Note: Descriptions are shown in the official language in which they were submitted.
CA 02770293 2012-02-03
WO 2011/017416 PCT/US2010/044384
SYSTEMS AND METHODS FOR MONITORING A WELL
TECHNICAL FIELD
[0001] This invention relates generally to systems and methods for
monitoring a
well.
BACKGROUND
[0002] Monitoring the state of a well and the state of the surrounding
formation
remains difficult. Information about the state of the well and the state of
the
formation is useful, for example, to detect issues at an early stage where
changes
in operation can be made and remedial action can be implemented to prevent
partial or complete loss of a well.
SUMMARY
[0003] The present disclosure provides systems and methods for
monitoring a
well. The systems and methods are configured to identify or analyze various
issues affecting the well including corrosion, cement quality, and fluid
migration.
One advantage of systems and methods that are described herein is the ability
to
continuously monitor a well. Another advantage is that systems and methods
monitor more area of a well and with greater resolution. The systems and
methods also simplify certain operations.
[0004] According to an exemplary embodiment, a method for monitoring
corrosion of a casing of a well includes measuring internal pressure of the
casing,
measuring strain of the casing with a system comprising at least one string of
interconnected sensors that is arranged such that the sensors are distributed
along a length and the circumference of the casing, and determining the
thickness
of the casing as a function of internal pressure and strain. A system
configured to
monitor corrosion of a casing of a well includes a pump configured to control
internal pressure of the casing, a gauge configured to measure internal
pressure of
the casing, at least one string of interconnected sensors that is arranged
such that
the sensors are distributed along the length and circumference of the casing
and
configured to measure strain of the casing, and a computing unit configured to
1
CA 02770293 2012-05-10
63293-4340
receive measurements of internal pressure and strain and to determine
thickness
of the casing as a function of internal pressure and strain.
[0005] According to another exemplary embodiment, a method for analyzing
cement in the annulus of a well includes controlling internal pressure of a
casing of
the well, measuring internal pressure of the casing, measuring strain of the
casing
with a system comprising at least one string of interconnected sensors that is
arranged such that the sensors are distributed along a length and the
circumference of the casing, the measured strain being a function of internal
pressure, and determining the quality of the cement as a function of strain of
the
casing and internal pressure. Another method for analyzing cement in a well
annulus includes measuring strain of a casing in the well with a system
including at
least one string of interconnected sensors that is arranged such that the
sensors
are distributed along a length and the circumference of the casing, and, after
pumping cement into the well annulus, establishing a baseline that is a
function of
steady state strain measurements within a first time period, and identifying
strain
measurements that substantially deviate from the baseline during a second time
period.
[0006] According to another exemplary embodiment, a method for
identifying
fluid migration or inflow associated with a wellbore tubular includes
measuring
strain of the wellbore tubular with a system comprising at least one string of
interconnected sensors that is arranged such that the sensors are distributed
along a length and the circumference of the wellbore tubular, establishing a
baseline that is a function of steady state strain measurements within a first
time
period, and identifying fluid migration or inflow where strain measurements
substantially deviate from the baseline within a second time period.
[0007] According to yet another exemplary embodiment, a method for
analyzing fluid proximate an injection well includes turning an injector on or
off,
determining temperature along a casing of the well during a first time period,
and
associating a rate of temperature change during the first time period with a
fluid.
2
CA 02770293 2012-05-10
63293-4340
[0007A] In accordance with this invention there is provided a method
for
identifying fluid migration or inflow associated with a wellbore tubular,
comprising:
measuring strain of the wellbore tubular with a system comprising at least one
string
of interconnected sensors that is arranged such that the sensors are
distributed along
a length and the circumference of the wellbore tubular, establishing a
baseline that is
a function of steady state strain measurements within a first time period; and
identifying fluid migration or inflow where strain measurements substantially
deviate
from the baseline within a second time period.
[0008] The foregoing has broadly outlined some of the aspects and
features of
the present disclosure, which should be construed to be merely illustrative of
various
applications of the teachings. Other beneficial results can be obtained by
2a
CA 02770293 2012-02-03
WO 2011/017416 PCT/US2010/044384
applying the disclosed information in a different manner or by combining
various
aspects of the disclosed embodiments. Other aspects and a more comprehensive
understanding may be obtained by referring to the detailed description of the
exemplary embodiments taken in conjunction with the accompanying drawings, in
addition to the scope defined by the claims.
BRIEF DESCRIPTION OF THE DRAWINGS
[0009] FIG. 1 is a schematic illustration of an exemplary injection
operation.
[0010] FIG. 2 is a partial cross-sectional view of a well reinforced
with a casing
according to an exemplary embodiment.
[0011] FIG. 3 is a partial elevational view of the casing of FIG. 2 and
a
monitoring system according to an exemplary embodiment.
[0012] FIG. 4 is a graphical illustration of an exemplary response of a
strain
string of the monitoring system of FIG. 3.
[0013] FIG. 5 is a graphical illustration of an exemplary response of
strain
strings of the monitoring system of FIG. 3.
[0014] FIG. 6 is a partial cross-sectional view of the casing of FIG. 2
including a
corroded area.
[0015] FIG. 7 is a graphical illustration of thickness along the length
of the
casing of FIG. 6.
[0016] FIG. 8 is a graphical illustration of thickness at a point on the
casing of
FIG. 6 at different times.
[0017] FIG. 9 is a partial cross-sectional view of the casing of FIG. 2
that is
undergoing a minifrac treatment.
[0018] FIG. 10 is a graphical illustration of strain and internal pressure
of the
casing of FIG. 9.
[0019] FIG. 11 is a partial cross-sectional view of the casing of FIG. 2
illustrating flow migration along the outside of the casing.
3
CA 02770293 2012-02-03
WO 2011/017416 PCT/US2010/044384
[0020] FIG. 12 is a graphical illustration of strain over time along the
length of
the casing of FIG. 11.
[0021] FIG. 13 is a graphical illustration of a horizontal gravel pack
according to
an exemplary embodiment.
[0022] FIG. 14 is a graphical illustration of strain of a gravel pack
screen of the
gravel pack of FIG. 13.
[0023] FIG. 15 is a partial cross-sectional view of a well reinforced
with
concentric casings illustrating exemplary flows moving along the outside of
the
outermost casing and between the casings.
[0024] FIG. 16 is a graphical illustration of pressure difference and
temperature
corresponding to strain strings on each of the concentric casings of FIG. 15.
[0025] FIG. 17 is a partial cross-sectional view of the casing of FIG. 2
including
permeable beds of carbon dioxide and water.
[0026] FIG. 18 is a graphical illustration of temperature at different
points along
the length of the casing of FIG. 17 over time.
[0027] FIG. 19 is a partial cross-sectional view of the casing of FIG. 2
where
cement pumped into an annulus is partially cured.
[0028] FIGS. 20 and 21 are graphical illustrations of temperature and
external
pressure at a point on the casing of FIG. 19 during an exemplary curing
process.
[0029] FIG. 22 is a graphical illustration of external pressure at
different times
along the length of the casing of FIG. 19.
DETAILED DESCRIPTION
[0030] As required, detailed embodiments are disclosed herein. It must
be
understood that the disclosed embodiments are merely exemplary of the
teachings
that may be embodied in various and alternative forms, and combinations
thereof.
As used herein, the word "exemplary" is used expansively to refer to
embodiments
that serve as illustrations, specimens, models, or patterns. The figures are
not
necessarily to scale and some features may be exaggerated or minimized to show
details of particular components. In other instances, well-known components,
4
CA 02770293 2012-02-03
WO 2011/017416 PCT/US2010/044384
systems, materials, or methods have not been described in detail in order to
avoid
obscuring the present disclosure. Therefore, specific structural and
functional
details disclosed herein are not to be interpreted as limiting, but merely as
a basis
for the claims and as a representative basis for teaching one skilled in the
art.
[0031] For purposes of teaching, the systems and methods of this disclosure
will be described in the context of monitoring a well, wellbore tubular, and
the
surrounding formation. However, the teachings of the present disclosure are
also
useful in other environments, such as to monitor pipes and the surrounding
environment in refineries, gas plants, pipelines, and the like.
[0032] As used herein, a wellbore tubular is a cylindrical element of a
well.
Wellbore tubulars to which the systems and methods can be applied include a
well
casing, a non-perforated tubular, a perforated tubular, a drill pipe, a joint,
a
production tube, a casing tube, a tubular screen, a sand screen, a gravel pack
screen, combinations thereof, and the like. The wellbore tubular can be formed
from steel or other materials.
[0033] The systems and methods are configured to monitor the wellbore
tubular
during production or non-production operations including injection, depletion,
completion, cementing, gravel packing, frac packing, production, stimulation,
waterflood, a gas miscible process, inert gas injection, carbon dioxide flood,
a
water-alternating-gas process, liquefied petroleum gas drive, chemical flood,
thermal recovery, cyclic steam injection, steam flood, fire flood, forward
combustion, dry combustion, well testing, productivity test, potential test,
tubing
pressure, casing pressure, bottomhole pressure, downdraw, combinations
thereof,
and the like. An exemplary injection operation is illustrated in FIG. 1. Here,
injection wells 10a include injectors or fluid pumps 2 that inject fluid 4
into a
permeable bed 6 of a formation 12 to drive oil toward a production well 10b.
[0034] The systems and methods are configured to investigate downhole
well
problems such as those indicated by changes in production. Such problems
include crossflow, premature breakthrough, casing leaks, fluid migration,
corrosion, tubing leaks, packer leaks, channeled cement, other problems with
cement quality, blast joint leaks, thief zones, combinations thereof, and the
like.
The systems and methods facilitate identifying the points or intervals of
fluid
5
CA 02770293 2012-02-03
WO 2011/017416 PCT/US2010/044384
entry/exit, the flow rate at such points, the type of fluid at such points,
and the
origin of the fluids coming into the well. The systems and methods are further
configured to investigate the integrity of a well as part of a routine
maintenance
operation.
[0035] Herein, a suffix (a, b, c, etc.) or subscript (1, 2, 3, etc.) is
affixed to an
element numeral that references like elements in a general manner so as to
differentiate a specific one of the like elements. For example, strain string
22a is a
specific one of strain strings 22.
[0036] Referring to FIG. 2, a well 10 includes a borehole 11 that is
drilled in a
formation 12. To prevent well 10 from collapsing or to otherwise line or
reinforce
well 10, well 10 includes a string of casings 14 that are inserted and
cemented in
borehole 11. Cement 16 is pumped up an annulus 15 between casing 14 and the
wall of borehole 11 to provide bonded cement sheath 16 that secures casing 14
in
borehole 11. Alternatively, well 10 may be formed according to other methods.
Referring momentarily to FIG. 15, string of casings 14 includes concentric
casings
14a, 14b.
[0037] Continuing with FIG. 2, for purposes of teaching, coordinate
systems are
now described. A Cartesian coordinate system can be used that includes an x-
axis, a y-axis, and a z-axis that are orthogonal to one another. The z-axis
corresponds to the longitudinal axis of casing 14 and any position on casing
14
can be established according to an axial position z and a position in the x-y
plane,
which is perpendicular to the z-axis. In the illustrated embodiment, casing 14
is
cylindrical and any position on casing 14 can be established using a
Cylindrical
coordinate system. Here, the z-axis is the same as that of the Cartesian
coordinate system and a position lying in the x-y plane is represented by a
radius r
and a position angle a and referred to as a radial position ra. Radius r
defines a
distance of the radial position ra from the z-axis and extends in a direction
determined by position angle a to the radial position ra. Here, position angle
a is
measured from the x-axis. A bending direction represents the direction of a
bending moment on casing 14. The bending direction is represented by a bending
angle 13 that is measured relative to the x-axis. A reference angle 9 is
measured
between bending angle 13 and position angle a.
6
CA 02770293 2012-02-03
WO 2011/017416 PCT/US2010/044384
Monitoring System
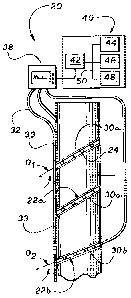
[0038] Referring now to FIGS. 2 and 3, a monitoring system 20 is
configured to
monitor casing 14 and formation 12. Monitoring system 20 includes strain
strings
22 that include interconnected sensors 24. Strain strings 22 are wrapped
around
casing 14 so as to position sensors 24 along the axial length and
circumference of
casing 14. As such, strain strings 22 are integral to well 10 and configured
to
measure strain of casing 14 at a range of azimuth angles and a range of depth
locations. Grooves 30 are formed in casing 14 and strain strings 22 are
recessed
in grooves 30. In alternative embodiments, strain strings 22 are deployed on
the
inside of casing 14 and may be permanently or temporarily attached. Strings 22
can be laminated to casing 14 or pressed against casing 14 by a covering or
expandable layer of material.
[0039] In the illustrated embodiments, monitoring system 20 includes a
plurality
of strain strings 22a, 22b and each strain string 22a, 22b winds substantially
helically at least partially along the length of casing 14. Strain strings
22a, 22b are
arranged at different constant inclinations that are hereinafter referred to
as wrap
angles 01, 02. Illustrated wrap angles 01, 02 are measured with respect to x-y
planes although equivalent alternative formulations can be achieved by
changing
the reference plane. In alternative embodiments, strings include a series of
segments that are arranged at different inclinations so as not to intersect
one
another.
[0040] In general, wrapping strain strings 22 at wrap angle 0 is
beneficial in that
strain strings 22 experience a fraction of the strain experienced by casing
14.
Additionally, each wrap angle 01, 02 is effective for a range of strain and
the use of
multiple strain strings 22a, 22b with different wrap angles 01, 02 expands the
overall range of strain that monitoring system 20 can measure. For example,
strain string 22 with wrap angle 0 of 200 may fail at one level of strain
while strain
string with wrap angle 0 of 30 or more may not fail at the same level of
strain or at
a slightly higher level of strain. The use different wrap angles 0 also
facilitates
determining unknown parameters, as described in further detail below. Another
advantage of wrapping casing 14 with multiple strain strings 22a, 22b is that
there
is added redundancy in case of failure of one of strain strings 22. The
additional
7
CA 02770293 2012-02-03
WO 2011/017416 PCT/US2010/044384
data collected with multiple strain strings 22 makes recovery of a 3-D image
an
overdetermined problem thereby improving the quality of the image.
[0041] Referring again to FIG. 15 where casings 14a, 14b are concentric,
strain
strings 22 are wrapped around each of concentric casings 14a, 14b. Such an
arrangement is useful in certain applications, as described in further detail
below.
Otherwise, strain strings 22 are generally wrapped around outermost casing 14a
as geomechanical deformations are best transferred to outermost casing 14a
from
formation 12. Alternatively, strain strings 22 can be coupled to outermost
casing
14a by cementing, centralization, or other movement limiters.
[0042] Continuing with FIGS. 2 and 3, monitoring system 20 includes a
temperature string 32 of sensors 33. As such, monitoring system 20 is
configured
to operate as a distributed temperature sensing (DTS) system. Illustrated
temperature string 32 is positioned against casing 14 and configured to take
temperature measurements along the length of casing 14 and independently of
strain strings 22. Alternatively, temperature string 32 can be wrapped around
casing 14 as described above with respect to strain strings 22. Temperature
strings 32 and strain strings 22 are used in combination according to certain
exemplary methods as described in further detail below.
[0043] Monitoring system 20 further includes single point pressure
gauges 34
and temperature gauges 36 that are positioned to measure pressure and
temperature independently of strain strings 22 and temperature strings 32. For
example, internal pressure from fluid levels and well head annular pressure is
measured with a pressure gauge 34 that is positioned inside casing 14.
Alternatively, other independent means of measuring or calculating temperature
and pressure can be used.
[0044] Monitoring system 20 further includes a data acquisition unit 38
and a
computing unit 40. Illustrated data acquisition unit 38 collects the response
of
each of strain strings 22, temperature strings 32, and single point gauges 34,
36.
The response and/or data representative thereof are provided to computing unit
40
to be processed. Computing unit 40 includes computer components including a
data acquisition unit interface 42, an operator interface 44, a processor unit
46, a
8
CA 02770293 2012-02-03
WO 2011/017416 PCT/US2010/044384
memory 48 for storing information, and a bus 50 that couples various system
components including memory 48 to processor unit 46.
Strain Strings
[0045] Strain strings 22 are now described in further detail. There are
many
different suitable types of strain strings 22 that can be associated with
monitoring
system 20. For example, strain strings 22 can be waveguides such as optical
fibers and sensors 24 can be wavelength-specific reflectors such as
periodically
written fiber Bragg gratings (FBG). An advantage of optical fibers with
periodically
written fiber Bragg gratings is that fiber Bragg gratings are less sensitive
to
vibration or heat and consequently are more reliable. In alternative
embodiments,
sensors 24 can be other types of gratings, semiconductor strain gages,
piezoresistors, foil gages, mechanical strain gages, combinations thereof, and
the
like. For purposes of illustration, according to a first exemplary embodiment
described herein, strain strings 22 are optical fibers and sensors 24 are
fiber Bragg
gratings.
[0046] Referring to FIGS. 4 and 5, a wavelength response Ar, of strain
string 22
is data representing reflected wavelengths Ar at sensors 24. The reflected
wavelengths Ar each represent a fiber strain Ef measurement at a sensor 24.
Here,
wavelength responses Ar, are plotted with respect to axial positions z of
sensors 24
or along the longitudinal axis of casing 14.
[0047] Generally described, reflected wavelength Ar is substantially
equal to a
Bragg wavelength Ab plus a change in wavelength AA. Reflected wavelength Ar is
equal to Bragg wavelength Ab when fiber strain Et measurement is substantially
zero and, when fiber strain Et measurement is non-zero, reflected wavelength
Ar
differs from Bragg wavelength Ab. The difference is change in wavelength AA
and
thus change in wavelength AA is the part of reflected wavelength Ar that is
associated with fiber strain Et . Bragg wavelength Ab provides a reference
from
which change in wavelength AA is measured at each of sensors 24. The
relationship between change in wavelength AA and fiber strain Ef is described
in
further detail below.
[0048] Fiber strain Ef may be due to forces including axial forces,
shear forces,
ovalization forces, and compaction forces. Such forces may be exerted, for
9
CA 02770293 2012-02-03
WO 2011/017416 PCT/US2010/044384
example, by formation 12, by the inflow of fluid between formation 12 and
casing
14, and by a pressure difference across the wall of casing 14. Fiber strain Ef
also
may be due to changes in temperature. Referring to FIGS. 4 and 5, fiber strain
Et
due to such forces and changes in temperature can have both a constant (DC)
component and sinusoidal (AC) components. Referring to FIG. 5, axial forces,
temperature changes, and pressure differences across the wall of the casing 14
are observed in the constant component (wavelength response An that is
observed
as a constant (DC) shift from Bragg wavelength Ab). Here, the different
constant
components correspond to different strain strings 22a, 22b wrapped at
different
wrap angles 01, 02. Referring to FIG. 4, bending of casing 14 at a radius of
curvature R or ovalization of casing 14 due to hoop forces are observed in the
sinusoidal component.
Relationship between change in wavelength and strain
[0049] An equation that may be used to relate change in wavelength AA
and
fiber strain Et imposed on sensors 24 is given by AA, = (1 ¨ PE)Ke f . As an
example, Bragg wavelength ith may be approximately 1560 nanometers. The term
(1 - Pe) is a fiber response which, for example, may be 0.8. Pe is a
photoelastic
coefficient. Bonding coefficient K represents the bond of sensor 24 to casing
14
and, for example, may be 0.9 or greater.
Relationships between fiber strain and axial strain, hoop strain, temperature,
and pressure
[0050] The constant component of measured fiber strain Ef is related to
axial
strain Ea and hoop strain Eh of casing 14 according to:
ef=K= (-1+ Vsin(6)2 = (1¨ Ea )2 + cos(6)2 = (1+ vea)2) and
Ef = K =(-1+ Vsin(6)2 = (1¨ veh )2 + cos(6)2 = (1+ eh )2 )
where K is the bonding coefficient of the fiber to the tubular, 0 is wrap
angle, and v
is Poisson's ratio. The constant component of measured fiber strain Ef is a
function
of the difference between the internal pressure Pi and the external pressure
Pe of
casing 14 that is given in terms of hoop strain Eh by:
Eh===, (PI ¨13 )D
2wE
CA 02770293 2012-02-03
WO 2011/017416 PCT/US2010/044384
where D is inner diameter of casing 14, w is wall thickness, and E is Young's
modulus of the casing material. The constant component of measured fiber
strain
Et is further a function of change in temperature given by:
ef = pAT
where p is the coefficient of thermal expansion.
[0051] Where bending is present, fiber strain Ef may be associated with
axial
strain Ea at a sensor 24 position on casing 14 according to:
rcos0))2
ef = ¨1+ ilsin2 19' (1¨(e, rcRos 0))2 cos 2 19 (1+ v(e,
R .
Here, fiber strain Et measured by sensor 24 at a position on casing 14 is a
function
of axial strain Ea at the position, radius of curvature R at the position,
Poisson's
ratio v, wrap angle 0, and radial position which is represented in the
equation by
radius r and reference angle (p. Fiber strain Ef is measured, wrap angle 0 is
known, and radius r is known. Poisson's ratio v is typically known for elastic
deformation of casing 14 and unknown for non-elastic deformation of casing 14.
Radius of curvature R, reference angle 9, and axial strain Ea are typically
unknown
and are determined through analysis of wavelength response A. Similarly,
Poisson's ratio v can be determined through analysis of wavelength response A,
where Poisson's ratio v is unknown.
[0052] In general, signal processing can be used along with the
equations to
determine axial strain Ea, radius of curvature R, reference angle 9, Poisson's
ratio
v., hoop strain Eh, temperature T (relative to calibrated temperature),
internal
pressure Pi, and external pressure P, from fiber strain Et measured along the
length and circumference of casing 14. Examples of applicable signal
processing
techniques include deconvolution and inversion where a misfit is minimized and
turbo boosting. Using the constant component of fiber strain Et, signal
processing
can be used to determine pressure and temperature profiles along the length of
casing 14. The pressure and temperature profiles provide information that is
useful for monitoring casing 14 and formation 12. In general, thermal strains
and
strain due to fluid pressure changes are much less than geomechanical strain
due
to the formation 12.
[0053] Exemplary monitoring methods that are used during operations such
as
injection, depletion, completion (cement curing), and the like are described
below.
11
CA 02770293 2012-02-03
WO 2011/017416 PCT/US2010/044384
In addition, exemplary monitoring methods that are used to detect features
such
as corrosion, flow or leaks, fluid migration, and the like are described
below.
Corrosion Monitoring
[0054] Referring to FIGS. 3 and 6-8, exemplary methods of monitoring
corrosion with monitoring system 20 are now described. Using a modified
version
of an equation introduced above, wall thickness w of casing 14 can be
determined
according to:
(Pi ¨ Pe)D
w= ____________
2chE
As decrease in thickness w reflects corrosion, casing 14 can be monitored for
corrosion by monitoring the thickness w of casing 14 over time or with respect
to
the original thickness w. For example, the thickness w calculated at some
point in
time t1, t2 can be compared to the original thickness w(t0) of casing 14 (or
to a
previously calculated thickness w or some other baseline thickness) to
determine
how much corrosion has taken place and the rate of corrosion. Corrosion may be
internal, external, or both. In FIG. 6, corrosion C is illustrated in an area
A and the
corresponding thickness w that is determined from fiber strain Et measurement
is
shown in FIG. 7. Multiple calculations of thickness w at a point z1 in area A
at
different times t1, t2 are shown in FIG. 8 to illustrate the rate of
corrosion.
[0055] According to an exemplary method, internal pressure Pi is
controlled
with a fluid pump 2 (see FIG. 1) as well 10 is shut-in. Internal pressure Pi
is
measured with internal pressure gauge 34, the diameter D and Young's modulus E
of casing 14 are known, and hoop strain Eh is determined from fiber strain Ef
measured with the strain strings 22 of monitoring system 20. Here, thickness w
and external pressure P, are unknown parameters that are found using the
thickness equation along with measurements of internal pressure Pi and hoop
strain Eh. Multiple measurements of hoop strain Ef are utilized to be able to
determine both external pressure P, and thickness w with the equation. For
example, multiple measurements of hoop strain Eh can be determined for each of
multiple internal pressures P. Where internal pressure Pi is can be determined
along casing 14 and strain strings 22 make hoop strain Eh measurements along
casing 14, thickness w can be found along the length and around the
circumference of casing 14 all at once. As another example, multiple
12
CA 02770293 2012-02-03
WO 2011/017416 PCT/US2010/044384
measurements of hoop strain Eh can be determined by multiple strain strings 22
at
different wrap angles 01, 02.
[0056] Alternatively, using an external pressure gauge 34, an
independent
measurement of external pressure Po can be combined with a measurement of
each of internal pressure Pi and hoop strain Eh to calculate thickness w at
the
position of the pressure gauge 34 or along casing 14 where external pressure
Po
along casing 14 is constant or calculable using one or more point measurements
of external pressure Po.
[0057] According to yet another method, where annulus 15 is uncemented
and
there is access to annulus 15 at the wellhead, internal and external pressures
Pi,
Po are held constant such that hoop strain Eh and thickness w are inversely
proportional to one another. Here, the following equation can be used to
relate
hoop strain Eh and thickness w at two different times tl, t2:
w1= chi
=
w2=
ch2
Cement Quality Analysis
[0058] Referring to FIGS. 9 and 10, an exemplary method of monitoring
the
quality of cement 16 with monitoring system 20 during a minifrac, leak-off, or
formation integrity test is now described. As used herein, a minifrac
treatment is a
fracturing treatment performed before a main hydraulic fracturing treatment to
acquire data and confirm a predicted response. In a formation integrity test,
internal pressure Pi is increased to a preset value that is less than the
anticipated
formation break-down test. The formation integrity test can be used as a
cement
integrity test. In a leak-off test, internal pressure Pi is increased until
part of
formation 12 that is exposed to open borehole 11 starts to breakdown. During
each of these tests, internal pressure Pi is increased and fluid may seep into
formation 12 if formation 12 has sufficient permeability.
[0059] In general, an extended leak-off test or minifrac operation can
be used
to determine the mechanical properties of formation 12. The mechanical
properties can be determined with information gained from the leak-off test or
minifrac operation. For example, such information includes limit pressure,
leak-off
pressure, fracture opening pressure, uncontrolled fracture pressure, fracture
propagation pressure, instantaneous shut-in pressure, fracture closure
pressure,
13
CA 02770293 2012-02-03
WO 2011/017416 PCT/US2010/044384
stable fracture propagation, unstable fracture propagation, fracture closure
phase,
and backflow phase. A pressure response curve is typically plotted to get such
information. The pressure response curve is internal pressure Pi versus time
or
cumulative volume of fluid pumped.
[0060] Monitoring system 20 is used to monitor cement 16 during the
extended
leak-off test or minifrac operation to facilitate differentiation between
fracture of
cement 16 and fracture of formation 12. For example, such a differentiation
may
be difficult to determine from a pressure response curve. As internal pressure
Pi
increases, fiber strain Ef is monitored to determine the quality of cement 16.
Referring to FIG. 10, if cement 16 is and remains competent, hoop strain Eh is
and
remains substantially proportional to internal pressure Pi, moving along line
60,
and external pressure P, remains substantially constant. If cement 16 is weak
and
breaks apart or if channels or other fluid pathways exist in cement-filled
annulus
15, hoop strain Eh will deviate from the line of proportionality 60 with
respect to
internal pressure P. For example, hoop strain Eh will move along line 62 so as
to
deviate from line 60 above a certain internal pressure Pi,x. Here, where such
deviation occurs along line 62, hoop strain Eh decreases as external pressure
P,
changes toward the value of internal pressure P.
[0061] Certain information that is determined from the pressure response
curve
can similarly be determined from the pressure strain curve shown in FIG. 10.
For
example, where cement 16 is competent, uncontrolled fracture pressure of
formation 12 or the point at which stable fracture growth ends can be
identified as
the highest internal pressure Pi measured. In such a case, measurements move
up and then back down line of proportionality 60 during a leak-off test.
Fluid Monitoring
[0062] Referring to FIGS. 11-18, exemplary methods of detecting the
presence
of fluid, fluid migration, and inflow proximate well 10 are now described.
Such
monitoring methods can be used to investigate operations such as injection,
depletion, production, and the like.
[0063] Referring to FIGS. 11 and 12, pressure difference across the wall of
casing 14 changes where fluid 74 migrates in formation 12 or annulus 15 along
the
outside of the wall of casing 14. Fluid may flow from a perforated area or
leak in
casing 14. The fluid may additionally or alternatively flow from a permeable
bed
14
CA 02770293 2012-02-03
WO 2011/017416 PCT/US2010/044384
70 or fracture 72 as shown in FIG. 11. The pressure change in permeable bed 70
may either be negative from a reservoir undergoing depletion or positive from
a
reservoir undergoing injection of fluids for purposes such as waste or carbon
dioxide disposal or water flooding for oil production.
[0064] Referring to FIG. 11, permeable bed 70 is undergoing a pressure
change and fluid 74 changes the external pressure Po applied to casing 14 and
the
associated fiber strain Et response. Referring to FIG. 12, fluid pressure and
migration can be identified by deviation of fiber strain Et from a baseline 78
and
extension of the deviating measurements along casing 14. Baseline 78 can be
determined from measurements of fiber strain Et that are substantially
constant or
steady-state for a certain time period. The time period used to determine
baseline
78 is generally distinct from the time period in which fluid 74 changes
external
pressure Po.
[0065] Illustrated fluid 74 migrates up annulus 15 with the front end
boundary
76 of fluid 74 reaching different positions zl, z2, z3, z4 along the length of
casing 14
at different times t t t
.1, -2, -3, t4. The extent, direction, and rate of fluid 74 migration
can be determined by monitoring boundaries 76 of fluid 74 over time and space.
As shown in FIG. 12, boundaries 76 can be identified where fiber strain Ef
measurement deviates from baseline 78. The extent of fluid 74 is the position
of
front end boundary 76 or the distance between front and rear end boundaries
76,
the flow rate is the change in position of front end boundary 76 over time,
and the
flow direction is given by the change in position of the front end boundary
76.
Front end boundary 76 is tracked with line 79. An independent pressure gauge
can facilitate determining the direction of pressure migration and the
location
(inside or outside). Referring to the time greater than time t4 of FIG. 12,
front end
boundary 76 does not move and the flow rate approaches zero. This is
illustrated
by the flattening of line 79 and can indicate that fluid 74 is trapped. In
other words,
fluid 74 with a rate that approaches zero can indicate that fluid 74 is
trapped.
[0066] Strain strings 22 can further be used to determine the location
of fluid 74
where fluid 74 changes the temperature of casing 14 so as to expand or
contract
the casing 14 and change fiber strain Et. For example, temperature changes can
be measured by strain strings 22 where flow rate is substantially high and
where
significant Joule-Thompson effects are involved.
CA 02770293 2012-02-03
WO 2011/017416 PCT/US2010/044384
[0067] Similarly, referring to FIGS. 13 and 14, flow through a gravel
pack 80,
including gravel pack screen 82 and gravel 84, can be monitored where strain
strings 22 are wrapped around a gravel pack screen 82. Here, the inflow of
fluid
74 changes the temperature of gravel pack screen 82 to create thermal strain
such
that the measurement of fiber strain Ef deviates from baseline 78. Greater
fiber
strain Ef deviation can indicate point of entry into gravel pack screen 82.
[0068] Referring to FIGS. 15 and 16, flow detection with a monitoring
system 20
including strain strings 22 on concentric casings 14a, 14b is described. FIG.
15
shows fluid 74 migrating up annulus 15a between outer casing 14a and inner
casing 14b as well as up annulus 15b between outer casing 14a and the wall of
borehole 11. Here, the material in annulus 15a, 15b may be permeable or fluid
74
may move through a microannulus, channel, or void. As used herein, the term
microannulus refers to the space between cement 16 and wall of casing 14 or
wall
of borehole 11. A fluid migration detection method is similar to the methods
described above. Here, the responses of strain strings 22 on concentric
casings
14a, 14b can be compared to determine the location, rate, and direction of
flow.
Referring to FIG. 16, the change in pressure difference AP (131-130) and the
change
in temperature T on each of casings 14a, 14b is illustrated. The changes in
temperature T and pressure difference AP are reflected in fiber strain Et
measurements as previously described. In general, flow that is closer to one
of
casings 14a, 14b will have a greater effect on the pressure and temperature
components of fiber strain Ef of that casing 14a, 14b. Also, radial flow may
be
indicated by inversely proportional responses of strain strings 22 on
concentric
casings 14a, 14b.
[0069] The responses of strain strings 22 and temperature string 32 are
used
together to determine where the flow is located or the size of the flow. In
general,
larger and closer flows result in greater temperature and pressure responses
while
smaller and farther flows result in lesser temperature and pressure responses.
Strain strings 22 are more sensitive to flow at a greater distance from casing
14
than temperature string 32. For example, if strain string 22 response shows a
pressure increase and the temperature string 32 response doesn't show a
temperature increase (e.g., relative to geothermal temperature TG), then the
fluid
flow path of a certain size is within a range of distances from casing 14, the
closer
16
CA 02770293 2012-02-03
WO 2011/017416 PCT/US2010/044384
boundary being defined by the sensitivity range of the temperature string 32
and
the farther boundary being defined by the sensitivity range of the strain
string 22.
If a temperature anomaly is not detected by temperature string 32 and a
pressure
increase is not detected by the strain string 22, any flow of any size is at a
distance
outside the sensitivity range of strain string 22 and temperature string 32.
The use
of additional tracing methods such as oxygen activation can further facilitate
determining the boundaries on an area in which flow is occurring. Tracers in
the
flow, such as those created by a pulsed-neutron logging tool that causes
oxygen
activation, can determine fluid velocity but not volumetric or mass rates.
Using this
information along with temperature-calculated mass flow rate can give an
indication of either flow size or distance from casing 14.
[0070] Referring to FIGS. 17 and 18, monitoring system 20 can
differentiate
between fluids that have different effects on the rate of temperature change
of
casing 14. For example, carbon dioxide (CO2) and water (H20) affect the rate
of
temperature change differently. According to an exemplary method, temperature
change is monitored after beginning and ending injection operations. Here,
injection fluids are colder than formation 12. Referring to FIG. 18, when well
injection begins (time t2), well 10 cools down. When well injection is stopped
(time
ti) warmback of well 10 occurs. During the life of injector 2 (see FIG. 1),
injector 2
will be turned off many times for scheduled or unscheduled maintenance. Every
such cycle produces a perturbation of the temperature of well 10. The local
rate of
temperature change of casing 14 is a function of the concentration of the
fluid
surrounding casing 14 in the area, such as beds of carbon dioxide CO2 and
water
H20 shown in FIG. 17. As such, monitoring the rate of temperature change
according to this method provides an indication of what fluids are located at
certain
positions along casing 14. Measurements taken over time can be used to monitor
migration of such fluids and the rate of migration.
[0071] Monitoring system 20 can measure axial strain along casing 14,
which is
related to reservoir compaction/dilation. For example, when injecting carbon
dioxide, there is generally reservoir dilation. Monitoring system 20 can be
used to
quantify this and calibrate geomechanical models, which indicate that injected
carbon dioxide is going where intended.
Cement Quality Analysis
17
CA 02770293 2012-02-03
WO 2011/017416 PCT/US2010/044384
[0072] Referring to FIGS. 19-22, monitoring system 20 can further be
used to
determine the quality and effectiveness of cement 16. Strain strings 22 and
temperature string 32 can be used individually or in combination to
continually or
periodically monitor the quality of cement 16 without running a tool or other
well
intervention. For example, the curing process is monitored and the integrity
of the
cement 16 is monitored after cement 16 has cured. Objectives of cement 16
placement monitoring include detecting the top of cement 90 and determining
the
quality of the cementation (zonal isolation).
[0073] Referring to FIG. 20, cement 16 cures by an exothermic reaction
where
the heat given off and rise in temperature is substantially proportional to
the
volume of cement 16 curing. In addition to the rise in temperature that
accompanies cement curing, conventional cements shrink as they hydrate.
Referring to FIG. 21, this shrinkage and hydration results in a decrease in
external
pressure Po applied to casing 14. Initially, liquid cement 16 applies
hydrostatic
pressure Poo to casing 14. As liquid cement 16 cures, the pressure applied by
cement 16 permanently changes and the pressure P0,2 applied by cured cement
16 is approximately the fluid pressure applied by fluids in formation 12. The
early
time in FIG. 21 shows the external pressure Po at a point z1 on casing 14 when
cement 16 was pumped. Late time in FIG. 21 shows external pressure Po at point
z1 on casing 14 after cement 16 has cured and has effectively lowered the
external
pressure Po applied to casing 14 at point zl.
[0074] It should be understood that monitoring system 20 gathers data
for
multiple points having different depths and azimuth angles (not shown) and
therefore provides complete coverage of casing 14 and any variations in cured
cement 16. FIG. 22 illustrates the response of monitoring system 20 to
partially
cured cement 16 along the length of casing 14. Top of cement 90 reaches point
z1
at time tl. In the uncured or poorly cured portions of cement 16, the
hydrostatic
pressure in annulus 15 has not been reduced by hydration and shrinkage of
cement 16. The response of monitoring system 20 differentiates between cured
and uncured cement 16 and can monitor the position of the top of cement 90
during the curing process. Cured cement is represented by fiber strain Ef,2
and
uncured cement is represented by fiber strain 41.
18
CA 02770293 2012-02-03
WO 2011/017416 PCT/US2010/044384
[0075] In the case of cement 16 curing in annulus 15 bounded by
concentric
casings 14a, 14b, strain strings 22 on each of concentric casings 14a, 14b
observe hoop strain changes in opposite directions due to the change in
annulus
15 pressure. Where the curing cement 16 is outside casing 14, the external
pressure decreases. Where the curing cement 16 is internal to casing 14, the
internal pressure decreases.
[0076] The temperature history from the temperature string 32 can be
combined with other logs such as caliper logs to determine the cross sectional
area of a channel or microannulus or otherwise the quality of cement 16. For
example, the temperature increase during curing can be used to determine the
volume of cement placed and the volume can then be compared was expected to
be used based on a caliper log or another determination of hole volume as a
function of depth. Volume of cement 16 is determined based on the temperature
change, the heat capacities of the various components, and the heat transfer
characteristics of formation 12, cement 16, and casing 14. When the cement
volume estimated from the temperature substantially equals that from the
caliper,
there are no large voids. When the temperature-estimated volume is less than
the
caliper-calculated volume, there is indication of a void, channel, or
microannulus.
Knowledge of the size (cross section) of the channel or microannulus is useful
for
estimating "leakage rate" when monitoring injection or production processes or
other logging measurements such as water flow log which give a velocity.
[0077] The above-described embodiments are merely exemplary
illustrations of
implementations set forth for a clear understanding of the teachings and
associated principles. Variations, modifications, and combinations may be made
to the above-described embodiments without departing from the scope of the
claims. All such variations, modifications, and combinations are included
herein by
the scope of this disclosure and the following claims.
19