Note: Descriptions are shown in the official language in which they were submitted.
CA 02802790 2012-12-14
WO 2012/000076 PCT/CA2010/001010
METHOD AND APPARATUS FOR DETERMINING A DOPPLER CENTROID IN A
SYNTHETIC APERTURE IMAGING SYSTEM
CROSS-REFERENCE TO RELATED APPLICATIONS
[0001] This is the first application filed for the present
invention.
TECHNICAL FIELD
[0002] The present invention relates to the field of
synthetic aperture imaging systems, and more particularly to
synthetic aperture raw data processing methods and apparatus.
BACKGROUND
[0003] Synthetic aperture radar (SAR) imaging systems are
widely used in aerial and space reconnaissance. Usually, an
aircraft or a spacecraft is provided with a SAR imaging system
which transmits radar pulses and collects radar echoes
corresponding to the radar pulses reflected by an object to be
imaged.
[0004] In SAR imaging systems, estimating the Doppler
centroid frequency may be required for compensating for
variations in the antenna beam since a Doppler frequency shift
may degrade the quality of the radar image. Methods have been
developed for estimating the Doppler centroid. However, these
methods require the use of additional operations in the Fourier
domain. Furthermore, these methods require Fourier transforms of
the SAR raw data, which are processing power consuming.
[0005] Therefore there is a need for an improved method and
apparatus for determining a Doppler centroid in a SAR imaging
system.
- 1 -
CA 02802790 2012-12-14
WO 2012/000076 PCT/CA2010/001010
SUMMARY
[0006] In accordance with a first broad aspect, there is
provided a method for determining a Doppler centroid in a
synthetic aperture imaging system, comprising: receiving raw
data representative of electromagnetic signals reflected by a
target area; selecting, among the raw data, at least two sets of
sub-area data each representative of electromagnetic signals
reflected by a corresponding sub-area of the target area, the
sub-areas being substantially aligned along an azimuth axis of
the target area and having a substantially identical surface
area; for each one of the sets of sub-area data, generating an
image corresponding to the corresponding sub-area; and measuring
a mean intensity of the image; and estimating the Doppler
centroid from a skew of an intensity function representing the
mean intensity as a function of a look number for the
corresponding sub-area.
[0007] In accordance with a second broad aspect, there is
provided a system for determining a Doppler centroid associated
with synthetic aperture data, comprising: a memory for storing
raw data representative of electromagnetic signals reflected by
a target area; a sub-image data generator adapted to select,
among the raw data, at least two sets of sub-area data each
representative of the electromagnetic signals reflected by a
corresponding sub-area of the target area, the sub-areas being
substantially aligned along an azimuth axis of the target area
and having a substantially identical surface area; an image
generator adapted to, for each one of the sets of sub-area data,
generate an image corresponding to the corresponding sub-area
and measure an intensity of the image; and a Doppler centroid
estimator adapted to calculate the Doppler centroid from a skew
- 2 -
CA 02802790 2012-12-14
WO 2012/000076 PCT/CA2010/001010
of an intensity function representing the mean intensity as a
function of a look number for the corresponding sub-area.
BRIEF DESCRIPTION OF THE DRAWINGS
[0008] Fig. 1 illustrates a SAR imaging system for imaging a
target area, in accordance with an embodiment;
[0009] Fig. 2 is a flow chart illustrating a method for
estimating a Doppler centroid, in accordance with an embodiment;
[0010] Figs. 3A and 3B illustrate a target area to be imaged
divided into four sub-areas and five areas, respectively;
[0011] Figs. 4A-4D illustrate graphical representations of
SAR raw data corresponding to four sub-areas of a target area to
be imaged, in accordance with an embodiment;
[0012] Figs. 5A-5D illustrate the SAR images corresponding to
the SAR raw data of Figs 4A-4D, respectively;
[0013] Fig. 6 illustrates three mean intensities of sub-area
SAR images as a function of a ground look number;
[0014] Fig. 7 illustrates a graphical representation of SAR
raw data, in accordance with an embodiment; and
[0015] Fig. 8 is a block diagram of a Doppler centroid
determining apparatus, in accordance with an embodiment.
DESCRIPTION
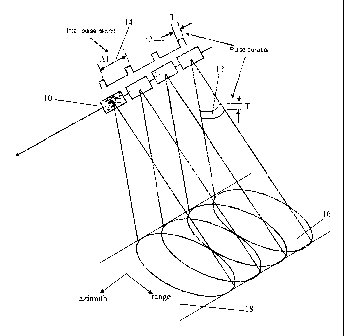
[0016] Figure 1 illustrates one embodiment of a satellite 10
provided with a SAR imaging system. The satellite 10 is in orbit
around an object to be imaged, such as a planet for example. The
satellite 10 is traveling along a satellite flight path while
- 3 -
CA 02802790 2012-12-14
WO 2012/000076 PCT/CA2010/001010
imaging the planet. The SAR imaging system is adapted to emit
successive electromagnetic radar pulses 12 in direction of the
planet. Each radar pulse 12 is characterized by a pulse duration
T and two successive radar pulses 12 are temporally spaced apart
by an inter-pulse duration LT. The pulse duration T and the
inter-pulse duration LT defines a pulse repetition frequency
which corresponds to the repetition rate of the outgoing radar
pulses 12. The emitted radar pulses 12 form a radar beam 14
which illuminates the target area to be imaged. The area of the
planet ground which intersects the radar beam is referred to as
the footprint 16 of the radar beam. While Figure 1 illustrates
an oval footprint 16, it should be understood that the footprint
16 may have other shape. For example, the footprint 16 may be
round. While the satellite 10 is moving along the satellite
flight path, the footprint 16 is moving, thereby defining a
swath 18. The swath 18 is characterized by a length in an
azimuth direction and a width in a range direction. The azimuth
direction corresponds to the propagation direction of the radar
beam 14, i.e. the flight path direction, and the range direction
is the direction normal to the azimuth direction. When reaching
the ground, the radar pulses 12 are reflected to give rise to
radar echoes. The radar echoes are collected by the SAR system
and processed in order to generate a radar image of the target
area.
[0017] The SAR system mounted to the satellite 10 is provided
with at least one emitting antenna for emitting the pulses 12.
The emitting antenna can be used for detecting the radar echoes
reflected by the ground. Alternatively, at least one receiving
antenna different from the emitting antenna can be used for
collecting the radar echoes.
- 4 -
CA 02802790 2012-12-14
WO 2012/000076 PCT/CA2010/001010
[0018] A SAR image is generated by superposing a plurality of
radar echoes within the range and azimuth of the SAR antenna
footprint 16. The received echoes are converted into electrical
signals which are referred to as SAR raw data. Alternatively,
the electrical signals may be subsequently converted into
digital data, which are also referred to as the SAR raw data.
The SAR raw data is then processed to create the SAR image of
the illuminated target area. A high resolution in the azimuth
direction is achieved by applying SAR signal processing without
requiring large antennas. The SAR signal processing allows
synthesizing a large aperture antenna. SAR signal processing can
be mathematically described as a correlation or a filtering
process on all of the radar echoes received during an aperture
time.
[0019] During operation of a SAR detection system, at least
one of the parameters of the SAR detection system may vary. In
order to generate an adequate image, a compensation for the
parameter variation is usually performed. In some instances, the
change of the SAR parameter may cause a Doppler shift. The
Doppler shift refers to a shift of the Doppler centroid which is
the center Doppler frequency of the Doppler spectrum as the
radar beam sweeps past the target area. Examples of a parameter
of which a variation causes a Doppler shift comprise the squint
angle which corresponds to the angle between the radar beam
center and the normal to the flight path, a change of the
eccentricity of the platform orbit, and the like.
[0020] Figure 2 illustrates one embodiment of a method 50 for
determining a Doppler centroid. The first step 52 comprises
receiving SAR raw data from a SAR imaging system. The SAR raw
data is representative of electromagnetic radar echoes reflected
by a target area. The second step 54 comprises selecting,
- 5 -
CA 02802790 2012-12-14
WO 2012/000076 PCT/CA2010/001010
amongst the SAR raw data, at least two sub-sets of data each
representative of the echoes reflected by a corresponding sub-
area of the target area. The sub-areas are selected such that
they have substantially the same surface area and they are
aligned along a line parallel to the azimuth axis of the target
area.
[0021] In one embodiment, the sub-areas are chosen to be
substantially symmetric about the antenna beam center.
[0022] Figure 3A illustrates a target area 60 divided into
four adjacent sub-areas 62, 64, 66, and 68 resulting from an
even division of the target area 60. The sub-areas 62, 64, 66,
and 68 have the same surface area and extend along the whole
width of the target area 60 in the range direction. The sub-
areas 62, 64, 66, and 68 are centered on an azimuth line 70
which passes through the center of the target area 60. While
Figure 3A illustrates contiguous sub-areas 62, 64, 66, and 68
which extend along the entire width of the target area 60, the
division of the target area 60 may be performed such that the
sub-areas are spaced apart along the azimuth line 70 and/or they
extend along only a section of the width of the target area 60.
[0023] Figure 3B illustrates another selection of sub-areas
within the target area 60. Five sub-areas 72, 74, 76, 78, and 80
are selected from the target area 60. The five sub-areas 72, 74,
76, 78, and 80 have the same surface area and are
discontinuously aligned along an azimuth line 82 which is
parallel to the azimuth axis and does not pass through the
center of the target area 60.
[0024] Referring back to Figure 2, the next step 56 of the
method 50 comprises the generation of a SAR image for each one
of the sub-sets of SAR raw data and the measurement of the mean
- 6 -
CA 02802790 2012-12-14
WO 2012/000076 PCT/CA2010/001010
intensity of each generated SAR image. Each generated SAR image
is an image of its corresponding sub-area. Any adequate method
for generating a SAR image from SAR raw data can be used.
[0025] In one embodiment, the step 56 of generating the SAR
image comprises digitally generating the SAR image using the SAR
raw data. Any adequate digital method for generating a SAR image
using SAR raw data can be used. Examples of adequate digital
methods comprise the range/Doppler method, the wavenumber
method, the chirp-scaling method, the plane-wave approximation
method, and the like.
[0026] In another embodiment, the step 56 of generating the
SAR image using the SAR raw data comprises optically generating
the SAR image using the SAR raw data. Any adequate optical
methods for generating a SAR image using the SAR raw data can be
used. The SAR image is generated by creating an optical image of
the SAR raw data and optically processing the image of the SAR
raw data.
[0027] In one embodiment, the optical image of the SAR raw
data is created using a light modulator such as a spatial light
modulator (SLM) or a micro display. The light modulator
comprises addressable pixels organized in rows along a first
axis representing the azimuth and in columns along a second axis
representing the range. The transmittance of each pixel of the
light modulator is controlled in accordance with the amplitude
and/or phase of the corresponding SAR data value. A coherent
light such as a laser light is generated and illuminates the
light modulator. The incident laser light is modulated by the
light modulator and an optical image of the SAR data is
generated at the output of the light modulator. The optical
image of the SAR data is then optically processed to reconstruct
- 7 -
CA 02802790 2012-12-14
WO 2012/000076 PCT/CA2010/001010
the SAR image of the sub-area. The reconstructed SAR image can
be projected on a screen. Alternatively, an optical sensor such
as a charge-coupled device (CCD) or a complementary metal-oxide-
semiconductor (CMOS) sensor, for example, can be used to convert
the optical SAR image of the target area into a digital SAR
image of the target area which can be recorded in a memory or
sent to a base station, for example.
[0028] In one embodiment, the SLM comprises two SLMs mapped
one onto the other. The transmittance of the pixels of the first
SLM is set in accordance with the amplitude of the SAR raw data
points and the transmittance of the pixels of the second SLM is
set in accordance with the phase of the SAR raw data points, or
vice versa.
[0029] In one embodiment, the step of measuring the mean
intensity for each one of the generated SAR images comprises
measuring the mean intensity of a section of the generated SAR
images. It should be understood that the mean intensity for the
same section of the SAR images is measured. For example,
measuring only the most luminous section of the SAR images may
be used for measuring the mean intensity.
[0030] Figures 4A-4D illustrates a graphical representation
of four sub-sets of raw data resulting from a selection of sub-
areas within a target area such as the selection illustrated in
Figure 3A. In this case, the sub-areas corresponding to the sub-
sets of SAR raw data illustrated in Figures 4A-4D are contiguous
and extend along the whole width of the target area in the range
direction.
[0031] Figures 5A-5D illustrate the generated SAR images
corresponding to the sub-sets of SAR raw data illustrated in
Figures 4A-4D, respectively. The step of measuring the mean
- 8 -
CA 02802790 2012-12-14
WO 2012/000076 PCT/CA2010/001010
intensity of each image illustrated in Figures 5A-5D can
comprise measuring the mean intensity of the whole image.
Alternatively, only a section, such as section 84, of each image
may be sensed in order to determine the mean intensity. It
should be understood that the same section 84 is selected for
each SAR image in order to determine the mean intensity.
[0032] Referring back to Figure 2, the last step 58 of the
method 50 comprises estimating the Doppler centroid using the
mathematical function representing the relation between the
measured mean intensity and the ground look number corresponding
to the sub-area. The Doppler centroid can be determined from the
skewness of the mathematical function. If the mathematical
function representing the mean intensity is substantially
symmetrical, then the Doppler centroid is substantially null. If
the mathematical function representing the mean intensity is
asymmetrical, then the Doppler centroid is different from zero
and the value of the Doppler centroid is then determined using
the skew of the mathematical function. It should be understood
that any mathematical method for determining the skew of a
mathematical function can be used.
[0033] In one embodiment, the Doppler centroid is determined
in accordance with a database of empirical data previously
stored in a memory. The empirical data contains Doppler centroid
values as a function skew values.
[0034] In one embodiment, an adequate interpolation method is
used for generating the mathematical function of the mean
intensity.
[0035] Figure 6 illustrates three curves 90, 92, and 94
representing the mean intensity of the generated SAR images
versus the mean azimuth of the corresponding sub-areas. The
- 9 -
CA 02802790 2012-12-14
WO 2012/000076 PCT/CA2010/001010
curve 90 is substantially symmetrical and therefore, the Doppler
centroid associated with this curve is substantially equal to
zero. The curve 92 is an example of a function having a positive
skew while the curve 94 is an example of a curve having a
negative skew.
[0036] No additional detector is required for determining the
value of the Doppler centroid using the method 50. Furthermore,
no Fourier transform is required which allows a reduction of the
required processing power.
[0037] In one embodiment, the method 50 further comprises the
steps of determining the Doppler shift, correcting the SAR raw
data in order to compensate for the Doppler shift, and
generating a SAR image using the corrected SAR raw data. The
Doppler shift is determined by comparing the determined Doppler
centroid to a reference Doppler centroid.
[0038] In one embodiment, the correction of the SAR raw data
and the generation of the SAR image is optically performed using
any adequate optical methods.
[0039] In another embodiment, the correction of the SAR raw
data is digitally performed and SAR raw data can be represented
by a complex function. In this case, the step of correcting the
SAR raw data comprises determining a phase factor in accordance
with the Doppler shift induced by the SAR parameter change.
[0040] Applying the phase factor to the SAR raw data consists
in multiplying the SAR raw data function ff(x, y) by an
imaginary number exp[jT], p being the previously determined
phase factor.
gg(x, y) = ff(x, y) exp [jp]
- 10 -
CA 02802790 2012-12-14
WO 2012/000076 PCT/CA2010/001010
_ ff(x, y) exp[j14(x, y)] exp[jcp]
ff (x, y) exp [j (14 (x, y) +cp) ] Eq. 1
where gg (x, y) , If (x, y) I , and j44 (x, y) respectively represent
the SAR corrected data function, the amplitude function of the
SAR raw data, and the phase function of the SAR raw data.
[0041] In another embodiment, the SAR raw data is graphically
represented by a SAR pattern such as the SAR pattern illustrated
in figure 6. SAR raw data points forming the SAR pattern are
organized in rows along the azimuth axis and in columns along
the range axis. Each SAR raw data point is associated with an
amplitude value and a phase value. In this case, the step of
correcting the SAR raw data comprises determining an azimuth
shift using the Doppler shift and shifting the columns of SAR
raw data points in accordance with the determined azimuth shift.
It should be understood that applying a linear phase vector to
the complex function representing the SAR raw data is equivalent
to applying an azimuth shift to a SAR pattern representing the
SAR raw data.
[0042] In one embodiment, the column shift and/or the phase
factor are determined using a database of empirical data. The
database contains values for the column shift and/or the phase
factor as a function of Doppler shift values.
[0043] In one embodiment, the step of generating the SAR
image using the corrected data comprises digitally generating
the SAR image using the corrected digital data. Any adequate
digital method for generating a SAR image using the corrected
data can be used. Examples of adequate digital methods comprise
the range/Doppler method, the wavenumber method, the chirp-
scaling method, the plane-wave approximation method, and the
like.
- 11 -
CA 02802790 2012-12-14
WO 2012/000076 PCT/CA2010/001010
[0044] In another embodiment, the step of generating the SAR
image using the corrected data comprises optically generating
the SAR image using the corrected digital data. Any adequate
optical methods for generating a SAR image using the corrected
SAR data can be used. The SAR image is generated by creating an
optical image of the SAR raw data and optically processing the
image of the SAR raw data.
[0045] Figure 8 illustrates one embodiment of a system 100
for determining the Doppler centroid in SAR raw data. The system
100 comprises a memory 102, a sub-image data generator 104, a
SAR image generator 106, and a Doppler centroid estimator 108.
The system 100 is adapted to receive SAR raw data representative
of echoes reflected by a target area. The SAR raw data is stored
in the memory 102. The sub-image data generator 104 is adapted
to generate at least two sub-sets of SAR raw data in accordance
with the methods illustrated above. The sub-image data generator
104 accesses the SAR raw data from the memory and generates at
least two sub-sets of SAR raw data each corresponding to a sub-
area of the target area. The sub-areas are aligned along an
azimuth axis. The sub-sets of SAR raw data are transmitted to
the SAR image generator 106. Alternatively, the sub-sets of SAR
raw data are stored in the memory 102. For each sub-set of SAR
raw data, the SAR image generator 106 generates a SAR image. The
SAR image generator 106 is further adapted to measure the mean
intensity of at least a section of each generated SAR image. The
measured mean intensities are transmitted to the Doppler
centroid estimator 108 which is adapted to determine the skew of
the function representing the mean intensity versus the ground
look number of the sub-area and the Doppler centroid from the
skew in accordance with the method described above.
- 12 -
CA 02802790 2012-12-14
WO 2012/000076 PCT/CA2010/001010
[0046] In one embodiment, the SAR image generator 106 is a
digital generator comprising a processing unit configured to
digitally generate a SAR image using the digital methods
described above. The processing unit is further configured to
measure the mean intensity of at least a section of each
generated image.
[0047] In another embodiment, the SAR image generator 106
comprises a coherent light source, a pixel drive unit, a light
modulator such as an SLM or a micro display, and an optical
processor. Any adequate light modulator can be used. For
example, the light modulator can be a liquid crystal display, a
micro mirror SLM, an electro-optic SLM, a magneto-optic SLM, or
the like. The pixel drive unit is adapted to control the
transmittance of each addressable pixel of the light modulator.
For each one of the sub-sets of SAR raw data, the SAR image
generator 106 receives the sub-set of SAR raw data and the pixel
drive unit sets the transmittance of the addressable pixels of
the light modulator in accordance with the sub-set of SAR raw
data. The coherent light source emits a coherent light beam
which illuminates the light modulator. The coherent light
incident to the light modulator is modulated in accordance with
the transmittance of the pixels and a modulated light
corresponding to an image of the sub-set of SAR data is
transmitted at the output of the light modulator. The modulated
light then propagates through the optical processor which
generates a reconstructed image of the sub-area. At the output
of the optical processor, the reconstructed image of the sub-
area is detected by the light detector which measures the mean
intensity of at least a section of the reconstructed image.
Alternatively, the SAR image generator can also be provided with
an optical detector or sensor, such as a CCD or a CMOS sensor,
- 13 -
CA 02802790 2012-12-14
WO 2012/000076 PCT/CA2010/001010
for converting the optical image of the sub-area into a digital
image which can be saved in memory and the mean intensity is
then digitally measured.
[0048] In one embodiment, the coherent light source comprises
a spatial filter to improve the quality of the image. A
polarizer may be provided between the light modulator and the
coherent light source if the light modulator requires polarized
light.
[0049] In one embodiment, the optical processor comprises at
least one cylindrical lens to selectively focus the azimuth or
range field. The cylindrical lens can be used together with a
spherical lens to provide focusing power in the azimuth
direction. The cylindrical lens may also compensate for a chirp
along the range direction and/or for a range phase factor along
the azimuth direction.
[0050] In one embodiment in which the SAR image generator
comprises a light detector, the optical processor can comprise
at least one spherical lens for imaging the processed wave to
the detector plane of the light detector.
[0051] In one embodiment, the sub-image generator 104 and the
Doppler centroid estimator 108 are embodied as a single module
adapted to perform the steps 54 and 58 of the method 50.
[0052] In an embodiment in which the system 100 is adapted to
digitally generate SAR images, the sub-image generator 104 and
the SAR image generator 106 and/or the Doppler centroid
estimator 108 are embodied as a single module comprising a
processing unit configured for performing the steps 54 and 56
and/or 58 of the method 50.
- 14 -
CA 02802790 2012-12-14
WO 2012/000076 PCT/CA2010/001010
[0053] In one embodiment, the system 100 further comprises
the SAR raw data correcting module adapted to determine the
Doppler shift from the determined Doppler centroid and correct
the SAR raw data in order to compensate for the Doppler shift
using the method described above. The corrected raw data are
then sent to the SAR image generator 106 or an additional SAR
image generator, which generates an image of the corrected data.
[0054] It should be understood that the method 50 and the
systems 100 can be used with interferometric SARs and non-
interferometric SARs.
[0055] While the present description refers to a synthetic
aperture radar, it should be understood that the methods,
apparatuses, and systems described above can be applied to any
synthetic aperture imaging system. For example, the method 50,
and the apparatus 100 can be used with a synthetic aperture
SONAR (SAS), a synthetic aperture LIDAR, a synthetic aperture
terahertz system, a synthetic aperture infrared system, or the
like.
[0056] It should be noted that the present invention can be
carried out as a method or can be embodied in a system or an
apparatus. The embodiments of the invention described above are
intended to be exemplary only. The scope of the invention is
therefore intended to be limited solely by the scope of the
appended claims.
- 15 -