Note: Descriptions are shown in the official language in which they were submitted.
METHOD AND APPARATUS FOR DETERMINATION OF SYSTEM PARAMETERS
FOR REDUCING CRUDE UNIT CORROSION
Background of the Invention
'Ibis invention relates generally to methods of reducing corrosion in a
crude unit. More specifically, the invention relates to methods of optimizing
system
parameters in a process stream of a crude unit to reduce corrosion in the
crude unit. The
invention has particular relevance to sampling dew point water and accumulator
boot
water to measure system parameters and respond to such measurements to reduce
corrosion and/or corrosion byproduct deposition in the crude unit.
In a crude oil refinery, generally the oil is pumped from a storage tank to a
crude unit for processing. The crude unit cleans the oil through water washing
in a "
desalter and then splits the oil into fractions in an atmospheric distillation
tower. These
fractions are pumped to various processing units downstream of the crude unit
(e.g.,
coker, catalytic cracker, hydrotreater etc.). Though corrosion and corrosion
byproduct
deposition (the latter sometimes referred to herein as fouling) occur in many
areas of a
crude unit, the most severe corrosion and fouling typically take place in the
overhead
condensing system of an atmospheric distillation tower system.
Refinery crude unit processing has becoming increasingly difficult in
recent years and is predicted to become even more challenging and complex for
several
CA 2818940 2018-11-09
CA 02818940 2013-05-23
WO 2012/149076
PCT/US2012/035075
reasons. For example, significant increases in crude oil prices have caused
refiners to
aggressively pursue "opportunity' or "challenging" crudes that are obtainable
at
discounted prices. The lower price is linked to a crude property such as high
acid or high
solids content that makes it less desirable than the light, sweet benchmark
crudes.
Refiners switch crude slates more frequently than in the past due to
minimum on-hand crude oil inventory combined with increased crude oil variety.
A
crude slate switch typically upsets the steady state condition of a crude unit
for up to
several hours. Generally, about eighty percent of the corrosion and fouling
occurs during
these switches or disruptions, which normally last about twenty percent of the
time. If
fouling and corrosion issues are severe enough, the refiner will discontinue
processing the
crude oil or blend of crudes causing the problem. However, these challenging
crudes are
available to the refiner at a discount thus making them more profitable.
Discontinuing
such problematic crudes is accordingly not a very popular option.
In efforts to reduce corrosion, a crude unit may be serviced two or three
times per week, or in some cases daily. Daily service at best provides a snap
shot view of
a dynamic crude unit system. Crude type and/or raw crude storage tanks are
switched
several times per week, sometimes daily. The contents of each tank are
different from the
others, so each switch causes a change of feed quality to the crude unit, many
times
upsetting the steady state status and causing disruptions in the system.
Preheating,
desalting, and distilling operations shift with the new crude, sending
products and/or
effluent water sources off specification. Many adjustments over several hours
(in some
cases days) normally take place to return the crude unit to steady state
operation.
2
CA 02818940 2013-05-23
WO 2012/149076
PCT/US2012/035075
The most common current industry practice to control such disruptions and
optimize crude unit operation is to provide enough manpower and man-hours. For
instance, each crude unit may have an operating crew from three to ten people,
depending
on size and complexity of the unit. This crew may spend their day gathering
various
samples for wet chemistry tab testing, and measuring and making adjustments
for
temperature and flow to keep the unit running within specification. Such
practice is
typically geared towards keeping the unit operating properly with respect to
fractionation
quality cut points and end points, with minimal attention being paid to a
speciality
chemical corrosion control program. If a disruption is severe, changes may be-
made to
the process chemicals and/or changes in levels, flows, or temperatures may be
recommended around the crude unit to keep the dynamic system in as optimum a
condition as possible.
Attempts to compensate thr periodic, or sometimes prolonged lack of
human involvement include installing online pH meters on atmospheric
distillation towers
overhead .tcctinatilator water hoots; however, due to a high rate of fouling
of the pH_
sensor only a small percentage of these meters operate correctly for any
length of time.
Online instrumentation, such as pIT meters, requires routine maintenance and
calibration.
Moreover, online. pH merely tracks the p11 and sends an alarm to the operator
when .the
pH is outside the control limits. Often, poorly calibrated and/or fouled
meters cause
frequent alarms. This frequency tends to minimize the effectiveness of the
alarm system.
Due to the lack of industry success with online pH metering and other
monitoring efforts refiners
have not pursued more exotic and effective online instrumentation for process
chemical
3
programs. There thus exists an ongoing need for more sophisticated and
effective online and/or
automatic methods for monitoring parameters and reducing corrosion in crude
units.
The art described in this section is not intended to constitute an admission
that any
patent, publication or other information referred to herein is "prior art"
with respect to this
invention, unless specifically designated as such.
Brief Summary of the Invention
At least one embodiment of the invention is directed towards a method of
measuring at least one property of a predominantly liquid sample. The method
comprises the
steps of: 1) adding at least one chemical reagent to the sample, the chemical
reagent capable of
inducing a measurable optical effect when added to the sample that is directly
related to the
property to be detected, 2) measuring the optical effect, and 3) deducing the
value of the property
by comparing the measured optical effect to pre-determined values associated
with the property
to be determined. The relationship between the measured optical effect and the
property to be
determined is independent of the volume of the liquid sample and independent
of the volume of
the reagent added to the sample.
The measured property may be one item selected from the list consisting on pH,
iron concentration, chloride concentration, and any combination thereof. The
measured optical
effect may be a colorimetric effect, turbidity effect, or a fluorescent
effect. The reagent may be
thoroughly mixed with the sample. The optical effect may be measured by
determining an
absorbance level at a particular wavelength whose measurement is recognized as
an isosbestic
4
CA 2818940 2018-11-09
CA 02818940 2013-05-23
WO 2012/149076 PCT/US2012/035075
point for all values of the property, detecting at least one other absorbance
level for one other
wavelength, comparing the two absorbance levels with pre-determined data, and
correlating the
two absorbance levels to the known absorbance levels of a particular value of
the property. The
reagents may be selected from the list consisting of: bromeresol purple,
fluorescein, PTSA,
TITTSA, calcein blue, FeITOZ1110, silver nitrate, thioglycolic acid, ammonia,
pH buffer, fenie iron
reductant, fluorescent dyeõ lueigenin, and any combination thereof.
The optical effect may be measured by the reagents being at least two
fluorescent
dyes, one of the dyes' fluorescence at a first wavelength is affected by the
value of the property
and one of the other dyes' fluorescence at a second wavelength is unaffected
by the value of the
property. The method may further comprise the steps of measuring the ratio of
the -fluorescence
intensities of the first and second wavelengths in the sample, comparing that
ratio to the ratio of
the fluorescence of the first and second wavelengths in a control having a
known value of that
property, and correlating the proportional change in the two ratios to the
property value. The
optical etlect may be measured by the reagent's absorbance and fluorescence
where the
absorbance is unaffected by the value of the property and the fluorescence is
affected by the value
of the property, by comparing the ratio of the fluorescence to absorbance to a
control having a
blown value of the property, and correlating the proportional change in the
two ratios to the
property. The reagent may form a complex with a compound that causes the
property, the
absorbance of the complex at a pre-determined wavelength is directly related
to the amount of
that compound present and not to the amount of reagent added.
The sample may be positioned within an apparatus. The apparatus comprises at
least one reagent source constructed and arranged to feed the reagent into a
chamber where it is
mixed with the sample and the sample is moved past an optical sensor that
measures the optical
CA 02818940 2013-05-23
WO 2012/149076
PCT/US2012/035075
property. The apparatus may further comprise a light source which may be
positioned in line or
perpendicular to the optical sensor. The light source may also be in line or
perpendicular to a
BDD cell through which the sample passes before the reagents are added. The
BD[) cell may be
constructed and arranged to oxidize sulfoxy compounds. The light source may
also be in line or
perpendicular to a vertically angled sensor flow path through which the sample
flows whereby
measured light passing to the optical sensor passes horizontally through the
sample. There may
be at least two optical sensors and the sensors are positioned along a
horizontal plane relative to
the vertical flow path. The apparatus may further comprise a tube downstream
from the sensor,
at least a portion of the tube is higher than the sensor and is horizontally
angled, the tube is
constructed and arranged to facilitate the migration of gas bubbles away from
the sensor. The
tube may be inverted U-shaped. The apparatus may further comprise a gas source
upstream from
the sensor, the gas source constructed and arranged to sparge undesired
materials away from the
sample. The apparatus may be interfaced with a control system governing at
least some of the
operations of a chemical process stream from which the sample was taken, the
measured data
resulting in the control system implementing a counter-measure in response to
the property.
Brief Description of the Drawings
A detailed description of the invention is hereafter described with specific
reference being made to the drawings in which:
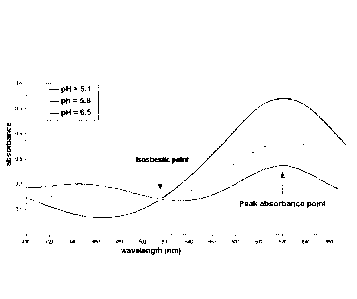
FIG. l is a graph used to show how the isoshestic point can be used to
determine
parameters of a liquid sample.
FTG. 2 contains graphs used to illustrate how isoshestie points at different
pH can
be used to determine parameters ora liquid sample. In these graphs the left Y-
axis is absorbance
6
CA 02818940 2013-05-23
WO 2012/149076 PCT/US2012/035075
for Isosbestic points and pH channels. The right Y-axis is the ratio pl-Visos.
FIG. 3 is a graph used to illustrate the accuracy of the invention's
measurements.
FIG. 4 is a graph used to Illustrate how T.P.,PTS.A and Incigenin can
determine
chloride concentration using fluorescence ratioing. The Y-axis is fluorescence
intensity.
FIG. 5 is a graph used to illustrate how lueigenin fluorescence can be used to
measure chloride using absorbance correction for sample and reagent volumes.
in this graph
Channel Counts is transmitted light intensity for the Trans curve. It is
fluorescence intensity for
the fluorescence curveõAbsorbance of the lucigenia dye is calculated by log10
(ref/trans).
FIG. 6 is a side view illustration of an apparatus used to measure parameters
of a
liquid sample.
FIG. 7 is an overhead view illustration of an apparatus used to measure
parameters
of a liquid sample
FIG, 8 is a flowchart illustration of various components in an apparatus used
to
measure parameters of a liquid sample.
FIG. 9 is a graph used to illustrate turbidity correction. in Fe measurements.
FIG. 10 is a graph illustrating response curves for chloride by turbidity
using
absorbance measurement. In this graph, Channel Counts is transmitted light
intensity for the
Trans curve. .Absorbance of the suspended .AgCI is calculated by
log10(reftrans) where the
reference curve is not shown. This absorbance is given as the X-axis in Figure
11,
FIG, 1 I is a graph illustrating a nonlinear calibration curve for chloride by
absorbance of the turbidity fbrmed by reaction of the sample with silver
nitrate.
7
Detailed Description of the invention
For purposes of this application the definition of these terms is as follows:
"BDD electrode" mean a boron doped diamond electrode that is at least
partially
covered with p-type diamond material in which at some of the covalent bond
sites where carbon
atoms would be in a pure diamond Material there are boron atoms covalently
bonded instead.
The BDD electrode is used in an electrochemical cell in which the BDD
electrode is the anode.
"Blank sample" means a liquid sample not containing reagent.
"Boot Waters" means a liquid sample taken from the aqueous phase of a
distilled
fraction of oil, in which the fraction has condensed and separated into an
aqueous phase and an
organic phase and are commonly (but not necessarily) collected from an
accumulator downstream
from a heat exchanger.
"Colorimeter" means a device, which measures the intensity of transmitted
light at
a particular wavelength that passes through a sample.
"Controller" means a manual operator or an electronic device having components
such as a processor, memory device, digital storage medium, cathode ray tube,
liquid crystal
display, plasma display, touch screen, or other monitor, and/or other
components which is
operable for integration with one or more application-specific integrated
circuits, programs,
computer-executable instructions or algorithms, one or more hard-wired
devices, wireless
devices, andfor one or more mechanical devices and which is operable to
integrate the feedback,
feed-forward, or predictive loop(s), and its functions may be at a central
location, such as a
network server, for communication over a local area network, wide area
network, wireless
network, Internet connection, microwave link, infrared link, and the like,
other components such
8
CA 2818940 2019-09-18
CA 02818940 2013-05-23
WO 2012/149076 PCT/US2012/035075
as a signal conditioner or system monitor may be included to facilitate signal
transmission and
signal-processing algorithms,
"Dew Point Water" means a liquid sample. taken at the point of initial
condensation of steam to water or the temperature at which a phase of liquid
water separates from
the water vapors and liquid hydrocarbons and begins to form liquid water as
the vapors cool.
This sample may be formed in collectors that are cooled by coils containing
cooling water that is
circulated through them. Dew point water will contain the highest amount of
ITO and other acids
relative to water samples taken further downstream.
"Ferrozine" means a mixture of 3-(2-pyridy1)-5, 5-bis(4-phenyisulfonic acid)4,
2,
zl-triazine, monosodium salt and ammonium thioglyeolate.
"Fluorometer" means a device, which measures the intensity of light that is
generated by a sample as it fluoresces that has a different wavelength than
the light projected into
the sample. The fluorescence light can be measured at an angle (which can be
900) with respect
to the light projected into the sample.
"interface" means the solid, electromagnetic, optical, virtual, or other
interconnection between the analyzer and at least one other item through which
electricity,
plasma, light, radiation, fluid, data, information, matter, reagent, waste,
material to be sampled,
energy, heat, liquid, and/or gas pass between the analyzer and the item,
"PTSA" means Pyretic tetrasulfonic acid.
"Sparging" means introducing gas into a liquid for the purpose of creating a
plurality of bubbles that migrate up the liquid and remove a particular
material from the liquid
through contact between the bubbles and the particular material,
9
"Sweeten" means to remove or render non-reactive a particular unwanted
composition present in an aqueous fraction, including but not limited to
hydrogen sulfide and
other sulfur based compounds.
"TP.PTSA" moans 5,10,15,20-tetrapheny1-21H, 23H-porphine-tetrasulfonic acid,
tetrasodium hydrate.
"Turbidity Meter" or "Turbidimeter" means a device, which measures the
intensity of light within a liquid that is scattered from a source beam of
light as a result of the
source beam of light interacting with particles within the liquid. The
wavelength of the scattered
light is the same as that projected into the sample.
In the event that the above definitions or a description stated elsewhere in
this
application is inconsistent with a meaning (explicit or implicit) which is
commonly used, in a
dictionary, the application
and the claim terms in particular are understood to be construed according to
the definition or
description in this application, and not according to the common definition,
dictionary definition.
In light of the above, in the event that a term
can only be understood if it is construed by a dictionary, if the term is
defined by the Kirk- Othmer
Encyclopedia of chemical Technology, 5th Edition, (2005), (Published. by
Wiley, John. & Sons,
Inc.) this definition shall control how the term is to be defined in the
claims.
Embodiments of the invention include a method of analyzing and an apparatus
for
analyzing properties and contents of a water sample. The water sample can be
from crude unit
overhead condensers. The analysis may be used to control a chemical corrosion
control system.
At least one embodiment of the invention is directed towards a method of
measuring system parameters for control of product feed in a crude oil
refinery. At least one
CA 2818940 2019-09-18
CA 02818940 2013-05-23
WO 2012/149076
PCT/US2012/035075
embodiment is directed to a method of reducing corrosion in a crude oil
refinery by making use
of the measured parameters. At least one embodiment is directed towards a heat
exchanger
operated in conjunction with at least one sensor capable of detecting the
parameters. The
parameters are one item selected from the list consisting of: metal
concentration, chloride
concentration, pH, and any combination thereof. Metals contemplated by the
invention cur
detection include but are not limited to: iron, copper, molybdenum, nickel and
zinc. In at least
one embodiment, one or more of the parameters are measured by an analyzer,
which has at least
one sensor.
Measuring the properties and compositions of various condensed water fractions
can be complicated. 'the Fractions that are analyzed typically are a widely
diverse (and at least
partially) and aqueous compositions comprising water, light hydrocarbons,
hydrogen sulfide, and
suspended solids of iron sulfides and iron oxides which can be agglomerated
with heavier
organics, amines, ammonia, organic acid (such as acetic acid) and silica. The
fractions typically
vary in pH, chloride concentration, and iron concentration and knowledge of
these values is
important in proper facility operation if pH is too low, corrosion of
downstream equipment can
occur. Excess chloride is an indicator that excessive corrosive hydrochloric
acid is present.
Excess iron is indicative of steel corrosion Z Ind reacts with sulfides to
form FeS particles that
deposit on internal system surfaces. Of particular use i.s determining the
parameter values early
in the condensation region to allow adequate time to properly enact a
corrosion control program
such as strategically injecting neutralizing amines (for pH control), filming
inhibitors (for iron
control), caustic solutions (for control), and the like.
Performing these measurements however is quite a challenge as the compositions
of the fractions are harmful to most sensors. In prior art sensors, small
diameter plastic tubing,
CA 02818940 2013-05-23
WO 2012/149076 PCT/US2012/035075
peristaltic pumps, valves and other mechanical parts rapidly become fouled
and/or plugged.
Partieles, oils, and other organics cause drift in baselines and calibration
errors in optical
components. Colorimetrie equipment in particular can become inaccurate due to
background
color, turbidity interference, and fouling of optical surfaces.
Electrochemical devices and
especially ion selective electrodes can be disturbed by sulfide compounds,
which are often
present in amounts exceeding hundreds of ppin
Ideally the parameters would be determined when or before the fractions enter
the
heat exchangers and/or at or before the dew point of steam, The value of the
parameters collected
at the dew point provides the most accurate prediction of what degree and form
of downstream
corrosion will ultimately occur and allows for precise use of a corrosion
control program and
would maximize the lifespan of the heat exchangers.
Unfortunately, practically no dew point samples are normally available. As a
result common practice is to instead obtain measurements on boot waters where
the water in the
fraction has completely condensed and to use that measurement to control
chemical dosage and
the need for a corrosion control program. Dew point samples may be Obtained
according to the
disclosures of US Patents 4,355,072 and 5,425,267 and US Patent Application
121263904,
Prior art methods of measuring parameters such as pH, chloride and iron with
colorimetry are reagent based. They involve adding a known amount of reagent
to a set volume
of sample. This has a number of disadvantages. First if there is an error in
adding the correct
amount of reagent, the reading will be incorrect since the absorbance measured
depends on the
amount of reagent. Second it is cumbersome because a specific volume of sample
must be
removed Jean a dynamic system. For accurate results, a start-stop process is
normally used. This
process consists of acquiring a sample and metering a known. volume of it into
a vessel. Then a
12
CA 02818940 2013-05-23
WO 2012/149076 PCT/US2012/035075
known amount of reagent is added and mixed. A far better system would involve
measuring, a
parameter by adding a small volume of reagent into a flowing sample without
needing to control
the amount of reagent. In such a system, as the added reagent disperses in the
flowing sample, its
concentration continuously decreases. Therefore, prior art methods would give
errors since the
measured absorbance depends on the now unknown amount of reagent in the
sample. This can
be overcome by referencing the amount of sample by a value that relates to the
volume of reagent
in the sample or reagent concentration in the sample.
In at least one embodiment a parameter is measured directly by adding an
amount
of a reagent to a liquid sample of a refinery process stream and directly
measuring an optical
property directly related to that amount of reagent wherein the measured
parameter is not
dependent on knowing the concentration of the reagents in the liquid sample,
In at least one
embodiment the measured parameter is one item selected from the list
consisting of: pH, iron (or
other metal) concentration, and chloride concentration.
In at least one embodiment the pIT is directly measured by using the
isosbestic
point of a colorimetric dye. FIG. 1 illustrates a graph of the absorbance vs.
wavelength of the
same concentration of a colorimetric dye in samples having various pH values.
While each of the
different pH samples has a unique absorbance at the pH wavelength, they all
share a single
wavelength at which the colorimetric, dye displays a constant absorbance level
regardless of pH,
the isosbestic point. By ratioing the absorbance at the wavelength to that
at the isosbestic
point, the pEl value obtained is independent of the relative amount of reagent
or sample. In the
prior art an algorithm is used which relies upon knowing the sample volume and
the maximum
absorbance wavelength to determine the
13
CA 02818940 2013-05-23
WO 2012/149076 PCT/US2012/035075
In the invention however rather than simply using.- the maximum absorbance to
determine pH, pH is instead determined by ratioing the maximum absorbance to
the isosbestic
point. The isosbestic point for the specific colorimetric dye used is a pre-
determined
characteristic of the dye that depends only on its concentration. Moreover for
that dye, the
maximum absorbance is also known for various pH values. As a result, on=
colorimetric
readings are taken for a sample, if the isosbestic and the maximum absorbances
are known, and
the readings confirm the pre-determined isoshestic point, then the readings
can be identified as
corresponding to the graph of a specific pH and the pu for the sample can be
known without the
need for knowirat the reagent concentration. initial blank sample measurements
allow for
accurate readings to he taken even for samples that are harder to measure with
the prier art
methods such as highly turbid or colored samples that interfere with the
measured maximum
absorbance. Likewise blank sample measurements correct for accumulated fouling
of the optic
tube. Ratioing the maximum absorbance to the isosbestic absorba.nce cancels
out the effects of
light source intensity variation and detector responsiveness variation. In at
least one embodiment
effects that are additive such as color, turbidity, and tube fouling are
corrected by blank
subtraction. In at least one embodiment effects that are proportional such as
light intensity and
detector sensitivity are corrected by ratioing.
In at least one embodiment, optical readings are performed on a number of pump
push strokes for a number of measurements while the reacted. sample flows
through the
colorimeter. Data arrays are filled with all transmittance data for the
isosbestic point and p1-1
band. the reference photodiodes for both LEDs are also read and are used to
correct for any
variation in light source emission intensity variation. Representative data
for three runs on
calibration standards are plotted in FIG. 2 where the left axes are absorbance
for the two
1.4
CA 02818940 2013-05-23
WO 2012/149076 PCT/US2012/035075
channels. The isoshestie curves illustrate how the pH dye concentration
increases to a peak arid
then declines back to the baseline. Since the runs are identical in function,
the isosbestic curves
are seen to be the same while the pH curves increase at higher pH. The right
axes are the
calculated ratios of blank-corrected pal and isoshestie absorbances. The ratio
curves (phlsos)
should ideally he flat lines if the isosbestic correction is valid. It is seen
that around the peak area
they are horizontal. These plots clearly show the value of our technique of
ratio lag and how
accurate values result. Readings could have been taken anywhere the ratio is
constant within the
desired error tolerance, not just at the peak, for example, in comparison,
prior art methods, using
the same range of readings, would have resulted in significant errors since
the absorbance at only
the pH wavelength varies widely.
The first four baseline points, or blank sample points, are averaged and
stored.
These exist as the sample liquid between the reagent injection point and optic
tube flows throuah.
the optic tube. As the sample liquid continues to flow through the optic tube,
sample mixed with
reagent flows through the optic tube on which readings are taken. After all
readings are
collected, the arrays are searched for the peak in the isosbeseic response.
The corresponding peak
in the pH curve is also extracted. The absorbanees are calculated from the
peak transmittances
and the reference values as logia (peak reference/peak transmittance) and are
corrected for tube
fouling and sample turbidity by subtracting the blank absorbances.
The ratio of corrected pH to corrected isosbestie absorhanees is input to the
calibration equation.
The pl." calibration equation is according to the linear function:
pH = pK + pHSlope x log(4bsi(Abs11 Abs))
CA 02818940 2013-05-23
WO 2012/149076 PCT/US2012/035075
Absji is the ratio for the pH II standard and is a constant in the equation
representing the maxirnum absorbance at the pH wavelength. Using the other two
pH standard
ratios, pK and piNlope are calculated as constants. When an unknown sample is
measured, the
ratio for the sample, Abs, is put into the equation and pH is found. FIG. 4
shows a typical
calibration line and the equation used in calculating
Because the dye becomes less sensitive
above pH 7,5, there is some inaccuracy in this area. In at least one.
embodiment a correction
factor is used to correct for the inaccuracy above pH 7.5.
In at least one embodiment the colorimetrie dye used is bromeresol purple.
Bromeresol purple has an isosbestie point at 488 rim and maximum absorbance at
590 um due to
As a result if samples are constantly taken from a refinery process stream,
have bromcresol
purple added to them, the pH can be accurately determined by ratioing the
absorbance al 590 urn
to that at 488 nm regardless of whether the sample volume or reagent
concentration is known. As
a result, it can be used to obtain accurate measurements without first
determining or even
knowing the volume of the reagent or having to compare the volume of the
reagent to a control
value. This allows for the analyzer to be a true online application where
reagent dispersion in the
flowing sample always gives accurate results. This is a significant
improvement over the prior art
that would only give accurate values when the reagent/sample volume ratio were
known which
cannot be known in a flowing sample stream. Thus the invention allows for the
avoidance of the
inefficient start-stop method used in the prior art.
In at least one embodiment parameters are measured directly using the ratio of
the
fluorescence of two fluorescent dyes. In the prior art fluorescent dyes have
been used to measure
the chloride content and pH of a sample by measuring the fluorescence of the
dyes in the sample
where the amount of dye and sample are both known. In at least one embodiment,
two or more
16
CA 02818940 2013-05-23
WO 2012/149076 PCT/US2012/035075
fluorescent dyes are added to a sample, each of which displays clear
fluorescence at certain
wavelengths. One dye's fluorescence intensity at a particular wavelength is
directly dependent on
the desired parameter and another dye's fluorescence intensity is completely
independent of the
desired parameter. The fluorescence intensity of the second dye is dependent
only on its
concentration in the sample mixture. By comparing the fluorescence ratio of
the two dyes at the
two .wavelengths in a control sample where the parameter is known to the
fluorescence ratio of an
unknown sample, the parameter of the unknown sample can be determined.
in at least one of the embodiments the dyes used are lucigenin (9, 9'-bis-N-
methyLacridinium nitrate) and PTS.A to determine chloride concentration by
fluorescence
quenching. At 510 nm, lucigenin's fluorescence is dependent on chloride
concentration while
PISA gives no fluorescence there. At 405 am PTSA's fluorescence is independent
of chloride
concentration while lacigenin does riot fluoresce there. By comparing the
ratio of the
fluorescence at 510 nm and 4C5 nm in a control to a measured sample, the
parameters of the
measured samples can be determined.
Another suitable reference dye is TPPTSA which fluoresces at 670 rim and whose
fluorescen.ce is independent of chloride concentration. By ratioing the
fluorescence of lucigenin
at 510 nm to the fluorescence of IFFI'SA at 670 nm, the variation in dye
concentration and
sample volume is corrected. FIG. 4 illustrates the respective spectra for
TPPTSA. and lucigenin
with and without chloride.
In at least one embodiment the desired parameter content is directly
determined by
measuring florescence quenching using only one dye. In at least one embodiment
the single
fluorescent dye is a dye whose fluorescence is diminished at a particular
wavelength by dilation
and whose fluorescence is diminished by the presence of a particular
composition, for example
17
CA 02818940 2013-05-23
WO 2012/149076 PCT/US2012/035075
by one containing chloride ions. As illustrated in .FIG. 5, in at least one
embodiment, this single
dye is lucigenin whose absorbance at 43:3 nm is dependent only on its
concentration, while at 510
am its fluorescence is dependent on the presence of chloride ions and its
concentration. By
ratioing its tluoreseenee to its absorbance, the effect of dilution or
concentration of dye in the
sample is canceled. The change in ratio between a control value and a measured
sample can be
used to determine the amount of chloride in a sample.
In at least one embodiment a eolorimetric absorbance reading is taken of a
complex formed between a parameter and an added reagent. A reagent is added
that does not
itself display colorimetric results at a given wavelength bat if it forms a
particular colored
complex in the presence of a parameter, the presence of that complex will
result in an apparent
absorbance reading. In at least one embodiment, Ferrozine is added to a
sample. At 560 nun
Ferrozine itself does not appreciably display absorbance. If iron is present
however, the
Ferrozine complexes with the iron and shows absorbance at 560 nm which can be
used to
determine the exact amount of iron present. If the absorbance is read when an
excess of
Ferrozine is present, then the value for iron is accurate without knowing
exactly how much
Ferrozine or sample is present, In at least one embodiment a Ferrozine reagent
buffer alters the
background readings of the sensor and gives erroneous readings at 560 turn, so
a second reading is
taken at 690 am where the Fe-Ferrozine complex does not absorb and the
background reading at
this wavelength is subtracted from that at 560 nun. Thc background level due
to turbidity or color
is removed from the reading.
In at least on embodiment silver nitrate is added to the sample. Silver
nitrate
does not appreciably absorb at 680 nm, but silver nitrate reacts with chloride
to form silver
chloride. Suspended silver chloride can be detected by measuring the
absorbance at 680 um from
18
CA 02818940 2013-05-23
WO 2012/149076 PCT/US2012/035075
the path of a light beam passing through a sample. It can also be detected by
measuring the
turbidity in a turbidineeter at 680 mm. The measurement then does not depend
on the level of
silver nitrate concentration.
Referring now u FIG. 6 there is shown an apparatus (100) useful for
determining
parameters using colorimetric, turbidimatric, or fluorescence readings. The
apparatus comprises
a manifold (101) into which a liquid sample from a source is introduced, The
liquid then can
pass into a chamber (103) into which one or more reagent sources (104) are
injected, The
chamber includes a mixing device (105) which can he mechanical, flux based,
ultrasonic, or
based on any other known mixing technology in the art, in one embodiment, a
reagent pump is
connected to the chamber (103) by a eapillary to minimize dead volume where
diffusion of
sample and reagent can occur. This avoids inaccuracies caused by a reagent
injection that mostly
comprises sample that had back-diffused into the reagent pump. In other
embodiments the
apparatus is constructed and arranged to avoid this problem with an
elastomerie duck-bill or with
other back-flow prevention devices known in the are
After reagent addition, the liquid sample passes through a sensor tube path
(110)
along which is at least one colorimeter, turbidhneter, or fluorometrie sensor
(106). The
colorimeter (106) comprises at least one optical sensor (107) and may also
include at least one
light source (108). The sensor (107) can be in-line and/or at an angle of more
than zero and less
than 180 degrees. in at least one embodiment the sensor (107) is located at a
90-degree angle to
the light source (108). There optionally can be one optical sensor (107)
located directly above the
light source whose purpose is to read only the light output of the light
source to reference
colorimeter and fluorometer readings. Any variations due to aging or
temperature changes can be
corrected by ratioing to sensor (107) reading.
19
CA 02818940 2013-05-23
WO 2012/149076 PCT/US2012/035075
In at least one embodiment the fight sources project and through-cell
detectors
view the sample in the same plane. In at least one embodiment this plane is
perpendicular to the
sensor tube path the sample is passing through. In at least one embodiment all
of the sensors are
perpendicular to the tube and are positioned at the same displacement along
the tube so that the
exact same sample volume is measured by all detectors simultaneously so they
take the same
"picture" of the sample flowing through the sensor tube
Downstream and above the sensor (107) is an angled tube (109.) The angled tube
(109) comprises a portion of tube length that extends along a path that
extends at a more
horizontal angle than the more. vertically angled sensor tube path (110). The
positioning and
shape of the sensor tube. path (110) and angled tube path (109) facilitate the
migration of gas
bubbles up away from the colorimeter or fluorometer sensor (106). In at least
one embodiment,
sensor tube path (110) is substantially vertical. TR at least one embodiment-,
at least a portion of
the angled tube (109) is substantially horizontal. In at least one embodiment,
as illustrated hi
AG. 6 at least a portion of the angled tube (109) is an inverted U shape. In
at least one
embodiment, sensor readings are taken in synchronization to a sample pump such
that the
readings are taken when the pump is in its intake stroke where sample, flow is
momentarily
stopped. This allows any bubbles to float out of the optical path so a true
optical absorbance or
fluorescence reading will be obtainedµ
As illustrated in FE.G 7, in at least one embodiment the apparatus (100)
comprises
more than one sensor (106a, 106b). in at least one embodiment more than one of
the sensors are
planar relative to the sensor tube path (110). Planar sensors allow
simultaneous measurements of
more than one parameter. In at least one embodiment the apparatus (100) can
contain a
CA 02818940 2013-05-23
WO 2012/149076 PCT/US2012/035075
temperature sensor, such as a thermistor, RID, thermocouple, and the like, so
temperature
compensation of the absorbance or fluorescence readings can be performed.
In at least one embodiment after passing through the angled tube (109), the
sample
is either disposed of or is returned to the industry fluid stream it came
from. Because the various
sensors make parameter measurements that are independent of the volume of the
sample, the
apparatus can be constructed and arranged to continuously receive sample
liquids and it can
provide continuous measurements without constantly stopping liquid input to
control for sample
ve k me.
In at least one embodiment the apparatus comprises a mechanism to sparge the
sample prior to its analysis by the sensor(s). Sparging facilitates the
removal of materials from
the sample that would otherwise impair, prevent, or otherwise complicate the
sensor analysis, In
at least one embodiment the spargirig is accomplished by aerating the sample
with air, nitrogen,
or any other gas to remove materials that are volatile or to react the
materials to the gas for the
purpose of eliminating their adverse effects,
in at least one embodiment acid, such as nitric acid or in combination with an
oxidizer, such as hydrogen peroxide are added to the sample prior to or during
sparging to
increase the rate of removal of volatile undesired material or react with the
undesired material.
In at least one embodiment the sample passes through a tiller to remove coarse
particles before the sample is analyzed. The filter may have a pore size of
between 10-200
micrometers, Flow or pressure sensors may also track the progress of the
sample through the
analyzer. In at least one embodiment the sample passes through a cooler or
heater to make it
compatible with the analyzer and reagent chemistries. In at least one
embodiment the analyzer
contains a cleaner reagent to remove fouling within the analyzer, Cleaner may
be one or more
21
CA 02818940 2013-05-23
WO 2012/149076 PCT/US2012/035075
organic amines such as ethanoiamine or methoxypropytamine or an oxidizer such
as hypochlorite
or hydrogen peroxide. Cleaner can be introduced into the analyzer through a 3-
way valve, pump,
.by any other suitable mechanism.
In at least one embodiment at least one parameter is measured according to the
methods and apparatuses disclosed in US Patents 5,326,482, 5,324,665, and
5,302,253. In at
least one embodiment the analyzer comprises one item selected from the list
consisting of a
ceramic piston body, a solenoid pump (in the place of peristaltic pump), non-
inoving part
turbulent flow mixers (in the place of coiled tube or static mixers). In at
least one embodiment a
leak detector is present. The leak detector can be a pressure sensor in the
manifold (or other
portion of the apparatus) or a conductivity sensor located wider the manifold.
In at least one embodiment the apparatus comprises at least one of the
monitoring
sensors as disclosed in US Patent 5,734,098. Tn at least one embodiment the
apparatus further
comprises instruments .to measure temperature, pressure, flow rate, and sample
weight. in at least
one embodiment the width of the sensor tube path (II lO) is optimal to
maintain the mixing of the
reagents with the sample. in at least one embodiment the mixing apparatus is
constructed and
arranged to mix the reagents with the sample in the same position that the
sensor readings will be
taken.
The apparatus can be dimensioned and its various components located and
constructed such that it can be a modular component of en overall fluid
process system. This
allows for changes (such as installation; removal, maintenance, and/or
upgrading) of just one
element of the process system without requiring a modification of other
portions of or of the
entire system in at least one embodiment at least some of the interfaces
comprise elastomeric
seals. In at least one embodiment the apparatus is engaged to a solid plate
sized to fit a pre
22
CA 02818940 2013-05-23
WO 2012/149076 PCT/US2012/035075
established size on a wall or mount. In at least one embodiment the analyzer
manifold and/or
housing containing the analyzer itself is so sized. This allows the analyzer
to be used as a
"turnkey" or 'peg.-board" deviee as the term is understood in the art. In at
least one embodiment,
the manifold is constructed according to the standards for surface mount fluid
distribution
components according to the standards described in American National
Standards, ANSIIISA-
76.00.02-2002, ISA (2002). In at least one embodiment one or more components
of the
apparatus (or the apparatus as a whole) are constructed and arranged out of
one or more modular
component connector substrate assembly systems as described in US Patent
7,178,556.
In at least one embodiment one or more ingredients of the sample are sweetened
before the sample is analyzed by the sensor(s). Various sulfur-based compounds
interthre with
various analyses (and in particular colorimetric analyses). in at least one
embodiment gas is
sparged to remove 11:S from the sample. In at least one embodiment the
sparging gas is one
selected from the list consisting of: air, hydrogen, nitrogen, helium, and any
combination thereof.
In at least one embodiment prior to a chloride analysis the sample is pre-
conditioned to sweeten the sulfur bearing materials in the sample Sulfur often
exists in. fractions
in the form of sulfides and thiosulfates. While prior art methods teach
sweetening sulfur oxides
by reacting them with hydrogen ions to form hydrogen sulfito or hydrogen
sulfate, their teachings
regarding sweetening thiosulfate require reactions with hydrogen peroxide and
boiling, such
boiling reactions are impractical in an online analyzer context. Sulfur and
thiosul fates in
particular are particularly harmful as they poison silver used in chloride
detection and ruin ion
selective electrodes. In addition silver sulfide is insoluble and can plug or
clog various
23
CA 02818940 2013-05-23
WO 2012/149076 PCT/US2012/035075
components. Also some sulfides are non-volatile so sparging alone cannot
remove them. The
BDD cell is used to remove these non-volatile species.
In at least one embodiment: the apparatus can perfonn real-time fractional
analysis.
in an industrial process stream it is quite common for the composition of the
stream .to change
over time due to various changes that occur in the system. This means that the
liquid samples
that pass through various locations at different times will have different
properties. Because the
apparatus can perform continuous analysis, the properties of each fraction can
he continuously
determined as they form.
Referring now to FIG. 8 there is shown a schematic representation of some
components present in at least one inventive embodiment. The apparatus
comprises a shut off
valve through which a sample passes. A thermometer measures temperature and a
coarse filter
removes large particulate matter. A relief valve and pressure sensor are
upstream or downstream
of the colorimetrie sensors. The flow and turbidity are also measured with
appropriate
equipment. A second tine filter further clarifies the sample before the
colorimetric analysis. At
least one sensor is used to measure each of pH, iron, and ehloride. Each
sensor corresponds to a
reagent source, a regent pump, and a mixing chamber. A BUD cell can be
upstream, downstream
or both from the colori.metric sensors. A port is provided for injecting
calibration solutions. In at
least one embodiment the sample can be filtered through a tangential filter in
addition to or
instead of a coarse and fine filter. In at least one embodiment the apparatus
is divided into two
legs to segregate the two main, distinct chemistries (for example where one
leg is sparized and the
other is not.)
In at least one embodiment the apparatus comprises a BDD cell. Some sample
ingredients, which arc resistant to sparging and chemical sweetening, can
instead be addressed
24
CA 02818940 2013-05-23
WO 2012/149076 PCT/US2012/035075
with a BDD coil. For example sulfoxy compounds interfere with colorimetric
analysis and are
difficult to sparge or chemically sweeten. A FWD cell however oxidizes the
sulfoxy compounds
for example oxidizing thiosulfate into sulfate and thereby neutralizes the
problems the sulfoxy
compounds would otherwise cause, In at least one embodiment the BDD also
imposes a uniform
temperature within the sample regardless of the temperature of the sample when
it is removed
from the industrial process stream. In at least one embodiment the temperature
of the sample is
maintained at a temperature that is optimal for one or more of the analyses to
be performed.
BDD electrode cells are particularly useful in this invention as they provide
a large
potential range without decomposing water, have a low capacitance background,
are highly
resistant to the harsh nature of the boot water sample, and are chemically
inert and do not tend to
adsorb sample constituents. The BDD electrode cell has a high over potential
for gas formation,
which allows for a very high and very effective voltage to be used to oxidize
sulfur-bearing
materials and generate hydroxyl radicals,
In at least one embodiment the BDD electrode cell is an anode and the cathode
is
an inert conductor. The cathode may be one item similar to and/or selected
front the list
consisting of: carbon, glassy carbon, platinum, stainless steel, hastelloy,
and any combination
thereof. In at least one embodiment the BDD electrode cell is within a lumen
having an internal
volume of between 5 and 100 mi. in at least one embodiment the apparatus
comprises a module
having a BIDD electrode surrounded by a cathode mesh. in at least one
embodiment nitric acid is
added to the sample to increase its conductivity and enhance oxidation. In at
least one
embodiment the BDD electrode module contains a top hole for waste removal and
gas venting,
CA 02818940 2013-05-23
WO 2012/149076 PCT/US2012/035075
In at least one embodiment the ADD electrode eeli is used to generate various
products including: hydroxyl radicals, ozone, carbon dioxide, and
hypeehlorite. In at least one
embodiment the BDD products are used to destroy biological contaminaats in at
least one portion
of the apparatus,
In at least one embodiment the apparatus provides information to a control
system
such as that described in US Patent Application 121263904. In at least one
embodiment the
determined parameter readings are interfaced with a control system and they
result in: the adding
of more, adding of less, or altogether stopping to add: acid, base, caustic,
corrosion inhibiter,
neutralizer, film inhibitor, water, and any combination thereof: In at least
one embodiment the
sample is derived from boot waters.
In at least one embodiment the apparatus is used to measure properties of
liquid
samples different from and other than boot water samples.
In at least one embodiment iron levels in the sample are measured as follows:
The
reagent and a liquid sample react for a period of time before the absorbance
is read as so the
insoluble iron becomes solubilizcd and complexed. in at least one embodiment
the time interval
is at least 2 minutes. As normal, the first four blank sample points are read
and stored as baseline
readings for correcting the final absorbanees for tube fouling. After reagent
injection, the reacted
sample is pumped for a certain amount of time, 7 seconds, to put the peak of
the sample in the
optical path of the colorimeter. After two minutes, a number of readings are
taken (such as 20)
and the results averaged.
For each wavelength, the pure sample blank readings are subtracted from those
taken after two minutes. Then the corrected absorbance at 690 um is subtracted
from those at
560 mu, The resulting value is put into a simple calibration equation of the
form [Fel k x Abs,
26
CA 02818940 2013-05-23
WO 2012/149076 PCT/US2012/035075
where Abs is the final corrected absorbance. laic advantage of the 690 mit
blanking step can be
appreciated by referring to FiG. 9 which shows results for samples in which
turbidity was added.
The correction is an improvement over no correction. Another advantage is
correction for
changes in absorbance caused by the buffer such as solubilization of suspended
material.
In at least one embodiment chloride is measured as 1bllows: Lucigenin
fluorescence in acid solution is quenched by anions such as CF and 1-15-. It
is the most sensitive
indicator for chloride .with a Ksv = 390 M71. A linear response to chloride is
obtained with r/F -
-o
1, where F is the fluorescence intensity for no chloride and F is the measured
fluorescence
intensity of the sample containing chloride. The slope of' the response is
determined during a
two-point calibration. For the analysis procedure, the sample is acidified and
then sparged to
remove interfering 1-1.2S. Then lucigenin is added and the mixed sample flows
through the
fluorometer. The first four blank sample points are read as baseline
absorbance and fluorescence.
Data arrays for all channels are collected as the mixed sample flows through
the Micrometer.
FIG. 5 shows plots oldie response for 0 ppm and 150 ppm chloride. One
fluorescence curve is
seen to be quenched by a factor of 2 in the 150 .pprii plot. The transmittance
curve for lueigenin
shows a peak where the fluorescence curve peaks and it is this point where
chloride is calculated.
Other points can also be used since the ratio corrects for reagent
concentration. The corrected
peak absorbance is calculated by subtracting the baseline absorbance from the
peak. Similarly,
the corrected fluorescence is found by subtracting the baseline fluorescence
from the peak. The
ratio of the two cotTeeted values is used in the calibration equation to
obtain the chloride
concentration in the sample.
In at least one embodiment chloride is measured as follows: Reagent such as
silver nitrate is added to a sample and the baseline absorbance values are
obtained. The sample is
27
CA 02818940 2013-05-23
WO 2012/149076
PCT/US2012/035075
read as it flows giving about 6-8 seconds fix turbidity to form. FIG. 10 shows
the turbidity and
transmittance responses as the sample flows through the device. Quite
different curves are seen
depending on the chloride concentration. Doublet formation occurs above 10 ppm
where the
times of the peaks vary with concentration, This effect does not allow a
static sample method to
be used since the time when peaks elute is not known. (One embodiment here is
that turbidity is
measured at the peak of a flowing sample and not after a specified time since
peak position will
vary with chloride concentration.) The best results were obtained when the
second transmittance
peak is used. Baseline correction is applied to the peak absorbance from which
the chloride
concentration is derived. As seen in FIG. II, the response is nonlinear and a
polynomial of order
2 was fit to the data. -Using standard equations, the cue ffic.:ients 'for the
Abs2 and Abs terms are
calculated during a three-point calibration. Optionally, at low chloride
concentrations only the
Abs term can be used as the response is nearly linear.
In at least one embodiment peraeetic acid is used to destroy sulfides and
sulfoxy
compounds, such as hydrogen sulfide, thiosulfate, and sulfite, and to
sufficiently remove their
interference effects on the analysis of chloride in industrial waters such as
overhead condensates
or hoot waters. Sulfur compounds such as hydrogen sulfide, 1-1.2S, and sulfoxy
compounds such
as thiosulfate, S2032- and sulfite, S032-, interfere seriously with reagent-
based methods of
chloride analysis. As previously mentioned, silver compounds and fluorescent
quenching
indicators are useful in analyzing sample waters. Unfortunately, these sulfur
compounds
irreversibly and totally react with and consume all Ag first, krming black,
insoluble precipitate
which coats and fouls all surfaces and thereby prevents the reaction of
chloride with Ai- needed
for proper analysis. In the case of fluorescence quenching of lueigenin, for
example, these sulfur
compounds significantly quench the fluorescence and therefore spoil its
effectiveness for
28
CA 02818940 2013-05-23
WO 2012/149076 PCT/US2012/035075
analysis. As a result, an effective analysis method would be improved when all
sulfides are
reduced at least to no more than trace levels or are substantially or
completely converted to
harmless sulfate before chloride analysis.
Known methods of removing volatile sulfides include gas sparging which
necessitates acidifying the sample and bubbling a gas, air or nitrogen
usually, and allowing
volatile II'S to vaporize out of the sample, The main problem with (his method
is that
nonvolatile sulfoxy compounds are not removed or destroyed. These compounds
still remain in
the sample to cause interference.
Sparging can be combined with reaction of the sulfides with hydrogen peroxide,
commonly used, to remove some sulfoxy compounds hut boiling for a minimum time
is required
to ensure complete removal. Such a process unfortunately is not compatible
with an on-line
analyzer. Even using 30% hydrogen peroxide is not completely effective without
boiling. Using
other oxidants such as high valent state metal ions, Ceti., Fe3 , are also not
effective.
As previously mentioned, an electrochemical method using a BDD electrode to
oxidize sulfide and sulfoxy compounds to sulfate improves the quality of the
analysis in the
presence of sulfoxy compounds. While this does work, the additionally required
components and
procedures add further complexity to the analyzer. Also this procedure is
difficult to optimize
since it is not known when all sulfides have been converted and in some cases,
chloride can be
oxidized.
In at least one embodiment, peracetic acid is used to effectively totally:
destroy all
sulfide and sulfoxy compounds. In at least one embodiment the peracetie acid
operates in no
more than 20 minutes. In at least one embodiment the peracetic acid operates
at 25C. The
peracetic acid using process is so effective that no sparging is required (but
in at least one
29
embodiment it is performed in concert with sparging). While hydrogen peroxide
itself fails to
oxidize the sulfoxy materials, in combination with peracetic acid, the removal
is highly effective.
In at least one embodiment the combination of the hydrogen peroxide with the
peracetic acid is
completely effective, The residual peracetic acid reagent does not affect the
subsequent reaction
with Ag+, In at least one embodiment the reagents used are 21 0% peracetic
acid (preferably 5%)
in equilibrium with 10-35% hydrogen peroxide (preferably 23%) in water.
This application of peracetic acid is highly beneficial and quite unexpected.
While
the use of peracetic acid is commonly used in food and water sanitation to
destroy S-S and S-Fl
bonds during sanitation in contaminating biological materials, its capacity to
destroy sulfur
compounds in refinery waters is completely unexpected. Moreover most chemistry
known to
affect sulfoxy compounds would also degrade or completely disrupt the silver
based chemistry
needed for the water analysis. The fact that the peracetic acid both
effectively rids the refinery
water of sulfoxy compounds while leaving the silver based chemistry unaffected
makes affords it
great utility.
While this invention may he embodied in many different forms, there are shown
in
the drawings and described in detail herein specific preferred embodiments of
the invention. The
present disclosure is an exemplification of the principles of the invention
and is not intended to
limit the invention to the particular embodiments illustrated.
Furthermore, the invention encompasses any possible combination of
some or all of the various embodiments described herein and incorporated
herein.
The above disclosure is intended to be illustrative and not exhaustive. This
description will suggest many variations and alternatives to one of ordinary
skill in this art. All
3 0
CA 2818940 2019-09-18
CA 02818940 2013-05-23
WO 2012/149076 PCT/US2012/035075
these alternatives and variations are intended to be included within the scope
of the claims where
the term "comprising" means "including, but not limited to Those familiar with
the art may
recognize other equivalents to the specific embodiments described herein which
equivalents are
also intended to be encompassed by the claims.
All ranges and parameters disclosed herein are understood to encompass any and
all subranges subsumed therein, and every number between the endpoints. For
example, a stated
range of "1 to 10" should be considered to include any and all subranges
between (and inclusive
of) the minimum value of] and the maximum value of 10; that is, all subranges
beginning with a
minimum value of 1 or more, (e.g. 1 to 6.1), and ending with a maximum value
of 10 or less,
(e.g. 2.3 to 9.4, 3 to 8, 4 to 7), and finally to each number 1, 2, 3, 4, 5,
6, 7, 8, 9, and 10 contained
within the range.
This completes the description of the preferred and alternate embodiments of
the
invention. Those skilled in the art may recognize other equivalents to the
specific embodiment
described herein which equivalents are intended to be encompassed by the:
claims attached hereto.
31