Note: Descriptions are shown in the official language in which they were submitted.
CA 02824543 2013-08-19
DOCKET NO.: NS-461/NS-487
A CENTRIFUGE PROCESS FOR DEWATERING OIL SANDS TAILINGS
FIELD OF THE INVENTION
The present invention relates to a process for dewatering oil sands tailings.
In
particular, tailings are treated with a coagulant and a flocculant and
subjected to centrifugation
to form a suitable cake for disposal and/or further environmental desiccation.
BACKGROLTND OF THE INVENTION
Oil sand generally comprises water-wet sand grains held together by a matrix
of viscous
heavy oil or bitumen. Bitumen is a complex and viscous mixture of large or
heavy hydrocarbon
molecules which contain a significant amount of sulfur, nitrogen and oxygen.
The extraction of
bitumen from sand using hot water processes yields large volumes of fine
tailings composed of
fine silts, clays, residual bitumen and water. Mineral fractions with a
particle diameter less than
44 microns are referred to as "fines." These fines are typically clay mineral
suspensions,
predominantly kaolinite and illite.
The fine tailings suspension is typically 85% water and 15% fine particles by
mass.
Dewatering of fine tailings occurs very slowly. When first discharged in
ponds, the very low
density material is referred to as thin fine tailings. After a few years when
the fine tailings have
reached a solids content of about 30-35%, they are referred to as fluid fine
tailings which
behave as a fluid-like colloidal material. The fact that fluid fine tailings
behave as a fluid and
have very slow consolidation rates significantly limits options to reclaim
tailings ponds. A
challenge facing the industry remains the removal of water from the fluid fine
tailings to
strengthen the deposits so that they can be reclaimed and no longer require
containment.
Accordingly, there is a need for an improved method to treat fine tailings to
reduce their
water content and reclaim the land on which fine tailings are disposed.
WSLega11053707100008 \ 9454821,, 1 1
CA 02824543 2013-08-19
SUMMARY OF THE INVENTION
The current application is directed to a process for dewatering oil sands
tailings by
treating the tailings with coagulant and flocculant prior to dewatering by
centrifugation. The
present invention is particularly useful with, but not limited to, fluid fine
tailings. It was
surprisingly discovered that by conducting the process of the present
invention, one or more of
the following benefits may be realized:
(1)
providing a concentrated flocculant solution may reduce the volume of high
quality flocculant make up water which would normally be required, and
corresponds with
higher throughput;
(2) the
flocculant may be mixed with tailings having a solids content of greater than
30 wt%, th.us minimizing the requirement for tailings dilution;
(3) optimum mixing of the flocculant and tailings may be achieved by
injecting the
flocculant at a point directly before the centrifuge feed tube to avoid
overshearing;
(4) dewatering by centrifugation may produce a centrate having a solids
content of
less than about 3 wt%, and a cake having a solids content of at least about 50
wt% and
capturing greater than 95% of the solids within the initial tailings;
(5) ultrafines separation does not occur with flocculated centrifuge feed.
Surprisingly, the particle size distribution did not differ among the
centrifuge feed, cake and
centrate;
(6) it was surprisingly discovered that the process worked at ambient
temperature;
(7) the optional addition of a coagulant may result in higher throughput
and produce
a significantly stronger, more conveyable cake from the centrifuge; and
(8) the addition of strengthening additives such as quick lime and cement
to the
centrifuge cake improved yield strength of the cake both at zero (0) time and
over time.
Thus, use of the present invention enables reclamation of tailings disposal
areas and
recovers water suitable for recycling in the process.
WS1 40053707 \ 00008 9454821\ I 2
CA 02824543 2013-08-19
In one aspect, a process for dewatering oil sands tailings is provided,
comprising:
= providing a tailings feed having a solids content in the range of about
10 wt% to
about 45 wt%;
= adding a flocculant to the tailings feed and mixing the flocculant and
tailings
feed to form flocs; and
= centrifuging the flocculated feed to produce a centrate having a solids
content of
less than about 3 wt% and a cake having a solids content of at least about 50
wt%.
In one embodiment, a coagulant is added to the tailings feed prior to
centrifugation. In
another embodiment, a coagulant is added to the tailings feed prior to the
addition of the
flocculant.
In one embodiment, the oil sands tailings is fluid fine tailings, which fluid
find tailings
may be optionally diluted with water to provide the tailings feed having a
solids content in the
range of about 10 wt% to about 45 wt%. In another embodiment, the tailings
feed has a solids
content in the range of about 30 wt% to about 45 wt%.
In one embodiment, the flocculant is a water soluble polymer having a moderate
to high
molecular weight and an intrinsic viscosity of at least 3 dl/g (measured in IN
NaC1 at 25 C).
BRIEF DESCRIPTION OF THE DRAWINGS
Referring to the drawings wherein like reference numerals indicate similar
parts
throughout the several views, several aspects of the present invention are
illustrated by way of
example, and not by way of limitation, in detail in the figures, wherein:
FIG. 1 is a schematic of one embodiment of the present invention for treating
oil sands
tailings prior to dewatering by centrifugation.
FIG. 2 is a graph showing the consistency in the solids content (wt%) of the
fluid fine
tailings from the dredge.
FIG. 3 is a graph showing the average mineral particle size distribution of
four samples
of fluid fine tailings.
WSLegd1 \ 053707,00008 9454821 \ I 3
CA 02824543 2013-08-19
FIG. 4 is a graph showing the average 44 micron fraction in the fluid fine
tailings.
FIG. 5 is a graph showing the average 5.5 micron fraction in the fluid fine
tailings.
FIG. 6 is a graph showing the average 1.9 micron fraction in the fluid fine
tailings.
FIG. 7 is a graph showing the relationship between polymer viscosity and
concentration
for the flocculant at 18 C using a simple constant rpm rheometer (Fann model
at 200 rpm).
FIG. 8 is a graph showing the Arrhenius relationship for the 0.2% polymer
solution.
FIG. 9 is a histogram showing a summary of all the nominally 0.2% polymer
tests
indicating that most of the polymer is within 10% of the target concentration.
FIG. 10 is a histogram showing polymer concentrations with intercept corrected
data
bringing the average to 0.2%.
FIG. 11 is a histogram showing a summary of the temperature corrected 0.4%
polymer
concentrations using the slope from the 0.2% Arrhenius data with intercept
corrected for a 0.4%
average concentration.
FIG. 12 is a graph comparing the fines and clay capture to solids capture for
all the
experimental runs.
FIG 13 is a graph showing the results of Coulter particle size analysis for
centrifuge
feed, centrate, and cake samples over the entire testing.
FIG. 14 is a graph showing the relationship between centrate solids and solids
capture
for the three pilot tests.
FIG. 15 is a graph showing centrate solids content as a function of throughput
during the
high capacity test, with the inset showing the rapidly settling centrate.
FIG. 16 is a graph showing the solids capture (%) in a 24 hour low polymer
dosage test.
FIG. 17 illustrates two graphs showing the general trend between polymer
dosage and
clay content for 1.9 micron clay particles (A) and 5.5 micron clay particles
(B).
WSLegal \051707 \00008µ9454821µ1 4
CA 02824543 2013-08-19
FIG. 18 is a bar graph that shows the effects of the addition of several
strengthening
additives at various concentrations.
FIG. 19 is a graph which shows the increase in yield strength over time for
various
strengthening additives.
DETAILED DESCRIPTION OF THE PREFERRED EMBODIMENTS
The detailed description set forth below in connection with the appended
drawings is
intended as a description of various embodiments of the present invention and
is not intended to
represent the only embodiments contemplated by the inventor. The detailed
description
includes specific details for the purpose of providing a comprehensive
understanding of the
present invention. However, it will be apparent to those skilled in the art
that the present
invention may be practiced without these specific details.
The present invention relates generally to a process for treating tailings
derived from oil
sands extraction operations and containing a fines fraction, and dewatering
the tailings to
enable reclamation of tailings disposal areas and to recover water for
recycling. As used herein,
the term "tailings" means tailings derived from oil sands extraction
operations and containing a
fines fraction. The term is meant to include fluid fine tailings (FFT) from
tailings ponds and
fine tailings from ongoing extraction operations (for example, thickener
underflow or froth
treatment tailings) which may bypass a tailings pond. The tailings are treated
with coagulant
and flocculant prior to dewatering by centrifugation to aggregate the solids
and to recover the
water.
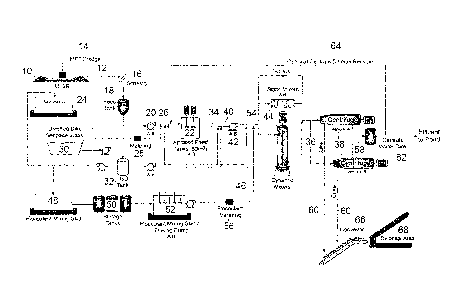
FIG. 1 is a flow diagram of the process of the present invention. In one
embodiment,
the tailings are primarily FFT obtained from tailings ponds. However, it
should be understood
that the fine tailings treated according the process of the present invention
are not necessarily
obtained from a tailings pond and may also be obtained from ongoing oil sands
extraction
operations.
The tailings stream from bitumen extraction is typically transferred to a
tailings pond 10
where the tailings stream separates into an upper water layer, a middle FFT
layer, and a bottom
layer of settled solids. The FFT layer 12 is removed from between the water
layer and solids
layer via a dredge 14 or floating barge having a submersible pump. In one
embodiment, the
WSI,egal \ 053707 \MOOS 9454821v1 5
CA 02824543 2013-08-19
FFT 12 has a solids content ranging from about 10 wt% to about 45 wt%. In
another
embodiment, the FFT 12 has a solids content ranging from about 30 wt% to about
45 wt%. In
one embodiment, the FFT 12 has a solids content ranging from about 37 wt% to
about 40 wt%.
The FFT 12 is preferably undiluted. The FFT is passed through a screen 16 to
remove any
oversized materials. The screened FFT 12 is collected in a vessel such as a
tank 18. In one
embodiment the FFT 12 is then pumped via a pump 20 from the tank 18 into an
agitated feed
tank 22 comprising a tank body and blades. In another embodiment FFT is pumped
to a simple
surge tank., and in yet another embodiment FFT is pumped directly to the
centrifuge.
A coagulant 24 is introduced into the in-line flow of FFT prior to entering
the the
agitated feed tank 22. In one embodiment, coagulant 24 is introduced into the
in-line flow of
FFT prior to entering the centrifuge 38. As used herein, the term "coagulant"
refers to a reagent
which neutralizes repulsive electrical charges surrounding particles to
destabilize suspended
solids and to cause the solids to agglomerate. Suitable coagulants include,
but are not limited
to, gypsum, lime, alum, polyacrylamide, or any combination thereof. In one
embodiment, the
coagulant comprises gypsum or lime. As used herein, the terni "in-line flow"
means a flow
contained within a continuous fluid transportation line such as a pipe or
another fluid transport
structure which preferably has an enclosed tubular construction. Sufficient
coagulant 24 is
added at line 26 to initiate neutralization. The dosage of the coagulant 24 is
controlled by a
metering pump 28. In one embodiment, the dosage of the coagulant 24 ranges
from about 300
grams to about 1,500 grams per tonne of solids in the FFT.
Dilution water 30 is required to disperse the coagulant 24 into the forward
flow of the
FFT 12 and to minimize the risk of total coagulation which would entrap the
solids within the
line 26. The dilution water 30 is introduced into the in-line flow of the FFT
at line 26 prior to
entering the agitated feed tank 22. The source of water 30 is preferably any
low solids content
process affected water. The FFT 12 and diluted coagulant 24 are blended
together within the
agitated feed tank 22, or in the pipeline when no feed tank is used. Agitation
is conducted for a
sufficient duration in order to allow the coagulant 24 to dissociate from the
water 30 and
agglomerate the FFT 12. In one embodiment, the duration is at least about five
minutes.
The agitated FFT 34 is then diluted with water 30. The water 30 is introduced
into the
in-line flow of the agitated FFT 34 prior to entering a mixer 44. As
previously mentioned, the
WSLegal\ 053707 \ 000081945482 I vi 6
CA 02824543 2013-08-19
source of water 30 is preferably any low solids content process affected
water. Sufficient water
30 is added to achieve a centrifuge feed 36 having a solids content preferably
in the range of
about 18 wt% to about 36 wt%, preferably greater than about 30 wt%. Dilution
provides a
consistent feed 36 to the centrifuge 38 to ensure stable machine operation. In
one embodiment,
Additional water 30 and a flocculant 46 are introduced into the in-line flow
of the
diluted FFT 40 at a line 54 prior to entering the mixer 44. As used herein,
the term "flocculant"
refers to a reagent which bridges the neutralized or coagulated particles into
larger
Other useful polymeric flocculants can be made by the polymerization of
(meth)acrylamide, N-vinyl pyrrolidone, N-vinyl formamide, N,N
dimethylacrylamide, N-vinyl
25 ammonium chloride (APTAC) and/or methacrylamido propyltrimethyl ammonium
chloride
(MAPTAC).
In one embodiment, the floeculant 46 comprises an aqueous solution of an
anionic
polyacrylamide. The anionic polyacrylamide preferably has a relatively high
molecular weight
(about 10,000 kD or higher) and medium charge density (about 20-35%
anionicity), for
WSLegal\ 053707 \ 00008,9454821vI 7
CA 02824543 2013-08-19
example, a high molecular weight polyacrylamide-sodium polyacrylate co-
polymer. The
preferred flocculant may be selected according to the FFT composition and
process conditions.
The flocculant 46 is supplied from a flocculant make up system for preparing,
hydrating
and dosing of the flocculant 46. Flocculant make-up systems are well known in
the art, and
typically include a polymer preparation skid 48, one or more storage tanks 50,
and a dosing
pump 52. The dosage of flocculant 46 is controlled by a metering pump 56. In
one
embodiment, the dosage of flocculant 46 ranges from about 400 grams to about
1,500 grams
per tonne of solids in the FFT. In one embodiment, the flocculant is in the
fom of a 0.4%
solution.
The additional water 30 is provided to disperse the flocculant 46 into the
forward flow
of the diluted FFT 40 and to minimize the risk of total flocculation which
would entrap the
solids within the line 54. When the flocculent 46 contacts the diluted FFT 40,
it starts to react
to form flocs formed of multiple chain structures and FFT minerals. The
diluted FFT 40 and
diluted flocculant 46 are further combined within the mixer 44. Since
flocculated material is
shear-sensitive, it must be mixed in a manner so as to avoid overshearing.
Over-shearing is a
condition in which additional energy has been input into the flocculated FFT,
resulting in
release and re-suspension of the fines within the water. Suitable mixers 44
include, but are not
limited to, T mixers, static mixers, dynamic mixers, and continuous-flow
stirred-tank reactors.
Preferably, the mixer 44 is a T mixer positioned before the feed tube (not
shown) of the
centrifuge 38. In one embodiment, diluted flocculant 46 may bypass the mixer
(44) and be fed
directly to the feed line of the centrifuge 38 for addition to the diluted FFT
40.
Flocculation produces a suitable feed 36 which can be dewatered in the
centrifuge 38.
The feed 36 is transferred to the centrifuge 38 =for dewatering. In one
embodiment, the
centrifuge 38 is a solid bowl decanter centrifuge. Solid bowl decanter
centrifuges are capable
of dewatering materials which are too fine for effective dewatering by screen
bowl centrifuges.
Extraction of centrate 58 occurs in the cylindrical part of the bowl, while
dewatering of solids
by compression of the cake 60 takes place in the conical part of the bowl.
Separation of the
centrate 58 and cake 60 using a solid bowl decanter centrifuge may be
optimally achieved using
low beach angle, deep pool depths, high scroll differential speed, and high
bowl speed rpm.
WSLega1\053707 00008 \9454821v1 8
CA 02824543 2013-08-19
In one embodiment, the centrate 58 has a solids content of less than about 3
wt%. The
centrate 58 may be collected into a tank 62 and either discharged back to the
tailings pond 10,
or diverted into a line 64 for recycling for flocculant make-up or feed
dilution.
In one embodiment, the cake 60 has a solids content of at least about 50 wt%.
The cake
60 may be collected and transported via a conveyor 66, pump or transport truck
to a disposal
area 68. At the disposal area 68, the cake 60 is stacked to maximize
dewatering by natural
processes including consolidation, desiccation and freeze thaw via 1 to 2 m
thick annual lifts to
deliver a trafficable surface that can be reclaimed. In another embodiment,
cake can be placed
in deep pits where dewatering includes desiccation and freeze thaw, but
primarily
consolidation. In another embodiment, cake is placed at the bottom of End Pit
Lakes.
Exemplary embodiments of the present invention are described in the following
Example, which is set forth to aid in the understanding of the invention, and
should not be
construed to limit in any way the scope of the invention as defined in the
claims which follow
thereafter.
Example 1
FFT was obtained from an oil sand tailings settling basin using a Royal
Boskalis
Westminster type IHC 1500 cutter suction dredger capable of pumping 1900 m3/hr
of FFT and
obtaining FFT from levels as deep as 11 meters down in the pond. Dredged FFT
was pumped
to the testing site, and screened through a 1/4 x 3/4 inch fixed screen prior
to entering the feed
tank. The FFT supply system was run continuously.
A water supply system was included to provide process affected water and
environmental run-off water from a series of ponds at the base of the dike.
The chemistry of
the water is set out in Table 1.
Table 1
Cation Concentration (ppm) Anion Concentration (ppm) Other
Ca Mg Na Cl SO4 HCO3 CO3 pH Ion Balance
12 4 444 210 77 720 41 8.47 0.98
wsLegam53707\0000s\9454 82 I 9
CA 02824543 2013-08-19
A flocculant make-up skid (SNF Floerger, France) was used to prepare a
flocculant
solution. 750 kg bags of polyacrylamide polymer (SNF Flopam 3338) were made up
to a
mother liquor concentration of 1.5% by weight and diluted to a concentration
of either 0.2% or
0.4% using process affected and environmental run-off water, and stored in a
60 m3 storage
tank until use. In one embodiment, the flocculant is an acrylamide-acrylate
copolymer. In
another embodiment, the flocculant is a high molecular weight (e.g., 14-20
million) acrylamide-
sodium acrylate copolymer, having approximately 25-30% charge density.
A gypsum supply system provided gypsum slurry. Agricultural grade gypsum needs
about 7 minutes to dissolve properly in an FFT slurry. At feed rates in excess
of 100 m3/1-1, the
30 m3 FFT storage tank provided about 20 minutes of residence time for the
gypsum to go into
solution. The gypsum slurry was nominally made up to 2% solids by weight, and
added via a
metering pump to the FFT line.
FFT was pumped from the feed tank to individual agitated feed tanks, with each
tank
provided with a commercially available centrifuge. In this example, an Alfa
Laval Lynx 1000
was used. When used, gypsum was added to the FFT prior to each agitated feed
tank.
Flocculant solution was added to the feed after the agitated feed tanks.
Mixing of the FFT and
diluted flocculant was tested using a simple T mixer, static mixer and a
continuous-flow stirred-
tank reactor. Satisfactory mixing was achieved with the T mixer positioned
directly before the
centrifuge feed tube.
The centrifuges were operated in parallel. The Alfa Laval centrifuge was
provided with
two rotating assemblies, with rotating assembly #2 having shallower beach
angle. The initial
gear box installed on the Alfa Laval centrifuge provided a limited back drive
capability, which
was subsequently improved to allow more back drive capacity.
Following centrifugation, the cake was collected via a conveyor, and
transferred to a
single open ended discharge cell. The production rate of cake was measured
from each
centrifuge using bins on load cells. Cake rates were measured for key test
conditions to
confirm material balances. Centrate from each centrifuge was dropped into
separate collection
tanks, and the final centrate was pumped back to the Mildred Lake Settling
Basin.
WSI ega1\051707 \00008'945482Iv I I
CA 02824543 2013-08-19
Each of the key process lines was equipped to allow sampling. Flow and density
meters
were installed for process control and mass balancing. Magnetic flow meters
(Endress &
Hauser) were used for water applications. Dual-type coriolis meters (Endress &
Hauser) were
used for FFT and high solids slurry applications. The density of FFT at the
dredge and at the
pilot was measured with nuclear density meters (Kay Ray 3680). An on-site
field lab was used
to conduct analyses (Table 3; AR = as required) and to collect sub-samples for
further lab bench
analyses (Table 4).
Table 3
Test Flocculant Gypsum Slurry FFT Centrifuge feed Centrate
Cake
Wt solids-field lab Daily/AR
Rheology Daily/AR AR
AR
Table 4
Test Dilution FFT Centrifuge Centrate Cake
Water feed
OWS composition
(Dean Stark)
Methylene blue
Coulter PSD
XRD AR AR AR AR
Water chemistry AR AR AR AR AR
Microscopy
Cold spin
Solids content was measured using moisture balances (a Mettler-Toledo unit
using an IR
heating element; a CEM unit using a microwave drying technique). Rheology of
polymer
solutions was determined using a Bohlin Visco 88 rheometer or a Fann constant
RPM
viscometer operated at 200 rpm. Centrifuge cake rheology was determined using
a Haake
Viscotester 550.
Oil/water/solids composition was determined using Dean & Stark procedure. Clay
content was determined using XRD (Rigaku D/NAX Rapid-II rotating anode power
diffractometer); methylene blue index; and sedigraph (Micrometrics Sedigraph
III 5120). For
WSLega1\053707`00008 \945482I I I I
CA 02824543 2013-08-19
water chemistry, the pH, bicarbonate and carbonate concentrations were
determined with a PC-
Titrate Alkalinity Autotitrator (Mandel); elemental analysis using a Varian
Simultaneous Vista-
Pro ICP-OES; and anions using a Dionex ICS 3000.
In addition, or, in the alternative, oil/water/solids content was determined
with a Dean
Stark soxhlet extraction technique with hot toluene. Large extractors were
used for the centrate,
and small extractors were used for the FFT, centrifuge feed, and cake. The
particle size
distributions of hydrocarbon free solids were measured with the Coulter
Particle Analysis
technique, using a Coulter LS 13 320 laser diffraction particle analyzer. The
solids were
cleaned using the Dean & Stark technique, and prepared for analysis using
total dispersion
protocols. The pH and conductivity were measured using a Jenway 4330
conductivity and pH
meter. Anion content was determined by ion chromatography using a Dionex-DX
600 series
chromatograph with an Ion-Pac AS4A-SC analytical column. An inductively
coupled argon
plasma atomic emission spectrometer (Varian Vista RL model ICP-AES) was used
to measure
28 individual elements. Carbonate and bicarbonate content were measured using
an alkalinity
titration titrator (Metrohm Titrino Model 751).
i. Comparison of maximum experimental centrifuge rates with and without
gypsum
High throughput tests were performed using the Alfa Laval Lynx 1000 centrifuge
(with
rotating assembly #1 and rotating assembly #2) with and without gypsum (Table
5). A
throughput of 41 dtph was achieved with rotating assembly #1 and a throughput
of 54 dtph was
achieved with rotating assembly #2, when no gypsum was added. Rotating
assembly #1
achieved 67 dtph, and rotating assembly #2 achieved 73 dtph with the addition
of gypsum.
Gypsum addition to the FFT feed significantly improved Alfa Laval Lynx 1000
throughputs by
yielding a significantly stronger, more conveyable cake.
Table 5
Alfa Laval Lynx 1000 Throughput
(dtph)
Test results without gypsum, RA #1 41
Test results without gypsum, RA #2 54
Test results with gypsum, RA #1 67
Test results with gypsum, RA #2 73
WSLega1\053707100008 \945482Iv I 12
CA 02824543 2013-08-19
Characterization of FFT
The solids content of FFT dredged from a particular tailings basin at various
times
during a two and a half month period is shown in Figure 2. As can be seen from
Figure 2, the
dredge consistently delivered FFT at 37-40 wt% solids.
Data for the average mineral particle size distribution of four different FFT
samples are
shown in Figure 3. It has been found that the average mineral particle size
distribution of FFT
is fairly consistent from basin to basin. However, it is understood that
variations in particle size
distribution may occur from basin to basin and over time. Figures 4-6 show the
changes in 44
micron, 5.5 micron, and 1.9 micron particles over about a two month period of
time. The 44
micron portion of the solids content is very consistent, while the 5.5 and 1.9
micron fractions
show more variations.
Tailings behavior may be attributed to clay minerals. Clay size (defined to be
particles
less than 2 microns in size) and clay minerals are strongly correlated.
Methods for following
trends in clay concentration include use of a hydrometer, sedigraph, methylene
blue (MB)
adsorption, laser light scattering methods, and direct quantification of clay
minerals using x-ray
diffraction (XRD). The sedigraph method is similar in principle to the
hydrometer test, where
the density of a clay suspension is monitored over time. As the coarse
particles settle out, the
fluid density decreases. This decrease can be related to the particle size
distribution via stokes
law and information about the fluid viscosity. The methylene blue test
involves adsorption of
the methylene blue dye on the clay surfaces and is best used to quantify
differences in clay
content. The methylene blue test can be conducted on bitumen free solids from
a Dean Stark
separation, or directly on the slurry suspension. XRD is useful in
characterizing the clays as
minerals. Table 6 summarizes particle size data for FFT samples using various
methods for
clay characterization.
WSLega1\053707 \00008\945482 I \ 1 3
CA 02824543 2013-08-19
Table 6
Wet Solids Dean Slurry CPA CPA CPA Sedigraph Sedigraph
XRD
sieve Stark MB
Clay
MB
% % % % % % % % % %
Passing Solids Clay Clay Passing Passing Passing Passing Passing Clay
45 m 44 p.m 5.5 pm 1.9 m 44 p.m 2 pm
91 39.6 64 62 91 49 26 97 53 55
90 38.3 62 64 90 50 28 98 54 62
90 33.6 62 59 95 51 28 96 50 48
92 35.0 63 63 92 51 27 97 52 49
91 40.7 58 55 93 49 26 95 47 48
96 33.4 60 62 94 52 28 96 52 55
93 34.1 61 61 94 51 28 97 52 58
91 40.9 60 56 85 44 24 96 46 53
96 37.2 75 66 94 55 29 99 60 51
97 40.9 78 65 94 57 30 99 60 67
96 37.8 69 68 95 58 30 99 60 53
98 26.4 61 57 91 47 24 98 53 55
96 36.8 71 68 95 57 29 98 58 57
98 27.5 69 61 93 50 26 98 54 53
98 36.7 70 67 96 60 32 99 60 65
98 42.1 74 76 93 53 29 98 57
N/A
100 39.5 76 70 91 52 28 98 59 55
94 40.3 67 69 94 53 29 97 52 62
The consistency in the FFT feed properties over the course of testing does not
allow for
an appreciation of the relationship between the various analytical options
when one considers
that each has an uncertainty of 5% or more, with the exception of X-ray
diffraction where the
uncertainty is 10% or more.
Given the strong correlations among the methods for clay determination, the
CPA 5.5
micron size is preferred. The 1.9 micron size in a laser light scattering
method such as CPA is
more subject to experimental error due to difficulties in consistent sample
dispersion, and lower
signal to noise as the particle size decreases. Figure 3 shows that on
average, the clay content
(using the CPA 1.9 or 5.5 micron) was higher for one set of tests compared to
a second set of
tests. This higher clay content results in higher than average flocculant
consumption. Overall,
the FFT had a 5.5 micron clay content ranging from 45-60%, averaging about
52%. Figure 5
shows that the 5.5 micron clay content increased from 50% to 53% after dredge
relocation.
WSLegah 053707 \ 00008 \ 945482 I vi i 4
CA 02824543 2013-08-19
Flocculant make up and characterization
The polymer preparation unit first adds water and slices the polymer beads to
several
microns to increase the surface area, thereby increasing the hydration rate
for the polymer. This
allows for efficient mixing of the mother liquor to the useable concentration.
At high centrifuge
feed rates, the hydration time for the polymer solution is only about 20 or 30
minutes.
Inadequate polymer hydration means increased dosage requirements. Although
there was no
indication of this in the testing, hydration time needs to be maximized with
other more viscous
or less soluble polymers. The storage tank was a conventional oil field tank,
with polymer
solution level maintained at about 40 m3 with stirring. Aside from polymer
concentration,
polymer effectiveness is affected by the degree of hydration, or the extent to
which the polymer
has uncoiled in solution. Both factors are related to viscosity which was used
to monitor
consistency in the polymer solution. A calibration of polymer viscosity as a
function of
solution concentration is shown in Figure 7 for SNF Flopam 3338. The polymer
viscosity
follows the Arrhenius equation given by:
_= Acca/RF
( 1 )
where îi is viscosity, A is a form factor, Ea is the activation energy for
polymer uncoiling, R is
the gas constant, and T is temperature (degrees Kelvin). Using this
approximation, variations in
the polymer concentration can be estimated. Using the polymer and viscosity
data, Figure 8
shows the plot of In (viscosity) versus 1/T (degrees Kelvin) for the 0.2%
polymer solution.
This relationship can then be used to determine a corrected viscosity by
referring to the
viscosity and concentration relationship established in Figure 7.
Polymer concentrations of 0.2 and 0.4% were tested. Figure 9 shows the
histogram of
polymer concentrations developed using the An-henius equation. 88% of the data
points are
within 10% of the target 0.2% polymer, and only 17% are more concentrated than
0.2%. The
average polymer concentration is 0.19 + 0.03. This analysis is very sensitive
to changes in
slope or intercept. When the intercept is changed to bring the average polymer
concentration to
exactly 0.2% (a change in intercept from only 13.12 to 13.04), the histogram
does not change
significantly (Figure 10). Figure 11 shows the histogram for the 0.4% polymer,
using the same
slope (activation energy) as determined from the 0.2% polymer data, but a
slope fitted to a
WSLegal\ 051707 00008 9454821N.] 15
CA 02824543 2013-08-19
0.4% polymer concentration. The histogram shows 0.4% 0.06 polymer. The
increased in
variability for the 0.4% polymer might be due to difficulties in maintaining
proper mixing or
hydration at this higher polymer concentration. However, the viscosity method
is useful due to
variations in suspended solids in the polymer make-up water, and the dilution
water having
almost 1500 ppm dissolved salts (0.15%).
iv. Polymer hydration
Polymer hydration is the degree to which the polymer molecules have uncoiled
or
effectively gone into solution. Viscosity changes over time may be used to
evaluate polymer
hydration. Prior to use, the polymer was stored in tanks with stirring which
may have helped
hydrate the polymer or break up the polymer strands in solution, resulting in
viscosity changes.
To ensure proper polymer hydration, a sample was taken from the polymer
solution in the
storage tank and the viscosity determined. Gentle or aggressive stirring for
several minutes
showed no change in polymer viscosity, confirming that the polymer was
completely hydrated.
During testing, the polymer make up was not keeping pace with demand, and
testing
commenced using 0.4% rather than 0.2% polymer solution. The move to more
concentrated
polymer solutions corresponded with the maximum centrifuge throughputs. At
high
throughputs, about 20 m3/h of the 0.4% flocculant solution was required. This
increase in
concentration had the effect of increasing the hydration time in the storage
tank.
v. Fines Capture
A fines capture target of 95% is considered to be a minimum performance
requirement
to limit re-handling. Fines capture is largely determined by the loss of
solids in the centrate. In
the field, solids content determinations (e.g., bitumen, total dissolved
solids, particle size
distribution) may help guide performance. Understanding the particle size
distributions in a
centrifuge operation is important because of the possibility of separating
ultra fines from the
FFT. These would generally be the particles less than 1 micron in size and if
they are
concentrated in the centrate, there is a potential for them to create tailings
handling issues far in
excess of their mass fraction. This is not an issue with flocculated FFT. The
operating criteria
for the field solids capture was set at 97%. Solids capture was the primary
metric used to
determine centrifuge performance in the field as determined by the following
equation where X
is weight percent and p is density:
WSLega1\051707T0008 \9454821µ1 16
CA 02824543 2013-08-19
X ' PA,/ Xcernw =
Peak.-
X Capful " (2)
-Ica}, = Pc-like Xrenn ate P corn are X.feed P Sled
Figure 12 shows all of the field data for solids capture compared to the fines
capture
(from the laboratory analysis of PSD), and to a clay capture determined from
the average clay
content of the various samples. There is a relatively low sand content in the
FFT feed since the
total solids capture and the fines capture are almost directly correlated.
Similarly, at the target
fines capture region > 95%, the clay capture is also essentially the same as
the solids capture,
indicating that there is no segregation of the ultrafine solids to the
centrate stream. Figure 13
shows that ultrafines separation does not occur with flocculated centrifuge
feed, by showing a
comparison of the size particle distributions for the feed, cake and centrate.
Within
experimental uncertainties, these three streams have similar particle size
distributions.
Centrate quality (suspended solids wt%) tends to define the solids or fines
capture.
Figure 14 compares centrate solids to solids capture for three separate pilot
programs over four
years. As testing progressed, fewer test runs lead to off specification or
less than 95% capture,
and as throughput increases (i.e., successively larger capacity machines were
tested), higher
solids in the centrate will still result in acceptable overall fines or solids
capture.
vi. Centrate quality
Centrate can be recycled and used to control centrifuge feed density via a
dilution
circuit, and may be used for polymer make up. Since polymer make up requires
slicing the
polymer beads into a high surface area, any solids contamination in the
preparation water could
have a deleterious effect on equipment reliability. FFT or FFT dilution,
however, does not
require high quality water. Figure 14 indicates that the majority of the
centrate samples
contained less than 1% solids which was within an acceptable range for recycle
water in the
pond and centrifuge feed dilution.
vii, Centrate settling and high flow rate testing
The nominal capacity of a centrifuge depends upon the settling or separation
behavior
of the feed. In FFT applications, the efficiency of the separation depends
upon how efficiently
WSLegah05370740008µ.945482 I. I 1 7
CA 02824543 2013-08-19
the polymer contacts the suspension solids. The optimum polymer injection
point was found to
be as close to the centrifuge as possible, implying that the polymer mixing is
sensitive to
overshear conditions which might occur when polymer is injected prior to flow
meters and
piping bends. If polymer mixing is occurring exclusively in the centrifuge,
there may be high
flow rates that overmix the polymer and FFT. It has been previously
demonstrated that
centrifuge throughput is limited by lack of scroll or back drive capacity.
There might be a flow
rate where overmixing prevents efficient separation, even with back drive
capacity.
High flow rate runs were conducted to assess if overmixing might make
increased back
drive capacity of little or no benefit. Figure 15 shows this increasing flow
rate experiment and
the subsequent centrate solids at those flow rates. As the flow rate or tonnes
of solids
throughput increases, the centrate quality decreases. Even at the highest flow
rates, no unusual
vibrations, bearing heating, or fluid leakages were noted. Table 10 shows the
24 hour settling
behavior of the centrates collected during this high volume test. Overshear or
overmixing of
the polymer and FFT mixture was observed at the very highest throughput of 270
m3/h or 98
dtph, since after 24 h of settling, a significant proportion of the centrate
solids remained in
suspension. At the lower rates, the centrifuge feed is well flocculated and
settles rapidly, but
simply not efficiently removed from the centrifuge. This indicates that with
properly mixed
centrifuge feed, the consequences of some off specification centrifuge
performance will be
minimal. These results also confirm that increased back drive capacity can
provide significant
improvement in centrifuge throughput.
Table 7
Throughput Total Flow Centrate Solids % Solids in
supernatant after
(dry tonnes per hour) (m3/h) (%) 24 h of centrate
settling
55 160 0.51 On spec
66 190 2.03 0.28
72 210 5.89 0.36
79 228 8.17 0.25
85 245 13.34 0.37
90 258 13.28 0.23
98 271 15.83 2.10
WSLegal'053707,00008 945482 I l 1 8
CA 02824543 2013-08-19
viii. Cake quality
Cake properties are a function of the solids content and water chemistry. The
importance of gypsum addition in improving conveyability of the cake from the
centrifuge is
generally reflected in the strength of the cake product. There is a definite
relationship between
gypsum addition and centrifuge cake strength. The field laboratory used a
Haake viscometer to
measure cake yield point. Table 11 summarizes the effect of gypsum with an
average of the
gypsum and non-gypsum data. For the same average solids content, the gypsum
cake is
considerably stronger.
Table 8
Gypsum Dose Cake Yield Solids
(g/tonne) (Pa) (wt%)
0 1095 51.1
1791 1289 51.1
ix. Polymer dose, clay content, and centrifuge performance
Testing was conducted to assess flocculant dosages. Figure 16 shows low
flocculant
testing, all with on specification fines capture, and the relationship between
throughput and
flocculant dosage. During the initial part of the test, the average dosage was
962 g/tonne at 50
dtph. In the latter stages, polymer consumption was 848 g/tonne at 36 tph
throughput. These
results indicate that mixing was probably more optimum, possibly because the
polymer
injection could be located close to the centrifuge, eliminating feed tube
problems. Coupled
with the average higher clay content, polymer dosage is likely close to an
optimum. At higher
throughputs, polymer dosage is higher for various reasons. High gypsum dosages
increases
polymer requirements. At higher than predicted throughputs, the polymer
effectiveness may
also have been reduced due to lower residence times in the hydration tank.
Higher than
expected tonnage throughput might also require the higher cake strength which
is associated
with higher polymer dosage. It is important to note, however, that there was
no explicit effort
to demonstrate lowest possible flocculant dosage at the highest tonnages.
Figure 17 shows the relationship between changes in clay content (both 1.9 and
5.5
micron) and polymer dosage. Higher clay content requires an increase in
polymer dosage.
With further mixing optimization and low polymer dose testing, the increase in
flocculant
dosage with increased clay content is less obvious towards the end of the test
program.
WSLegaIN 053707 \ 00008 \ 945482 ii 19
CA 02824543 2013-08-19
Example 2
In one embodiment, the centrifuge cake is further treated with an additive to
give
additional strength to the cake. Examples of additives useful in the present
invention include
Portland cement, fly ash, gypsum, quick lime, hydrated lime, and even inert
solids such as sand
or coke. Further examples include guar gum, xanthan gum, calcium chloride and
clays such as
kaolin and bentonite. With the addition of strengthening additives, the
initial strength of
centrifuge cake can increase from around 1 kPa to about 5 to 20 kPa or higher.
This increase in
strength allows for once through tailings handling and allows for aggressive
capping and
reclamation strategies to be implemented.
In one experiment, centrifuge cake was allowed to be mixed with a variety of
strengthening additives and the yield strength (kPa) at time zero (0) was
determined by means
known in the art. The weight percent solids (% solids) of each mixture was
also determined.
Any mixing means known in the art can be used; however, it was found to be
particularly
effective to pass the centrifuge cake and strengthening additive through at
least one double roll
crusher or the like to ensure thorough mixing. Non-mixed cake, no additive,
and mixed cake,
no additive, served as controls to show that mixing alone is not responsible
for the increases in
yield strength (kPa) observed. Figure 18 is a bar graph that shows the effects
of the addition of
several strengthening additives at various concentrations. It can be seen from
Figure 18 that
quick lime at lower concentrations than cement (i.e., 1%, 2%, 5% quick lime
versus 25% and
100% cement) resulted in the greatest increase in yield strength at time zero
(0).
Figure 19 shows the increase in yield strength over time for the additives 25%
hydrated
lime (--A--); 2% quick lime ( ); 1% cement ( __ x¨); 5% cement (¨A
_________ ); and 25%
cement (¨+¨). It can be seen from Figure 19 that mixing, no additive, (¨*¨)
did not appear
to affect yield strength (kPa) over time when compared to non-mixed, no
additive (¨E¨),
However, the addition of strengthening additives improved compaction (yield
strength) over
time in all instances.
The scope of the claims should not be limited by the preferred embodiments set
forth in
the examples, but should be given the broadest interpretation consistent with
the description as
a whole.
WSLegal\ 053707 \ 00008 \945482 l vl 20