Note: Descriptions are shown in the official language in which they were submitted.
CA 02832328 2013-10-03
WO 2012/152747
PCT/EP2012/058356
-1-
SPECTRAL IMAGING FOR MEASUREMENT OF NUCLEAR
PATHOLOGY FEATURES IN CANCER CELLS PREPARED FOR IN SITU
ANALYSIS
FIELD OF THE INVENTION
In general, the disclosed technology relates to identification of cancer
subtypes.
More specifically, the disclosed technology relates to methods for determining
molecular drivers of cancer and/or progression using a multivariate image data
and
statistical analysis of in-situ molecular markers and morphological
characteristics
in the same cells of a tissue sample of a cancer. This analysis takes place
after a
single acquisition that obtains the molecular and anatomic morphology data in
parallel. The analysis compares specific morphological and molecular markers
to
known samples exhibiting particular genetic drivers of the cancer. This method
provides statistical information that allows for an increased confidence in
the
identification of specific molecular drivers of the cancer.
BACKGROUND OF THE INVENTION
Pathological prognostic assays are used to provide information to help guide
and
develop treatment regimes and predict outcomes for a myriad of cancer types.
Early detection and accurate determination of the molecular basis of a cancer
is a
key feature in treating cancer patients. For many cancers, this requires
multiple
separate preparations of tissue samples from the patient to determine
different
morphological and molecular factors.
Typically, cancer samples are pathologically examined by fixing the cells onto
microscopic slides and staining them using a variety of staining methods
(e.g.,
morphological or cytogenetic stains). Stained specimens are then evaluated for
the
presence or absence of abnormal or cancerous cells and cell morphologies.
Although providing only general information, histological staining methods are
the
most common methods currently practiced for the detection of cancerous cells
in
biological samples. Other staining methods often used for cancer detection
include
immunohistochemistry and activity stains. These methods are based on the
presence or absence of specific antigens or enzymatic activities in cancerous
cells.
Other methods of detecting cancerous cells utilize the presence of chromosomal
aberrations in cancer cells. In particular, the deletion or multiplication of
copies of
whole chromosomes or chromosomal segments, and higher levels of amplifications
CA 02832328 2013-10-03
WO 2012/152747
PCT/EP2012/058356
-2-
of specific regions of the genome are common occurrences in cancer.
Chromosomal aberrations are often detected using cytogenetic methods such as
Giemsa-stained chromosomes (G-banding) or fluorescent in situ hybridization
(FISH).
Typically, biological samples stained by any of the aforementioned methods are
manually evaluated by either a laboratory technician or a pathologist.
Microscopic
slides are viewed under low magnification to locate candidate areas and those
areas
are viewed under higher magnification to evaluate the presence of cancerous
cells.
Further, current methods usually require a single staining method at a time,
and if
more than one staining method is performed, it is usually not on the same
exact
cells. This adds to the chance of either false negative results associated
with
cytological staining methods or false positive results associated with
immunogenic
or activity-based staining methods. The inability to directly associate
objective
measures of morphology with particular genetic rearrangements when separate
slides are used has limited usefulness of combining such measurements in a
meaningful way.
In men, prostate cancer is the most prevalent form of cancer for all races.
While
each year over 300,000 men are diagnosed with prostate cancer in the U.S.
alone,
the currently available tests are notoriously inaccurate and subjective. As a
result
many incidences of prostate cancer are undiagnosed until the disease has
progressed to late stages, including metastases. Both the incidence of
prostate
cancer and its associated mortality have been increasing over the past ten
years.
The clinically evident disease represents only the tip of the iceberg in that
nearly 30
percent of all men over age 50 harbor a silent microscopic form of latent
prostate
cancer. Early detection methods currently in use are increasing the
identification of
this latent form of cancer, which now represents more than 11 million cases
within
the male in the United States. Growth rate studies indicate that these tumors
appear
to grow very slowly and that the great majority should remain clinically
silent. It is
estimated that about 50-65% of prostate cancer is localized, 9-17% has spread
to an
area near the prostate, and 20-25% has metastasized to other parts of the
body.
The screening for prostate cancer is primarily by PSA (a blood test for
Prostate
Specific Antigen) and DRE (Digital Rectal Exam) testing. Confirmation of
cancer
is made by examination of tissue samples derived from needle biopsies. These
methodologies cannot differentiate between benign disease and cancer. The
failure
to differentiate can result, for example, in exposure of patients with benign
disease
CA 02832328 2013-10-03
WO 2012/152747
PCT/EP2012/058356
-3-
to treatments that are unnecessary and have side effects (e.g., impotence and
incontinence). At present, factors to be considered in assessing cancer
progression
are estimates. Tumor volume, pre- and post-operative histological grading of
cancer and high grade intraepithelial neoplasia, clinical and pathological
tumor
staging, and serum PSA may be employed to predict the biological
aggressiveness
of prostate cancer. Unfortunately, these techniques generally have only
marginal
predictive value. Moreover, it is estimated that PSA testing misses 20%-30% of
all
individuals with cancer. Accordingly, there is a clear need for diagnostics
with
better sensitivity and specificity.
It is well accepted that the epigenetic and genetic transformation of a normal
prostatic cell to a cancer cell with progression to a metastatic phenotype
requires
multiple steps. The development of methods to identify these changes in order
to
better select therapies and to predict tumor aggressiveness has been the
subject of
much work in prostate cancer. In spite of the progress made in evaluating the
progression of prostate cancer, it is evident that improvements are needed in
the
accuracy of such determinations.
Thus, there is a widely recognized need for, and it would be highly
advantageous to
have, a method of analyzing cancer and cancer-associated morphologies that can
analyze multiple-variables in single cells of a biological sample within a
single
acquisition, providing a higher confidence level for identification of
specific
mechanisms that drive the prognosis of cancer, and providing more information
to
the health care professionals in the designing and selecting of treatment
protocols.
BRIEF SUMMARY OF THE INVENTION
The presently disclosed technology provides improved methods for increased
specificity in analyzing the molecular mechanisms of a cancer in tissue. Thus,
in
certain embodiments, the technology relates to a multivariate cancer
diagnostic
method wherein said method determines the presence of both molecular markers
and phenotypic morphometric markers at the cellular level in a single cell or
single
sample containing a population of cells from a tissue, said method comprising:
a. obtaining molecular marker data from a single sample from a subject
comprising a single cell or population of cells from a tissue;
b.
obtaining quantitative cell morphology data from the same single cell or
population of cells as used in step (a) to provide a multivariable analysis
CA 02832328 2013-10-03
WO 2012/152747
PCT/EP2012/058356
-4-
of said single sample, the multivariable data set comprising both
quantitative cell morphology data from step (b) and molecular marker
data from step (a); and
c. comparing the multivariable analysis data set obtained in step (b) with
a
reference multivariable analysis data set created by obtaining both
molecular marker data and quantitative cell morphology data from
cancer and non-cancer cell samples taken from individuals with known
clinical outcome.
The comparison results of step (c) provide a prediction of a clinical outcome
from
the subject defined by specific combinations of features and markers
statistically
associated with cancer progression, occurrence, metastases or other feature of
clinical outcome seen in the reference multivariable analysis data set.
In such diagnostic methods, the molecular marker may be a genetic
rearrangement.
For example, such a genetic rearrangement may be in an ETS gene rearrangement,
including the ERG gene.
In the disclosed methods, the morphological measures may include nuclear size,
shape and DNA content.
A preferred application of the diagnostic method is in a cancer cell that is a
prostate
cancer cell.
The technology also contemplates a method of identifying specific genetic
rearrangements or molecular marker patterns in a test sample containing a
single
cell or a population of cells from a cancerous tissue comprising:
a. obtaining statistical relevance of measurable phenotypic features and
molecular markers derived through regression analysis of multiple
morphological and molecular marker variables from a single sample
belonging to a population of cancer cells from cohorts of known
molecular outcomes of cancer to create a reference library showing
phenotypic and molecular markers associated with a clinical outcome;
b. correlating specific morphometric phenotypes with specific genetic
rearrangements or molecular marker patterns from said library;
CA 02832328 2013-10-03
WO 2012/152747
PCT/EP2012/058356
-5-
c. performing in-situ molecular analysis on a test sample containing a
single cell or a population of cells from a cancerous tissue and
simultaneously or concurrently measuring morphometric features on the
same test sample to determine both the morphology and molecular
markers of the sample;
d. comparing the combined in-situ molecular and morphometric data
obtained from the test sample of step (c) with the library in step (b) and
identifying specific genetic rearrangements or molecular marker patterns
in said single cell or population of cells from the test sample of
cancerous tissue.
The cancerous tissue may be a solid tissue or a fluidic tissue such as a
hematologic
tissue. In the methods disclosed herein, the cancer cells may be cancer cells
that are
associated with a cancer selected from the group consisting of leukemia,
lymphoma, brain cancer, cerebrospinal cancer, bladder cancer, prostate cancer,
breast cancer, cervix cancer, uterus cancer, ovarian cancer, kidney cancer,
esophagus cancer, lung cancer, colon cancer, pancreatic cancer, and melanoma.
In the disclosed methods, the morphological contrast may be derived from use
of
fluorescent stain (e.g. DAPI, quantum dots), optical properties of the tissue
(e.g.
transmitted dark-field illumination), reflecting or scattering markers (e.g.
colloidal
gold, silver stain), or light-absorbing contrast agents (e.g. hematoxylin,
DAB).
The in-situ molecular marker contrast used herein may be derived from use of
fluorescent stain (e.g. DAPI, quantum dots), optical properties of the tissue
(e.g.
transmitted dark-field illumination), reflecting or scattering markers (e.g.
colloidal
gold), or light-absorbing contrast agents (e.g. hematoxylin, DAB, fast red,
fast
blue, silver stain).
In other aspects, the in-situ molecular marker is an immunoprobe, DNA probe,
RNA probe, lectin, aptamer, protein ligand or enzyme cofactor.
In a specific embodiment, the multivariate assay is performed on a cancer cell
that
is a prostate cancer cell, in which the in-situ molecular analysis is used to
determine the presence of an ETS, including ERG, gene-rearrangement, and the
morphological stain is a DAPI stain. More specifically, the ERG rearrangement
is
an insertion into the ERG gene, or deletion of the 5' region of ERG, and the
morphological metric is an irregular roundness of the nuclei.
CA 02832328 2013-10-03
WO 2012/152747
PCT/EP2012/058356
-6-
The present technology also relates to methods of early identification of pre-
cancer
or cancer-associated cells likely to have a specific genetic rearrangement
comprising:
a. obtaining a library of in-situ molecular markers and morphometric
measurements performed on a population of cells from pre-cancer
cohorts of known genetic rearrangements associated with a cancer
outcome;
b. correlating morphometric phenotypes with a specific genetic
rearrangement from said library to generate library data;
c. performing in-situ molecular analysis on a test cell sample containing a
single cell or a population of cells and measuring anatomic features on
the same sample to determine the morphology of the test cell sample;
and
d. comparing the combined in-situ molecular and morphometric data
obtained from the test cell sample of step (c) with the library data in step
(b) and providing increased statistical confidence of identification of the
test cell sample as a cancer or pre-cancer cell sample.
The pre-cancer or cancer associated cells may be associated with a cancer
selected
from the group consisting of leukemia, lymphoma, brain cancer, cerebrospinal
cancer, bladder cancer, prostate cancer, breast cancer, cervix cancer, uterus
cancer,
ovarian cancer, kidney cancer, esophagus cancer, lung cancer, colon cancer,
pancreatic cancer, and melanoma.
In such methods again, the morphological contrast may be derived from use of
fluorescent stain (e.g. DAPI, quantum dots), optical properties of the tissue
(e.g.
transmitted dark-field illumination), reflecting or scattering markers (e.g.
colloidal
gold, silver stain), or light-absorbing contrast agents (e.g. hematoxylin,
DAB) 14.
The in-situ molecular marker contrast may be derived from use of fluorescent
stain
(e.g. DAPI, quantum dots), optical properties of the tissue (e.g. transmitted
dark-
field illumination), reflecting or scattering markers (e.g. colloidal gold),
or light-
absorbing contrast agents (e.g. hematoxylin, DAB, fast red, fast blue, silver
stain).
The in-situ molecular marker may be an immunoprobe, DNA probe, RNA probe,
lectin, aptamer, protein ligand or enzyme cofactor.
CA 02832328 2013-10-03
WO 2012/152747
PCT/EP2012/058356
-7-
In a specific method, the pre-cancer or cancer-associated cell is a prostate
cell, the
in-situ molecular analysis is used to determine the presence of an
ERG-rearrangement, and the morphological stain is a DAPI stain. More
particularly, the ERG rearrangement is an insertion into the ERG gene, or
deletion
of the 5' region of the ERG gene, and the morphological metric is an irregular
roundness of cellular nuclei.
In another embodiment, the pre-cancer or cancer-associated cell is a prostate
cancer
cell, FISH analysis is used to determine the presence of an ERG-rearrangement,
and the morphological stain is a DAPI stain. The ERG rearrangement may be an
insertion into the ERG gene, or deletion of the 5' region of the ERG gene, and
said
morphometric change is an irregular roundness of the cellular nuclei.
Also described is a method of identifying the presence of a molecular marker
predictive of a clinical outcome in a cancer subject having the steps of:
a. preparing a reference library of genetic rearrangements associated with
a
specific cancer outcome from samples obtained from a plurality of
subjects having a known cancer and clinical outcome associated with
said cancer;
b. preparing a reference library of morphological changes associated with a
specific cancer outcome from samples obtained from a plurality of
subjects having a known cancer and clinical outcome associated with
said cancer;
c. combining the genetic rearrangement library with the morphological
library to obtain a library in which morphological changes in the cancer
cells are correlated or otherwise linked with specific genetic
rearrangements in individual cancer types and clinical outcomes;
d. obtaining quantitative cell morphology data from a test sample
containing a single cell or population of cells obtained from a test
subject suspected of having cancer;
e. comparing the quantitative cell morphology data from obtained from the
test subject with the combined genetic rearrangement and morphological
library of step c) to identify the specific genetic rearrangement present in
the test subject. More specifically, the method may be characterized in
CA 02832328 2013-10-03
WO 2012/152747
PCT/EP2012/058356
-8-
that the presence of a combination of morphological features and genetic
rearrangements provides identification of a specific clinical outcome in
the subject.
In such a method, the method may further comprise confirming the presence of
the
genetic rearrangement by in situ detection of a molecular marker.
BRIEF DESCRIPTION OF SEVERAL VIEWS OF THE DRAWINGS
Figure 1: Depicts the method of the present technology where raw
data is
acquired through quantitative spectral imaging is de-composited
on the basis of wavelength signal distribution from nuclear stain
and probe detection.
Figure 2: Depicts an example field view.
Figure 3: Depicts a scatter plot of the mean area plotted against
the
coefficient of variance (CV) expressed as a percent of the mean
value.
Figure 4: Depicts a scatter plot of mean roundness plotted against the
coefficient of variance (CV) expressed as a percent of the mean
roundness value.
Figure 5: Depicts a scatter plot of mean area (abscissa) plotted
against the
mean roundness value (ordinate).
Figure 6: Depicts a scatter plot of mean area (abscissa) plotted against
the
CV area (ordinate). ERG rearrangement negative cancer cores are
plotted in blue (diamonds), the ERG translocation only positive
cores are magenta (squares), the ERG translocation + deletion
positive cores are green (triangles).
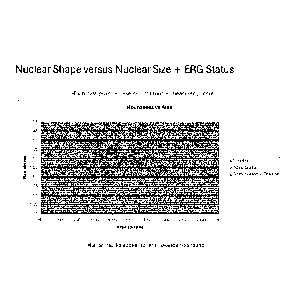
Figure 7: Depicts a scatter plot of mean roundness (abscissa) plotted
against the CV roundness (ordinate). ERG rearrangement
negative cancer cores are plotted in blue (diamonds), the ERG
translocation only positive cores are magenta (squares), the ERG
translocation + deletion positive cores are green (triangles).
Figure 8: Depicts a scatter plot of mean area (abscissa) plotted against
the
mean roundness (ordinate). ERG rearrangement negative cancer
cores are plotted in blue (diamonds), the ERG translocation only
positive cores are magenta (squares), the ERG translocation +
deletion positive cores are green (triangles).
CA 02832328 2013-10-03
WO 2012/152747
PCT/EP2012/058356
-9-
Figure 9:
Depicts a graph of the frequency of cancer nuclei with a given
total integrated intensity (DAPI) taken from 1 field per core.
Figure 10: Depicts a graph of the statistical significance and
regression
analysis for nuclear size and Gleason score.
Figure 11: Depicts a
graph of the statistical significance and regression
analysis for nuclear shape (roundness) and ERG rearrangements.
DETAILED DESCRIPTION OF THE INVENTION
The present technology provides a quantitative image analysis of biological
samples using a novel single acquisition of multivariate information on
molecular
and morphologic data on single cancer cells analyzed in combination to provide
improved specificity and sensitivity to determine underlying mechanisms
driving a
cancer. Preferably, the cells are from a tissue sample. This new multivariate
tissue
data can help to stratify risk and aid treatment decisions in cases that are
otherwise
difficult to categorize based on conventional pathology grading of H&E stained
biopsies alone.
The present technology provides information for determining pathological
prognosis states of cancer by using fluorescent labeling of molecular markers
in
conjunction with specialized imaging approaches involving spectrally-resolved
detection and data pre-processing. The present technology provides an imaging
approach that can acquire and analyze nuclear morphology on tissue that is
prepared for detection of molecule-specific probes on tissue within a single
data
acquisition cycle. This imaging approach employs a combination of labeling,
acquisition, pre-processing and analysis technologies. A multidimensional
image is
collected and analyzed to separate and distinguish different analyte channels
of
interest by emission wavelength. The subsequent analyte channels represent
different aspects of the data that quantify the morphology and genetic
rearrangement, genetic expression and/or protein expression of the cell.
In one embodiment of the present technology, data collection and analysis of
the
combination of morphological and genetic rearrangement information from single
cancer cells is analyzed to provide a higher confidence level on the
identification of
underlying drivers of the cancer based on pathological study, than can be
achieved
by any single part of the information taken alone. The data collected is
compared to
features in populations of cells previously analyzed to provide a reference
for the
specific cancer type to determine contributing mechanisms to cancer sub-type.
In
CA 02832328 2013-10-03
WO 2012/152747
PCT/EP2012/058356
-10-
the present technology, the reference population distribution of markers and
features can be created by correlating or otherwise linking the data from the
morphological and in-situ molecular information obtained by the method of the
present technology on samples which have a known cancer genotype and outcome.
Thus, cancer sub-type identities and associated likelihood of outcome for a
specific
type of cancer is derived with statistical confidence intervals from the
measured
morphological and specific molecular-genetic rearrangement data. The data
obtained from an unknown cancer sample can then be compared to data from
known molecular sub-types from the cancer tissue library to provide an
improved
identification of molecular sub-type and prediction of outcome for the unknown
cancer sample.
It is envisioned that the present technology may be used for the prognosis of
different cancer types, including, but not limited to, prostate cancer,
leukemia,
brain cancer, cerebrospinal cancer, bladder cancer, breast cancer, cervix
cancer,
uterus cancer, ovarian cancer, kidney cancer, esophagus cancer, lung cancer,
colon
cancer, melanoma, neuroblastoma, and pancreatic cancer. In one preferred
embodiment of the present technology, the methods are used provide improved
identification of molecular sub-type of prostate cancer.
Morphological characteristics of the cancer cell of the present technology
include
measurement and statistical analysis of a variety of nuclear features,
including,
size, morphology, intranuclear chromatin distribution ("chromatin texture"),
inter-
nuclear variability of amount of chromatin labeling (DNA or chromatin
content),
presence of macronucleoli, and overall tissue growth patterns as evidenced by
nuclear distribution. Nuclear morphological characteristics are imaged using a
fluorescent DNA staining technique, for example DAPI (4',6-diamidino-2-
phenylindole, a fluorescent stain that binds strongly to A-T rich regions in
DNA).
Examples of other fluorescent DNA stains include propidium iodide (PI) and
ethidium bromide which can be viewed under a fluorescence microscope using a
fluorescence illumination modality. Light absorbing morphological stains such
as a
May-Grunwald-Giemsa stain, a Giemsa stain, a Papanicolau stain or a
Hematoxylin-Eosin stain also can be visualized via light microscopy.
Constitutive
optical properties of the prepared tissue, such as refractive index, can also
be
leveraged to enhance and/or identify nuclear boundary shape.
CA 02832328 2013-10-03
WO 2012/152747
PCT/EP2012/058356
-11-
Genetic rearrangement in accordance with the present technology can be
measured
by in situ hybridization. In situ hybridization is a useful method of
detecting major
and/or minor chromosomal aberrations. In this method, labeled nucleic acid
probes
are denatured and applied on fixed and denatured cells. Cells in either the
metaphase or interphase stages of cell cycle allow the probes to hybridize to
specific sequences within the genome of the cells. Examples of in situ
hybridization include, but are not limited to, fluorescent in situ
hybridization
(FISH), chromogenic in situ hybridization (CISH); radiolabeled in situ
hybridization, digoxigenein labeled in situ hybridization and biotinylated in
situ
hybridization. Numerous nucleic acid labeling techniques are known in the art.
For
example, a fluorescent dye can be covalently attached to either the 5' or 3'
end of a
nucleic acid probe. Following hybridization, the labeled probe can be directly
visualized using fluorescent microscope and dark field modality. FISH may be
conducted using manual and automated methods which are known to one skilled in
the art. In a particular embodiment for the prognosis of prostate cancer,
labeled
nucleic acids to detect ERG rearrangements can be used in FISH.
Herein, the term "molecular mechanism" refers to the characterization of the
cancer
cells based on a number of parameters that are used to determine the
underlying
molecular changes of cancer and relevant therapeutic options. The
multifactorial
nature of phenotypic change and tissue sampling leaves a level of confidence,
in
which the present technology provides higher level of confidence in
identifying the
underlying molecular mechanisms of a cancer using the methods outlined herein
than any method used alone.
In a preferred embodiment, the present technology provides a method of further
determining the underlying molecular changes of a prostate cancer sample by
performing a single acquisition multivariate image data collection and
analysis on
individual prostate cancer cells of the sample. This multivariate analysis
includes
performing FISH staining to detect ERG rearrangement and also morphological
analysis using DAPI staining on the same cell. The results of both ERG
rearrangement and morphological analysis are gathered from a single image
acquisition of cells of the prostate cancer tissue sample and analyzed by
comparing
the results from each cell in the population of cancer-specific cells sampled
by the
image to results that have been gathered and compiled into library of
reference
cancer cell populations with known molecular changes and corresponding
measurable morphological changes. The prostate cancer cell library is composed
of
data collected from prostate cancer tissue samples with known genetic
CA 02832328 2013-10-03
WO 2012/152747
PCT/EP2012/058356
-12-
rearrangements. This embodiment and the development of the prostate cancer
cell
library is described further in the examples as detailed below.
As described in the examples, both high-quality morphometric and photometric
data representing basic nuclear morphology and relative nuclear chromatin
content
as revealed by DAPI staining on tissue sections prepared for fluorescence in-
situ
hybridization (FISH) was achieved. FISH analysis is used to determine the
rearrangement of a particular gene (ERG) implicated in early events driving
prostate cancer, and this data along with the nuclear size, the nuclear shape,
and the
relative chromatin content of nuclei measured combined can be used to compare
to
a library of known prostate cancer ERG status and morphology grade.
For example, the library specific to prostate cancer cell ERG insertion
rearrangement was created by collecting the basic features of nuclear size
(area),
nuclear shape (roundness), and amount of stain contained in a nucleus
(integrated
intensity) from cancer nuclei selected from 150 distinct tissue cores
representing a
retrospective cohort on a tissue. Further to the basic measurements, the
Coefficient
of Variance (CV) was calculated for the size and shape features on a per-core
basis,
permitting easier comparison of the relationship between variability of
nuclear size
in a core and variability of nuclear shape in the same cores. The CV also
permits
investigation of the relationship between average nuclear size and shape and
the
correlation to dispersion of these values within a core. On average, 4 fields
of view
were sampled to cover each tissue core, and each tissue core represents an
individual cancer foci. Several thousand nuclei representing different stages
of
pathological grade have been measured and assessed to produce this library
data.
Libraries specific to other cancers may be analyzed in a similar manner as
described for prostate cancer herein.
The present technology uses a standardized implementation of fluorescence
spectral imaging for image acquisition for measuring nuclear pathology and in-
situ
molecular probes. Fluorescence imaging provides significant advantages over
brightfield imaging in terms of linearity, contrast, and dynamic range. This
nuclear
imaging approach is designed to produce very high quality standardized image
data
under non-immersion conditions (preferably at 32x magnification, although high-
resolution dry imaging may be performed at a variety of optical
magnifications).
Spatial resolution, dynamic range and signal: noise provided to the raw data
are
highly controlled through the use of well-characterized optics train, sensor
technology and illumination technology. Factors that impact data (illumination
CA 02832328 2013-10-03
WO 2012/152747
PCT/EP2012/058356
-13-
level, magnification, numerical aperture, sensor pixel size, camera exposure
etc.)
are carefully matched and standardized to maximize performance for application
requirements. Because the system noise parameters are qualified and
calibrated,
statistical significance of brightness levels can be assured. Spatial
resolution limits
in X, Y, and Z planes are well understood and optimized to produce high
quality
data.
In some embodiments, an anatomic Gleason grade and other important clinical
variables can be combined with this data on nuclear morphology and correlated
to
patient outcome in further analysis in order to reveal the most significant
predictive
factors.
Gleason grade is a scoring pattern for prostate cancer that is known in the
art.
Briefly, pathologists assign a grade to the most common tumor pattern, and a
second grade to the next most common tumor pattern. The two grades are added
together to generate a Gleason Score. The Gleason Grade is also known as the
Gleason Pattern, and the Gleason Score is also known as the Gleason Sum. The
Gleason Grade or Gleason Pattern ranges from 1 to 5, with 5 having the worst
prognosis.
The present technology provides a novel application of imaging technologies to
quantitate multiple variables from tissue sections prepared for multi-analyte
in-situ
fluorescence. Multiple data points include the rearrangement of a particular
gene
(such as ERG) implicated in early events driving prostate cancer, the nuclear
size,
the nuclear shape, and the relative chromatin content of nuclei measured in a
single
acquired image.
The present technology uses carefully optimized quantitative spectral imaging
equipment and processing to provide high-quality morphological information
that
can be measured objectively and reliably in software. Suitable imaging
equipment
and software are described in the examples below. Nuclear size (area) and
nuclear
shape (roundness) metrics are interrogated from a well characterized tissue
micro-
array (TMA). The present technology demonstrates that high values for nuclear
size correlate with a higher likelihood of belonging to a cancer of higher
morphological Gleason grade in prostate cancer.
The present technology provides a novel ability to objectively measure
morphology
and correlate the morphology to molecular rearrangement in the same tissue
section
to provide enhanced sensitivity and specificity of determining the insertion
CA 02832328 2013-10-03
WO 2012/152747
PCT/EP2012/058356
-14-
condition, as demonstrated by the statistically relevant association of ERG
insertion
rearrangement and greater irregularity of nuclear shape (lower roundness) as
demonstrated in the examples below.
The present technology's quantitative spectral imaging approach and nuclear
morphometric analysis provides quantitative information about the relative
integrated intensity for segmented features. This information may be used in a
unique way, for example, to measure relative chromatin content on formalin-
fixed,
paraffin embedded tissue prepared through automated FISH procedures. Such an
approach is envisioned to be further used to ascertain rapidly dividing cells
or
anomalous ploidy conditions in samples prepared for multiplexed analyte
analysis.
One skilled in the art will recognize that modifications may be made in the
present
technology without deviating from the spirit or scope of the invention. The
invention is further illustrated by the following examples, which are not to
be
construed as limiting the invention in spirit or scope to the specific
procedures or
compositions described therein.
Examples
Correlative value to nuclear morphology and ERG rearrangement for
prostate cancer cells
Quantitative technologies have been advanced and applied in this study to
permit
extraction of morphometric data from tissue prepared for fluorescent in-situ
molecular analysis of multiplexed probes. A highly characterized spectral
imaging
approach is used to produce high resolution (wavelength resolution, spatial
resolution and intensity resolution) data (Figure 1). Figure 1 depicts the
steps of the
present technology where raw data acquired through quantitative spectral
imaging
is de-composited on the basis of wavelength signal distribution from the
nuclear
stain and probe detection. This produces a quantifiable image representing the
true
relative distribution of label on the tissue section. The signal to noise
ratio of such
images is very high, in part due to the ability to separate the true signal
from
contaminating signals constitutive to the tissue.
These data are subsequently processed to deliver measurements of nuclear
features
in prostate cancer tissue sections. The data produced through the use of
spectral
imaging is de-composited on the basis of wavelength signal distribution from
the
nuclear stain and probe detection; this produces a quantifiable image
representing
CA 02832328 2013-10-03
WO 2012/152747
PCT/EP2012/058356
-15-
the true relative distribution of label on the tissue section. The signal to
noise ratio
of such images is very high, in part due to the ability to separate the true
signal
from contaminating signals constitutive to the tissue.
Nuclear morphology and relative nuclear chromatin content was assessed by DAPI
staining on tissue sections prepared for fluorescence in-situ hybridization
(FISH).
The basic features of nuclear size (area), nuclear shape (roundness), and
amount of
stain contained in a nucleus (integrated intensity) have been extracted from
cancer
nuclei selected from 150 distinct tissue cores representing a retrospective
cohort on
a tissue array (CTMA 17.1). Further to the basic measurements, the Coefficient
of
Variance (CV) was calculated for the size and shape features on a per-core
basis,
this permits easier comparison of the relationship between variability of
nuclear
size in a core and variability of nuclear shape in the same cores; the CV also
permits investigation of the relationship between average nuclear size and
shape
and the correlation to dispersion of these values within a core. On average, 4
fields
of view were sampled to cover each tissue core, and each tissue core
represents an
individual cancer foci. Several thousand nuclei representing different stages
of
pathological grade have been measured to produce this data.
The samples have been prepared in an automated manner optimized for
multiplexed molecular interrogation with quantum dot detection technology and
DAPI nuclear counterstain. Spectral data were taken from CTMA 17.1 using a
Zeiss AxioImager.M2 stand (Zeiss MicroImaging, Thornwood, NY) configured
with 20X N.A 0.85 plan-apochromatically corrected objective used in series
with a
1.6X apo-chromatically corrected tube lens to produce a total magnification of
32X
with a depth of field of 1.8 microns. This total magnification has been
previously
determined to produce optical diffraction limited image data (-0.4 micron
image
resolution) when convolved with the 6.5 micron pixel dimensions of the CCD
image sensor incorporated into the system. A long pass interference filter
with
409-nm cut-off (Omega, Brattleboro, VT) was used to separate the visible
signal
from the fluorescence excitation. A closed-loop stabilized near-UV light
source
(Exfo (now Lumen Dynamics) Exacte, Ontario, CA) calibrated to deliver 110 mW
integrated fluence (370-nm +/- 20-nm) at the sample plane through the 20X
objective was used for DAPI excitation. To enable a record of extra-nuclear
tissue
structure and contextual information, a transmitted light filtered to 710-nm
+/-10-
nm and calibrated to 1.27-mw integrated fluence at the sample plane was used
to
capture contextual data in the same spectral acquisition.
CA 02832328 2013-10-03
WO 2012/152747
PCT/EP2012/058356
-16-
This imaging strategy utilizes a stabilized light source capable of repeating
illumination at the sample plane with less than 1% variation in absolute
illumination level; the illumination level can also be adjusted in a linear
manner at
1% increments. Most commonly, the illumination range for quantum dot detection
is restricted to the near UV range. The combination of a calibrated
quantitative
light source (closed-loop metal halide) and calibrated quantitative detection
system
(CCD-based spectral detection) ensures that variability in brightness levels
can be
traced to originate in the sample and reflect the true stain distribution.
Relative
stain variations can be measured with high repeatability. Thus it is now
possible to
analyze variability in nuclear and chromatin staining intensities between
nuclei and
draw conclusions that may be useful for determining relative chromatin content
in
nuclei.
Spectral data was acquired using a Sagnac interferometer in an imaging
spectrometer configuration (Malik, Z., et al., J. Microsc. 182 (1996) 133-
140); the
interferometer acquisition settings were configured to deliver 5-nm to 7-nm
spectral resolution across the visible wavelength range (400-nm to 800-nm) in
a
rapidly acquired series of exposures. Spectral data containing intensities for
all the
visible wavelengths at each pixel were deconvolved into specific wavelength
channels representing the pure DAPI contribution and the context contribution
(700-nm to 720-nm) to the overall signal through linear unmixing (Garini, Y.,
et
al., Cytometry Part A. 69A (2006) 735-747). Linear unmixing was performed
using
normalized reference spectra for DAPI and the near-IR illumination components.
Reference spectra were acquired using identical instrumentation under
standardized
conditions to negate influence of optical wavelength dependent response. This
approach permits ideal signal to noise ratios and responsible quantitation of
the
relative signal contributions of each spectral component. Thus, the relative
DAPI
content of individual cancer nuclei in a field of view can be accurately
measured
along with the spatial features; this helps to control for the possibility of
partial
nuclei due to histological sectioning and may provide additional information.
On average, four fields of view were required to cover each core. Fields were
interactively adjusted to maximize the capture of glandular nuclei. Damaged
cores,
non-cancerous, and uninformative fields were excluded from analysis. The peak
image intensities within a field of view were normalized to come within 3/4 of
the
upper limit of the dynamic range of the image sensor (16,000 e- well capacity)
by
adjusting the exposure time.
CA 02832328 2013-10-03
WO 2012/152747
PCT/EP2012/058356
-17-
Images representing the individual spectral components were obtained from
spectral acquisition software as 16-bit monochrome data. The image analysis
software (Image Pro Analyzer 7.0, Media Cybernetics, Bethesda, MD) was
spatially calibrated to the 32X acquisition magnification to permit expression
of
measurements in units of microns. A Fourier high-pass filter was applied to
each
image as a pre-processing step in order to enhance the edge transitions of the
nuclei
(Russ, J.C., The Image Processing Handbook, New York: CRC Press LLC (2002)).
The nuclear features in the image were then thresholded on the basis of
intensity
range. A watershed split operation was performed on each image in order to
separate objects in close proximity to one other.
Non-glandular nuclei, non-cancer nuclei and irrelevant structures were
manually
deleted from each field of view such that only cancerous, glandular nuclei
remained (Figure 2). This deletion process was guided by a principle
pathologist.
Figure 2 shows an example of the field of view. The image on the left
represents
the tissue morphology on the acquired field as rendered using nuclear and
tissue
context spectral components. The image on the right represents the DAPI
component and segmented nuclear features after irrelevant or poorly segmented
nuclei have been manually de-selected.
Thus, relevant nuclear shape parameters were measured objectively by software,
with expert medical guidance to ensure minimal noise in the data from
irrelevant
cells and extraneous structures. After irrelevant nuclei were de-selected, the
nuclear
outlines were saved as separate files and area, roundness, and integrated
intensity
measurements for each cancer nucleus were exported to Microsoft Excel
(Microsoft, Redmond, WA). The area was reported in pixels, with 0.2
microns/pixel. Roundness was calculated using
perimeter2
pi
the formula: 4 x area, where a perfect circle will have a roundness of 1, and
increasing deviation from roundness will have a value of greater than 1. The
integrated intensity is a sum of all the pixel values contained in a nucleus,
each
pixel may have a value that ranges between 0 and 65,536 (16-bit scale).The
integrated intensity is an indirect measure of the chromatin content remaining
after
tissue processing; the relative chromatin content is reliably reported by the
DAPI
intercalating stain (Coleman, A.W., et al., J. Histochem. Cytochem. 29 (1981)
959-
968).
CA 02832328 2013-10-03
WO 2012/152747
PCT/EP2012/058356
-18-
The CTMA17-1 data was saved in a directory containing a single folder for each
core that was analyzed. Within each folder there are the DAPI and tissue
anatomic
context image files (16-bit monochrome *.tif format) for each field of view
from
that particular core. The folder also contains the saved outline files for
each DAPI
imaged that was analyzed (ImagePro proprietary format). In addition, the
numerical
data was exported to a Microsoft Excel spreadsheet that contains the count
data for
that core as it was exported from Image Pro Analyzer 7.0 (Media Cybernetics,
Bethesda, MD).
A Microsoft Excel file in the main CTMA 17.1 directory was used to summarize
the raw measurement data for further analysis. The file spreadsheet contains
all the
data from each core (each core has its own labeled worksheet) as well as a
summary worksheet which contains mean values and coefficients of variance for
area and roundness for each core as well as graphs displaying their
relationships to
one another. The main folder contains another Microsoft Excel sheet entitled
"Histogram Data" which contains a histogram created from the normalized
integrated DAPI intensities. For this histogram, one field per cancerous core
was
taken.
Preliminary results were summarized and then subjected to further statistical
and
regression analysis. The aim of the statistical analysis for this study was to
quantitatively assess morphometric and photometric features of cancer nuclei
in the
context of tumor progression. To accomplish this, the variables for nuclear
size
(area), nuclear shape (roundness), and relative chromatin content (normalized
intensity) were analyzed against the endpoints of Gleason grade, ERG
rearrangement status, and tumor vs. benign cells.
To evaluate the possibility of distribution differences in nuclear shape or
size or
chromatin content with respect to ERG rearrangement status, the Wilcoxon
Raffl(
Sum Test was used to test the null hypothesis that there is no difference
between
the types of rearrangements (normal, rearrangement through insertion,
rearrangement through deletion) and their roundness, size, or chromatin
content. In
situations where a statistically significant difference is detected in a
rearrangement
group, logistic regression analysis was performed.
To evaluate the possibility of distribution differences in nuclear shape or
size or
chromatin content with respect to Gleason score greater than 6 (as compared to
Gleason score less than 6) status, the Wilcoxon Rank Sum Test was used to test
the
CA 02832328 2013-10-03
WO 2012/152747
PCT/EP2012/058356
-19-
null hypothesis that there is no difference between Gleason >6 and Gleason = <
6
and the roundness, size, or chromatin content. In situations where a
statistically
significant difference is detected between Gleason groups, logistic regression
analysis was performed.
Preliminary size and shape results are summarized below and in the figures;
prior
to statistical analysis, the values representing size and shape were plotted
for
individual cores with color coding for normal vs. cancer nuclei, and for ERG
rearrangement status within cancer nuclei (Figure 3, Figure 4, Figure 5). Each
data
point represents the value for several fields gathered from a microarray core.
Cancer cores are plotted in blue (diamonds), the normal cores are magenta
(squares).
A histogram of integrated DAPI content, normalized to the integrated intensity
of
the brightest nuclei was created to provide a measure of the relative
chromatin
content remaining in nuclei imaged from sectioned and processed tissues
(Figure 9). The values are normalized for each field of view such that the
nuclei in
the field with the highest integrated intensity are assigned a value of 1.
Nuclei with
half as much integrated intensity would be expected to have a value of 0.5.
The
most frequent values would be expected to represent nuclei with 2 sets of
chromosomes (2N), as would be expected for interphase cells, and the brightest
values would represent nuclei with more than 2 sets of chromosomes, as would
be
expected in polyploidy or dividing cells. There is a distribution of
integrated
intensity values consistent with this model, this provides some evidence to
control
for the possibility that nuclei have been sectioned through at different
levels.
The further statistical testing and regression analysis of these preliminary
data
reveal significant differences in nuclear size for anatomic Gleason scores
higher
than 6 (e.g. Gleason 3+4) (Figure 10). The results indicate that larger nuclei
are
more likely to be associated with a Gleason grade higher than 6.
The statistical analysis also reveals significant differences in the case of
ERG
rearranged cancer nuclei as compared to normal ERG cancer nuclei. There is
furthermore a statistically relevant association between less roundness and
the
insertional ERG rearrangement (Figure 11). The results indicate that
irregularly
shaped nuclei are more likely to be associated with ERG rearrangements, and
ERG
insertion only events in particular.
CA 02832328 2013-10-03
WO 2012/152747
PCT/EP2012/058356
-20-
The present technology is now described in such full, clear and concise terms
as to
enable a person skilled in the art to which it pertains, to practice the same.
It is to
be understood that the foregoing describes preferred embodiments of the
present
technology and that modifications may be made therein without departing from
the
spirit or scope of the disclosed technology as set forth in the appended
claims.
Further, the examples are provided to not be exhaustive but illustrative of
several
embodiments that fall within the scope of the claims.