Note: Descriptions are shown in the official language in which they were submitted.
CA 02834808 2013-10-31
WO 2012/162804 PCT/CA2012/000516
METHOD FOR CONTROLLING FLUID INTERFACE LEVEL
IN GRAVITY DRAINAGE OIL RECOVERY PROCESSES
FIELD OF THE DISCLOSURE
The present disclosure relates to methods for improving recovery of
hydrocarbons
from subterranean formations. More specifically, the disclosure relates to a
method of
controlling the fluid interface level above a horizontal producer well to
effect the inflow of
oil-bearing production fluids from the reservoir and to avoid breakthrough of
gases into the
producer well.
BACKGROUND
Gravity drainage processes are used for extracting highly viscous oil ("heavy
oil")
from subterranean formations or bitumen from oil sand formations. For purposes
of this
patent specification, the general term "oil" will be used with reference to
liquid petroleum
substances recovered from subterranean formations, and is to be understood as
including
conventional crude oil, heavy oil, or bitumen, as the context may allow or
require.
For heavy oil or bitumen to drain from a subterranean formation by gravity,
its
viscosity must first be reduced. The Steam-Assisted Gravity Drainage (SAGD)
process uses
steam to increase the temperature of the oil and thus reduce its viscosity.
Other known
gravity drainage processes use solvents or heat from in-situ combustion to
reduce oil
viscosity.
SAGD uses pairs of horizontal wells arranged such that one of the horizontal
wells,
called the producer, is located vertically below a second well, called an
injector. The vertical
distance between the injector and producer wells is typically 5 meters (5 m).
The horizontal
section of a SAGD well is typically 700 m to 1500 m long. For SAGD projects in
the
Athabasca oil sands in Alberta, Canada, the depth of the horizontal section is
typically
between 100 m and 500 m from the surface. Bitumen recovery from the oil sands
is
accomplished by injecting steam into the injector wellbore. Steam is injected
from the
- 1 -
CA 02834808 2013-10-31
WO 2012/162804 PCT/CA2012/000516
injector wellbore into the hydrocarbon-bearing formation, typically through
slots or other
types of orifices in the injector wellbore liner. The steam permeates the
formation within a
region of the formation adjacent to the injector well; this steam-permeated
region is referred
to as a steam chamber. As steam is continuously injected into the formation,
it migrates to the
edges of the steam chamber and condenses at the interface between the steam
chamber and
the adjacent region of the bitumen-bearing formation. As the steam condenses,
it transfers
energy to the bitumen, increasing its temperature and thus decreasing its
viscosity, ultimately
to the stage where the bitumen becomes flowable, whereupon the mobile bitumen
and
condensed water flow down the edges of the steam chamber, accumulating as a
"liquid
inventory" in a lower region of the steam chamber and flowing into the
producer wellbore.
The fluid mixture of flowable bitumen and water that enters the producer well
is then
produced to the surface.
A significant challenge encountered by operators of SAGD well pairs is
controlling
the inflow distribution of oil and water over the horizontal length of the
producer well, or the
outflow distribution of steam, solvents, or combustion gases from the
horizontal injector
well. In many cases, inflow distributions or steam outflow distributions are
biased towards
one part of the well ¨ for example, the region near the heel of the well
(i.e., where the
horizontal producer well transitions to a vertical well to the surface) or the
region near the toe
of the well. This results in less favourable well economics due to ineffective
use of injection
fluid (i.e., steam), poor bitumen recovery rates, and low recovery factors
(i.e., when parts of
the reservoir are not produced). The inflow/outflow biasing is influenced by
the reservoir
geology, which is largely outside the control of the well operator.
Another important factor influencing inflow and outflow distributions is the
sand face
pressure distribution along the length of the injector or producer well
resulting from wellbore
hydraulics. In this context, "sand face" refers to the point where flow
emerges from the sand
pack. In oil sands, the sand packs around the liner and flow emerges from the
point where the
sand is retained by the liner and flows into the gaps of the sand screen. The
well operator has
some control over this factor by means of the well completion design. For a
typical injector
well injecting steam into the formation through a slotted liner, wellbore
steam pressures are
- 2 -
CA 02834808 2013-10-31
WO 2012/162804 PCT/CA2012/000516
highest near the heel and decrease towards the toe due to fluid friction
pressure losses in the
axial direction of the wellbore. Where wellbore pressures are higher at the
heel, greater
outflows of steam, solvent, or other injected gas are present. To equalize or
create
preferential outflow distributions, Dall'Acqua et al. have proposed (in
International
Application No. PCT/CA2008/000135) an injector completion with a tubing string
run inside
a liner, whereby the tubing string has ports located along its length that are
sized and
positioned to create a uniform or preferential sand face pressure distribution
over the length
of the injector well. The pressure distribution could be customized to achieve
preferential
outflow distributions into reservoirs with varying mobility (due to varying
formation
permeability, for example).
The experience of SAGD well operators in Alberta has shown that the
performance of
gravity drainage wells is affected by both injector and producer completion
designs. In some
cases, the producer completion has been shown to have a more significant
effect on well
performance. A method of controlling inflow distributions over the length of a
long
horizontal producer well is needed. Producer well design requires
consideration of additional
complexities that are not factors for injector well design. The fluid
interface level relative to
the producer needs to be managed carefully to both maximize production rates
and to protect
the producer well from breakthrough of injection gases. Breakthrough of steam
into the
producer will damage the well and/or related facilities, and breakthrough of
other injection
gases (e.g., light hydrocarbons such as propane and butane) reduces the
efficiency of their
function to mobilize bitumen.
The fluid interface (i.e., the interface between the liquid inventory and the
overlying
steam chamber) is characterized by a density contrast between the injection
fluid (typically
steam) and the produced oil and water. For purposes of this patent
specification, the fluid
interface level will be alternatively referred to as the "liquid level". It is
preferred to let the
liquid level sit a short distance above the producer well to act as a seal
preventing steam from
entering the producer well. If steam is allowed to enter the producer, the
steam is not being
used for heating bitumen and the process becomes less efficient. Steam
entering the producer
-3 -
CA 02834808 2013-10-31
WO 2012/162804 PCT/CA2012/000516
well can also carry sand particles at high speeds and cause erosion of the
steel liners and
tubing strings in the wellbore.
To evaluate the economics of an oil recovery project, an estimate of the
recovery rate
is required. For conventional oil wells, an inflow performance relationship
(IPR) is used to
predict the oil recovery rate for the reservoir pressure and bottom hole
pressure conditions
expected. In this sense, conventional oil production is driven by pressure not
gravity.
Therefore, IPRs as used for conventional oil wells cannot be applied to
gravity drainage
projects, so a gravity drainage inflow performance relationship (GIPR) is
needed to estimate
the economics of the process.
"Thermal Recovery of Oil and Bitumen" (R. Butler, 1997, 3rd edition, printed
by
GravDrain Inc., ISBN 0-9682563-0-9) presents formulas for predicting SAGD
recovery rates
for a given liquid head, or difference in height between the top of the steam
chamber and the
producer well. The calculation is based on a two-dimensional cross-section of
the well and
reservoir. Two other factors will affect SAGD production rates that are not
covered in these
calculations. Firstly, Butler's calculation assumes that the liquid level
contacts the top of the
producer well. In actuality, it is typical for liquid levels to sit above the
producer wellbore
forming a liquid "trap" that the producer wellbore is submersed in. As bitumen
and water
flow through the liquid trap to the producer well, pressure loss will occur.
Many SAGD
operators have observed significant pressure losses in this region, with
resultant reduction in
actual production rates relative to predicted rates. While exact causes for
these pressure
losses are not fully known, they are sometime attributed to two-phase flow
(relative
permeability) effects, plugging of slotted liners, fines migration, or other
causes.
Another important consideration for predicting SAGD production rates is that
wellbore pressures and temperatures vary along the length of a long horizontal
well. This will
cause liquid levels, and thus the depth of the liquid trap, to also vary along
the length of the
well, which in turn will affect the total production rate from the well. Near-
wellbore reservoir
heterogeneities (i.e., permeability variations close to the wellbore) will
also contribute to
inflow variations along the length of the well.
- 4 -
CA 02834808 2013-10-31
WO 2012/162804 PCT/CA2012/000516
BRIEF SUMMARY OF THE DISCLOSURE
The present disclosure teaches methods for predicting or characterizing an
inflow
relationship that relates the vertical position of the liquid level to the
position of a producer
well. This inflow relationship is applied to producer completion design to
select wellbore
tubular and flow control equipment that will influence the pressure profile
along the length of
the producer well, which will affect liquid levels. The inflow relationship
considers a number
of parameters to arrive at a liquid level prediction; these parameters include
injection
pressure and temperature, pressures in the producer wellbore, subcool (i.e.,
cooling of liquid
below its saturation temperature) at the heel of the producer, and the
vertical temperature
gradient (i.e., due to heat loss rate to the underburden, or formation below
the production
zone). These parameters can be measured directly or indirectly by temperature
and pressure
sensors placed in the injector and producer wellbores.
The permeability of a heavy oil or oil sands reservoir is non-uniform, or
"heterogeneous". Areas with high permeability will tend to allow steam and oil
to flow more
easily through them; thus these areas are more likely to be depleted sooner
than areas with
low permeability. Commonly used producer completion strategies provide little
restriction to
inflow from high permeability areas, so it is likely that reservoirs will be
depleted non-
uniformly over the length of the well. This could lead to ineffective
placement or distribution
of steam during the life of the well, which would reduce the overall
efficiency of the process.
The ideal case is for the reservoir to be depleted uniformly.
The present disclosure teaches methods facilitating the design or selection of
means
to limit liquid inflow into the producer well from high permeability areas and
to control flow
from areas with different permeabilities based on liquid level to match
reservoir delivery rate.
For example, methods in accordance with the disclosure can be used:
= To determine the liquid level required in areas of different permeabilities
so that they
will produce uniformly;
- 5 -
CA 02834808 2013-10-31
WO 2012/162804 PCT/CA2012/000516
= To determine the fluid level required to match production to different
reservoir
delivery rates in a homogeneous reservoir;
= To compare the production distribution for a measured fluid level
distribution (for
example, by temperature monitoring or logs) with the reservoir delivery
distribution
to determine the transient behaviour of the fluid level; and/or
= To determine the transient production distribution based on changes in
the
temperature distribution.
According to one embodiment of methods in accordance with the present
disclosure,
wellbore flows can be designed to match reservoir delivery. Using this method
to determine
production rate provides a basis for confirming the completion design and
adjusting the
design to maintain the production distribution. In this way, growth of the
steam chamber can
be promoted to be uniform. Alternatively, custom growth patterns can be
promoted to
accommodate specific geological settings for optimal recovery. Depleting the
reservoir
uniformly will promote uniform steam chamber growth. This is particularly
beneficial for
wells with water or gas caps that "rob" steam from the steam chamber rather
than allowing
the steam to be used as intended (i.e., for heating bitumen at the edge of the
steam chamber).
Liquid level is a function of a number of parameters including injector
pressure,
formation heat loss rate, production rate, permeability, and producer wellbore
pressure.
Injector pressures are set by the well operator to be higher than the original
reservoir pressure
to allow for steam to enter the pore spaces within the formation. Injection
pressures are
limited by the fracture pressure of the formation, which is a function of well
depth and
overburden geology. Higher injection pressures allow for higher steam chamber
temperatures. The pressure acting down on the liquid at the liquid-steam
interface is expected
and presumed to be close to the injector wellbore pressure.
Formation heat loss rates are governed by the heat conductivity of the
underburden
geology below the producer well. For a reservoir with bottom water below the
producer well,
heat losses may be higher and therefore the vertical temperature gradients
will be higher.
- 6 -
CA 02834808 2013-10-31
WO 2012/162804 PCT/CA2012/000516
Producer wellbore pressure and production rates are linked. As production
rates are
increased, wellbore pressures will decrease. Pressure losses of oil and water
will occur as
they travel downwards through the liquid trap. Pressure losses are associated
with flow
through porous media, typically calculated in accordance with Darcy's Law.
Additional
pressure losses in the liquid trap can occur due to flow convergence from the
liquid trap into
the openings on the horizontal liner of the producer, from plugging of
openings in the
horizontal liner, fines migration, relative permeability effects, or other
causes.
The rates at which these temperatures and pressures decrease are generally
outside the
control of the well designer. However, the well designer can control the
wellbore pressures
through design of the producer well completion. For example, a conventional
producer
completion may use 88.9 mm tubing landed at the toe of the well. If this
tubing diameter is
increased to 139.7 mm, then pressure losses through the tubing will be lower.
Wells are often
controlled to a subcool at the heel of the well, which is typically between 5
C to 20 C.
Subcool at the sand face will be higher as pressure loss through the tubing
results in higher
pressures at the sand face. For a well with 88.9 mm tubing higher tubing
pressure losses will
occur, which will result in higher liquid levels. By contrast, a wellbore with
139.7 mm tubing
will have less pressure loss and therefore a lower subcool at the sand face.
The preceding example demonstrates the effect of wellbore pressure on sand
face
subcool and consequently on liquid level. The same principles can be applied
to more
complicated wellbores with flow control devices mounted on the tubing string
or on the liner.
The sizing and positioning of flow control devices in the wellbore will affect
the direction
and magnitude of flow at different points in the wellbore, thus affecting the
wellbore
pressures.
To maximize production, liquid levels can be designed to be as close to the
producer
wellbore as possible without causing steam breakthrough. Lower liquid levels
will provide
greater head pressure in the steam chamber to drive gravity drainage to the
sump (liquid
inventory).
- 7 -
CA 02834808 2013-10-31
WO 2012/162804 PCT/CA2012/000516
An iterative method can be applied to predict the liquid level height for an
expected
pressure and temperature gradient through the liquid zone and a known
production rate and
injector-producer pressure differential. This calculation can be applied over
the well length to
determine a liquid level distribution for different completion scenarios.
Producer wellbore
completions can be optimized to raise liquid levels in areas where production
needs to be
restricted, and completions can be designed to lower liquid levels in areas
where production
needs to be increased.
Gravity IPR
The Gravity IPR (Inflow Performance Relationship) relates the pressure
difference
between the steam chamber and the production wellbore to the flow rate into
the production
wellbore. Developing or characterizing the Gravity IPR involves using
temperature
measurements from the field to define an analysis boundary encompassing the
production
wellbore and part of the liquid inventory (i.e., sump or steam trap)
surrounding the wellbore.
The relationship between pressure difference and inflow rate is then
determined using
numerical or analytical methods. The Gravity IPR has several unique features
when
compared to a conventional IPR:
= By using temperature measurements to define the analysis boundary, the
Gravity IPR
couples the drainage radius to the temperature of the fluid entering the
wellbore
(inflow temperature) such that a higher inflow temperature corresponds to a
smaller
drainage radius, and a lower inflow temperature corresponds to a larger
drainage
radius.
= The Gravity IPR accounts for the viscosity gradient in the liquid
inventory
surrounding the wellbore, providing a better approximation of the flow
resistance in
the near-wellbore region.
= The Gravity IPR accounts for the effect of gravity, allowing a stable range
of inflow
temperatures to be identified, within which the liquid inventory will move
towards an
equilibrium state where the inflow rate matches the rate at which liquid is
delivered to
the inventory (delivery rate).
- 8 -
CA 02834808 2013-10-31
WO 2012/162804 PCT/CA2012/000516
Accordingly, in one aspect the present disclosure teaches a method for
characterizing
an inflow performance relationship relating the vertical position of the
liquid level of a liquid
inventory in a steam chamber in a petroleum-bearing formation relative to a
horizontal
producer well disposed within the formation, comprising the steps of:
= measuring temperatures within the steam chamber;
= measure the vertical temperature gradient in the liquid inventory;
= defining the temperature drawdown as the difference between the steam
chamber
temperature and the temperature of liquids flowing into the producer well;
= defining an analysis boundary in a plane perpendicular to the producer
well, such that
the analysis boundary encompasses the producer wellbore and contacts the fluid
interface between the liquid inventory and the overlying steam chamber;
= mapping the measured steam chamber temperature and vertical temperature
gradient
onto the area enclosed by the analysis boundary;
= defining the pressure drawdown as the difference between the steam
chamber
pressure and the wellbore pressure; and
= determining the relationship between the pressure drawdown and the flow
rate into
wellbore, using known numerical or analytical methods.
In one embodiment of the method, the temperature at the fluid interface is
assumed to
equal the steam chamber temperature, and the temperatures at locations within
the analysis
boundary are calculated from the vertical temperature gradient and the
distance below the
fluid interface.
In another embodiment, the pressure at the fluid interface is assumed to equal
the
steam chamber pressure, and the sum of the pressure head and the elevation
head is assumed
to be constant along the analysis boundary.
In a further embodiment, the steam chamber pressure is assumed to equal the
saturation pressure corresponding to the measured steam chamber temperature.
- 9 -
CA 02834808 2013-10-31
WO 2012/162804 PCT/CA2012/000516
The analysis boundary may be assumed to be a cylindrical boundary centred on
the
producer wellbore and touching the lowest part of the fluid interface.
However, methods in
accordance with the present disclosure are not limited to this assumption, and
alternative
embodiments of the method may assume a different shape for the analysis
boundary.
The methods may include the additional steps of determining the relationship
between the pressure drawdown and the inflow rate at a plurality of
temperature drawdowns,
and then plotting the inflow rate as a function of inflow temperature for a
constant pressure
drawdown.
BRIEF DESCRIPTION OF THE DRAWINGS
Embodiments of the invention will now be described with reference to the
accompanying figures, in which numerical references denote like parts, and in
which:
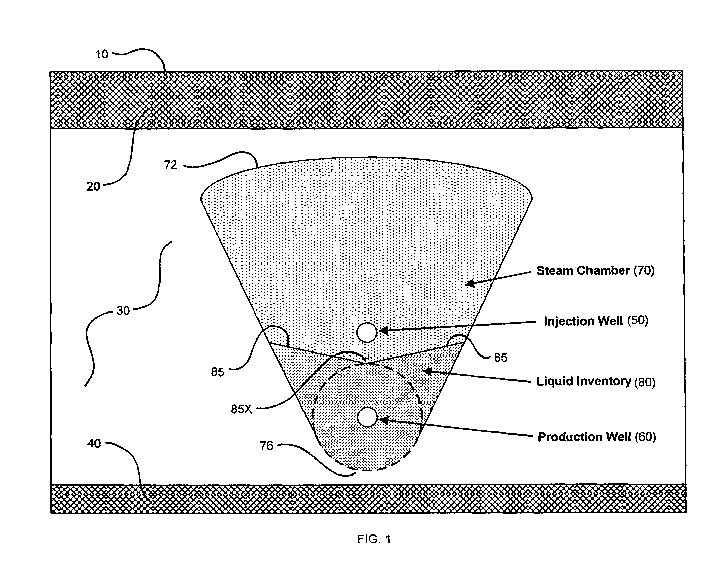
FIGURE 1 is a schematic cross-section through a steam chamber within a
subterranean oil sands reservoir, in conjunction with a horizontal steam
injection well and a horizontal production well.
FIGURE 2 is an enlarged cross-section through a production well and
adjacent regions as in FIG. 1.
FIGURE 3 is a flow chart illustrating steps in one embodiment of a method
for establishing an inflow performance relationship for a production wellbore
in accordance with the present disclosure.
FIGURE 4 is a graph illustrating the variability of inflow rate into a
production well with changes in inflow temperature.
DETAILED DESCRIPTION
FIG. 1 schematically illustrates a horizontal well pair (i.e., injector and
producer) in a
typical SAGD bitumen recovery installation in a bitumen-laden subterranean oil
sands
formation 30 underlying an overburden layer 20 extending to the ground surface
10, and
-10-
CA 02834808 2013-10-31
WO 2012/162804 PCT/CA2012/000516
overlying an underburden formation 40, all in accordance with prior art
knowledge and well
within the understanding of persons of ordinary skill in the art. Steam under
high pressure is
introduced into injector well 50 from a connecting well leg (not shown)
extending to ground
surface 10. Injector 50 has a slotted or orificed liner such that steam exits
injector 50 through
the liner slots or orifices and permeates oil sands formation 30 to create a
steam chamber 70
within formation 30. In this context, the term "steam chamber" may be
understood to mean a
volume within formation 30 in which steam remains present and mobile, at least
for so long
as steam injection into formation 30 continues. For analytical purposes, it is
assumed that
regions of formation 30 outside steam chamber 70 are essentially uninfluenced
by the steam
injected through injector 50.
The pattern of steam migration within formation 30, and thus the configuration
of
steam chamber 70, will vary with a variety of factors including formation
characteristics and
steam injection parameters. However, as represented by the idealized
configuration shown in
FIG. 1, a typical steam chamber 70 for a SAGD well can be considered or
modeled as being
generally wedge-shaped in cross-section, surrounding injector well 50, with a
"roofline" 72
and sloping side boundaries 74 converging downward toward a lower limit 76.
Steam
migrating to steam chamber side boundaries 74 condenses due to the lower
temperature of
the surrounding region of formation 30. As the steam condenses, it transfers
energy to the
bitumen, increasing its temperature and thus decreasing its viscosity such
that it becomes
flowable, whereupon the mobile bitumen and condensate flow downward and
accumulate as
a liquid inventory 80 within a lower region of steam chamber 70, below
injector 50. A fluid
interface 85 is thus formed between liquid inventory 80 and the overlying
region of steam
chamber 70. Based on theory and field observation, the level of fluid
interface 85 is assumed
for analytical purposes to be lowest (i.e., closest to producer 60) at a point
85X directly
above producer 60.
A producer well 60 is installed at a selected depth below and generally
parallel to
injector 50, such that it can be expected to lie within the zone of liquid
inventory 80 upon
formation of steam chamber 70. Producer well 60 has slots or other suitable
orifices to allow
the bitumen/condensate mix in liquid inventory 80 enters producer 60 for
production to the
- 11 -
CA 02834808 2013-10-31
WO 2012/162804 PCT/CA2012/000516
surface 10. For this purpose, producer well 60 typically has a liner with
narrow slots or other
orifices that allow liquid flow into producer 60 while substantially
preventing sand or other
contaminants from entering producer 60 or clogging the slots or orifices in
the liner.
FIG. 2 provides an enlarged illustration of liquid inventory 80 and producer
well 60
within a lower region of steam chamber 70. Also indicated in FIG. 2 is an
analysis boundary
90 surrounding producer well 60, with analysis boundary 90 being an
empirically defined or
selected parameter for purposes of predictive methods in accordance with the
present
disclosure. In accordance with a preferred embodiment of these predictive
methods, analysis
boundary 90 is assumed to be circular in cross-section and centered around
producer well 60,
with a radius corresponding the distance from the center of producer 60 to
point 85X on fluid
interface 85. However, alternative configurations of analysis boundary 90 may
be
appropriate to satisfy case-specific physical and/or analytical constraints.
Gravity Inflow Performance Relationship (Gravity IPR)
FIG. 3 schematically illustrates one embodiment of a procedure for developing
a
"gravity IPR" for use in evaluating the stability of liquid inventory 80. In
this context, the
stability of liquid inventory 80 relates to the stability of the vertical
distance from producer
60 to point 85X on fluid interface 85 at given points along the horizontal
length of producer
60 (which for purposes of FIG. 2 corresponds to the radius of circular
analysis boundary 90).
Procedural and analytical steps shown in FIG. 3 are summarized below:
Stage 101 ¨Temperature Measurements:
= Measure temperatures within steam chamber 70 and the vertical temperature
gradient
in liquid inventory 80.
= Define the temperature drawdown to be the difference between the steam
chamber
temperature and the inflow temperature (i.e., temperature of produced fluids
flowing
into producer well 60). For this purpose:
o Temperature drawdown = steam chamber temperature ¨ inflow temperature.
- 12 -
CA 02834808 2013-10-31
WO 2012/162804 PCT/CA2012/000516
Stage 102 ¨ Define Analysis Boundary:
= Consider a cross-section of producer wellbore 60 and the surrounding
liquid
inventory 80 in a plane perpendicular to the axis of the wellbore. Define
analysis
boundary 90 such that it encompasses producer wellbore 60 and contacts fluid
interface 85 between liquid inventory 80 and the overlying steam chamber 70.
The
distance between producer wellbore 60 and fluid interface 85 (i.e., the liquid
level) is
given by the temperature drawdown and the vertical temperature gradient. For
this
purpose:
o Liquid level = temperature drawdown / vertical temperature
gradient.
Stage 103 ¨ Temperature Mapping:
= Map the measured steam chamber temperature and vertical temperature
gradient onto
the area enclosed by analysis boundary 90. For this purpose:
= The temperature at liquid-vapor interface 85 is assumed to equal the
steam
temperature.
= The temperature at locations within analysis boundary 90 is calculated from
the vertical temperature gradient and the distance below the liquid-vapor
interface 85.
Stage 104 ¨ Solution:
= Specify the pressure conditions at analysis boundary 90 and producer
wellbore 60.
Define the pressure drawdown to be the difference between the steam chamber
pressure and the wellbore pressure. Using numerical or analytical methods
known to
persons of ordinary skill in the art, determine the relationship between the
pressure
drawdown and the flow rate into wellbore 60. For this purpose:
= The pressure at liquid-vapor interface 85 is assumed to equal the
pressure
within steam chamber 70 (which is taken to be the saturation pressure
corresponding to the measured steam chamber temperature).
- 13 -
CA 02834808 2013-10-31
WO 2012/162804 PCT/CA2012/000516
= The total head (i.e., the sum of the pressure head and the elevation
head) is
assumed to be constant along analysis boundary 90.
= A skin factor is included to account for near-wellbore pressure losses
that are
measured in the field but not captured by conventional equations for flow
through porous media (e.g., Darcy's Law). "Skin factor" in this context is a
term well understood in the field (see, for example, the definition of skin
factor in the Schlumberger Oilfield Glossary: www.glossary.oilfield.s1b.com).
= Flow chart blocks 110 and 120 in FIG. 3 represent additional criteria
taken into
consideration in the solution stage 104:
= Block 110 ¨ The analysis boundary represents a uniform head (i.e., a flow
isobar), and flow normal to the boundary integrated around the perimeter of
the boundary defines the inflow to the wellbore. In its simplest form, it is a
cylindrical boundary centered on the producer wellbore and touching the
lowest part of the fluid interface. Other shapes for the analysis boundary can
be incorporated to reflect better conformance to a different fluid level
interface, if additional refinement to reflect a changing steam chamber shape
with time is desired.
= Block 120 ¨ Reservoir and fluid properties are calculated over the range
of
temperatures considered inside the analysis boundary. Relative permeability
properties are incorporated and in combination with the temperature field and
fluid portions in determining the pressure gradients that are integrated to
arrive at the inflow characterization.
Stage 105 ¨ Stability Assessment:
= Determine the relationship between the pressure drawdown and inflow rate at
various
temperature drawdowns. Plot inflow rate as a function of inflow temperature
for a
constant pressure drawdown, as shown in FIG. 4. The slope of the plotted
curve(s) is
negative in the stable range of inflow temperatures.
- 14-
CA 02834808 2013-10-31
WO 2012/162804 PCT/CA2012/000516
o Within the stable range of inflow temperatures, an increase in liquid
level
(resulting when the delivery rate into liquid inventory 80 exceeds the inflow
rate into producer well 60) will cause the inflow rate to increase. The liquid
level will rise until it reaches an equilibrium position at which the inflow
rate
matches the delivery rate. A decrease in liquid level (resulting when the
inflow rate exceeds the delivery rate) causes the inflow rate to decrease. The
liquid level will drop until it reaches an equilibrium position at which the
inflow rate matches the delivery rate.
o Outside the stable range of inflow temperatures, an increase in liquid
level
will cause the inflow rate to decrease, allowing the liquid level to "run
away."
o For certain combinations of pressure drawdown, fluid properties, and
reservoir properties, the slope of the curve(s) will be positive for all
inflow
temperatures, indicating that there is no stable range of inflow temperatures.
A
decrease in liquid level will cause the inflow rate to increase, potentially
leading to steam breakthrough into producer 60.
Practical Application of Gravity IPR
When coupled to a wellbore hydraulic model, the gravity IPR enables the
performance of a production well to be evaluated by measuring the inflow
temperature along
the well to determine when the liquid level is reaching critical levels (i.e.,
when fluid level
rise in portions of the well compromises production efficiency, or when fluid
level drop in
portions of the well compromises well integrity). More specifically, the
gravity IPR provides
a basis for:
= Configuring producer well completions to deliver a pressure distribution
that is within
the range of self-balancing performance over the life of the well.
= Evaluating how pump intake subcool should be controlled to maintain
hydraulic
conditions within the self-balancing range of operation over the entire well.
- 15 -
CA 02834808 2013-10-31
WO 2012/162804 PCT/CA2012/000516
= Evaluating production rate capacities for specific completion options and
field
applications.
= Using inflow temperature distributions for evaluating completion
configuration
changes to match reservoir variations and maintain performance within the self-
balancing range over the entire well.
= Using temperature fall-off logs for evaluating completion configuration
changes to
match reservoir variations and maintain performance within the self-balancing
range
over the entire well.
= Using temperature measurements to set "smart well" controls for
production wells
and maintain performance within the self-balancing range over the entire well.
= Positioning or repositioning tubing intake points to maintain performance
within the
self-balancing range over the entire well.
= Adjusting chokes on gas lift tubing based on intake temperature to
maintain
performance within the self-balancing range over the entire well.
= Determining where fluid conditions approach water saturation, leading to
flashing,
which in turns chokes flow to automatically regulate inflow.
= By using flow conditions in the GIPR assessment, determining locations
where pore
throat water flashing may produce scaling and inflow restrictions.
The gravity IPR also provides a basis for determining reservoir delivery
distribution
over the length of the steam chamber:
= For producer wells operating in the self-balancing range, the delivery
distribution can
be calculated from temperature fall-off logs and inflow distributions using
distributed
temperature measurements under static inflow conditions.
-16-
CA 02834808 2013-10-31
WO 2012/162804 PCT/CA2012/000516
= For wells operating in the dynamic range, the reservoir delivery
distribution can be
calculated from the inflow rate to the well and the transient behaviour of the
fluid
level.
= Transient plugging development (for example, plugging of slots/orifices
in the liner,
or plugging in the formation itself by way or pore throat plugging) can be
determined
using temperature measurements and the gravity IPR. Producer well
configuration
updates can be evaluated to:
o Assess the likelihood of maintaining the well in the self-balancing
performance envelope and the reconfiguration requirements to maintain
stability.
o Determine a production intervention schedule to maintain an efficient
production distribution under dynamic fluid level control.
Other analytical methods for describing the inflow performance of the SAGD or
any
other gravity process can be calibrated using methods in accordance with the
present
disclosure. For example a conventional IPR inflow performance relationship can
be
calibrated by determining the drainage radius in the basic IPR equation as a
function of
inflow temperature. This can provide an even simpler basis for evaluating SAGD
inflow
performance. One example of such an application would be wellbore hydraulics
programs
used for analyzing and optimizing completions for SAGD production.
It will be readily appreciated by those skilled in the art that various
modifications of
methods in accordance with the present disclosure may be devised without
departing from the
scope and teaching of the present invention. It is to be especially understood
that the subject
methods are not intended to be limited to any described or illustrated
embodiment, and that
the substitution of a variant of a claimed element or feature, without any
substantial resultant
change in the working of the methods, will not constitute a departure from the
scope of the
invention.
- 17 -
CA 02834808 2013-10-31
WO 2012/162804 PCT/CA2012/000516
In this patent document, any form of the word "comprise" is to be understood
in its
non-limiting sense to mean that any item following such word is included, but
items not
specifically mentioned are not excluded. A reference to an element by the
indefinite article
"a" does not exclude the possibility that more than one of the element is
present, unless the
context clearly requires that there be one and only one such element.
Relational terms such as "parallel", "horizontal", and "perpendicular" are not
intended to denote or require absolute mathematical or geometric precision.
Accordingly,
such terms are to be understood in a general rather than precise sense (e.g.,
"generally
parallel" or "substantially parallel") unless the context clearly requires
otherwise.
Wherever used in this document, the terms "typical" and "typically" are to be
interpreted in the sense of representative or common usage or practice, and
are not to be
understood as implying invariability or essentiality.
- 18 -