Note: Descriptions are shown in the official language in which they were submitted.
CA 02838996 2013-12-10
WO 2012/171019
PCT/US2012/041929
METHODS AND SYSTEMS FOR WEIGHT CONTROL BY UTILIZING VISUAL
TRACKING OF LIVING FACTOR(S)
RELATED APPLICATIONS
[001] This application claims the priority of provisional applications Ser.
No. 61/495,630,
filed June 10, 2011, entitled "METHODS AND A SYSTEM FOR VISUAL TRACKING
PERSON'S LIVING FACTOR(S) TO MAINTAIN WEIGHT CONTROL," which is
incorporated herein by reference in its entirety for all purposes.
TECHNICAL FIELD
[002] In some embodiments, the instant invention relates to methods and
systems for a non-
theraputic weight control of a person.
BACKGROUND
[003] Consumers are striving to control their body weight, whether for the
object of losing
or gaining weight, or simply to maintain the weight they have, they are also
eager to ensure
that they are eating healthfully.
SUMMARY OF INVENTION
[004] In some embodiments, the instant invention is a non-therapeutic method
for assisting
a person to control weight of the person that can include receiving, by a
programmed
computer system, input data, where the input data comprises at least one of
the following
categories of data:
[005] i) food data representative of at least one first food consumed by the
person, and
[006] ii) what-if food data representative of at least one second food that
the person
considers to consume.
[007] In some embodiments, the method may further include calculating, in real-
time, by
the programmed computer system, at least one actual RCV(t) value over a period
of time
based, at least in part, on the food data of the input data and stored food
data, where the
1
CA 02838996 2013-12-10
WO 2012/171019
PCT/US2012/041929
stored food data is data about one or more food consumed by the person over
the period of
time prior to the receipt of the input data; calculating, in real-time, by the
programmed
computer system, at least one potential RCV(t) value over a period of time
based, at least in
part, on the what-if food data of the input data and the stored food data;
displaying, in real-
time, by the programmed computer system, at least one first graphical
indicator
representative of the at least one actual RCV(t) value over the period of
time, where the
displaying of at least one first graphical indicator is indicative of:
[008] i) whether the at least one actual RCV(t) value over the period of time
deviates from a
visual representation of a pre-determined optimum value or a pre-determined
optimum range
of values, and
[009] ii) an actual deviation if the at least one actual RCV(t) value over the
period of time
actually deviates from a visual representation of the pre-determined optimum
value or the
pre-determined optimum range of values, and where the displaying of at least
one first
graphical indicator provides information that assists the person to control
the weight of the
person.
[0010] In some embodiments, the method may further include displaying, in real-
time, by the
programmed computer system, at least one second graphical indicator
representative of the at
least one potential RCV(t) value over the period of time, where the displaying
of at least one
second graphical indicator is indicative of:
[0011] i) whether the at least one potential RCV(t) value over the period of
time deviates
from the visual representation of the pre-determined optimum value or the pre-
determined
optimum range of values and
[0012] ii) a potential deviation if the at least one potential RCV(t) value
over the period of
time actually deviates from the visual representation of the pre-determined
optimum value or
the pre-determined optimum range of values, and where the displaying of at
least one second
2
CA 02838996 2013-12-10
WO 2012/171019
PCT/US2012/041929
graphical indicator provides the information that assists the person to
control the weight of
the person.
[0013] In some embodiments, the non-therapeutic method includes displaying of
the at least
one first graphical indicator that includes positioning the at least one first
graphical indicator
at a first position along a scale, where the first position corresponds to the
calculated at least
one actual RCV(t) value over the period of time; where the displaying of the
at least one
second graphical indicator includes positioning the at least one second
graphical indicator at a
second position along the scale, where the second position corresponds to the
calculated at
least one potential RCV(t) value over the period of time; and where the visual
representation
of the pre-determined optimum value or the pre-determined optimum range of
values is
positioned at a third position along the scale.
[0014] In some embodiments, the at least one actual RCV(t) value is at least
one actual
RCAV(t) value and where the at least one potential RCV(t) value is at least
one potential
RCAV(t) value.
[0015] In some embodiments, the at least one actual RCAV(t) value is
calculated based at
least in part on the energy density of: (i) the food data of the input data
and (ii) the stored
food data, where the at least one potential RCAV(t) value over the period of
time is
calculated based at least in part on energy density of: (i) the what-if data
of the input data and
(ii) the stored food data, where the pre-determined optimum value or the pre-
determined
optimum range of values are determined from an energy density range of 0.5-1.6
kcal/gram.
[0016] In some embodiments, the at least one actual RCAV(t) value over the
period of time
is equal to:
[0017] (((amount of [kcal] of the at least one first food / 100 gram) X weight
of the at least
one first food) + ((amount of [kcal] of Food(2) of the stored food data / 100
gram) X weight
of consumed Food (2) of the stored food data) + ....+((amount of [kcal] of
Food(n) of the
3
CA 02838996 2013-12-10
WO 2012/171019
PCT/US2012/041929
stored food data / 100 gram) X weight of consumed Food (n) of the stored food
data)) /
(weight of the at least one first food + weight of consumed Food (2) of the
stored food
data+...+weight of consumed Food (n) of the stored food data), where "n" is
the total number
of Foods of the stored food data; where the at least one first food excludes
non-dairy
beverages; where the at least one potential RCAV(t) value is equal to:
[0018] (((amount of [kcal] of the at least one second food / 100 gram) X
weight of the at least
one second food) + ((amount of [kcal] of Food(2) of the stored food data / 100
gram) X
weight of consumed Food (2) of the stored food data) + ....+((amount of [kcal]
of Food(n)
of the stored food data / 100 gram) X weight of consumed Food (n) of the
stored food data)) /
(weight of the at least one second food + weight of consumed Food (2) of the
stored food
data+...+weight of consumed Food (n) of the stored food data); and where the
at least one
second food excludes non-dairy beverages.
[0019] In some embodiments, the present invention is a non-therapeutic method
where the
energy density range is 0.8-1.2 kcal/gram. In some embodiments, the energy
density range is
1-1.25 kcal/gram
[0020] In some embodiments, the non-therapeutic method further includes
receiving, by the
programmed computer system, weight data of the person, and displaying, by the
programmed
computer system, at least one second graphical indicator based at least in
part on determining,
by the programmed computer system, that the person maintains the weight or the
person loses
weight.
[0021] In some embodiments, a first part of the input data is received from
the person and a
second part of the input data received from a source other than the person. In
some
embodiments, the source is a remote database.
[0022] In some embodiments, the at least one actual RCV(t) value over the
period of time is
calculated by:
4
CA 02838996 2013-12-10
WO 2012/171019
PCT/US2012/041929
[0023] obtaining weight of protein, PRO(m), for the food data of the input
data;
obtaining weight of fat, FAT(m), for the food data of the input data;
obtaining weight of non-
dietary fiber carbohydrates, CHO(m), for the food data of the input data;
obtaining weight of
dietary fiber, DF(m), for the food data of the input data; determining a whole
number value
for the food data of the input data by:
[0024] 1) determining food energy data for the food data of the input data,
FED value, based
at least in part on one of:
[0025] i) W(PRO) x Cp x PRO(m), wherein W(PRO) is a metabolic efficiency
factor of
protein and wherein Cp is a energy conversion factor of protein,
[0026] ii) W(FAT) x Cfx FAT(m), wherein W(FAT) is a metabolic efficiency
factor of fat and
wherein Cf is a energy conversion factor of fat,
[0027] iii) W(CHO) x Cc x CHO(m), wherein W(CHO) is a metabolic efficiency
factor of
carbohydrate and wherein Cc is a energy conversion factor of carbohydrate, and
[0028] iv) W(DF) x Cdf x DF(m), wherein W(DF) is a metabolic efficiency factor
of dietary
fiber and wherein Cdf is a energy conversion factor of dietary fiber;
[0029] 2) dividing the determined FED value by a factor data obtained from a
storage device
and saving the result as whole number value for the food data of the input
data; determining a
daily whole number benchmark data for the
person;
determining the food data of the input data's whole number value; summing,
over the period
of time, whole number values of the food data of the input data and the stored
food data.
[0030] In some embodiments, W (PRO) is selected from a range 0.7 <= W(PRO) <=
0.9,
W(CHO) is selected from a range 0.9 <= W(CHO) <= 0.99, W(FAT) is selected from
a range
0.9 <= W(FAT) <= 1.0 and W(DF) is selected from a range 0 <= W(DF)<= 0.5.
[0031] In some embodiments, W (PRO) is selected from a range 0.75 <= W(PRO) <=
0.88,
W(CHO) is selected from a range 0.92 <= W(CHO) <= 0.97, W (FAT) is selected
from a
5
CA 02838996 2013-12-10
WO 2012/171019
PCT/US2012/041929
range 0.95 <= W(FAT) <= 1.0 and W(DF) is selected from a range 0 <= W(DF)<=
0.25,
wherein PRO(m), CHO(m), FAT(m) and DF(m) are expressed in grams, and where Cp
is
selected as 4 kilocalories/gram, Cc is selected as 4 kilocalories/gram, Cf is
selected as 9
kilocalories/gram and Cdf is selected as 4 kilocalories/gram. In some
embodiments, the
factor data is a whole number selected from a range between 20 and 100.
[0032] In some embodiments, the at least one actual RCV(t) value over the
period of time is
based on: calculating p value for the food data of the input data by the
following equation:
p
k k,
[0033]
[0034] where c is calories, f is fat in grams and r is dietary fiber in grams
for each candidate
food serving and where k1 is about 50, k2 is about 12 and k3 is about 5;
[0035] calculating PA value for the person by the following equation:
k4 x kg hc_)dy weigh t x minute5: of activity
PA
100
[0036]
[0037] where k4 is a pre-determined numerical weighting factor determined on
the basis of
intensity level of physical exercise; and adding PA to p when PA exceeds a pre-
determined
threshold value.
[0038] In some embodiments, the at least one first graphical indicator, the at
least one second
graphical indicator, the visual representation of the pre-determined optimum
value or the pre-
determined optimum range of values, and the scale are displayed on a portable
computing
device of the person.
[0039] In some embodiments, the present invention includes a programmed
computing
device, including a non-transient memory having at least one region for
storing computer
6
CA 02838996 2013-12-10
WO 2012/171019
PCT/US2012/041929
executable program code; and at least one processor for executing the program
code stored in
the non-transient memory, wherein the program code includes code to receive
input data,
where the input data comprises at least one of the following categories of
data:
[0040] i) food data representative of at least one first food consumed by the
person, and
[0041] ii) what-if food data representative of at least one second food that
the person
considers to consume;
[0042] code to calculate, in real-time, at least one actual RCV(t) value over
a period of time
based, at least in part, on the food data of the input data and stored food
data, where the
stored food data is data about one or more food consumed by the person over
the period of
time prior to the receipt of the input data; code to calculate, in real-time,
at least one potential
RCV(t) value over a period of time based, at least in part, on the what-if
food data of the
input data and the stored food data; code to display, in real-time, at least
one first graphical
indicator representative of the at least one actual RCV(t) value over the
period of time,
[0043] where the displaying of at least one first graphical indicator is
indicative of:
[0044] i) whether the at least one actual RCV(t) value over the period of time
deviates from a
visual representation of a pre-determined optimum value or a pre-determined
optimum range
of values, and
[0045] ii) an actual deviation if the at least one actual RCV(t) value over
the period of time
actually deviates from a visual representation of the pre-determined optimum
value or the
pre-determined optimum range of values, and
[0046] where the displaying of at least one first graphical indicator provides
information that
assists the person to control the weight of the person; and code to display,
in real-time, at
least one second graphical indicator representative of the at least one
potential RCV(t) value
over the period of time,
[0047] where the displaying of at least one second graphical indicator is
indicative of:
7
CA 02838996 2013-12-10
WO 2012/171019
PCT/US2012/041929
[0048] i) whether the at least one potential RCV(t) value over the period of
time deviates
from the visual representation of the pre-determined optimum value or the pre-
determined
optimum range of values and
[0049] ii) a potential deviation if the at least one potential RCV(t) value
over the period of
time actually deviates from the visual representation of the pre-determined
optimum value or
the pre-determined optimum range of values, and
[0050] where the displaying of at least one second graphical indicator
provides the
information that assists the person to control the weight of the person.
[0051] In some embodiments, the code to display the at least one first
graphical indicator
includes code to position the at least one first graphical indicator at a
first position along a
scale, where the first position corresponds to the calculated at least one
actual RCV(t) value
over the period of time; where the code to display the at least one second
graphical indicator
includes code to position the at least one second graphical indicator at a
second position
along the scale, wherein the second position corresponds to the calculated at
least one
potential RCV(t) value over the period of time; and where the visual
representation of the
pre-determined optimum value or the pre-determined optimum range of values is
positioned
at a third position along the scale.
[0052] In some embodiments, the at least one actual RCV(t) value is at least
one actual
RCAV(t) value and wherein the at least one potential RCV(t) value is at least
one potential
RCAV(t) value.
[0053] In some embodiments, the at least one actual RCAV(t) value is
calculated based at
least in part on energy density of: (i) the food data of the input data and
(ii) the stored food
data, where the at least one potential RCAV(t) value over the period of time
is calculated
based at least in part on energy density of: (i) the what-if data of the input
data and (ii) the
8
CA 02838996 2013-12-10
WO 2012/171019
PCT/US2012/041929
stored food data, where the pre-determined optimum value or the pre-determined
optimum
range of values are determined from an energy density range of 0.5-1.6
kcal/gram.
[0054] In some embodiments, the at least one actual RCAV(t) value over the
period of time
is equal to:
[0055] (((amount of [kcal] of the at least one first food / 100 gram) X weight
of the at least
one first food) + ((amount of [kcal] of Food(2) of the stored food data / 100
gram) X weight
of consumed Food (2) of the stored food data) + ....+((amount of [kcal] of
Food(n) of the
stored food data / 100 gram) X weight of consumed Food (n) of the stored food
data)) /
(weight of the at least one first food + weight of consumed Food (2) of the
stored food
data+...+weight of consumed Food (n) of the stored food data), wherein "n" is
the total
number of Foods of the stored food data;
[0056] where the at least one first food excludes non-dairy beverages; where
the at least one
potential RCAV(t) value is equal to:
[0057] (((amount of [kcal] of the at least one second food / 100 gram) X
weight of the at least
one second food) + ((amount of [kcal] of Food(2) of the stored food data / 100
gram) X
weight of consumed Food (2) of the stored food data) + ....+((amount of [kcal]
of Food(n)
of the stored food data / 100 gram) X weight of consumed Food (n) of the
stored food data)) /
(weight of the at least one second food + weight of consumed Food (2) of the
stored food
data+...+weight of consumed Food (n) of the stored food data); and
[0058] where the at least one second food excludes non-dairy beverages.
[0059] In some embodiments, the energy density range is 0.8-1.2 kcal/gram. In
some
embodiments, the energy density range is 1-1.25 kcal/gram.
[0060] In some embodiments, the program code further includes code to receive
weight data
of the person, and code to display at least one second graphical indicator
based at least in part
on a determination that the person maintains the weight or the person loses
weight.
9
CA 02838996 2013-12-10
WO 2012/171019
PCT/US2012/041929
[0061] In some embodiments, a first part of the input data is received from
the person and a
second part of the input data received from a source other than the person. In
some
embodiments, the source is a remote database.
[0062] In some embodiments, the code to calculate the at least one actual
RCV(t) value over
the period of time further includes code to obtain weight of protein, PRO(m),
for the food
data of the input data; code to obtain weight of fat, FAT(m), for the food
data of the input
data; code to obtain weight of non-dietary fiber carbohydrates, CHO(m), for
the food data of
the input data; code to obtain weight of dietary fiber, DF(m), for the food
data of the input
data; code to determine a whole number value for the food data of the input
data, wherein the
whole number value for the food data of the input data is determined by:
[0063] 1) determining food energy data for the food data of the input data,
FED value, based
at least in part on one of:
[0064] i) W(PRO) x Cp x PRO(m), wherein W(PRO) is a metabolic efficiency
factor of
protein and wherein Cp is a energy conversion factor of protein,
[0065] ii) W(FAT) x Cf x FAT(m), wherein W(FAT) is a metabolic efficiency
factor of fat and
wherein Cf is a energy conversion factor of fat,
[0066] iii) W(CHO) x Cc x CHO(m), wherein W(CHO) is a metabolic efficiency
factor of
carbohydrate and wherein Cc is a energy conversion factor of carbohydrate, and
[0067] iv) W(DF) x Cdf x DF(m), wherein W(DF) is a metabolic efficiency factor
of dietary
fiber and wherein Cdf is a energy conversion factor of dietary fiber;
[0068] 2) dividing the determined FED value by a factor data obtained from a
storage device
and saving the result as whole number value for the food data of the input
data; code to
determine a daily whole number benchmark data for the person;
code to determine the food data of the input data's whole number value; code
to sum, over
CA 02838996 2013-12-10
WO 2012/171019
PCT/US2012/041929
the period of time, whole number values of the food data of the input data and
the stored food
data.
[0069] In some embodiments, W (PRO) is selected from a range 0.7 <= W(PRO) <=
0.9,
W(CHO) is selected from a range 0.9 <= W(CHO) <= 0.99, W(FAT) is selected from
a range
0.9 <= W(FAT) <= 1.0 and W(DF) is selected from a range 0 <= W(DF)<= 0.5. In
some
embodiments, W (PRO) is selected from a range 0.75 <= W(PRO) <= 0.88, W(CHO)
is
selected from a range 0.92 <= W(CHO) <= 0.97, W (FAT) is selected from a range
0.95 <=
W(FAT) <= 1.0 and W(DF) is selected from a range 0 <= W(DF)<= 0.25, wherein
PRO(m),
CHO(m), FAT(m) and DF(m) are expressed in grams, and wherein Cp is selected as
4
kilocalories/gram, Cc is selected as 4 kilocalories/gram, Cf is selected as 9
kilocalories/gram
and Cdf is selected as 4 kilocalories/gram.
[0070] In some embodiments, the at least one actual RCV(t) value over the
period of time is
based on:
[0071] calculating p value for the food data of the input data by the
following equation:
f
p =
ki
[0072]
[0073] where c is calories, f is fat in grams and r is dietary fiber in grams
for each candidate
food serving and where k1 is about 50, k2 is about 12 and k3 is about 5;
[0074] calculating PA value for the person by the following equation:
X kg, body wei ght x irue f acv; vity
1 00
[0075]
11
CA 02838996 2013-12-10
WO 2012/171019
PCT/US2012/041929
[0076] where k4 is a pre-determined numerical weighting factor determined on
the basis of
intensity level of physical exercise; and adding PA to p when PA exceeds a pre-
determined
threshold value.
BRIEF DESCRIPTION OF THE DRAWINGS
[0077] The present invention will be further explained with reference to the
attached
drawings, wherein like structures are referred to by like numerals throughout
the several
views. The drawings shown are not necessarily to scale, with emphasis instead
generally
being placed upon illustrating the principles of the present invention.
Further, some features
may be exaggerated to show details of particular components.
[0078] FIG. 1 illustrates certain features of some embodiments of the present
invention.
[0079] FIG. 2 illustrates certain features of some further embodiments of the
present
invention.
[0080] FIG. 3 illustrates certain features of some further embodiments of the
present
invention.
[0081] FIG. 4 illustrates certain features of some further embodiments of the
present
invention.
[0082] FIG. 5 illustrates certain features of some further embodiments of the
present
invention.
[0083] FIG. 6 illustrates certain features of some further embodiments of the
present
invention.
[0084] FIG. 7 illustrates certain features of some further embodiments of the
present
invention.
[0085] FIG. 8 illustrates yet certain features of some further embodiments of
the present
invention.
12
CA 02838996 2013-12-10
WO 2012/171019
PCT/US2012/041929
[0086] FIG. 9 illustrates yet certain features of some further embodiments of
the present
invention.
[0087] FIG. 10 illustrates yet certain features of some further embodiments of
the present
invention.
[0088] FIG. 11 illustrates yet certain features of some further embodiments of
the present
invention.
[0089] FIG. 12 illustrates yet certain features of some further embodiments of
the present
invention.
[0090] FIG. 13 illustrates yet certain features of some further embodiments of
the present
invention.
[0091] FIG. 14 illustrates yet certain features of some further embodiments of
the present
invention.
[0092] FIGS. 15A-15C illustrate yet certain features of some further
embodiments of the
present invention.
[0093] FIGS. 16A-16B illustrate yet certain features of some further
embodiments of the
present invention.
[0094] FIGS. 17A-17B illustrate yet certain features of some further
embodiments of the
present invention.
[0095] FIG. 18 illustrates yet certain features of some further embodiments of
the present
invention.
[0096] FIG. 19 illustrates yet certain features of some further embodiments of
the present
invention.
[0097] FIG. 20 illustrates yet certain features of some further embodiments of
the present
invention.
13
CA 02838996 2013-12-10
WO 2012/171019
PCT/US2012/041929
[0098] FIGS. 21A-21B illustrate yet certain features of some further
embodiments of the
present invention.
[0099] FIGS. 22A-22B illustrate yet certain features of some further
embodiments of the
present invention.
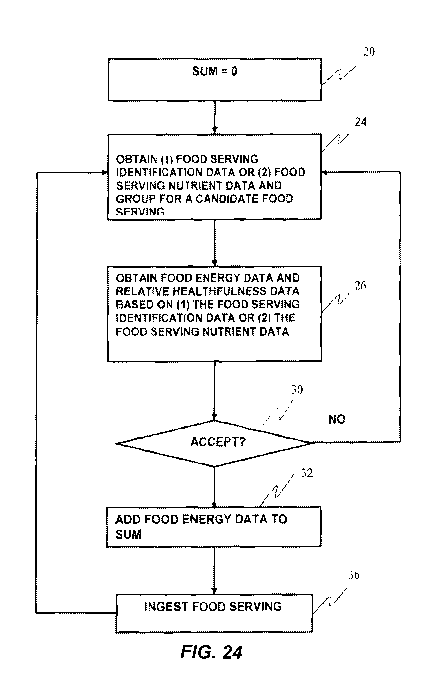
[00100] FIG. 23 illustrates yet certain features of some further
embodiments of the
present invention.
[00101]
FIG. 24 illustrates yet certain features of some further embodiments of the
present invention.
[00102]
FIG. 25 illustrates yet certain features of some further embodiments of the
present invention.
[00103]
FIG. 26 illustrates yet certain features of some further embodiments of the
present invention.
[00104]
FIG. 27 illustrates yet certain features of some further embodiments of the
present invention.
[00105] FIG. 28 illustrates yet certain features of some further
embodiments of the
present invention.
[00106] The
figures constitute a part of this specification and include illustrative
embodiments of the present invention and illustrate various objects and
features thereof
Further, the figures are not necessarily to scale, some features may be
exaggerated to show
details of particular components. In addition, any measurements,
specifications and the like
shown in the figures are intended to be illustrative, and not restrictive.
Therefore, specific
structural and functional details disclosed herein are not to be interpreted
as limiting, but
merely as a representative basis for teaching one skilled in the art to
variously employ the
present invention.
14
CA 02838996 2013-12-10
WO 2012/171019
PCT/US2012/041929
DETAILED DESCRIPTION
[00107]
Among those benefits and improvements that have been disclosed, other
objects and advantages of this invention will become apparent from the
following description
taken in conjunction with the accompanying figures. Detailed embodiments of
the present
invention are disclosed herein; however, it is to be understood that the
disclosed
embodiments are merely illustrative of the invention that may be embodied in
various forms.
In addition, each of the examples given in connection with the various
embodiments of the
invention which are intended to be illustrative, and not restrictive.
[00108]
Throughout the specification and claims, the following terms take the
meanings explicitly associated herein, unless the context clearly dictates
otherwise. The
phrases "In some embodiments" and "in some embodiments" as used herein do not
necessarily refer to the same embodiment(s), though it may. Furthermore, the
phrases "in
another embodiment" and "in some other embodiments" as used herein do not
necessarily
refer to a different embodiment, although it may. Thus, as described below,
various
embodiments of the invention may be readily combined, without departing from
the scope or
spirit of the invention.
[00109] In
addition, as used herein, the term "or" is an inclusive "or" operator, and is
equivalent to the term "and/or," unless the context clearly dictates
otherwise. The term "based
on" is not exclusive and allows for being based on additional factors not
described, unless the
context clearly dictates otherwise. In addition, throughout the specification,
the meaning of
"a," "an," and "the" include plural references. The meaning of "in" includes
"in" and "on."
[00110] In
some embodiments, the term "energy content" as used herein refers to the
energy content of a given food, whether or not adjusted for the metabolic
conversion
efficiency of one or more nutrients in the food.
CA 02838996 2013-12-10
WO 2012/171019
PCT/US2012/041929
[00111] In
some embodiments, the term "metabolic conversion efficiency" as used
herein includes both absolute measures of metabolic conversion efficiency and
the metabolic
conversion efficiency of nutrients relative to each other.
[00112] In
some embodiments, the term "data" as used herein means any indicia,
signals, marks, symbols, domains, symbol sets, representations, and any other
physical form
or forms representing information, whether permanent or temporary, whether
visible, audible,
acoustic, electric, magnetic, electromagnetic or otherwise manifested. In some
embodiments,
the term "data" as used to represent pre-determined information in one
physical non-transient
form shall be deemed to encompass any and all representations of corresponding
information
in a different physical form or forms.
[00113] In
some embodiments, the term "presentation data" as used herein means data
to be presented to a person in any perceptible form, including but not limited
to, visual form
and aural form. Examples of presentation data include data displayed on a
visual presentation
device, such as a PDA, a smart phone, a monitor, and data printed on paper.
[00114] In some embodiments, the term "presentation device" as used herein
means a
device or devices capable of presenting data to a person in any perceptible
form.
[00115] In
some embodiments, the term "database" as used herein means an organized
body of related data, regardless of the manner in which the data or the
organized body thereof
is represented. For example, the organized body of related data may be in the
form of one or
more of a table, a map, a grid, a packet, a datagram, a frame, a file, an e-
mail, a message, a
document, a list or in any other suitable form.
[00116] In
some embodiments, the term "image dataset" as used herein means a
database suitable for use as presentation data or for use in producing
presentation data.
[00117] In
some embodiments, the term "auxiliary image feature" as used herein means
one or more of the color, brightness, shading, shape or texture of an image.
16
CA 02838996 2013-12-10
WO 2012/171019
PCT/US2012/041929
[00118] In
some embodiments, the term "network" as used herein includes both
networks and intemetworks of all kinds, including the Internet, and is not
limited to any
particular network or inter-network. For example, "network" includes those
that are
implemented using wired links, wireless links or any combination of wired and
wireless
links.
[00119] In
some embodiments, the terms "first", "second", "primary" and "secondary"
are used to distinguish one element, set, data, object, step, process,
activity or thing from
another, and are not used to designate relative position or arrangement in
time, unless
otherwise stated explicitly.
[00120] In some embodiments, the terms "coupled", "coupled to", "coupled
with,"
"connected", and "connected with" as used herein each mean a relationship
between or
among two or more devices, apparatus, files, circuits, elements, functions,
operations,
processes, programs, media, components, networks, systems, subsystems, and/or
means,
constituting any one or more of (a) a connection, whether direct or through
one or more other
devices, apparatus, files, circuits, elements, functions, operations,
processes, programs,
media, components, networks, systems, subsystems, or means, (b) a
communication
relationship, whether direct or through one or more other devices, apparatus,
files, circuits,
elements, functions, operations, processes, programs, media, components,
networks, systems,
subsystems, or means, and/or (c) a functional relationship in which the
operation of any one
or more devices, apparatus, files, circuits, elements, functions, operations,
processes,
programs, media, components, networks, systems, subsystems, or means depends,
in whole
or in part, on the operation of any one or more others thereof
[00121] In
some embodiments, the terms "communicate," "communicating" and
"communication" as used herein include both conveying data from a source to a
destination,
and delivering data to a communication medium, system, channel, network,
device, wire,
17
CA 02838996 2013-12-10
WO 2012/171019
PCT/US2012/041929
cable, fiber, circuit and/or link to be conveyed to a destination. The term
"communications"
as used herein includes one or more of a communication medium, system,
channel, network,
device, wire, cable, fiber, circuit and link.
[00122] In
some embodiments, the term "processor" as used herein means processing
devices, apparatus, programs, circuits, components, systems and subsystems,
whether
implemented in hardware, software or both, and whether or not programmable. In
some
embodiments, the term "processor" as used herein includes, but is not limited
to one or more
computers, hardwired circuits, neural networks, signal modifying devices and
systems,
devices and machines for controlling systems, central processing units,
programmable
devices and systems, field programmable gate arrays, application specific
integrated circuits,
systems on a chip, systems comprised of discrete elements and/or circuits,
state machines,
virtual machines, data processors, processing facilities and combinations of
any of the
foregoing.
[00123] In
some embodiments, the term "data processing system" as used herein means
a system implemented at least in part by hardware and comprising a data input
device, a data
output device and a processor coupled with the data input device to receive
data therefrom
and coupled with the output device to provide processed data thereto.
[00124] In
some embodiments, the terms "obtain", "obtained" and "obtaining", as used
with respect to a processor or data processing system mean (a) producing data
by processing
data, (b) retrieving data from storage, or (c) requesting and receiving data
from a further data
processing system.
[00125] In
some embodiments, the terms "storage" and "data storage" as used herein
mean one or more data storage devices, apparatus, programs, circuits,
components, systems,
subsystems, locations and storage media serving to retain data, whether on a
temporary or
permanent basis, and to provide such retained data.
18
CA 02838996 2013-12-10
WO 2012/171019
PCT/US2012/041929
[00126] In some embodiments, the terms "food serving identification
data" and "food
serving ID data" as used herein mean data of any kind that is sufficient to
identify a food and
to convey an amount thereof, whether by mass, weight, volume, or size, or by
reference to a
standard or otherwise defined food serving, or by amounts of constituents
thereof The terms
"amount" and "amounts" as used herein refer both to absolute and relative
measures.
[00127] In some embodiments, the terms "food identification data" and
"food ID data"
as used herein mean data of any kind that is sufficient to identify a food,
whether or not such
data conveys an amount thereof
[00128] In some embodiments, the terms "indicator" or "graphical
indicator" are used
herein interchangeably and include a single or a plurality of visual
presentations to convey
information, including but not limited to, the plurality of presentations that
show related or
the same information or the plurality of presentations that show unrelated
information.
[00129] It is understood that at least one aspect/functionality of the
various
embodiments described herein can be performed in real-time (or "in real time")
and/or
dynamically. As used herein, the term "real-time"/"in real time" means that an
event/action
occurs instantaneously or almost instantaneously in time when another
event/action has
occurred. As used herein, the term "dynamic(ly)" means that an event/action
occurs without
any human intervention.
[00130] In some embodiments, a person's tracked living factors include,
but are not
limited to, food consumption, physical activity, mental activity, stress
level, health, etc.
[00131] In some embodiments, the instant invention can provide for
methods and
systems for visually tracking a person's living factor(s) which serves to non-
therapeutically
reduce the weight of a person and/or for non-therapeutically maintaining the
person's weight.
In some embodiments, the instant invention can provide a software tool (e.g.,
a smart phone's
application ("App")) that determines/calculates, on the basis of collected
data (e.g., tracking
19
CA 02838996 2013-12-10
WO 2012/171019
PCT/US2012/041929
the person's living factor(s) and/or additional information such as person's
current weight)
that the person has maintained or lost weight.
[00132] In
some embodiments, the instant invention visually tracks a person's living
factor(s) to allow the person to maintain weight control (e.g., lose weight,
maintain weight,
etc.). In some embodiments, the instant invention visually tracks a person's
living factor(s)
over a period of time to maintain weight control. In some embodiments, the
instant invention
visually tracks a person's living factor(s) over a period of time to maintain
weight control
and/or allows the person to understand how the person's living factor(s) could
be affected if
the person is to engage in a certain activity (e.g., would decides to eat a
particular food
(he/she has a cupcake), run a mile, etc). In some embodiments, the instant
invention visually
tracks a combination of a plurality of living factors over a period of time.
[00133] In
some embodiments, the instant invention visually tracks a running
cumulative value(s) of a person's living factor(s) over a period of time
("actual RCV(t)") to
maintain weight control and/or reduce weight. In some embodiments, the instant
invention
visually tracks a running cumulative average value(s) of a person's living
factor(s) over a
period of time ("actual RCAV(t)") to maintain weight control and/or reduce
weight, and/or
allow the person to understand how the person's living factor(s) could be
affected if the
person engages in a certain activity (e.g., eats a particular food (he/she has
a cupcake), runs a
mile, etc).
[00134] In some embodiments, the instant invention visually tracks the
actual RCV(t)
and/or the actual RCAV(t) of the person's living factor(s) by visually
displaying a indicator
("the graphical indicator" or "visual indicator") on a computer device,
including but not
limiting to, a hand-held computing mobile device or similar device. In some
embodiments,
the graphical indicator represents the actual RCV(t) and/or the actual RCAV(t)
of the
person's living factor(s) where "t" can be minutes, hours, days, months,
years, and/or any
CA 02838996 2013-12-10
WO 2012/171019
PCT/US2012/041929
other suitable time value. In some embodiments, the instant invention allows
the person to
understand how the person's living factor(s) could be affected if the person
is to engage in a
certain activity (e.g., would decide to eat a particular food (he/she has a
cupcake), to run a
mile, etc) by visually changing the graphical indicator (e.g., changing its
position on the
screen, changing its shape, changing its color, etc.) based on a potential
RCV(t) and/or a
potential RCAV(t) calculated when the person submits information about the
certain activity
that he or she considers to engage in ("what-if data"/"what-if scenarios").
[00135] In
some embodiments, personal computer device(s) programmed in
accordance with the instant invention can further determine/calculate, on the
basis of the
collected data about the person's living factor(s), the person's progress in
accomplishing
personal goal(s) (e.g., going to the gym, eating a healthy snack, tracking
your food intake and
activity, getting a good night's sleep.)
[00136] As
detailed further herein, in some embodiments of the instant invention, the
actual RCV(t), the actual RCAV(t), the potential RCV(t), and/or the potential
RCAV(t) can
be calculated on the basis of various values/factors such as energy density
("ED"), food
energy density ("FED"), total energy expenditure ("TEE"), adjusted TEE,
healthfulness
("HD"), kcal, whole numbers (e.g., p, PA) representative of the amount and/or
extent to which
the person engages in or considers to engage in a particular activity (e.g.,
perform medium
intensity physical exercise), and other suitable values/factors.
[00137] In some embodiments, the visual tracking is representative of a
targeted
optimum/desired range within which the graphical indicator is shown. In some
embodiments,
the visual tracking is representative of a targeted optimum/desired value with
respect to
which the graphical indicator is shown. The targeted optimum/desired range
and/or the
targeted optimum/desired value allow(s) the person to visually compare
outcome(s) of
activities in which the person engages and/or considers to engage in. In some
embodiments,
21
CA 02838996 2013-12-10
WO 2012/171019
PCT/US2012/041929
the instant invention provides a functionality that displays a certain visual
presentation and/or
spatial mark(s) that is/are representative of the targeted optimum/desired
range and/or the
targeted optimum/desired value. In some embodiments, the targeted
optimum/desired range
and/or the targeted optimum/desired value are constant over a period of time.
In some
[00138] Examples of visually tracking the actual RCV(t), the actual
RCAV(t),
the potential RCV(t), and/or the potential RCAV(t) based on ED
[00139] For example, some embodiments of the instant invention are
based on a
wherein "n" is the total number of Foods consumed by a person over the tracked
time period
22
CA 02838996 2013-12-10
WO 2012/171019
PCT/US2012/041929
[00140] In
some embodiments, the RCAV(t) (ED) (time period) value may be
calculated using various weight metric units (e.g., lb, kg, etc) and thus can
be modified
according to the weight metric unit. In some embodiments, the instant
invention collects data
about person's living factor(s) over a period of time (e.g., said data
comprising data about
food consumed by the person over the period of time.) In some embodiments, the
instant
invention can then calculate an actual RCAV(t) (ED) of the food consumed by
the person
over a period of time; and display the graphical indicator to represent the
person's calculated
actual RCAV(t) (ED) of food consumed. In some embodiments, the instant
invention can
then calculate a potential RCAV(t) (ED) of the food contemplated to be
consumed by the
person at a particular point in time (e.g., the what-if scenarios).
[00141] In
some embodiments, value(s) for energy and/or weight of foods consumed
and/or to be consumed can be obtained from various sources which may include,
but not
limited to, food packaging, public/private database(s), etc. In some
embodiments, personal
electronic devices programmed in accordance with the instant invention have a
functionality
of automatically acquiring information about the energy and/or weight of foods
consumed
and/or to be consumed from food packaging and/or announcement (e.g.,
advertisement). In
some embodiments, the functionality of automatically acquiring information can
include, but
is not limited to, a functionality of scanning (e.g., UPC, QR code), taking a
picture (e.g.,
UPC, QR code), and/or wireless receiving data (e.g., near field communication
(NFC), IR,
etc.)
[00142] In
some embodiments, the instant invention may exclude beverages from the
calculation because beverages may significantly impact the actual/potential
RCAV(t) (ED)
value without contributing to a persons' feeling of being no longer hungry
(i.e., food
satisfied.)
23
CA 02838996 2013-12-10
WO 2012/171019
PCT/US2012/041929
[00143] In
some embodiments, the tracking period (t) can be a fixed period of time
(e.g., daily, weekly, monthly.) In some embodiments, the tracking period (t)
can be adapted
to be pre-determined by the person (e.g., daily, weekly, monthly.) In some
embodiments, the
tracking period (t) can be adapted to be changed by the person in real-time.
In one example,
a reset button can be provided whose activation will return the graphical
indicator to baseline
and the process will begin anew.
[00144] In
some embodiments, the actual/potential RCAV(t) (ED) value can be further
adjusted to account for volume of air and/or water in a particular consumed
food. For
example, popcorn contains a high volume of air. Popcorn's energy value per 100
gram (3.5
oz) is about 1,598 kJ (382 kcal) which would correspond to ED of 3.82
(kcal/gram). The
consumption of one cup of popcorn (about 8 grams) would correspond to an ED of
0.31 of a
consumed amount which is further adjusted down by taking into consideration
the volume of
air. In some embodiments, a weight of the volume of air is calculated as being
the same as
the weight of water occupying the same volume. For example, in some
embodiments, the
instant invention assumes for calculation(s) the person's the actual/potential
RCAV(t) (ED)
value that weight of a cup (8 oz.) of popcorn is equal to weight of a cup (8
oz.) of water.
[00145] In
some embodiments, the instant invention can provide a functionality of
separately tracking consumption of beverages without using beverage data in
the person's the
actual/potential RCAV(t) (ED) value calculation above. In one instance, the
device
programmed in accordance with the principles of the instant invention,
prevents the
submission of data about the consumed or to be consumed beverages such as
orange juice
that the person drank or intends to drink during a particular time period
(t)(e.g., day, week).
Consequently, in such embodiments, the instant invention will not use the
orange juice data
in the calculation of the person's actual/potential RCAV(t) (ED) value.
24
CA 02838996 2013-12-10
WO 2012/171019
PCT/US2012/041929
[00146] In some embodiments, the instant invention accounts for milk
(animal and
plant origin) separately from other beverages.
[00147] In some embodiments, the instant invention provides a software
tool (e.g., an
App) on a computer device, including but not limited to, a hand-held computing
mobile
device (e.g., smart phone-type device, iPad-type device, etc.) that assists
the person in
visually tracking the actual/potential RCAV(t) (ED) value for controlling
living factor(s)
including consumption of food for weight maintenance and/or weight loss. In
some
embodiments, the visual tracking of the actual/potential RCAV(t) (ED) value
guides the
person toward consumption of foods having a lower ED.
[00148] In some embodiments, the instant invention can provide a
functionality of
automatically resetting the actual/potential RCAV(t) (ED) value on a pre-
determined periodic
basis. In some embodiments, the instant invention can provide a functionality
of allowing the
person/person to manually reset the actual/potential RCAV(t) (ED) value .
[00149] In some embodiments, the software tool can include a graphical
display with at
least one indicator that has a particular shape (e.g., bubble shape, a level,
etc.) and/or is
spatially positioned within the graphical display such as to convey to the
person'
actual/potential RCAV(t) (ED) value with respect to a targeted optimum/desired
range and/or
value.
[00150] Examples of Figure 1
[00151] In some embodiments, as shown in Fig. 1, as the software receives
data about
food(s) consumed by the person, the at least one graphical indicator, which
can be in a form
of a bubble (1), can be adapted to move, for example, from-left-to-right (3,4)
on a scale (2) to
reflect the person's most recent actual/potential RCAV(t) (ED) value. In some
embodiments,
the scale (2) represents a food ED scale, having a range between 0 kcal/gram,
corresponding
to an ED of water, and 9 kcal/gram, corresponding to an ED of oil. In some
embodiments,
CA 02838996 2013-12-10
WO 2012/171019
PCT/US2012/041929
the consumption of different foods would result in change in a position of the
at least one
graphical indicator along the food ED scale that conveys the person's
actual/potential
RCAV(t) (ED) at a particular time . For example, an ED of a banana is 0.6
(kcal/gram),
assuming that the banana weighs 100 grams and contains 60 kcal. For example,
an ED of a
celery portion is 0.5 (kcal/gram). For example, an ED of watermelon is 0.25
(kcal/gram)
because a watermelon is mostly water. For example, an ED of oil is 9
(kcal/gram), the
highest possible ED value among foods.
[00152] In
one example, if the person tracks his/her actual/potential RCAV(t) (ED) on
a daily basis, at a particular time during a day, for example, at 3 PM, the
position of the
graphical indicator (1) along the scale (2) will represent the person's real-
time
actual/potential RCAV(t) (ED) value based on the foods that the person
consumed prior to 3
PM for control of weight maintenance and/or weight loss. In one example, if
the graphical
indicator (1) is positioned closer to the right end (4) of the scale (2), the
person receives a
real-time visual indication that, from this time and on, he or she needs to
eat foods that have a
low ED to maintain weight control and/or lose weight until the next
calculation when the
person consumes the next food. In one example, if the graphical indicator (1)
is positioned
closer to the left end (3) of the scale (2), the person receives a real-time
visual indication that,
from this time and on, he or she can eat foods that do not necessarily have a
lower ED for
control of weight maintenance and/or weight loss until the next calculation
when the person
consumes the next food. In one example, the visual tracking is representative
of a pre-
determined targeted optimum/desired range. This targeted range then allows the
person to
visually track a target range for control of weight maintenance and/or weight
loss so as to
determine whether the person is "under" or "over" the target range.
[00153] In
one example, the person tracks his/her actual/potential RCAV(t) (ED) on a
daily basis. For example, the person enters a breakfast of mixed fruit and low-
calorie oatmeal
26
CA 02838996 2013-12-10
WO 2012/171019
PCT/US2012/041929
and, as a result, the position of the graphical indicator along the scale (2)
will be at position
(1) because the foods eaten have a combined ED that is less than the target.
As such, the
visual tracking is representative of a pre-determined target
(optimum/desired). This target
then may result in control of weight maintenance and/or weight loss.
Consequently, in one
example, this shows a certain visual presentation and/or spatial mark(s)
within the display
that is representative of a pre-determined targeted (optimum/desired) ED value
or range to
which a visual condition of the at least one indicator of the person's
actual/potential RCAV(t)
(ED) value is compared to. Therefore, the graphical indicator provides a real-
time visual
indication that, for the next foods selected (i.e., lunch), choices with a
higher ED can be
consumed (e.g., a sandwich) to reach the target value.
[00154] In
yet another example, the person tracks his/her actual/potential RCAV(t)
(ED) on a daily basis. For example, the person enters a breakfast of French
toast with butter
and syrup, the position of the graphical indicator along the scale (2) will be
at position (4)
because the foods eaten have a combined ED that is greater than the target. As
such, the
visual tracking is representative of a pre-determined optimum/desired target.
This target then
may result in control of weight maintenance and/or weight loss. The graphical
indicator
provides a real-time visual indication that, for the next foods selected
(i.e., lunch), choices
with a lower ED can be consumed (e.g., soup and salad) to reach the target
value.
[00155] In
yet another example, a person tracks his/her actual/potential RCAV(t) (ED)
on a weekly basis (Friday-to-Friday.) A person enters all foods eaten over a
weekend of
socializing, the position of the graphical indicator along the scale (2) will
be at position (4)
because the foods eaten have a combined ED that is greater than the target.
The graphical
indicator provides a real-time visual indication that, for the next several
meals and/or days
food choices with a lower ED need to be consumed to reach the target value.
27
CA 02838996 2013-12-10
WO 2012/171019
PCT/US2012/041929
[00156] In
another example, the person tracks his/her actual/potential RCAV(t) (ED)
on a weekly basis (Monday-to-Monday). By consistently choosing foods with a
lower ED for
several days, the position of the graphical indicator along scale (2) will be
at position (3)
because the foods eaten have a combined ED that is less than the target. The
graphical
indicator provides a real-time visual indication that, for the next few meals
and/or days, foods
choices with a higher ED need to be consumed to reach the target value by
week's end.
[00157] In
some embodiments, the graphical display can be programmed to show a
certain visual presentation and/or spatial mark(s) within the display that is
representative of a
pre-determined optimum/desired targeted ED value or range to which a visual
condition of
the at least one indicator of the person's RCAV(t) (ED) value is compared to.
This then
allows the person to visually track an RCAV (ED) (time period) value for
control of weight
maintenance and/or weight loss. In some embodiments, the pre-determined
targeted
optimum/desired ED range of the actual/potential RCAV(t) (ED) value is 0.5-1.6
kcal/gram.
In some embodiments, the pre-determined targeted optimum/desired ED range of
the
actual/potential RCAV(t) (ED) value is 0.8-1.2 kcal/gram. In some embodiments,
the pre-
determined targeted optimum/desired ED range of the actual/potential RCAV(t)
(ED) value is
1-1.25 kcal/gram. In some embodiments, the targeted pre-determined
optimum/desired ED
range of the actual/potential RCAV(t) (ED) value is 0.8 -0.9 kcal/gram.
[00158] In
one example, the person's pre-determined targeted optimum/desired ED
range on the scale (2) is defined by arrows (5). In one example, if the person
tracks the
actual/potential RCAV(t) (ED) on a daily basis and, at a particular time
during a day, for
example, at 3 PM, the graphical indicator (1) is within the range defined by
arrows (5), i.e.
within his or her pre-determined targeted optimum/desired ED range. Then, the
person
receives a real-time visual indication that, from this time and on, he or she
needs to eat foods
that have ED within the person's pre-determined targeted optimum/desired ED
range for
28
CA 02838996 2013-12-10
WO 2012/171019
PCT/US2012/041929
control of weight maintenance and/or weight loss until the next calculation
when the person
consumes the next food.
[00159] In
one example, the person tracks the actual/potential RCAV(t) (ED) value on
a daily basis and, at a particular time during a day, for example, at 3 PM,
the graphical
indicator (1) is to the right (4) of the range defined by arrows 105, i.e. to
the right of his/her
pre-determined targeted optimum/desired ED range. Then, the person receives a
real-time
visual indication that, from this time and on, he/she needs to eat foods that
have a lower ED
than the person's pre-determined targeted ED range to control his/her weight
maintenance
and/or weight loss until the next calculation is performed when the person
consumes the next
food.
[00160] In
one example, the person tracks the actual/potential RCAV(t) (ED) value on
a daily basis and, at a particular time during a day, for example, at 3 PM,
the graphical
indicator (1) is to the left (3) of the range defined by arrows (5), i.e. to
the left of his/her pre-
determined targeted ED range. Then, the person receives a real-time visual
indication that,
from this time and on, he/she can eat foods that have a higher ED than the
person's pre-
determined targeted ED range and would still maintain weight control and/or
lose weight
until the next calculation when the person consumes the next food.
[00161] In
some embodiments, the at least one indicator can be programmed to allow
the person to measure the actual/potential RCAV(t) (ED) value over an extended
period of
time (weeks, months, etc.) In some embodiments, the instant invention receives
data about
foods consumed by the person and, based on the data, adjusts the at least one
indicator's
visual presentation and/or spatial positioning within the display to reflect
(1) ED or (2) ED
and energy value of the consumed food.
[00162] In
some embodiments, the instant invention can provide a functionality of
inquiring to at least one food database to determine the ED of the consumed
food based on
29
CA 02838996 2013-12-10
WO 2012/171019
PCT/US2012/041929
the consumed food's ingredient(s)/nutrient(s) and the consumed amount. In
some
embodiments, the at least one food database is remotely located with respect
to the person's
computer device. In some embodiments, the at least one food database resides
at a person's
computer device and is updated periodically and/or automatically (e.g., real-
time).
[00163] In some embodiments, the instant invention can provide a
functionality of
allowing a person's computer device of the instant invention to communicate
with a website
(e.g., weight management website) to integrate information gathered or
provided by a
person's computer device of the instant invention into a weight
control/management product
offered by the website.
[00164] For example, in some embodiments, the instant invention can
additionally
visually track a person's physical activity over a period of time. For
example, in some
embodiments, the instant invention visually tracks, over a period of time,
both a person's
physical activity and the actual/potential RCAV(t) (ED) value as parts of the
same equation.
[00165] Examples of Illustrative Operating Environments
[00166] Examples of Figure 2
[00167] FIG. 2 illustrates one embodiment of an environment in which
the present
invention may operate. However, not all of these components may be required to
practice the
invention, and variations in the arrangement and type of the components may be
made
without departing from the spirit or scope of the invention. In some
embodiments, the instant
invention can host a large number of persons and concurrent transactions. In
other
embodiments, the instant invention can be based on a scalable computer and
network
architecture that incorporates varies strategies for assessing the data,
caching, searching, and
database connection pooling. An example of the scalable architecture is an
architecture that is
capable of operating multiple servers.
CA 02838996 2013-12-10
WO 2012/171019
PCT/US2012/041929
[00168] In
embodiments, persons' computer devices 102-104 include virtually any
computing device capable of receiving and sending a message over a network,
such as
network 105, to and from another computing device, such as servers 106 and
107, each other,
and the like. In embodiments, the set of such devices includes devices that
typically connect
using a wired communications medium such as personal computers, multiprocessor
systems,
microprocessor-based or programmable consumer electronics, network PCs, and
the like. In
embodiments, the set of such devices also includes devices that typically
connect using a
wireless communications medium such as cell phones, smart phones, pagers,
walkie talkies,
radio frequency (RF) devices, infrared (IR) devices, CBs, integrated devices
combining one
or more of the preceding devices, or virtually any mobile device, and the
like. Similarly, in
embodiments, persons' computer devices 102-104 are any device that is capable
of
connecting using a wired or wireless communication medium such as a PDA,
POCKET PC,
wearable computer, and any other device that is equipped to communicate over a
wired
and/or wireless communication medium.
[00169] In some embodiments, each person computer device within client
devices 102-
104 can include a browser application that is configured to receive and to
send web pages,
and the like. In embodiments, the browser application is configured to receive
and display
graphics, text, multimedia, and the like, employing virtually any web based
language,
including, but not limited to Standard Generalized Markup Language (SMGL),
such as
HyperText Markup Language (HTML), a wireless application protocol (WAP), a
Handheld
Device Markup Language (HDML), such as Wireless Markup Language (WML),
WMLScript, JavaScript, and the like. In embodiments, persons' computer devices
102-104
can be programmed in either Java or .Net.
[00170] In
some embodiments, persons' computer devices 102-104 are further
configured to receive a message from the another computing device employing
another
31
CA 02838996 2013-12-10
WO 2012/171019
PCT/US2012/041929
mechanism, including, but not limited to email, Short Message Service (SMS),
Multimedia
Message Service (MMS), instant messaging (IM), internet relay chat (IRC),
mIRC, Jabber,
and the like.
[00171] In some embodiments, network 105 is configured to couple one
computing
device to another computing device to enable them to communicate. In
embodiments,
network 105 is enabled to employ any form of computer readable media for
communicating
information from one electronic device to another. Also, in embodiments,
network 105
includes a wireless interface, and/or a wired interface, such as the Internet,
in addition to local
area networks (LANs), wide area networks (WANs), direct connections, such as
through a
universal serial bus (USB) port, other forms of computer-readable media, or
any combination
thereof. In embodiments, on an interconnected set of LANs, including those
based on
differing architectures and protocols, a router acts as a link between LANs,
enabling
messages to be sent from one to another.
[00172] Also, in some embodiments, communication links within LANs
typically
include twisted wire pair or coaxial cable, while communication links between
networks may
utilize analog telephone lines, full or fractional dedicated digital lines
including T1, T2, T3,
and T4, Integrated Services Digital Networks (ISDNs), Digital Subscriber Lines
(DSLs),
wireless links including satellite links, or other communications links known
to those skilled
in the art. Furthermore, in embodiments, remote computers and other related
electronic
devices could be remotely connected to either LANs or WANs via a modem and
temporary
telephone link. In essence, in embodiments, network 105 includes any
communication
method by which information may travel between client devices 102-104, and
servers 106
and 107.
[00173] Examples of Figure 3
32
CA 02838996 2013-12-10
WO 2012/171019
PCT/US2012/041929
[00174]
FIG. 3 shows the computer and network architecture of some embodiments of
the instant invention. The persons' computer devices 202a, 202b thru 202n
shown, each
comprises a computer-readable medium, such as a random access memory (RAM) 208
coupled to a processor 210. The processor 210 executes computer-executable
program
instructions stored in memory 208. Such processors comprise a microprocessor,
an ASIC,
and state machines. Such processors comprise, or are be in communication with,
media, for
example computer-readable media, which stores instructions that, when executed
by the
processor, cause the processor to perform the steps described herein.
Embodiments of
computer-readable media include, but are not limited to, an electronic,
optical, magnetic, or
other storage or transmission device capable of providing a processor, such as
the processor
210 of client 202a, with computer-readable instructions. Other examples of
suitable media
include, but are not limited to, a floppy disk, CD-ROM, DVD, magnetic disk,
memory chip,
ROM, RAM, an ASIC, a configured processor, all optical media, all magnetic
tape or other
magnetic media, or any other medium from which a computer processor can read
instructions. Also, various other forms of computer-readable media transmit or
carry
instructions to a computer, including a router, private or public network, or
other transmission
device or channel, both wired and wireless. The instructions comprise code
from any
computer-programming language, including, for example, C, C++, C#, Visual
Basic, Java,
Python, Perl, and JavaScript.
[00175] The persons' computer devices 202a-n can also comprise a number of
external
or internal devices such as a mouse, a CD-ROM, DVD, a keyboard, a display, or
other input
or output devices. Examples of persons' computer devices 202a-n are personal
computers,
digital assistants, personal digital assistants, cellular phones, mobile
phones, smart phones,
pagers, digital tablets, laptop computers, Internet appliances, and other
processor-based
devices. In general, a person device 202a are be any type of processor-based
platform that is
33
CA 02838996 2013-12-10
WO 2012/171019
PCT/US2012/041929
connected to a network 206 and that interacts with one or more application
programs. The
persons' computer devices 202a-n operate on any operating system capable of
supporting a
browser or browser-enabled application, such as MicrosoftTM, WindowsTM, or
Linux. The
persons' computer devices 202a-n shown include, for example, personal
computers executing
a browser application program such as Microsoft Corporation's Internet
ExplorerTM, Apple
Computer, Inc.'s SafariTM, Mozilla Firefox, and Opera.
[00176]
Through the persons' computer devices 202a-n, persons 212a-n of the instant
invention can communicate over the network 206 with a centralized computer
system, and/or
each other, and/or with other systems and devices coupled to the network 206.
As shown in
FIG. 3, server devices 204 and 213 are also coupled to the network 206.
[00177] In
some embodiments, the instant invention can utilize NFC technology to
obtain/transmit information. In some embodiments, NFC can represent a short-
range
wireless communications technology in which NFC-enabled devices are "swiped,"
"bumped,"
"tap" or otherwise moved in close proximity to communicate. In some
embodiments, NFC
could include a set of short-range wireless technologies, typically requiring
a distance of 10
cm or less. In some embodiment, NFC can operates at 13.56 MHz on ISO/IEC 18000-
3 air
interface and at rates ranging from 106 kbit/s to 424 kbit/s. In some
embodiments, NFC can
involve an initiator and a target; the initiator actively generates an RF
field that can power a
passive target. In some embodiment, this can enable NFC targets to take very
simple form
factors such as tags, stickers, key fobs, or cards that do not require
batteries. In some
embodiments, NFC peer-to-peer communication can be conducted when a plurality
of NFC-
enable device within close proximity of each other.
[00178] In
some embodiments, NFC tags can contain data and be read-only or
rewriteable. In some embodiment, NFC tags can be custom-encoded. In some
embodiments,
NFC tags and/or NFC-enabled device (e.g., smart phones with NFC capabilities)
can
34
CA 02838996 2013-12-10
WO 2012/171019
PCT/US2012/041929
securely store personal data such as debit and credit card information,
loyalty program data,
PINs and networking contacts, and/or other information. NFC tags can be
encoded to pass a
Uniform Resource Locator (URL) and a processor of the NFC-enabled device can
automatically direct a browser application thereof to the URL without
prompting for
permission to proceed to the designated location.
[00179] In
some embodiments, lottery data may also be communicated using any
wireless means of communication, such as 4G, 3G, GSM, GPRS, WiFi, WiMax, and
other
remote local or remote wireless communication using information obtained via
the
interfacing of a wireless NFC enabled mobile device to another NFC enabled
device or a
NFC tag. In some embodiments, the term "wireless communications" includes
communications conducted at ISO 14443 and ISO 18092 interfaces. In some
embodiments,
the communications between person's NFC-enabled smart device and lottery
provided
equipment (e.g., terminals, POS, POE, Hosts) is performed, for example, in
accordance with
the ISO 14443A/B standard and/or the ISO 18092 standard.
[00180] In some embodiments, player's NFC-enabled smart device and/or
lottery
provided equipment (e.g., terminals, POS, POE, Hosts) can include one or more
additional
transceivers (e.g., radio, Bluetooth, and/or WiFi transceivers) and associated
antennas, and
enabled to communicate with each other by way of one or more mobile and/or
wireless
protocols. In some embodiments, NFC tags can include one or more integrated
circuits.
[00181] In some embodiments, person's NFC-enabled smart device may include
a
cellular transceiver coupled to the processor and receiving a cellular network
timing signal.
In some embodiments, person's NFC-enabled smart device may further include a
satellite
positioning receiver coupled to the processor and receiving a satellite
positioning system
timing signal, and the processor may accordingly be configured to synchronize
the internal
timing signal to the satellite positioning system timing signal as the
external timing signal. In
CA 02838996 2013-12-10
WO 2012/171019
PCT/US2012/041929
some embodiments, the processor of person's NFC-enabled smart device may be
configured
to synchronize the internal timing signal to the common external system timing
signal via the
NFC circuit.
[00182] Another Examples of visually tracking the actual RCV(t), the
actual
RCAV(t), the potential RCV(t), and/or the potential RCAV(t) based on
ED
[00183] Examples of Figure 4
[00184] Figure 4 illustrates, for example, the scale, the graphical
indicator in a shape of
a person, and the position of the graphical indicator with respect to a
particular
optimum/desired range identified on the scale, in accordance with some
embodiments of the
present invention. Figure 4 shows that on Tuesday, March 1st, a computer
device
programmed in accordance with the instant invention could receive information
about a
hypothetical person that can identify 3 foods and an amount of each of three
foods that the
person has consumed or contemplates to consume. Then, the programmed device of
the
instant invention and/or a remotely located computer system of the instant
invention, in
accordance with some embodiments, calculates the actual RCAV(t) (ED) value of
the person
if food has been consumed or the potential RCAV(t) (ED) value (what-if
scenario) if the
person would have consumed these three foods. Subsequently, the instant
invention would
adjust the visual positioning of the graphical indicator on the scale to show
the
actual/potential RCAV(t) (ED) value of the person with respect to the pre-
determined
optimum/desired range/value of the ED. In some embodiments, the pre-determined
optimum/desired range/value can be a single number value or a position on the
scale. Figure
4, for example, conveys to the person that he or she needs to eat low ED foods
to bring the
graphical indicator (i.e., the person's the actual/potential RCAV(t) (ED)
value) within the
optimum/desired range. In some embodiments, the computer devices programmed in
36
CA 02838996 2013-12-10
WO 2012/171019
PCT/US2012/041929
accordance with the instant invention can track the progress of person's
weight maintenance
and/or weight loss.
[00185] Examples of Figure 5
[00186] Figure 5 illustrates, for example, the scale, the graphical
indicator and a
position of the graphical indicator with respect to a pre-determined target
optimum/desired
range/value identified on the scale, in accordance with some embodiments of
the present
invention. As shown in Figure 5, the visual tracking provides to the person
the real-time
information that, for example, the person's actual/potential RCAV(t) (ED)
value exceeds the
pre-determined targeted optimum/desired range of ED based on the current food
intake
and/or potential future food intake.
[00187] Examples of Figure 6
[00188] Figure 6 illustrates, for example, the scale, the graphical
indicator and a
position of the graphical indicator with respect to a pre-determined targeted
optimum/desired
range/value identified on the scale, in accordance with some embodiments of
the present
invention. As shown in Figure 6, the visual tracking provides to the person
the real-time
information that, for example, the person's actual/potential RCAV(t) (ED)
value is within the
pre-determined targeted optimum/desired range/value of ED based on the current
food intake
and/or potential future food intake.
[00189] Examples of Figure 7
[00190] Figure 7 illustrates, for example, the scale, the graphical
indicator and a
position of the indicator with respect to a pre-determined targeted
optimum/desired
range/value identified on the scale, in accordance with some embodiments of
the present
invention. Figures 4 and 7 show that the size of the pre-determined targeted
optimum/desired
range/value can vary. In some embodiments, the size of the pre-determined
targeted
optimum/desired range/value can vary based, at least in part, on person's
individual
37
CA 02838996 2013-12-10
WO 2012/171019
PCT/US2012/041929
characteristic(s). In
some embodiments, the size of the pre-determined targeted
optimum/desired range can vary based on characteristic(s) of a group of
persons within which
the person is categorized by the instant invention.
[00191] Examples of Figures 8 and 9
[00192] As shown in Figure 8, the instant invention can provide a visual
historical
prospective to the tracked living factor(s) of the person. For example, by
selecting an option
(806), the instant invention provides a visual history prospective on the
person's living
factor(s) during a particular day ("Daily View.") For example, by selecting an
option (807),
the instant invention provides the visual history prospective on the person's
living factor(s)
during a particular week ("Weekly View.") In some embodiments, the person is
not required
to re-set the visual tracking because of the offered functionality to receive
the visual history
of the tracking his or her individual living factor(s). In some embodiments,
the person is
presented, at the same time, with one or more visual snapshots of historical
information for
particular period(s) of time. For example, as shown in Figure 9, the person is
presented with
visual historical information for his or her status for four time periods: 1)
the status as of the
current date; 2) the status for the current week as of the current date; 3)
the status for the
previous week; and 4) the status since the beginning of the visual tracking
and/or since the
last re-set.
[00193] Examples of Figures 10 and 11
[00194] In some embodiments, the person is presented with a functionality
to store
within the App and/or the programmed computer system of the instant invention
one or more
foods that the person repeatedly consumes and/or intends to consume. For
example, as
shown in Figure 10, the App and/or the programmed computer system of some
embodiments
of the instant invention can store one or more lists of foods that the person
consumes and/or
intends to consume on the daily basis (1008). For instance, the person can
have a first list for
38
CA 02838996 2013-12-10
WO 2012/171019
PCT/US2012/041929
Monday and Tuesday, have another list for Wednesday, and/or have another list
for
Wednesday through Sunday. In another example, as shown in Figure 10, the App
and/or the
programmed computer system of some embodiments of the instant invention can
offer a
functionality to search (1009) one or more databases (e.g., private and/or
public databases)
for a certain food if the person does not know the ingredient(s) of a
particular food and/or the
ingredient(s)' amount(s), energy value(s), etc. For example, the person can
submit a brand
name or a type of food, and the search functionality would guide the person
through the
search wizard to identify the exact food of interest. In another example, the
person can
submit a restaurant name, and the search functionality (1009) would guide the
person through
a menu of that particular restaurant to identify food(s) consumed and/or
contemplated to be
consumed and determine the ED values and other characteristics of the food. In
yet another
example, after the search functionality (1009) has identified a particular
food, the App and/or
the programmed computer system of some embodiments of the instant invention
can store the
identified food in a database and associated the food with the person so that
the food can be
recalled in the future without the searching.
[00195] For
example, as shown in Figure 11, the App and/or the programmed
computer system of some embodiments of the instant invention can offer a
functionality to
the person to submit information about the food that the person consumes
and/or considers to
consume (e.g., "what-if" scenarios) if the person already knows such
information. For
example, as shown in Figure 11, the person may know a name of the food, a
portion size,
calories, or other characteristics (see examples below.) Further, as shown in
Figure 11, the
App and/or the programmed computer system of some embodiments of the instant
invention
can restrict the person from submitting information about the consumption of
beverages such
as non-milk-based beverages.
39
CA 02838996 2013-12-10
WO 2012/171019
PCT/US2012/041929
[00196] Further, the App and/or the programmed computer system of some
embodiments of the instant invention provide a functionality to determine a
future effect of
engaging and/or abstaining from particular activity(ies) (e.g., eating a
banana, not eating a
banana, eating two bananas, running a mile, running two miles, not running two
miles, etc.) --
a forward looking what-if scenarios. For example, after the person submits
information about
a particular what-if scenario, the App and/or the programmed computer system
of some
embodiments of the instant invention provides a visual output to show how the
characteristic(s) of the graphical indicator change(s) (e.g., its shape,
color, position, etc.)
would change with respect to the optimum range of the ED shown in Figures 4-7.
For
instance, with respect to Figure 4, the instant invention can determine and
visually inform the
person by moving the graphical indicator more towards the right end of the
scale (i.e., further
away from the target optimum/desired range) or moving the graphical indicator
more towards
the target optimum/desired range what would happen if the person eats a
particular food (e.g.,
a cupcake).
[00197] Examples of Figures 12-14
[00198] In some embodiments, as shown in Figures 12-14, the instant
invention
provides functionality(ies) that allow(s) the person to actively switch
between the
presentation of the graphical indicator of the visual tracking and practical
advices that are
provided based on particular activity(ies) that the person has engaged or
considers to engage
in (e.g., what-if scenarios). For example, if the person consumed certain
food, the App
and/or the programmed computer system of the instant invention adjust the
visual
representation of the graphical indicator and provide the person with a
practical tip that is
related to the consumed food or a goal that the person desires to achieve. In
one example, if
the person's goal is to lose weight and the person ate a piece of chocolate
cake, the App
and/or the programmed computer system of the instant invention can provide an
active link
CA 02838996 2013-12-10
WO 2012/171019
PCT/US2012/041929
from the graphical indicator or the area around the graphical indicator to a
practical tip about
a substitute food with less ED than the piece of chocolate cake.
[00199] Examples of visually tracking the actual RCV(t), the actual
RCAV(t),
the potential RCV(t), and/or the potential RCAV(t) based on FED
[00200] In some embodiments, the instant invention visually tracks the
actual/potential
RCV(t) (FED) value of food servings consumed and/or contemplated to be
consumed by the
person. In some embodiments, the instant invention visually tracks
actual/potential RCV(t)
(FED) value of food servings consumed and/or contemplated to be consumed by
the person
in accordance with, but not limited to, the following equation:
RCV(t) (FED) = (FED(1) of food serving(1)/factor data ("FAC") + FED(2) of food
serving(2)/FAC +...+ FED(n) of food serving(n)/FAC ) (2);
where the targeted optimum/desired range/value shown at a particular time is
representative
of a portion of PWNB attributed to a time from the beginning of the tracking
period to the
particular time at which the actual/potential RCV(t) (FED) value is
calculated. For example,
if PWNB is 52, the tracking period is 48 hours, and the actual/potential
RCV(t) (FED) value
is calculated after 12 hours from the start of the tracking period, then the
shown targeted
optimum/desired range/value is 13 -- 52 / (48/12).
[00201] Food servings can be specified in various ways, and preferably
in ways that
are meaningful to consumers according to their local dining customs. Food
servings may be
specified by weight, mass, size or volume, or according to customary ways of
consuming
food in the relevant culture. For example, in the United States it is
customary to use measures
such as cups, quarts, teaspoons, tablespoons, ounces, pounds, or even a
"pinch", in Europe, it
is more common to use units such as liters, deciliters, grams and kilograms.
In China and
Japan it is also appropriate to use a measure such as a standard mass or
weight held by
chopsticks when consuming food.
41
CA 02838996 2013-12-10
WO 2012/171019
PCT/US2012/041929
[00202] In
certain embodiments, food energy data is produced based on protein energy
data representing the protein energy content, carbohydrate energy data
representing the
carbohydrate energy content and fat energy data representing the fat energy
content, of a
candidate food serving, by applying respective weight data to weight each of
the protein
energy data, the carbohydrate energy data and the fat energy data, each of the
weight data
representing the relative metabolic conversion efficiency of the corresponding
nutrient and
forming the food energy data based on a sum of the weighted protein energy
data, the
weighted carbohydrate energy data and the weighted fat energy data. The data
for the various
nutrients is provided either by the consumer or by another source based on
data from the
consumer, such as food identification data. If the protein energy data is
represented as
"PRO", the carbohydrate energy data as "CHO" and the fat energy data as "FAT",
in certain
ones of such embodiments, the food energy data (represented as "FED") is
obtained by
processing the data in the manner represented by the following equation:
FED=(Wpro X PRO)+(Wcho X CHO)+(Wfat X FAT), (3)
where Wpro represents the respective weighting data for PRO, Wcho represents
the
respective weighting data for CHO and Wfat represents the respective weighting
data for
FAT. In certain ones of such embodiments, Wpro is selected from the range
0.7.1 < Wpro <
0.8, Wcho is selected from the range 0.9 < Wcho < 0.95 and Wfat is selected
from the range
0.97 < Wfat < 1Ø In certain ones of such embodiments, Wpro is substantially
equal to 0.8,
Wcho is substantially equal to 0.95 and Wfat is substantially equal to 1Ø
Various measures
of energy can be employed, such as kilocalories (kcal) and kilojoules (kJ).
[00203] In
certain embodiments, food energy data is produced based on protein data
representing the mass or weight of the protein content (represented as PROm),
carbohydrate
data representing the mass or weight of the carbohydrate content (represented
as CH0m) and
fat data representing the mass or weight of the fat content (represented as
FATm), of a
42
CA 02838996 2013-12-10
WO 2012/171019
PCT/US2012/041929
candidate food serving. In such embodiments, the protein data, carbohydrate
data and fat data
are converted to energy data in producing the food energy data, by processing
the protein
data, carbohydrate data and fat data in the manner represented by the
following equation:
FED=(Wpro X Cp X PROm)+(Wcho X Cc X CH0m) (Wfat X Cf- X FATm), (4)
where Cp is a conversion factor for converting PROm to data representing the
energy content
of PROm, Cc is a conversion factor for converting CHOm to data representing
the energy
content of CHOm, and Cf is a conversion factor for converting FATm to data
representing
the energy content of FATm. For example where the food energy data is
represented in
kilocalories and PROm, CHOm and FATm are expressed in grams, Cp is selected as
4
kilocalories/gram, Cc is selected as 4 kilocalories/gram and Cf is selected as
9
kilocalories/gram. Mass and weight data can be expressed in the alternative by
units such as
ounces and pounds.
[00204] In
certain embodiments, food energy data is produced based on total food
energy data representing the total energy content, protein energy data
representing the protein
energy content, and dietary fiber energy data representing the dietary fiber
energy content, of
a candidate food serving. More specifically, the food energy data is produced
by separating
data representing the protein energy content and the dietary fiber energy
content (if present)
from the total food energy data to produce reduced energy content data,
applying respective
weight data to weight each of the protein energy data and the dietary fiber
energy data, each
of the weight data representing the relative metabolic conversion efficiency
of the
corresponding nutrient and forming the food energy data based on a sum of the
reduced
energy content data, the weighted protein energy data, and the weighted
dietary fiber energy
data. The data for the various nutrients is provided either by the consumer or
by another
source based on data from the consumer, such as food identification data. If
the total food
energy data is represented as "TFE", protein energy data is represented as
"PRO" and the
43
CA 02838996 2013-12-10
WO 2012/171019
PCT/US2012/041929
dietary fiber energy data as "DF", in certain ones of such embodiments where
TFE includes
an energy component of DF (as in the case of foods labeled according to
practices adopted in
the US and in the Dominion of Canada (CA)), the food energy data is obtained
by processing
the data in the manner represented by the following equation:
FED=(TFE-PRO-DF)+(Wpro X PRO)+(Wdf X DF), (5)
where Wpro represents the respective weighting data for PRO and Wdf represents
the
respective weighting data for DF. In certain ones of such embodiments, Wpro is
selected
from the range 0.7 < Wpro < 0.8 and Wdf is selected from the range O<Wdf <
0.5. In certain
ones of such embodiments, Wpro is substantially equal to 0.8 and Wdf is
substantially equal
to 0.25. Various measures of energy can be employed, such as kilocalories
(kcal) and
kilojoules (kJ).
[00205] For
those instances where TFE does not include a dietary fiber component (as
in the case of foods labeled according to practices adopted in Australia (AU)
and the
countries of central Europe (CE)), the process of equation (3) is modified to
the following
form:
FED=(TFE-PRO)+(Wpro X PRO)+(Wdf X DF). (6)
[00206] In
certain embodiments, food energy data is produced based both on the total
food energy data, as well as on protein data representing the mass or weight
of the protein
content (represented as PROm) and dietary fiber data representing the mass or
weight of the
dietary fiber content (represented as DFm), of a candidate food serving. In
such embodiments
and for foods labeled as in the US and CA, the protein data and dietary fiber
data are
converted to energy data in producing the food energy data, by processing the
total food
energy data, the protein data and dietary fiber data in the manner represented
by the following
equation:
FED=[TFE-(Cp X PROm)-(Cdf X DFm)]+(Wpro X Cp X PROm)+(Wdf X Cdf X DFm), (7)
44
CA 02838996 2013-12-10
WO 2012/171019
PCT/US2012/041929
where Cp is a conversion factor for converting PROm to data representing the
energy content
of PROm and Cdf is a conversion factor for converting DFm to data representing
an energy
content of DFm. For example where the food energy data is represented in
kilocalories and
PROm and DFm are expressed in grams, Cp is selected as 4 kilocalories/gram and
Cdf is
selected as 4 kilocalories/gram. Mass and weight data can be expressed in the
alternative by
units such as ounces and pounds.
[00207] For
those instances where TFE does not include a dietary fiber component (as
in the case of foods labeled according to practices adopted in AU and CE), the
process of
equation (5) is modified to the following form:
FED=[TFE-(Cp X PROm)]+(Wpro X Cp X PROm)+(Wdf X Cdf X DFm). (8)
[00208] In
certain embodiments, food energy data is produced based on protein data
representing the protein energy content of a candidate food serving,
carbohydrate data
representing its carbohydrate energy content, fat data representing its fat
energy content, and
dietary fiber data representing its dietary fiber energy content. This data is
provided either by
the consumer or from another source based on data from the consumer, such as
food
identification data. If the protein energy data is represented as "PRO", the
carbohydrate
energy data as "CHO", the fat energy data as "FAT", and the dietary fiber
energy data as
"DF", in certain ones of such embodiments, the food energy data (represented
as "FED") is
obtained by processing the data in the manner represented by the following
equation:
FED=PRO+CHO+FAT+DF. (9)
[00209] In
certain ones of such embodiments, food energy data is produced based on
the protein energy data, the carbohydrate energy data, the fat energy data,
and the dietary
fiber energy data, of the candidate food serving, by applying respective
weight data to weight
each of the protein energy data, the carbohydrate energy data, the fat energy
data and the
dietary fiber energy data representing its relative metabolic conversion
efficiency and
CA 02838996 2013-12-10
WO 2012/171019
PCT/US2012/041929
forming the food energy data based on a sum of the weighted protein energy
data, the
weighted carbohydrate energy data, the weighted fat energy data and the
weighted dietary
fiber energy data. If Wpro represents the respective weighting data for PRO,
Wcho represents
the respective weighting data for CHO, Wfat represents the respective
weighting data for
FAT and Wdf represents the respective weighting data for dietary fiber, in
certain ones of
such embodiments, the food energy data (represented as "FED") is obtained by
processing the
data in the manner represented by the following equation:
FED=(Wpro X PRO)+(Wcho X CHO)+(Wfat X FAT)+(Wdf X DF). (10)
[00210] In
certain ones of such embodiments, Wpro is selected from the range 0.7 <
Wpro < 0.8, Wcho is selected from the range 0.9 < Wcho < 0.95, Wfat is
selected from the
range 0.97 < Wfat < 1.0 and Wdf is selected from the range O<Wdf < 0.5 In
certain ones of
such embodiments, Wpro is substantially equal to 0.8, Wcho is substantially
equal to 0.95,
Wfat is substantially equal to 1.0 and Wdf is substantially equal to 0.25.
[00211] In
certain embodiments, food energy data is produced based on protein data
representing the mass or weight of the protein content (represented as PROm),
carbohydrate
data representing the mass or weight of the carbohydrate content (represented
as CH0m), fat
data representing the mass or weight of the fat content (represented as FATm)
and dietary
fiber data representing the mass or weight of the dietary fiber content
(represented as DFm),
of a candidate food serving. In such embodiments, the protein data,
carbohydrate data, fat
data and dietary fiber data, are converted to energy data in producing the
food energy data, by
processing the protein data, carbohydrate data, fat data and dietary fiber
data in the manner
represented by the following equation:
FED=(Wpro X Cp X PROm)+(Wcho X Cc X CH0m) (Wfat X Cf X FATm)+(Wdf X Cdf X
DFm), (11)
46
CA 02838996 2013-12-10
WO 2012/171019
PCT/US2012/041929
where Cp is a conversion factor for converting PROm to data representing an
energy content
of PROm, Cc is a conversion factor for converting CHOm to data representing an
energy
content of CH0m, Cf is a conversion factor for converting FATm to data
representing an
energy content of FATm and Cdf is a conversion factor for converting DFm to
data
representing an energy content of DFm. For example where the food energy data
is
represented in kilocalories and PROm, CH0m, FATm and DFm are expressed in
grams, Cp
is selected as 4 kilocalories/gram, Cc is selected as 4 kilocalories/gram, Cf
is selected as 9
kilocalories/gram and Cdf is selected as 4 kilocalories/gram.
[00212] In
the US and in CA, where food labeling standards include a food product's
dietary fiber in its total carbohydrate amount in grams (represented as
"Total_CHOm"
herein), food energy data may instead be produced by processing the protein
data,
carbohydrate data, fat data and dietary fiber data in the manner represented
by the following
equation:
FED=(Wpro X Cp X PROm)+(Wcho X Cc X [Total_CHOm-DFm])+(Wfat X Cf X
FATm)+(Wdf X Cdf X DFm). (12)
[00213] In
certain embodiments, the food energy data is produced in a modified
fashion in order to discourage consumption of foods having a high saturated
fat content, so
that the food energy data (FED) is based both on the relative metabolic
conversion efficiency
of selected nutrients and weighting data that promotes consumption of
relatively more
healthful foods. In such embodiments, and where (as in the US and CA) food
labeling
standards include a food product's saturated fat (represented as "Sat_FATm"
herein) in its
total amount of fat in grams (represented as "Total_FATm" herein), the food
energy data is
produced by processing the protein data, carbohydrate data, fat data,
saturated fat data and
dietary fiber data in the manner represented by the following equation:
47
CA 02838996 2013-12-10
WO 2012/171019
PCT/US2012/041929
FED=(Wpro X Cp X PROm)+(Wcho X Cc X [Total_CHOm-DF- m])+(Wdf X Cdf X
DFm)+(Wfat X Cf X [Total_FATm-Sat_FATm])+- (Wsfat X Cf X Sat_Fatm), (13)
wherein Wsfat represents modified weighting data for Sat_FATm. In certain ones
of such
embodiments, Wpro is selected from the range 0.7 < Wpro < 0.8, Wcho is
selected from the
range 0.9 < Wcho < 0.95, Wfat is selected from the range 0.97 < Wfat < 1.0,
Wdf is selected
from the range O<Wdf < 0.5, and Wsfat is selected from the range 1.0 < Wsfat <
1.3. In
particular ones of such embodiments, Wpro is substantially equal to 0.8, Wcho
is
substantially equal to 0.95, Wfat is substantially equal to 1.0, Wdf is
substantially equal to
0.25 and Wsfat is substantially equal to 1.3.
[00214] The relatively higher value assigned to Wsfat is based, in part, on
the
desirability of discouraging consumption of saturated fat, due to the ill-
health effects
associated with this nutrient. The higher ranges and values of Wpro and Wcho
in the
presently disclosed embodiments relative to those employed in embodiments
disclosed
hereinabove, are useful for weight loss processes. That is, consumers engaged
in a weight
loss process by limiting their food energy consumption could, in some cases,
be encouraged
to eat foods higher in saturated fat if it is assigned a relatively higher
weight than other
nutrients, since this tends to reduce their overall food energy consumption.
By assigning
relatively higher ranges and values for Wpro and Wcho for use in processes
that also weight
saturated fat higher than unsaturated fat, the potential to encourage
consumption of saturated
fat is substantially reduced. Accordingly, the weights assigned to Wpro and
Wcho in the
presently disclosed embodiments are based both on the relative metabolic
conversion
efficiency of protein and carbohydrates and the desire to promote consumption
of relatively
more healthful foods.
[00215] In
certain embodiments, for foods containing alcohol, the foregoing processes
as represented by equation (11) are modified to add a term representing an
energy component
48
CA 02838996 2013-12-10
WO 2012/171019
PCT/US2012/041929
represented by the amount of alcohol in the food. Where the amount of alcohol
(by weight or
mass) is expressed in grams (represented as "ETOHm" herein), this term is
produced by
multiplying ETOHm by a weighting factor Wetoh and a conversion factor Cetoh,
where
Wetoh is selected from the range 1.0 < Wetoh < 1.3, and in particular ones of
such
embodiments is substantially equal to 1.29, and Cetoh is selected as 9
kilocalories/gram,
based on the principle that alcohol is metabolized in the same pathway as fat.
The higher
value assigned to Wetoh is based, in part, on the desirability of discouraging
consumption of
alcohol, due to the ill-health effects associated with this nutrient. Where a
food contains
alcohol, in certain embodiments its food energy data is produced by processing
PROm,
Total_CH0m, DFm, Total_FATm, Sat_FATm, and ETOHm in the manner represented by
the following equation:
FED=(Wpro X Cp X PROm)+(Wcho X Cc X [Total_CHOm-DFm])+(Wdf X Cdf X
DFm)+(Wfat X Cf X [Total_FATm-Sat_FATm])+- (Wsfat X Cf X Sat_Fatm) (Wetoh X
Cetoh X ETOHm). (14)
[00216] The process represented by equation (12) is modified for use in CE
and AU
and is represented as follows:
FED=(Wpro X Cp X PROm)+(Wcho X Cc X Total_CH0m) (Wdf X Cdf X DFm)+(Wfat X
Cf X [Total_FATm-Sat_FATm])+(Wsfat X Cf X Sat_FATm) (Wetoh X Cetoh X ETOHm).
(15)
[00217] In certain embodiments, for foods containing sugar alcohol, the
foregoing
processes as represented by equations (12) and (13) are modified to add a term
representing
an energy component represented by the amount of sugar alcohol in the food.
Where the
amount of sugar alcohol (by weight or mass) is expressed in grams (represented
as
"SETOHm" herein), this term is produced by multiplying SETOHm by a weighting
factor
Wsetoh and a conversion factor Csetoh, where Wsetoh is selected from the range
0.9 <
49
CA 02838996 2013-12-10
WO 2012/171019
PCT/US2012/041929
Wsetoh < 0.95, and in particular ones of such embodiments is substantially
equal to 0.95, and
Csetoh is selected from the range 0.2 to 4.0 kilocalories/gram, and in
particular ones of such
embodiments is substantially equal to 2.4. Where a food contains sugar
alcohol, in certain
embodiments its food energy data is produced by processing PROm, Total_CH0m,
DFm,
Total_FATm, Sat_FATm, ETOHm and SETOHm in the manner represented by the
following
equation:
FED=(Wpro X Cp X PROm)+(Wcho X Cc X [Total_CHOm-DFm-SETOHm])+(Wdf X Cdf
X DFm)+(Wfat X Cf X [Total_FATm-Sat_- FATm])+(Wsfat X Cf X Sat_Fatm)+(Wetoh X
Cetoh X ETOHm)+(Wsetoh X Csetoh X SETOHm). (16)
[00218] The process represented by equation (14) is modified for use in CE
and AU
and is represented as follows:
FED=(Wpro X Cp X PROm)+(Wcho X Cc X [Total_CHOm-SE- TOHm])+(Wdf X Cdf X
DFm)+(Wfat X Cf X [Total_FATm-Sat_FATm])+(Wsfat X Cf X Sat_Fatm) (Wetoh X
Cetoh X ETOHm)+(Wsetoh X Csetoh X SETOHm). (17)
[00219] For the person's convenience, the food energy data is converted to
simplified
whole number data for a candidate food serving by producing dietary data
expressed as whole
number data by dividing the food energy data by factor data, such as data
having a value of
35, and rounding the resulting value to produce the simplified whole number
data. (Of
course, to assign 35 as the value of the factor data is arbitrary, and any
other value such as 50,
60 or 70 may be used for this purpose.)
[00220] In
the manner described above, the consumer can easily track food
consumption throughout a period, such as a day or a week, (either manually or
with the
assistance of a data processing system) to ensure that a pre-determined sum of
the dietary
data for the food consumed bears a pre-determined relationship to a value of
pre-determined
whole number benchmark data based on one or more of the consumer's age, body
weight,
CA 02838996 2013-12-10
WO 2012/171019
PCT/US2012/041929
height, gender and activity level. For example, if the consumer is following a
weight loss
program, the pre-determined whole number benchmark data is set at a value
selected to
ensure that the consumer will lose weight at a safe rate if he or she consumes
an amount of
food during the period having a sum of dietary data that does not exceed the
pre-determined
whole number benchmark data.
[00221]
Since individual food energy needs vary with the individual's age, weight,
gender, height and activity level, in certain embodiments the pre-determined
whole number
benchmark data is selected based on one or more of these variables. In such
embodiments,
food energy needs are estimated based on methods published by the National
Academies
Press, Washington, D.C., USA in Dietary Reference Intakes for Energy,
Carbohydrates,
Fiber, Fat, Fatty Acids, Cholesterol, Protein and Amino Acids, 2005, pages 203
and 204.
More specifically, as explained therein these methods estimate that men aged
19 years and
older have a total energy expenditure (TEE) determined as follows:
TEE=864-(9.72 X age)+PA X (14.2 X weight+503 X height), (18)
and that women aged 19 years and older have a TEE determined as follows:
TEE=387-(7.31 X age)+PA X (10.9 X weight+660.7 X height), (19)
where age is given in years, weight in kilograms and height in meters.
[00222] In
such embodiments, these methods are employed on the basis that all
individuals have a "low active" activity level, so that the activity level
(PA) for men is set at
1.12 and PA for women is set at 1.14. The published methods assume a 10
percent
conversion cost regardless of the types and amounts of nutrients consumed;
consequently,
TEE is adjusted by subtracting 10 percent of the calculated TEE. Also, the
published method
of calculating TEE assigns an energy content of zero to certain foods having a
non-zero
energy content. The total energy content of such foods consumed within a given
day
generally falls within a range of 150 to 250 kilocalories, which may be
normalized as 200
51
CA 02838996 2013-12-10
WO 2012/171019
PCT/US2012/041929
kilocalories. Accordingly, TEE as determined by the published method is
adjusted to produce
adjusted TEE (ATEE) in a process represented by the following equation:
ATEE=TEE-(TEE X 0.10)+200, (20)
where ATEE and TEE are given in kilocalories.
[00223] For consumers carrying out a process of reducing body weight, the
pre-
determined whole number benchmark is obtained by subtracting an amount from
the adjusted
TEE selected to ensure a pre-determined weight loss over a pre-determined
period of time.
For example, a safe weight loss process can be selected to produce a loss of
two pounds per
week, or a consumption of 1000 kilocalories per day less than ATEE for a given
individual.
In this example, to produce the pre-determined whole number benchmark data
(PWNB),
where the factor data used to produce the dietary data for the candidate food
servings
(whether having a value of 35, 50, 60, 70 or other value) is represented as
FAC, such data is
produced by a process represented by the following equation:
PWNB=(ATEE-1000)/FAC. (21)
[00224] To achieve weight loss, the value of (ATEE-1000) in certain
embodiments is
selected to fall within a range of 1000 kilocalories to 2500 kilocalories, so
that if (ATEE-
1000) is less than 1000 kilocalories, then (ATEE is set equal to 1000
kilocalories, and if
(ATEE-1000) is greater than 2500 kilocalories, (ATEE-1000) is set equal to
2500
kilocalories. However, in various other embodiments, the upper limit of 2500
kilocalories
varies from 2000 to 3000 kilocalories, and the lower limit of 1000
kilocalories varies from
500 to 1500 kilocalories.
[00225] Examples of visually tracking the actual RCV(t), the actual
RCAV(t),
the potential RCV(t), and/or the potential RCAV(t) based on HD
[00226] In some embodiments, the instant invention visually tracks
actual/potential
RCAV(t) (HD) value of food consumed or contemplated to be consumed by the
person. In
52
CA 02838996 2013-12-10
WO 2012/171019
PCT/US2012/041929
some embodiments, the instant invention visually tracks actual/potential
RCV(t) (HD) value
of the person based on food servings in accordance with, but not limited to,
the following
equation:
RCV(t) (HD) = (HD(1) of food (1) + HD(2) of food (2) +...+ HD(n) of food (n))
(22);
where RCV(t) (HD) is visually compared to the targeted optimum/desired
range/value of HD
shown. In some embodiments, the targeted optimum/desired range/value of HD is
determined based on one or more groups of food considered to be most healthful
for the
person to consume.
[00227] In
certain embodiments, the relative healthfulness data is determined in a
manner that depends on a particular food group of the selected food. In
certain ones of such
embodiments, the healthfulness data is determined in a first, common manner
for foods
within a first metagroup comprising the following groups: beans, dry &
legumes; and oils.
The healthfulness data (HD) for these groups is obtained based on a linear
combination of fat
content data, saturated fat content data, sugar content data and sodium
content data for the
food. In one such embodiment, the healthfulness data is produced by processing
fat content
data (F_data), saturated fat content data (SF_data), sugar content data
(S_data) and sodium
content data (NA_data), as follows, wherein such data is determined as
explained
hereinbelow:
HD=[(2 X (SF_data+F_data)+S_data+NA_data1/4/kcal_DV (23)
where kcal_DV is determined as explained hereinbelow. The table of FIG. 15A
illustrates
how the foods in these groups are ranked according to their healthfulness
based on their
respective healthfulness data produced in accordance with the process
represented by, for
example, the equation (20) and a comparison thereof against the exemplary
comparison data
included therein. These values may be varied from place to place, from culture
to culture and
from time to time, to provide a fair comparison of available foods and food
products.
53
CA 02838996 2013-12-10
WO 2012/171019
PCT/US2012/041929
[00228] It
will also be appreciated that the food groups and metagroups, and the
corresponding procedures and comparison values, as disclosed herein may be
varied based on
variations in the foods and food products available from place to place,
culture to culture and
over time. They may also vary to accommodate the needs and desires of certain
segments of
the population, such as those with special needs (for example, diabetic
patients and those
living in extreme climates) and those with particular healthfulness goals
(which can vary, for
example, with physical activity level). Such groups, metagroups, procedures,
and comparison
values are selected based on the similarities of foods and the manner in which
related foods
vary in the amounts and types of nutrients that tend to affect their
healthfulness.
[00229] The value selected for kcal_DV is selected to represent a daily
calorie value
that depends on the purposes or needs of the class of consumers for whom the
relative
healthfulness data is provided. For example, if this class encompasses
individuals desiring to
loose body weight, the value of kcal_DV is selected as a daily calorie target
to ensure weight
loss, such as 1500 kcal. However, this value may differ from culture to
culture and from
country to country. For example, the energy needs of those living in China are
generally
lower than those living in the United States, so that kcal_DV may be selected
at a lower value
for Chinese individuals trying to reduce body weight than for those living in
the United
States. As a further example, if the class of consumers for whom the relative
healthfulness
data is provided encompasses athletes attempting to maintain body weight
during training,
kcal_DV may be set at a much higher level than 1500 kcal. For most purposes,
kcal_DV may
be selected in a range from 1000 kcal to 3000 kcal.
[00230] The
value of SF_data is determined relative to a recommended or otherwise
standardized limit on an amount or proportion of saturated fat to be included
in a person's
daily food intake. The recommended or otherwise standardized amount or
proportion of
saturated fat to be consumed daily is based on the person's presumed total
food energy intake
54
CA 02838996 2013-12-10
WO 2012/171019
PCT/US2012/041929
daily, and a proportion thereof represented by saturated fat. In certain
embodiments, for
consumers desiring to lose body weight, as explained hereinabove, a total food
energy intake
of 1500 kcal is assumed (although the amount may vary in other embodiments).
If, for
example, a maximum desirable percentage of saturated fat consumed as a
proportion of total
daily energy intake is assumed to be seven percent, then the total number of
calories in
saturated fat that the person consumes daily on such a diet should be limited
to about 105
kcal (of a total of 1500 kcal). Since fat contains about nine kcal per gram,
the person's daily
consumption of saturated fat in this example should be limited to about twelve
grams.
However, the recommended or standardized limit on the proportion or amount of
saturated fat
to be consumed may vary from one class of consumer to another, as well as from
country to
country and from culture to culture. SF_data is determined by comparison to
such a standard.
In this example, therefore, SF_data is determined as the ratio of (a) the mass
of saturated fat
in a standard amount of the food under evaluation, to (b) twelve grams. While
a different
procedure or other amounts or proportions may be employed in other embodiments
to
evaluate the saturated fat content of a food, it is desired to determine
SF_data in a manner
that is reasonably comparable to the ways in which F_data, S_data and NA_data
are
determined.
[00231]
Similarly to SF_data, the value of F_data is determined relative to a
recommended or otherwise standardized limit on the amount or proportion of
total fat to be
included in a person's daily food intake. In those embodiments in which it is
presumed that a
person consumes 1500 kcal daily and a recommended proportion or limit of
thirty percent of
energy consumption in the form of fat is adopted, this translates to fifty
grams of total fat on a
daily basis. In this example, therefore, and in particular for comparability
to SF_data, F_data
is determined as the ratio of (a) the mass of total fat in a standard amount
of the food under
evaluation, to (b) fifty grams. Of course, a different procedure or other
amounts or
CA 02838996 2013-12-10
WO 2012/171019
PCT/US2012/041929
proportions may be employed in other embodiments to evaluate the total fat
content of a
food.
[00232] In
a similar manner, the value of S_data is determined relative to a
recommended or otherwise standardized limit on the amount or proportion of
sugar to be
included in a person's daily food intake. In those embodiments in which it is
presumed that a
person consumes 1500 kcal daily and a recommended proportion or limit of ten
percent of
food energy intake in the form of sugar is adopted, this translates to thirty
eight grams of
sugar on a daily basis (at four kcal per gram of sugar). In this example,
therefore, and in
particular for comparability to SF_data and F_data, S_data is determined as
the ratio of (a)
the mass of sugar in a standard amount of the food under evaluation, to (b)
thirty eight grams.
Of course, a different procedure or other amounts or proportions may be
employed in other
embodiments to evaluate the sugar content of a food.
[00233] In
a manner similar to those described above, the value of NA_data is
determined relative to a recommended or otherwise standardized limit on the
amount or
proportion of sodium to be included in a person's daily food intake. In those
embodiments in
which a recommended limit of 2400 mg of sodium consumed daily is adopted,
NA_data is
determined as the ratio of (a) the mass of sodium in a standard amount of the
food under
evaluation, to (b) 2400 mg. Of course, a different procedure or other amounts
or proportions
may be employed in other embodiments to evaluate the sodium content of a food.
[00234] In such embodiments, the healthfulness data is determined in a
second,
common manner for foods within a second metagroup comprising the following
groups: beef
(cooked), cookies, cream & creamers, eggs, frankfurters, game (raw), game
(cooked), lamb
(cooked), luncheon meats, pizza, pork (raw), pork (cooked), sausage, snacks--
pretzels, veal
(raw) and veal (cooked). The healthfulness data (HD) for these groups is
obtained based on a
linear combination of the food's fat content data, saturated fat content data,
sugar content
56
CA 02838996 2013-12-10
WO 2012/171019
PCT/US2012/041929
data, sodium content data and ED data. In one such embodiment, the
healthfulness data is
produced by processing F_data, SF_data, S_data, NA_data and ED_data of the
food, as
follows, wherein F_data, SF_data, S_data and NA_data are obtained as explained
hereinabove:
HD=ED_data+([(2 X SF_data)+(2 X F_data)+NA_data+S_datal X 100/M_serving), (24)
where M_serving is the mass or weight of a standard serving of the food. In
this particular
embodiment, ED_data is obtained as the energy content of the food (in kcal)
divided by its
mass (in grams). The tables of FIGS. 15B and 15C illustrate how the foods in
these groups
are ranked according to their healthfulness based on their respective
healthfulness data
produced in accordance with the process represented by equation (21) and a
comparison
thereof against the exemplary comparison data included therein.
[00235] In
such embodiments, the healthfulness data is determined in a third, common
manner for foods within a third metagroup comprising the following groups:
beverages;
alcoholic beverages; sweet spreads¨jams, syrups, toppings & nut butters. The
healthfulness
data (HD) for these groups is obtained based on a linear combination of the
food's fat content
data, saturated fat content data, sugar content data, sodium content data and
ED data. In one
such embodiment, the healthfulness data is produced by processing F_data,
SF_data, S_data,
NA_data, ED_data and M_serving, as follows:
HD=(ED_data/3)+[(2 X SF_data)+(2 X F_data) (2 X S_data)+NA_datal/M_serving.
(25)
[00236] The table of FIG. 16A illustrates how the foods in these groups are
ranked
according to their healthfulness based on their respective healthfulness data
produced in
accordance with the process represented by equation (22) and a comparison
thereof against
the exemplary comparison data included therein.
[00237] In
such embodiments, the healthfulness data is determined in a fourth,
common manner for foods within a fourth metagroup comprising the following
groups:
57
CA 02838996 2013-12-10
WO 2012/171019
PCT/US2012/041929
cheese, dairy & non-dairy, hard; and cheese, cottage & cream. The
healthfulness data (HD)
for these groups is obtained based on a linear combination of the food's fat
content data,
saturated fat content data, sugar content data, sodium content data and ED
data. In one such
embodiment, the healthfulness data is produced by processing F_data, SF_data,
S_data,
NA_data, ED_data and M_serving, as follows:
HD=ED_data+[(4 X SF_data)+(4 X F_data)+S_data+NA_datal X 100- /M_serving. (26)
[00238] The
table of FIG. 16B illustrates how the foods in these groups are ranked
according to their healthfulness based on their respective healthfulness data
produced in
accordance with the process represented by equation (23) and a comparison
thereof against
the exemplary comparison data included in FIG. 16B.
[00239] In
such embodiments, the healthfulness data is determined in a fifth, common
manner for foods within a fifth metagroup comprising the following groups:
breads; bagels;
tortillas, wraps; breakfast--pancakes, waffles, pastries; and vegetable dishes
The healthfulness
data (HD) for these groups is obtained based on a linear combination of the
food's fat content
data, saturated fat content data, sugar content data, sodium content data and
ED data. In one
such embodiment, the healthfulness data is produced by processing F_data,
SF_data, S_data,
NA_data, ED_data and M_serving, as follows:
HD=ED_data+[(2 X SF_data)+F_data+S_data+(2 X NA_data)-DF_datal X
100/M_serving.
(27)
[00240] The value of DF_data is determined relative to a recommended or
otherwise
standardized minimum amount or proportion of dietary fiber to be included in a
person's
daily food intake. One such recommendation is that a minimum of ten grams of
dietary fiber
be consumed by a person for every 1000 kcal consumed daily. In those
embodiments in
which it is presumed that a person consumes 1500 kcal daily, this translates
to a
recommended minimum of fifteen grams of dietary fiber on a daily basis. Of
course, a
58
CA 02838996 2013-12-10
WO 2012/171019
PCT/US2012/041929
different procedure or other amounts or proportions may be employed in other
embodiments
to evaluate the recommended amount of dietary fiber to be consumed on a
periodic basis. In
this particular example, the value of DF_data is obtained as the ratio of the
mass of dietary
fiber in a standard serving of then food, to fifteen grams.
[00241] The table of FIG. 17A illustrates how the foods in these groups are
ranked
according to their healthfulness based on their respective healthfulness data
produced in
accordance with the process represented by equation (24) and a comparison
thereof against
the exemplary comparison data included in FIG. 17A.
[00242] In
such embodiments, the healthfulness data is determined in a sixth, common
manner for foods within a sixth metagroup comprising the following groups:
grains & pasta,
cooked; and grains & pasta, uncooked. The healthfulness data (HD) for these
groups is
obtained based on a linear combination of the food's fat content data,
saturated fat content
data, sugar content data, sodium content data, ED data and dietary fiber
content data. In one
such embodiment, the healthfulness data is produced by processing F_data,
SF_data, S_data,
NA_data, ED_data and DF_data, as follows:
HD=(ED_data/3)+[([SF_data+F_data+(2 X S_data)+(2 X NA_data)]/4) - DF_data] X
100/M_serving. (28)
[00243] The
table of FIG. 17B illustrates how the foods of the groups in the sixth
metagroup are ranked according to their healthfulness based on their
respective healthfulness
data produced in accordance with the process represented by equation (25) and
a comparison
thereof against the exemplary comparison data included in FIG. 17B.
[00244] In
such embodiments, the healthfulness data is determined in a seventh,
common manner for foods within a seventh metagroup comprising the following
groups:
breakfast cereals, hot, cooked; breakfast cereals, hot, uncooked; and fruit
salads. The
healthfulness data (HD) for these groups is obtained based on a linear
combination of the
59
CA 02838996 2013-12-10
WO 2012/171019
PCT/US2012/041929
food's saturated fat content data, fat content data, sugar content data,
sodium content data and
ED data. In one such embodiment, the healthfulness data is produced by
processing SF_data,
F_data, S_data, NA_data and ED_data, as follows:
HD=ED_data+[SF_data+(2 X F_data) (2 X S_data)+(2 X NA_data] X 100/M_serving.
(29)
[00245] The table of FIG. 18 illustrates how the foods in these groups are
ranked
according to their healthfulness based on their respective healthfulness data
produced in
accordance with the process represented by equation (26) and a comparison
thereof against
the exemplary comparison data included in FIG. 18.
[00246] In
such embodiments, the healthfulness data is determined in an eighth,
common manner for foods within an eighth metagroup comprising the following
groups:
bars; cakes and pastries; and candy. The healthfulness data (HD) for these
groups is obtained
based on a linear combination of the food's fat content data, saturated fat
content data, sodium
content data, ED data and sugar content data. In one such embodiment, the
healthfulness data
is produced by processing F_data, SF_data, NA_data, ED_data and S_data, as
follows:
HD=ED_data+[(2 X SF_data)+F_data+(2 X S_data)+(2 X NA_data)] X 100/M_serving.
(30)
[00247] The
table of FIG. 19 illustrates how the foods in these groups are ranked
according to their healthfulness based on their respective healthfulness data
produced in
accordance with the process represented by equation (27) and a comparison
thereof against
the exemplary comparison data included in FIG. 19.
[00248] In such embodiments, the healthfulness data is determined in a
ninth, common
manner for foods within a ninth metagroup comprising the following groups:
dips; dressings;
gravies; sauces; soups, condensed; soups, RTE; and spreads (other than sweet).
The
healthfulness data (HD) for these groups is obtained based on a linear
combination of the
food's fat content data, saturated fat content data, sodium content data,
sugar content data and
CA 02838996 2013-12-10
WO 2012/171019
PCT/US2012/041929
ED data. In one such embodiment, the healthfulness data is produced by
processing F_data,
SF_data, S_data, NA_data, and ED_data, as follows:
HD=ED_data+[(2 X SF_data)+F_data+S_data+(2 X NA_data)] X 100/M_serving. (31)
[00249] The
table of FIG. 20 illustrates how the foods in these groups are ranked
according to their healthfulness based on their respective healthfulness data
produced in
accordance with the process represented by equation (28) and a comparison
thereof against
the exemplary comparison data included in FIG. 20.
[00250] In
such embodiments, the healthfulness data is determined in a tenth, common
manner for foods within a tenth metagroup comprising the following groups:
beans, dry &
legumes dishes; beef dishes; breakfast mixed dishes; cheese dishes; chili,
stew; egg dishes;
fish & shellfish dishes; lamb dishes; pasta dishes; pasta, cooked; pork
dishes; poultry dishes;
rice & grains dishes; salads, main course; salads, side; sandwiches; veal
dishes and vegetarian
meat substitutes. The healthfulness data (HD) for these groups is obtained
based on a linear
combination of the food's fat content data, saturated fat content data, sodium
content data,
sugar content data and ED data. In one such embodiment, the healthfulness data
is produced
by processing F_data, SF_data, NA_data, S_data and ED_data, as follows:
HD=ED_data+[(2 X SF_data)+(2 X F_data)+S_data+(2 X NA_data)] X 100/M_serving.
(32)
[00251] The
tables of FIGS. 21A and 21B illustrate how the foods in these groups are
ranked according to their healthfulness based on their respective
healthfulness data produced
in accordance with the process represented by equation (29) and a comparison
thereof against
the exemplary comparison data included in FIGS. 21A and 21B.
[00252] In
such embodiments, the healthfulness data is determined in an eleventh,
common manner for foods within an eleventh metagroup comprising the following
groups:
fruit¨fresh, frozen & dried; and fruit & vegetable juices. The healthfulness
data (HD) for
these groups is obtained based on a linear combination of the food's sodium
content data,
61
CA 02838996 2013-12-10
WO 2012/171019
PCT/US2012/041929
sugar content data, saturated fat content data, fat content data and ED data.
In one such
embodiment, the healthfulness data is produced by processing NA_data, S_data,
SF_data,
F_data and ED_data, as follows:
HD=ED_data+[(2 X S_data)+NA_data+SF_data+F_data] X 100/M_serving. (33)
[00253] The table of FIG. 22A illustrates how the foods in these groups are
ranked
according to their healthfulness based on their respective healthfulness data
produced in
accordance with the process represented by equation (30) and a comparison
thereof against
the exemplary comparison data included in FIG. 22A.
[00254] In
such embodiments, the healthfulness data is determined in a twelfth,
common manner for foods within a twelfth metagroup comprising the following
groups:
vegetables, raw; and vegetables, cooked. The healthfulness data (HD) for these
groups is
obtained based on a linear combination of the food's sodium content data,
sugar content data,
saturated fat content data, fat content data and ED data. In one such
embodiment, the
healthfulness data is produced by processing NA_data, S_data, SF_data. F_data
and ED_data
as follows:
HD=ED_data+[S_data+(1.5 X NA_data) (5 X SF_data) (5 X F_data)] X
100/M_serving.
(34)
[00255] The
table of FIG. 22B illustrates how the foods in these groups are ranked
according to their healthfulness based on their respective healthfulness data
produced in
accordance with the process represented by equation (31) and a comparison
thereof against
the exemplary comparison data included in FIG. 22B.
[00256] In
such embodiments, the healthfulness data is determined in a thirteenth,
common manner for foods within a thirteenth metagroup comprising the following
groups:
gelatin, puddings; ice cream desserts; ice cream novelties; ice cream,
sherbet, sorbet; sweet
pies; and sweets--honey, sugar, syrup, toppings. The healthfulness data (HD)
for these groups
62
CA 02838996 2013-12-10
WO 2012/171019
PCT/US2012/041929
is obtained based on a linear combination of the food's sodium content data,
fat content data,
saturated fat content data, sugar content data, and ED data. In one such
embodiment, the
healthfulness data is produced by processing NA_data, F_data, SF_data, S_data,
and
ED_data, as follows:
HD=ED_data+[(2 X SF_data)+F_data+NA_data+(2 X S_data)] X 100/M_serving. (35)
[00257] The
table of FIG. 23 illustrates how the foods in these groups are ranked
according to their healthfulness based on their respective healthfulness data
produced in
accordance with the process represented by equation (32) and a comparison
thereof against
the exemplary comparison data included in FIG. 23.
[00258] In such embodiments, the healthfulness data is determined in a
fourteenth,
common manner for foods within the following group: breakfast cereals, RTE.
The
healthfulness data (HD) for this group is obtained based on the saturated fat
content data of
the food, as well as its fat content data, sugar content data, sodium content
data, dietary fiber
content data and ED data. In one such embodiment, the healthfulness data is
produced by
processing SF_data, F_data, S_data, NA_data, DF_data and ED_data, as follows:
HD=(ED_data/3)+[(2 X S_data)+SF_data+F_data+NA_data-DF_data] X 100/M_serving.
(36)
[00259] For
this group, the most healthful foods have an HD value less than or equal to
-0.36, while less healthful foods have an HD value greater than -0.36 and less
than or equal to
1.66, even less healthful foods have an HD value greater than 1.66 and less
than or equal to
2.91 and the most unhealthful foods have an HD value greater than 2.91.
[00260] In
such embodiments, the healthfulness data is determined in a fifteenth,
common manner for foods within an fifteenth metagroup comprising the following
group:
coffee/tea drinks with milk. The healthfulness data (HD) for this group is
obtained based on
the saturated fat content data, the fat content data, the sodium content data
and the sugar
63
CA 02838996 2013-12-10
WO 2012/171019
PCT/US2012/041929
content data of the food. In one such embodiment, the healthfulness data is
produced by
processing SF_data, F_data, S_data and NA_data, as follows:
HD=([(2 X SF_data)+(2 X F_data) (2 X S_data)+NA_data]/4)/kcal_DV. (37)
[00261] For
this group, the most healthful foods have an HD value less than or equal to
3.25, while relatively less healthful foods have an HD value greater that 3.25
and less than or
equal to 3.471, even less healthful foods have an HD value greater than 3.471
and less than or
equal to 4.18 and the least healthful foods have an HD value greater than
4.18.
[00262] In
such embodiments, the healthfulness data is determined in a sixteenth,
common manner for foods within the following group: crackers. The
healthfulness data (HD)
for this group is obtained based on the saturated fat content data, the fat
content data, the
sugar content data, the sodium content data and the ED data of the food. In
one such
embodiment, the healthfulness data is produced by processing SF_data, F_data,
S_data,
NA_data and ED_data, as follows:
HD=(ED_data/3)+[(2 X SF_data)+F_data+S_data+(2 X NA_data)] X 100/M_serving.
(38)
[00263] For this group, none of the foods are graded in the most healthful
foods
category, while relatively less healthful foods have an HD less than or equal
to 1.805, even
less healthful foods have an HD value greater than 1.805 and less than or
equal to 3.2, and the
least healthful foods have an HD value greater than 3.2.
[00264] In
such embodiments, the healthfulness data is determined in a seventeenth,
common manner for foods within the following group: fish, cooked. The
healthfulness data
(HD) for this group is obtained based on the saturated fat content data, the
fat content data,
the sugar content data, the sodium content data and the ED data of the food.
In one such
embodiment, the healthfulness data is produced by processing SF_data, F_data,
S_data,
NA_data and ED_data, as follows:
HD=ED_data+[(4 X SF_data)+(4 X F_data)+S_data+(2 X NA_data)] X 100/M_serving.
(39)
64
CA 02838996 2013-12-10
WO 2012/171019
PCT/US2012/041929
[00265] For
this group, the most healthful foods have an HD value less than or equal to
3.2, while relatively less healthful foods have an HD value greater that 3.2
and less than or
equal to 4.7, even less healthful foods have an HD value greater than 4.7 and
less than or
equal to 6.6, and the least healthful foods have an HD value greater than 6.6.
[00266] In such embodiments, the healthfulness data is determined in a
eighteenth,
common manner for foods within the following group: fruit, canned. The
healthfulness data
(HD) for this group is obtained based on the saturated fat content data, the
fat content data,
the sugar content data, the sodium content data and the ED data of the food.
In one such
embodiment, the healthfulness data is produced by processing SF_data, F_data,
S_data,
NA_data and ED_data, as follows:
HD=ED_data+[(2 X SF_data)+(2 X F_data) (4 X S_data)+(2 X NA_data)] X
100/M_serving. (40)
[00267] For
this group, the most healthful foods have an HD value less than or equal to
1.56, while relatively less healthful foods have an HD value greater that 1.56
and less than or
equal to 1.93, even less healthful foods have an HD value greater than 1.93
and less than or
equal to 3.27, and the least healthful foods have an HD value greater than
3.27.
[00268] In
such embodiments, the healthfulness data is determined in a nineteenth,
common manner for foods within the following group: nuts, nut butters. The
healthfulness
data (HD) for this group is obtained based on the saturated fat content data,
the fat content
data, the sugar content data, the sodium content data and the ED data of the
food. In one such
embodiment, the healthfulness data is produced by processing SF_data, F_data,
S_data,
NA_data and ED_data, as follows:
HD=(ED_data/3 )+ [(2X SF_data)+F_data+ S_data+NA_data] X 100/ M_s erving. (41)
[00269] For
this group, none of the foods are graded within the most healthful foods
category, while relatively less healthful foods have an HD value less than or
equal to 1.5,
CA 02838996 2013-12-10
WO 2012/171019
PCT/US2012/041929
even less healthful foods have an HD value greater than 1.5 and less than or
equal to 5.6, and
the least healthful foods have an HD value greater than 5.6.
[00270] In
such embodiments, the healthfulness data is determined in a twentieth,
common manner for foods within the following group: snacks, other. The
healthfulness data
(HD) for this group is obtained based on the saturated fat content data, the
fat content data
and the ED data of the food. In one such embodiment, the healthfulness data is
produced by
processing SF_data, F_data and ED_data, as follows:
HD=ED_data+[SF_data+F_data] X 100/M_serving. (42)
[00271] For
this group, none of the foods are graded within the most healthful foods
category or in the relatively less healthful foods category, while even less
healthful foods
have an HD value less than or equal to 5.491, and the least healthful foods
have an HD value
greater than 5.491.
[00272] In
such embodiments, the healthfulness data is determined in a twenty-first,
common manner for foods within the following group: snacks--popcorn. The
healthfulness
data (HD) for this group is obtained based on the saturated fat content data
of the food, as
well as its fat content data, sugar content data, sodium content data, dietary
fiber content data
and ED data. In one such embodiment, the healthfulness data is produced by
processing
SF_data, F_data, S_data, NA_data, DF_data and ED_data, as follows:
HD=ED_data+[(2 X S_data)+SF_data+F_data+NA_data-DF_data] X 100/M_serving. (43)
[00273] For this group, the most healthful foods have an HD value less than
or equal to
3.02, while less healthful foods have an HD value greater than 3.02 and less
than or equal to
4.0, even less healthful foods have an HD value greater than 4.0 and less than
or equal to 6.3
and the most unhealthful foods have an HD value greater than 6.3.
[00274] In
certain embodiments, methods are provided for selecting and ingesting
foods in a way that enables the consumer to control body weight, while
simplifying the task
66
CA 02838996 2013-12-10
WO 2012/171019
PCT/US2012/041929
of evaluating the relative healthfulness of a candidate food serving. With
reference to FIG.
24, at the beginning of a selected period, such as a day or a week, a variable
SUM is set 20 to
0. A consumer considers ingesting a candidate food serving and obtains 24 data
representing
its identity and/or its nutrient content and a pre-determined group including
the candidate
food serving. In order to evaluate the desirability of ingesting the candidate
food serving, the
consumer obtains 26 food energy data and relative healthfulness data for the
candidate food
serving based on at least one of the data representing its (1) identity and
(2) its nutrient
content and group classification. Such food energy data and relative
healthfulness is
determined as disclosed hereinabove. In certain advantageous embodiments, such
relative
healthfulness is represented by distinctly different and suggestive colors
and/or shapes on
packaging or labeling of a food product, for example: a green star to
represent those foods
that provided the greatest satiety for minimal kcal as well as a nutritional
profile which most
closely complements public health guidelines; a blue triangle to represent
foods with a
nutritional profile that is not as closely aligned with public health
recommendations but does
have satiety and nutritional virtues; a pink square to represent foods that
provide minimal
satiety or nutritional value to overall intake but are likely to enhance the
tastefulness or
convenience of eating; and a white circle to represent foods that, while not
making much of a
contribution to overall nutrition or feelings of satiety, provide pleasure and
can be part of a
healthy eating plan when consumed in moderation.
[00275] Based on the food energy data and relative healthfulness data thus
obtained,
the consumer determines whether to accept or reject 30 the candidate food
serving for
consumption. For example, the consumer may wish to consume a snack food and
must decide
between a bag of fried corn chips and a bag of popcorn. He or she obtains
their relative
healthfulness data using one of the processes disclosed hereinabove, and
decides 30 to select
the popcorn because its healthfulness relative to the fried corn chips is more
favorable than
67
CA 02838996 2013-12-10
WO 2012/171019
PCT/US2012/041929
that of the fried corn chips. Thus, if the consumer decides 30 to reject a
candidate food
serving, the process returns to 24 to be repeated when the consumer again
considers a
candidate food serving for ingestion.
[00276] If
the consumer has decided that a candidate food serving is sufficiently
healthful or selected it in preference to another such candidate food serving,
based on the
obtained food energy data the consumer decides 30 whether to ingest the
candidate food
serving or to reject it. If the value of SUM would exceed pre-determined
maximum data if the
consumer ingests the candidate food serving, the consumer decides 30 to reject
it and the
process returns to 24 to be repeated when the consumer again considers a
candidate food
serving for ingestion. If the consumer decides to ingest the candidate food
serving, the food
energy data is added 32 to SUM, the consumer ingests 36 the candidate food
serving and the
process returns to 24 to be repeated when the consumer again considers a
candidate food
serving for ingestion. It will be appreciated that steps 32 and 36 need not be
carried out in the
order illustrated. It will also be appreciated that the order in which the
consumer considers the
healthfulness data and the food energy data can vary depending on personal
preference.
[00277]
Where the consumer considers two candidate food servings, and accepts one to
be ingested and rejects the other, in effect the process as illustrated in
FIG. 24 is carried out
twice, once for the candidate food serving accepted by the consumer and again
for the
rejected candidate food serving.
[00278] A method of selecting and purchasing food for consumption utilizing
the
relative healthfulness data and food energy data is illustrated in FIG. 25.
When a consumer
considers whether to purchase a given food offered for sale, the consumer
supplies 250 data
representing its identity and/or its nutrient content and a pre-determined
group including the
food offered for sale. In order to evaluate the desirability of purchasing the
food, the
consumer obtains 260 relative healthfulness data and food energy data for the
food based on
68
CA 02838996 2013-12-10
WO 2012/171019
PCT/US2012/041929
at least one of the data representing its (1) identity and (2) its nutrient
content and group
classification. The food may be a packaged food that displays an image on its
packaging
representing the relative healthfulness data and food energy data of the
product offered for
sale. Instead it may be a packaged food that does not display such an image,
so that the
consumer inputs an identification of the packaged food, or else its
classification in a
respective pre-determined food group and nutrient content, in a device such as
a PDA or
cellular telephone to obtain a display of the relative healthfulness data, as
disclose more fully
hereinbelow. It might also be a food such as produce that is unpackaged and
the consumer
may obtain the relative healthfulness data and food energy data in the same
manner as for the
packaged food lacking the image representing same.
[00279]
Based on the relative healthfulness data and the food energy data, the
consumer determines whether to accept or reject 270 the food for purchase. For
example, the
consumer may wish to purchase cookies and wishes to decide between two
competing brands
of the same kind of cookie. The relative healthfulness data and food energy
data provide a
simple and straightforward means of making this decision.
[00280]
When the consumer has selected all of the foods to be purchased 280, he or
she then purchases the selected foods 290 and delivers or has them delivered
296 to his/her
household for consumption.
[00281] In
some embodiments, the App and/or the programmed computer system of
some embodiments of the instant invention is/are configured to produce meal
plan data for a
person on request. A meal plan for a given person is based on a personal
profile of the person
and relative healthfulness data and food energy data produced for a variety of
foods, either
prior to the request for the meal plan data or upon such request. The personal
profile includes
such data as may be necessary to retrieve or produce a meal plan tailored to
the needs and/or
desires of the requesting person, and can include data such as the person's
weight, height,
69
CA 02838996 2013-12-10
WO 2012/171019
PCT/US2012/041929
body fat, gender, age, attitude, physical activity level, weight goals, race,
religion, ethnicity,
health restrictions and needs, such as diseases and injuries, and consequent
dietary
restrictions and needs.
[00282] In
some embodiments, the App and/or the programmed computer system of
some embodiments of the instant invention is/are configured to produce a
plurality of meal
plans each designed to fulfill pre-determined criteria, such as a low-fat
diet, a low
carbohydrate diet, an ethnically or religiously appropriate diet, or the like.
Criteria and
methods for producing such diets are, for example, disclosed by US published
patent
application No. 2004/0171925, published Sep. 2, 2004 in the names of David
Kirchoff, et al..
US 2004/0171925 is hereby incorporated by reference herein in its entirety.
[00283]
When the consumer considers whether to ingest a candidate food serving, the
person looks at how the graphical indicator has changed in response to
particular what-if
scenario(s). In some embodiments, the person views an integrated image of the
graphical
indicator including both a numeral representing an energy value of the food
serving and an
auxiliary image feature representing a further nutritional quality of the food
serving. In
certain ones of such embodiments, the further nutritional quality comprises
the relative
healthfulness of the candidate food serving. Such relative healthfulness may
be determined as
disclosed in this application, or in another manner. In certain advantageous
embodiments,
such relative healthfulness is represented by distinctly different and
suggestive image colors,
shades, shapes, brightness, or textures of the graphical indicator. In certain
ones of such
embodiments, the further nutritional quality represents a relative heart
healthiness of the
candidate food serving, while in others it represents sugar content for use by
diabetic
consumers. In certain ones of such embodiments, the further nutritional
quality represents an
amount, presence or absence of a particular nutrient or nutrients. For
example, body builders
CA 02838996 2013-12-10
WO 2012/171019
PCT/US2012/041929
may wish to know the amount of protein in a serving of a particular candidate
food serving or
whether such protein includes all essential amino acids.
[00284]
With reference again to FIG. 26, based on the data provided by the integrated
image of the graphical indicator, that is, the energy content data and the
further nutritional
quality data provided thereby, the consumer determines whether to accept or
reject 130 the
candidate food serving for consumption. For example, the consumer may wish to
consume a
snack food and must decide between a bag of fried corn chips and a bag of
popcorn. He or
she views the integrated image on each bag, and decides to consume the popcorn
both
because its energy content and healthfulness relative to the fried corn chips
as revealed by the
integrated image are more favorable than those of the fried corn chips. The
integrated image
thus provides an easily viewed and readily understood evaluation of multiple
nutritional
qualities of a candidate food serving.
[00285] In
certain embodiments, with or without the use of a data processing system,
the consumer adds the data represented by the numeral in the integrated image
associated
with the candidate food serving to the SUM 140, and if the SUM is less than a
pre-
determined daily or weekly maximum MAX 150, the consumer ingests 160 the
candidate
food serving. In the alternative, the consumer first ingests the candidate
food serving and then
adds the number data represented by the numeral in the integrated image to
SUM. For
example, the consumer might not know the precise value of SUM plus the number
data, but is
aware that it is relatively low compared to MAX.
[00286] A
method of selecting and purchasing food for consumption utilizing the
visual tracking of the person's living factor(s) and what-if scenarios as, for
example,
illustrated in FIG. 27. When a consumer considers whether to purchase a given
food for
consumption, the consumer views 310 an integrated image associated with the
food including
both a numeral representing an energy value of the food and an auxiliary image
feature
71
CA 02838996 2013-12-10
WO 2012/171019
PCT/US2012/041929
representing a further nutritional quality of the food. The food may be a
packaged food that
displays the integrated image on its packaging. Instead it may be a packaged
food that does
not display such an image, so that the consumer submits an identification of
the packaged
food in a device such as a PDA or cellular telephone to obtain a display of
the integrated
image for evaluation, as disclose above (e.g., scanning QR code, using NFC
tag, etc.). It
might also be a food such as produce that is unpackaged and the consumer may
obtain an
associated integrated image in the same manner as for the packaged food
lacking the image.
[00287]
Based on the data provided by the integrated image, that is, the energy
content
data and the further nutritional quality data provided thereby, the consumer
determines
whether to accept or reject 320 the food for purchase. For example, the
consumer may wish
to purchase cookies and wishes to decide between two competing brands of the
same kind of
cookie. Each may have the same energy content, so that the consumer may wish
to choose the
brand having a more favorable healthfulness based on differing colors, shapes,
textures,
shadings or combinations thereof seen in the integrated image on each package.
Or else if
each has an image having the same auxiliary image feature, the consumer may
wish to select
the brand having a lower energy content per serving.
[00288]
When the consumer has selected all of the foods to be purchased 330, he or
she then purchases the selected foods 340 and delivers or has them delivered
350 to his/her
household for consumption.
[00289] In certain ones of such embodiments, the App and/or the programmed
computer system of the instant invention is/are configured to store (A) the
weighting data and
conversion factors necessary to carry out one or more of the processes
summarized in
equations (1) through (15) hereinabove to produce food energy data, and (B)
data identifying
the pre-determined food groups and instructions for carrying out the processes
necessary to
produce the relative healthfulness data as summarized in equations
hereinabove.
72
CA 02838996 2013-12-10
WO 2012/171019
PCT/US2012/041929
[00290] Examples of visually tracking the actual RCV(t), the actual
RCAV(t),
the potential RCV(t), and/or the potential RCAV(t) based on p and/or PA
[00291] In some embodiments, the instant invention visually tracks the
actual/potential
RCV(t) (p) value of food servings consumed and/or contemplated to be consumed
by the
person. In some embodiments, the instant invention visually tracks
actual/potential RCV(t)
(p) value of food servings consumed and/or contemplated to be consumed by the
person in
accordance with, but not limited to, the following equation:
RCV(t) (p) = (p of food serving(1) + p(2) of food serving(2) +...+ p(n) of
food serving(n))
(44);
where the targeted optimum/desired range/value shown at a particular time is
representative
of a portion of total (p) attributed to a time from the beginning of the
tracking period to the
particular time at which the actual/potential RCV(t) (p) value is calculated.
For example, if
the total (p) is 30, the tracking period is 24 hours, and the actual/potential
RCV(t) (p) value is
calculated after 8 hours from the start of the tracking period, then the shown
targeted
optimum/desired range/value is 10 -- 30 / (24/8).
[00292] In some embodiments, (p) values of the food servings is
characterized by the
equation (45)
=
k2 k3
(45)
where c is calories, f is fat in grams and r is dietary fiber in grams for
each candidate food
serving and where k1 is about 50, k2 is about 12 and k3 is about 5.
[00293] In some embodiments, the tracking of the actual/potential
RCV(t) (p), as for
example shown in the equation (4) is further adjusted based on the person's
activity level to
determine the actual/potential RCV(t) (p+PA). In some embodiments, the instant
invention
73
CA 02838996 2013-12-10
WO 2012/171019
PCT/US2012/041929
determines PA on the basis of intensity level and duration of physical
exercise. In some
embodiments, PA, is a whole number characterized by the equation (46)
kg body weight x minutes of ;Activity
'fit!
(46)
wherein k4 is a pre-determined numerical weighting factor determined on the
basis of
[00294] In
some embodiments of the claimed invention, a range of PA is allotted per
day is determined based on current body weight. In some embodiments, this
range of PA can
be seven p from minimum to maximum. In some embodiments, the appropriate
ranges of PA
are assigned to each of series of weight ranges. In some embodiments, when the
formula (46)
[00295] In
some embodiments, k4 can be between 0.05 and 0.2 and the pre-determined
threshold can be 1 to 3 PA per day, for example 2. In some embodiments, the
App and/or the
programmed computer system of the instant invention is/are configured for
calculating PA
74
CA 02838996 2013-12-10
WO 2012/171019
PCT/US2012/041929
LOW illtenSity:
.051 x kg body weight x mixatto
=
100 rounded off to P
A
1,47)
MO derate intensity:
.071 1 x k-L ,: body weight x minutes
_____________________________________ rounded off to =P
1 00 A
(48)
filah intensity:
.1783 x kg body weight x minutes
_________________________________________ rounded off to = P
1 0 0 A
(49)
[00296] In
some embodiments, the instant invention adds PA to p when PA exceeds a
pre-determined threshold of 1 to 3 PA per day. In some embodiments, the
instant invention
adds PA to p when PA exceeds a pre-determined threshold of 5 PA per day. In
some
embodiments, the instant invention adds PA to p when PA exceeds a pre-
determined threshold
of 7 PA per day. In some embodiments, the instant invention adds PA to p when
PA exceeds a
pre-determined threshold of 10 PA per day.
[00297] In some embodiments, the instant invention further incorporates
into the visual
tracking of one or more calculations based on food energy data (FED) and food
healthfulness
disclosed in US Pub. 20100055271, US Pub. 20100055652, US Pub. 20100062402, US
Pub.
20100055653, US Pub. 20100080875, and US Pub. 20100062119, which are each
incorporated herein by reference in their entirety. In some embodiments, the
instant
invention further incorporates into the visual tracking one or more
calculations disclosed in
U.S. Pat. No. 6,040,531; U.S. Pat. No. 6,436,036; U.S. Pat. No. 6,663,564;
U.S. Pat. No.
6,878,885 and U.S. Pat. No. 7,361,143, each of which is incorporated herein by
reference in
its entirety. In some embodiments, the instant invention further incorporates
the visual
CA 02838996 2013-12-10
WO 2012/171019
PCT/US2012/041929
tracking one or more calculations based on the calculations disclosed in US
Pub.
20100055271, US Pub. 20100055652, US Pub. 20100062402, US Pub. 20100055653, US
Pub. 20100080875, US Pub. 20100062119, U.S. Pat. No. 6,040,531; U.S. Pat. No.
6,436,036;
U.S. Pat. No. 6,663,564; U.S. Pat. No. 6,878,885 and U.S. Pat. No. 7,361,143.
[00298] While a
number of embodiments of the present invention have been described,
it is understood that these embodiments are illustrative only, and not
restrictive, and that
many modifications may become apparent to those of ordinary skill in the art.
15
25
76