Note: Descriptions are shown in the official language in which they were submitted.
CA 02841614 2014-02-03
Docket No.: 201201490
ESTIMATING PRODUCT PROMOTION SALES LIFT
TECHNICAL FIELD
100011 This disclosure relates to systems and methods for managing and
analyzing data
related to the sale of one or more products in retail store outlets.
BACKGROUND
100021 in marketing and selling products across diverse geographical regions
and through
multiple retail outlet locations, multiple teams of person.nel may be
involved. Each team may
establish their own promotional activities for the region and/or the retail
outlet location(s) for
which they are responsible. In many cases, retail personnel may design
promotions based
only on past experience and/or anecdotal evidence as a guide to the impact a
particular
promotion may have on product sales.
SUMMARY
[0003] In general, this disclosure is directed to evaluating the effectiveness
of different types
of product promotions, including circulars and temporary price cuts, by
calculating the sales
lift attributable to the promotions, and also to evaluating the overall impact
to a category of
products by promotions on individual products in the category or group. One
feature of the
process outlined in this disclosure is the calculation of the baseline against
which promotion
sales are compared and based on which sales lift is determined. The process
for calculating
baseline sales dollars and/or unit sales includes establishing a baseline for
a product based on
sales data before and/or after Promotion for that product and a number of
other products that
are determined to exhibit similar sales trends.
[0004] In one example, a method includes for each of a number of products in a
product
category of a retailer, estimating regular sales of the product during a
period of time
including at least one sales promotion for the product based on actual sales
data for the
product during the period of time. Regular sales of the product includes sales
of a given
product without any sales promotions for the given product. A correlation
value for each pair
of products is calculated. The correlation value is indicative of a similarity
between the
CA 02841614 2014-02-03
Docket No.: 201201490
estimated regular sales for each product of the pair of products over the
period of time. The
method also includes determining one or more products that are similar to a
target product of
based on the correlation values of the similar products to the target product,
calculating a
baseline sales of the target product during the period of time based on the
estimated regular
sales each of the similar products, and calculating an incremental sales lift
for the target
product during the period of time based on actual sales data for the target
product and the
baseline sales of the target product during the period of time.
10005] The details of one or more embodiments of the disclosure are set forth
in the
accompanying drawings and the description below. Other features, objects, and
advantages
of the disclosure will be apparent from the description and drawings, and from
the claims.
BRIEF DESCRIPTION OF DRAWINGS
100061 FIG. 1 is a conceptual diagram illustrating an example system for
estimating the sales
lift of a product of a retailer on promotion.
100071 FIG. 2 is a block diagram illustrating an example computing device that
may estimate
the sales lift of the product of the retailer on promotion.
100081 FIG. 3 is a flow diagram illustrating an example method of estimating
the sales lift of
the product of the retailer on promotion.
100091 FIG. 4 is a flow diagram illustrating another example method of
estimating the sales
lift of the product of the retailer on promotion.
100101 FIG. 5 is a graph of actual unit sales of a target product for each
week in a thirteen
week time period and estimated baseline unit sales of the product during a one
week
promotion.
100111 FIG. 6 is a graph of actual and estimated unit sales of six different
products in a
category for each week in a thirteen week, three-month time period.
DETAILED DESCRIPTION
100121 Examples according to this disclosure are directed to evaluating the
effectiveness of
different types of product promotions, including circulars and temporary price
cuts, by
calculating the sales lift attributable to the promotions. One feature of the
process outlined in
CA 02841614 2014-02-03
Docket No.: 201201490
this disclosure is the calculation of the baseline against which promotion
sales are compared
and based on which sales lift is determined. The process for calculating
baseline sales dollars
and/or unit sales includes establishing a baseline for a product based on
sales data before
and/or after promotion for that product and for a number of other products
that are
determined to exhibit similar sales trends.
10013] Many enterprises including, e.g., retailers employ a large number of
sophisticated
business analyses concerning products or other items to manage and improve
sales revenues
and profits. Retailers of consumer packaged goods (CPG) may, for example,
attempt to
determine the effect on sales of various types of promotional activities such
as weekly
circular advertisement promotions, temporary price cuts, and the like. The
increase in sales
of an item due to one or more product promotions may be referred to as sales
lift. Such
business analyses may be based, at least in part, on what is sometimes
referred to as baseline
sales, e.g. baseline sales units (e.g. volume) or baseline sales dollars (e.g.
revenues or
profits). Baseline sales may be defined as the amount of sales of a product or
other item
without any sales promotions for the item. The sales lift attributable to a
sales promotion for
an item sold by a retailer or other enterprise may be defined as the
difference between the
actual sales of the item during the promotion and baseline sales for the item.
However, as
baseline sales by definition cannot include sales of an item during a
promotion, the
calculation of lift depends on an estimation of baseline sales during time
period the
promotion occurs.
100141 Many techniques have been employed to estimate baseline sales during
promotional
time periods, but prior techniques have often been prone to error. Because
small errors in
baseline sales estimates may cause large errors in analysis based thereon, a
need exists for
more accurate and efficient ways of determining baseline sales. As such,
examples
according to this disclosure are directed to determining the sales lift for a
target item sold by
a retailer attributable to a sales promotion employing an estimate of baseline
sales
determined based on sales data before and/or after promotion for the target
item and for a
number of other items that arc determined to exhibit similar sales trends to
the target item.
10015] In one example, a method includes, for each item of a plurality of
items sold by a
retailer, estimating, with a computing device, non-promotional sales volume of
the item
during a period of time including a sales promotion for the item based on
sales data for the
3
CA 02841614 2014-02-03
Docket No.: 201201490
item during the period of time, correlating, with the computing device, the
non-promotional
sales for each item of the plurality of items to one another, categorizing,
with the computing
device, one or more items of the plurality of items as similar to a select
item of the plurality
of items based on the correlation of the non-promotional sales of the one or
more similar
items to the non-promotional sales of the select item, estimating, with the
computing device,
baseline sales of the select item during the period of time based on the non-
promotional sales
for the select item and each of the one or more similar items, and
calculating, with the
computing device, a sales lift for the select item attributable to the sales
promotion for the
select item based on actual sales data for the select item and the estimated
baseline sales of
the select item during the time period.
10016] In another example, a method includes, for each product of a plurality
of products in a
product category of a retailer, estimating, with a computing device, regular
sales of the
product during a period of time including at least one sales promotion for the
product based
on actual sales data for the product during the period of time. Regular sales
include sales of a
given product without any sales promotions for the given product. The method
also includes
calculating a correlation value for each pair of products of the plurality of
products, wherein
the correlation value is indicative of a similarity between the estimated
regular sales for each
product of the pair of products over the period of time, determining one or
more products of
the plurality of products similar to a target product of the plurality of
products based on the
correlation values of the one or more similar products to the target product,
calculating a
baseline sales of the target product during the period of time based on the
estimated regular
sales for the target product and each of the one or more similar products, and
calculating an
incremental sales lift for the target product during the time period based on
actual sales data
for the target product and the baseline sales of the target product during the
time period.
[0017] in addition to improving the determination of baseline sales for a
target product
during a period of time including a promotion, examples according to this
disclosure may
provide advantages by estimating baseline sales for each product in each time
period, e.g.,
each week, regardless of whether the product is on promotion in the week.
Regular sales of a
product in a non-promotion week (or other time period) may be impacted by
sales of other
products, e.g., other products in a common category that are on promotion. As
such,
estimating a baseline for products in non-promotion weeks can show the
potential
4
CA 02841614 2014-02-03
Docket No.: 201201490
cannibalization or affiliation among items, and when rolled up to the product
category level,
the baseline can indicate the overall impact on the entire category by
promoting a subset of
products in the category.
[0018] FIG. 1 is a block diagram illustrating example product promotion system
(PPS) 10
including client computing devices 12A-12N (collectively "clients 12" or
individually
"client 12"), network 14, data repository 16, server 18, and point-of-sale
(PUS) system 21.
Clients 12 are communicatively connected to data repository 16, server 18, and
POS system
21 via network 14. Clients 12 and server 18 are configured to periodically
communicate with
one another over network 14 to track and store, e.g. in data repository 16,
sales data
associated with various products sold by a retailer, e.g. sales data retrieved
from or
communicated by PUS system 21. Server 18 includes promotion analysis engine
19, which
can be employed in conjunction with the product sales data to analyze the
effect of various
types of sales promotions on the sales of products of the retailer. In this
manner, system 10,
and other systems according to this disclosure including similar capabilities
can be employed
to calculate the sales lift for a product of the retailer that is attributable
to a sales promotion.
[0019] in some examples, a retailer is an entity that provides services or
retails merchandise
through physical, tangible, non-Internet-based retail stores or through
Internet-based stores.
In the case of a retailer that sells products and services through physical,
tangible, non-
Internet-based retail stores, each store of the retailer can include retail
floor space including a
number of aisles. Each of the aisles can have shelf and/or rack space for
displaying
merchandise. In some stores, at least sonic of the aisles have end caps for
displaying
additional merchandise. Each of the stores includes one or more checkout lanes
with cash
registers at which customers can purchase merchandise. In some examples, the
checkout
lanes are staffed with cashiers.
[0020] Clients 12 can include any number of different portable electronic
mobile devices,
including, e.g., cellular phones, personal digital assistants (PDA's), laptop
computers,
portable gaming devices, portable media players, c-book readers, watches, as
well as non-
portable devices such as desktop computers. Clients 12 can include one or more
input/output
devices configured to allow user interaction with one or more programs
configured to
communicate with server 18 and promotion analysis engine 19. In one example,
clients 12
include client computers from which users access and interact with promotion
analysis
CA 02841614 2014-02-03
Docket No.: 201201490
engine 19. In one example, clients 12 run a web browser that accesses and
presents a web
application executed by server 18 or another device and allows a user to
generate a report
including sales transaction data for one or more items sold by the retailer.
In another
example, clients 12 execute an application outside of a web browser, e.g. an
operating system
specific application like a Windows application or Apple OS application that
accesses and
presents information processed promotion analysis engine 19 on server 18 or
another device.
In another example, one or more of clients 12 store and execute promotion
analysis engine 19
locally.
[0021] Network 14 can include one or more terrestrial and/or satellite
networks
interconnected to provide a means of communicatively connecting clients 12 to
data
repository 16 and server 18. In one example, network 14 is a private or public
local area
network (LAN) or Wide Area Network (WANs). Network 14 can include both wired
and
wireless communications according to one or more standards and/or via one or
more
transport mediums. In one example, network 14 includes wireless communications
according to one of the 802.11 or Bluetooth specification sets, or another
standard or
proprietary wireless communication protocol. Network 14 can also include
communications
over a terrestrial cellular network, including, e.g. a GSM (Global System for
Mobile
Communications), CDMA (Code Division Multiple Access), EDGE (Enhanced Data for
Global Evolution) network. Data transmitted over network 14, e.g., from
clients 12 to data
repository 16 can be formatted in accordance with a variety of different
communications
protocols. For example, all or a portion of network 14 can be a packet-based,
Internet
Protocol (IP) network that communicates data from clients 12 to data
repository 16 in
Transmission Control Protocol/Internet Protocol (TCP/IP) packets, over, e.g.,
Category 5,
Ethernet cables.
[0022] Data repository 18 and/or POS system 20 can each include, e.g., a
standard or
proprietary electronic database or other data storage and retrieval mechanism.
In one
example, data repository 18 and/or POS system 20 each include one or more
databases, such
as relational databases, multi-dimensional databases, hierarchical databases,
object-oriented
databases, or one or more other types of databases. Data repository 18 and/or
POS system 20
can be implemented in software, hardware, and combinations of both. In one
example, data
repository 18 and/or POS system 20 include proprietary database software
stored on one of a
6
CA 02841614 2014-02-03
Docket No.: 201201490
variety of storage mediums on a data storage server connected to network 14
and configured
to store information associated with sales of products or other items at
various locations of a
retailer. Storage media included in or employed in cooperation with data
repository 18
and/or PUS system 20 can include, e.g., any volatile, non-volatile, magnetic,
optical, or
electrical media, such as a random access memory (RAM), read-only memory
(ROM), non-
volatile RAM (NVRAM), electrically-erasable programmable ROM (EEPR.OM), flash
memory, or any other digital media.
100231 Data repository 16 and/or POS system 21 store information associated
with sales of
products and other items of the retailer. Examples of such information
includes past actual
sales transactions for the various products sold by the retailer at a number
of locations, e.g., a
number of stores in a number of different geographical locations. In one
example, PUS
system 21 receives and processes sales data associated with customer
transactions of the
retailer at various locations of the retailer. Server 18 can periodically
retrieve raw PUS sales
transaction data from PUS system 21 and can store the data or process and then
store the data
in data repository 16. In another example, PUS system 21 is configured to
periodically
"push" the sales data over network 14 to server 18 and/or data repository 16.
10024] Server 18 includes promotion analysis engine 19, which is employed, as
described
below, to calculate the sales lift for a product of the retailer that is
attributable to a sales
promotion. Server 18 can be any of several different types of network devices.
Examples of
server 18 include a data processing appliance, web server, specialized media
server, personal
computer operating in a peer-to-peer fashion, or another type of network
device. Promotion
analysis engine 19 can be implemented in hardware, software, or a combination
of both and.
can include one or more functional modules configured to execute various
functions
attributed to promotion analysis engine 19. Additionally, although example
system 10 of
FIG. 1 includes one server 18, other examples include a number of collocated
or distributed
servers configured to process sales and other types of data associated with
products and other
items sold by the retailer and stored in data repository 16 individually or in
cooperation with
one another.
(0025] Although data repository 16, server 18, and PUS system 21 are
illustrated as separate
components in example system 10 of FIG. 1, in other examples the components
are
combined or each is distributed amongst more than one device. In one example,
server 18
7
CA 02841614 2014-02-03
Docket No.: 201201490
stores data repository 16 and control the repository to periodically retrieve
sales data from
POS system 21 over network 14. In another example, data repository 16 and/or
POS system
21 are distributed among a number of separate devices, e.g. a number of
database servers,
and server 18 includes a number of co-located or distributed servers
configured to operate
individually and/or in cooperation with one another and with the various
devices comprising
data repository 16 and/or POS system 21.
10026] Regardless of the particular configuration of system 10, or other
example systems
according to this disclosure, the system may be employed to calculate the
sales lift for a
product of the retailer that is attributable to a sales promotion. In one
example, server 18
retrieves from POS system 21 or POS system 21 pushes actual sales transaction
data to
server 18 over network 14. The sales transaction data is received by server 18
periodically
and stored in data repositories for different periods of time, e.g., in blocks
of one or more
days, weeks, months, or years. Promotion analysis engine 19 executed by server
18 retrieves
the sales transaction data for one or more products sold by the retailer and
analyzes the sales
data to calculate the sales lift for a product or products that is
attributable to one or more
sales promotions associated with the product(s).
100271 In some examples, promotion analysis engine 19 analyzes sales data for
a number of
products that belong to the same product category for one or more time
periods, e.g., one or
more months. Products and other items sold by the retailer can be organized
into categories
of products. A product category can be a group of a number of products that
share one or
more attributes or are otherwise related to one another. In one example, the
retailer organizes
group apples, oranges, and bananas into a product category of "fresh fruit."
In another
example, the retailer organizes shampoo, deodorant, and toothpaste into a
product category
of "personal hygiene." Product categories may not necessarily include
different types of
products that share a similar purpose or function, as illustrated in the
foregoing examples. In
one example, product categories include different versions of the same type of
item. In one
such example, the retailer organizes different brands of toothpastes into a
"toothpaste"
category. In some examples, categories include items, the sales of which are
interrelated
and/or interdependent in one or more ways. For example, a category includes
items, the
customer demand for which exhibits affinity, substitution, cannibalism, or
other
8
CA 02841614 2014-02-03
Docket No.: 201201490
interdependencies between different particular items in the category. In
another example, a
product category could be a group of products that are placed on the same
store fixture.
[0028] In one example, promotion analysis engine 19 retrieves or simply
references sales
data stored on server 18 or data repository 16 for a plurality of products in
a product category
over a period of time. For example, promotion analysis engine 19 references
sales data
stored on data repository for 10 different brands of toothpaste for a three
month time period
including 13 weeks of sales. The time period for which the sales data is
referenced by
promotion analysis engine 19 can include at least one promotion. For example,
the
toothpaste sales data includes a week of sales of one or more of the
toothpastes at a
discounted price.
[0029] In one example, promotion analysis engine 19 estimates regular sales of
each
toothpaste in the category for the three month period including the one week a
temporary
price cut (TPC) or weekly circular promotion based on the actual sales data
stored in data
repository 16. "Regular" sales is used in this disclosure to refer to sales of
a given product or
other item without any sales promotions for the given product. Thus, regular
sales for an
item during non-promotional period of items can be equal to the actual sales
of the item.
Regular sales of the item during a promotion, however, may only be estimated
based on
actual sales data. For example, promotion analysis engine 19 estimates regular
sales of a
toothpaste during a promotional period for the toothpaste by interpolating
between actual
sales for the toothpaste the week before and the week after the week of the
promotion. In
another example, promotion analysis engine 19 estimates regular sales of a
toothpaste during
a promotional period for the toothpaste by interpolating between actual sales
for the
toothpaste for a number of weeks before and a number of weeks after the week
of the
promotion.
[0030] In one example, promotion analysis engine 19 compares the estimated
regular sales of
each of the toothpastes in the category to one another to determine, for each
toothpaste, one
or more other toothpastes that exhibit similar sales trends to a target
(sometimes referred to
as "select" toothpaste). For example, promotion analysis engine 19 correlates
the estimated
regular sales for each toothpaste in the category to one another to determine
a correlation
factor or value of each toothpaste to each other toothpaste in the category.
The correlation
9
CA 02841614 2014-02-03
Docket No.: 201201490
factor or value can be a numerical value that represents the statistical
similarity between the
estimated regular sales of two or more items sold by a retailer.
[0031] In one example, promotion analysis engine 19 employs the correlation
factors
between the different toothpastes in the category to determine, for each
toothpaste, one or
more other toothpastes that exhibit sales trends above a threshold similarity
to the target
toothpaste. For example, promotion analysis engine 19 references the
correlation factors for
each toothpaste in the category to the target toothpaste. Promotion analysis
engine 19 can
then categorize one or more of the toothpastes having correlation factors
above a threshold as
similar to the target toothpaste.
100321 As will be described in more detail below, sales data for the similar
toothpastes are
employed by promotion analysis engine 19 to calculate an estimated baseline
sales for the
target toothpaste. For example, promotion analysis engine 19 uses a weighted
sum of the
estimated regular sales for the similar toothpastes to estimate the baseline
sales of the target
toothpaste during the three month time period including the one week circular
promotion.
The weights associated with the similar toothpastes correspond to the degree
to which each
similar toothpaste is correlated to the target toothpaste. In one example,
promotion analysis
engine 19 uses the estimated baseline sales for the target toothpaste to
determine the sales lift
attributable to the circular promotion for the target toothpaste. For example,
promotion
analysis engine 19 uses the sales data stored in data repository 16 to
calculate the difference
between the actual sales of the target toothpaste during the one week circular
promotion and
the estimated baseline sales of the target product that week.
[0033] FIG. 2 is a block diagram illustrating an example computing device 30
that is
configured to calculate the sales lift for a product or products that is
attributable to one or
more sales promotions associated with the product(s). FIG. 2 illustrates only
one example of
computing device 30, and many other examples of computing device 30 can be
used in other
instances. In addition, although discussed with respect to one computing
device 30, one or
more components and functions of computing device 30 can be distributed among
multiple
computing devices 30.
[0034] Computing device 30 is, in certain examples, be substantially similar
to server device
18 of FIG. I. As such, examples of computing device 30 include, but are not
limited to,
various types of network devices such as a data processing appliance, web
server, specialized
CA 02841614 2014-02-03
Docket No.: 201201490
media server, personal computer operating in a peer-to-peer fashion, or
another type of
network device. Additional examples of computing device 30 include, but are
not limited to,
computing devices such as desktop computers, workstations, network terminals,
and portable
or mobile devices such as personal digital assistants (PDAs), mobile phones
(including smart
phones), tablet computers, laptop computers, netbooks, ultrabooks, and others.
In this
manner, computing device 30 is substantially similar to one of client devices
12 of FIG. 1.
[0035] As shown in the example of FIG. 2, computing device 30 includes display
32, user
interface 34, one or more communication units 36, one or more processors 38,
and one or
more storage devices 42. As illustrated, computing device 30 further includes
promotion
analysis engine 19 and operating system 44. Promotion analysis engine 19
includes sales
data module 46, baseline estimation module 48, and sales lift module 50. Each
of
components 32, 34, 36, 38, and 42 are interconnected (physically,
communicatively, and/or
operatively) for inter-component communications. In some examples,
communication
channels 40 include a system bus, network connection, inter-process
communication data
structure, or any other channel for communicating data. As one example in FIG
2,
components 32, 34, 36, 38, and 42 are coupled by one or more communication
channels 40.
Promotion analysis engine 19, sales data module 46, baseline estimation module
48, sales lift
module 50, and operating system 44 also communicate information with one
another as well
as with other components of computing device 30.
[0036] Display 32 can be a liquid crystal display (LCD), e-ink, organic light
emitting diode
(OLED), or other display. Display 32 presents the content of computing device
30 to a user.
For example, display 32 displays the output of promotion analysis engine 19
executed on one
or more processors 38 of computing device 30, confirmation messages,
indications, or other
functions that may need to be presented to a user. In some examples, display
32 provides
some or all of the functionality of a user interface of computing device 30.
For instance,
display 32 can be a touch-sensitive and/or presence-sensitive display that can
display a
graphical user interface (GUI) and detect input from a user in the form of
user input gestures
using capacitive or inductive detection at or near the presence-sensitive
display.
[0037] User interface 34 allows a user of computing device 30 to interact with
computing
device 30. Examples of user interface 34 include, but are not limited to, a
keypad embedded
on computing device 30, a keyboard, a mouse, a roller ball, buttons, or other
devices that
11
CA 02841614 2014-02-03
Docket No.: 201201490
allow a user to interact with computing device 30. In some examples, computing
device 30
does not include user interface 34, and the user interacts with computing
device 30 with
display 32 (e.g., by providing various user gestures). In some examples, the
user interacts
with computing device 30 with user interface 34 and display 32.
100381 Computing device 30, in some examples, also includes one or more
communication
units 36. Computing device 30, in one example, utilizes one or more
communication units
36 to communicate with external devices (e.g., clients 12 of FIG. 1) via one
or more
networks, such as one or more wireless networks, one or more cellular
networks, or other
types of networks. One or more of communication units 36 can be a network
interface card,
such as an Ethernet card, an optical transceiver, a radio frequency
transceiver, or any other
type of device that can send and receive information. Other examples of such
network
interfaces include Bluetooth, 3G and WiFi radio computing devices as well as
Universal
Serial Bus (USB).
100391 One or more processors 38 (hereinafter "processors 38"), in one
example, are
configured to implement functionality and/or process instructions for
execution within
computing device 30. For example, processors 38 are capable of processing
instructions
stored at one or more storage devices 42, which include, in some examples,
instructions for
executing functions attributed to promotion analysis engine 19 and the modules
thereof
Examples of processors 38 include any one or more of a microprocessor, a
controller, a
digital signal processor (DSP), an application specific integrated circuit
(ASIC), a field-
programmable gate array (FPGA), or equivalent discrete or integrated logic
circuitry.
100401 One or more storage devices 42 (hereinafter "storage devices 42") can
be configured
to store information within computing device 30 during operation. Storage
devices 42, in
some examples, are described as a computer-readable storage medium. In some
examples,
storage devices 42 include a temporary memory, meaning that a primary purpose
of one or
more storage devices 42 is not long-term storage. Storage devices 42 are, in
some examples,
described as a volatile memory, meaning that storage devices 42 do not
maintain stored
contents when the computer is turned off. Examples of volatile memories
include random
access memories (RAM), dynamic random access memories (DRAM), static random
access
memories (SRAM), and other forms of volatile memories known in the art. In
some
examples, storage devices 42 are used to store program instructions for
execution by one or
12
CA 02841614 2014-02-03
=
Docket No.: 201201490
more processors 38. Storage devices 42, for example, are used by software or
applications
running on computing device 30 (e.g., promotion analysis engine 19) to
temporarily store
information during program execution.
10041] Storage devices 42, in some examples, also include one or more computer-
readable
storage media. Storage devices 42 can be configured to store larger amounts of
information
than volatile memory. Storage devices 42 can further be configured for long-
term storage of
information. In some examples, storage devices 42 include non-volatile storage
elements.
Examples of such non-volatile storage elements include magnetic hard discs,
optical discs,
floppy discs, flash memories, or forms of electrically programmable memories
(EPROM) or
electrically erasable and programmable (EEPROM) memories.
10042] As illustrated in FIG. 2, computing device 30 includes promotion
analysis engine 19.
Promotion analysis engine 19 includes sales data module 46, baseline
estimation module 48,
and sales lift module 50. Sales data module 46 of promotion analysis engine 19
are
configured to retrieve, receive, or otherwise reference actual sales
transaction data
corresponding to sales of products or other items at a number of different
locations of a
retailer. Sales data module 46, for example, retrieves sales data from a data
repository like
data repository 16 of FIG. 1. Baseline estimation module 48 of promotion
analysis engine 19
is configured to estimate baseline sales for a target product of a retailer
during a time period
including at least one sales promotion. For example, baseline estimation
module 48 uses a
weighted sum of estimated regular sales for the target product and other
products with similar
sales trends to the target product to estimate the baseline sales of the
target product during a
time period including one or more promotions. Sales lift module 50 is
configured to
calculate the sales lift for a target product that is attributable to one or
more sales promotions
associated with the target product based at least in part on the estimated
baseline sales for the
target product. The functions of sales data module 46, baseline estimation
module 48, and
sales lift module 50 of promotion analysis engine 19 are described in greater
detail with
reference to FIGS. 3-5 below.
100431 Although shown as separate components in FIG 2, in some examples, one
or more of
promotion analysis engine 19, sales data module 46, baseline estimation module
48, and sales
lift module 50 can be part of the same module. In some examples, one or more
of promotion
analysis engine 19, sales data module 46, baseline estimation module 48, and
sales lift
13
CA 02841614 2014-02-03
Docket No.: 201201490
module 50 are formed in a common hardware unit. In some instances, one or more
of
promotion analysis engine 19, sales data module 46, baseline estimation module
48, and sales
lift module 50 are software and/or firmware units that are executed on
processors 38. In
general, the modules of promotion analysis engine 19 are presented separately
for ease of
description and illustration. However, such illustration and description
should not be
construed to imply that these modules of promotion analysis engine 19 are
necessarily
separately implemented, but can be in some examples.
[0044] Additionally, although the foregoing examples have been described with
reference to
promotion analysis engine 19 including sales data module 46, baseline
estimation module 48,
and sales lift module 50, in other examples such function/processing engines
or other
mechanisms configured to operate in accordance with the disclosed examples can
be
physically and/or logically differently arranged. For example, promotion
analysis engine 19
includes a baseline estimation module and sales lift module, in which one or
both of the two
modules are configured to retrieve or otherwise reference sales data, e.g.,
retrieved by
computing device 30 from a data repository like data repository 16 of FIG. 1.
A wide variety
of other logical and physical arrangements are possible in order to implement
the
functionality attributed to the example of promotion analysis engine 19
illustrated in FIGS. 1
and 2.
[0045] Computing device 30 includes operating system 44. Operating system 44,
in some
examples, controls the operation of components of computing device 30. For
example,
operating system 44, in one example, facilitates the communication of
promotion analysis
engine 19 with processors 38, display 32, user interface 34, and communication
units 36.
100461 Computing device 30 can include additional components not shown in FIG.
2. For
example, computing device 30 can include a battery to provide power to the
components of
computing device 30. Similarly, the components of computing device 30 may not
be
necessary in every example of computing device 30. For instance, in certain
examples
computing device 30 may not include display 32.
[0047] FIG. 3 is a flowchart illustrating an example method of determining the
sales lift for a
product or products that is attributable to one or more sales promotions
associated with the
product(s). The method of FIG. 3 includes estimating non-promotional sales
volume of a
target item during a period of time including a sales promotion for the target
item based on
14
CA 02841614 2014-02-03
Docket No.: 201201490
actual sales data for the target item during the period of time (100),
correlating estimated
non-promotional sales for each of a plurality of other items during the time
period to the
target item (102), categorizing one or more of the other items as similar to
the target item
based on the correlation of the non-promotional sales of the plurality of
other items to the
non-promotional sales of the target item (104), estimating baseline sales of
the target item
during the period of time based on sales for each of the one or more other
items categorized
as similar to the target item (106), and calculating sales lift for the target
item attributable to
the sales promotion for the target item based on the actual sales data for the
target item and
the estimated baseline sales of the target item during the time period (108).
100481 The example method of FIG. 3 illustrates generally the manner in which
examples
according to this disclosure function to determine the sales lift for a
product or products that
is attributable to one or more sales promotions associated with the
product(s). The functions
of the method of FIG. 3 can be carried out by a variety of computing devices,
including, e.g.,
by promotion analysis engine 19 of computing device 30 of FIG. 2. For example,
Sales data
module 46 of promotion analysis engine 19 is configured to retrieve, receive,
or otherwise
reference actual sales transaction data corresponding to sales of products or
other items at a
number of different locations of a retailer. Sales data module 46, for
example, retrieves sales
data from a data repository like data repository 16 of FIG. 1, which stores
sales transaction
data that has been captured by PUS system 21.
100491 Baseline estimation module 48 of promotion analysis engine 19 is
configured to
estimate baseline sales for a target product of a retailer during a time
period including at least
one sales promotion. For example, baseline estimation module 48 uses a
weighted sum of
estimated regular sales for the target product and other products with similar
sales trends to
the target product to estimate the baseline sales of the target product during
a time period
including one or more promotions. In the context of the example method of FIG.
3, baseline
estimation module 48 estimates non-promotional sales volume of an item during
a period of
time including a sales promotion for the target item based on actual sales
data for the target
item during the period of time (100). In one example, this estimation is
executed iteratively
by baseline estimation module 48 for a plurality of items that below to a
category of items
sold by a retailer.
CA 02841614 2014-02-03
Docket No.: 201201490
100501 In one example, baseline estimation module 48 of promotion analysis
engine 19 also
correlates non-promotional sales for each of a plurality of items during the
time period to a
target item (102). In one example, baseline estimation module 48 statistically
correlates the
trend of the non-promotional sales of each of the items to the target item to
determine the
degree to which the non-promotional sales trends of the items are similar to
the non-
promotional sales trend of the target item. Based on the correlation, baseline
estimation
module 48 also categorizes one or more of the items as similar to the target
item (104).
Additionally, baseline estimation module 48 of promotion analysis engine 19
estimates the
baseline sales of the target item during the period of time based on the non-
promotional sales
for the target item and each of the one or more other items categorized as
similar to the target
item (106). For example, baseline estimation module 48 uses a weighted sum of
estimated
regular sales for the target product and other products with similar sales
trends to the target
product to estimate the baseline sales of the target product during a time
period including one
or more promotions.
100511 After the baseline sales has been estimated by baseline estimation
module 48, sales
lift module 50 calculates the sales lift, e.g. the incremental increase in
sales for the target
item attributable to the sales promotion for the target item based on the
actual sales data for
the target item and the estimated baseline sales of the target item during the
time period
(108). For example, sales lift module 50 calculates the sales lift of the
target item as the
difference between the actual sales of the target item and the estimated
baseline sales of the
target item during the week of the promotion.
100521 FIG. 4 is a flowchart illustrating another example method according to
this disclosure
of determining the sales lift for a product that is attributable to a sale
promotion associated
with the product. As with the method of FIG. 3, the method of FIG. 4 may be
carried out by a
variety of computing devices, including, e.g., by promotion analysis engine 19
of computing
device 30 of FIG. 2. As has been alluded to above, one of the goals of
examples according to
this disclosure is to evaluate the effect of sales promotions on the sales of
products of a
retailer. One way to evaluate sales promotions is to estimate the incremental
increase (or
decrease) in sales of a product during a promotion. Such sales lift
estimations can be
executed for one product, a large number of products, or even all of the
products sold by a
retailer at one or more locations. In some cases, sales lift estimations are
executed for a
16
CA 02841614 2014-02-03
Docket No.: 201201490
number of products belonging to a common category and which are promoted
during the
same time period, e.g., during one week in a month or a quarter.
[0053] The example method of FIG. 4 can be employed to estimate the sales lift
for each
product in a category and also calculate the total category sales lift. The
sales lift calculation
is a relatively straight forward calculation of the difference between the
actual sales of an
item during a promotion and an estimate of what the item sales would have been
for that
particular time period if the promotion did not occur, or, in other words, if
the item was not
on promotion. The actual sales can be tracked and stored electronically by a
retailer using,
e.g. computing system such as POS system 21 described with reference to FIG.
I. The
baseline sales, however, can be challenging to accurately and efficiently
estimate. In the
example of FIG. 4, therefore, functions 200 ¨ 212 are all executed in order to
estimate the
baseline number of units of an item that would have been sold during a
promotion week if
the item was not on promotion. Once the baseline sales have been estimated, in
this case, the
baseline number of units, sales lift for the target item can be quickly
determined as the
difference between the actual promotional sales and the estimated baseline
sales.
[0054] The calculation of incremental sales lift is illustrated in the example
of FIG. 5, which
is a graph of actual unit sales 300 of a target product for each week in a
thirteen week, three-
month time period and baseline unit sales 302 during a one week promotion in
week 9 of the
thirteen week period. As illustrated in the example of FIG. 5, the sales lift
for the target
product is the difference between the estimated baseline unit sales 304 in
week nine and the
actual unit sales 306 of the target product during the promotion.
[0055] In some examples according to this disclosure, the sales lift is
determined for each of
the items in the category in the manner illustrated in FIG. 4. Based on the
incremental sales
lift for each of the items in the category, the total category sales lift is
then be determined.
[0056] In one example of the method of FIG. 4, sales data module 46 of
promotion analysis
engine 19 retrieves sales data stored on server 18 or data repository 16 for a
plurality of
products in a product category over a period of three months including
thirteen weeks. The
actual sales data includes sales transaction data for the products during the
three month
period of time, which indicates the actual number of units and sales revenue
of each
transaction. The sales data includes sales across one or more store locations
for the retailer
of the products. In one example, the time period for which the sales data is
retrieved by sales
17
CA 02841614 2014-02-03
Docket No.: 201201490
data module 46 includes a promotion. Additionally, in one example, the
promotion lasts for
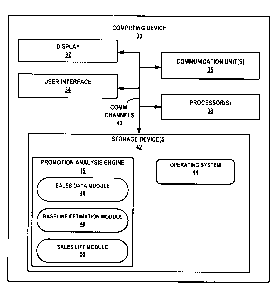
one week of the thirteen week, three month period and all of the products in
the category are
on promotion during the same week. In other examples, only one or some of the
products in
a category is on sale in any given week.
100571 Baseline estimation module 48 employs the actual sales data retrieved
by sales data
module 46 to determine an estimate of the regular sales of the products in the
category during
the non-promotional and promotional weeks in the three month period of time.
In some
examples, it is convenient to index product sales values against one or more
parameters like
average sales. For example, regular sales of a product in one week of the
thirteen week, three
month period of time is indexed to the average weekly sales of the product
over all thirteen
weeks. In FIG. 4, baseline estimation module 48 determines the indexed regular
unit sales
(IndexRegUnit) of a product in each week in the three month period that does
not include the
one week promotion by indexing the actual regular unit sales of the product
during the non-
promotional weeks to the average weekly unit sales, Avg WkUnit, of the product
over the
weeks when it is not on promotion, e.g. has regular sales. Thus, in the twelve
non-
promotional weeks of the three-month period of time, the regular sales of the
product is equal
to the actual regular sales and the IndcxRegUnit = RegUnit/AvgWkUnit (200). In
one
example, baseline estimation module 48 iteratively repeats the calculation of
IndexRegUnit
for each product in the category such that the calculation can be expressed
as:
IndexRegUnit _rn) = ActRegUnit (i i_õ, WI _)/AvgWkUnit(i
where:
are products 1-n in the category,
w are 1-m number of weeks in the three-month period of time, and
all of the weeks 1-m are non-promotional weeks.
100581 As noted above and illustrated by the determination of IndexRegUnit
(200) in the
example of FIG. 4, regular sales for an item during non-promotional sales
periods for the
item is equal to the actual sales of the item. However, regular sales of an
item during a
promotion can only be estimated based on actual sales data. Thus, in order to
determine/estimate the indexed regular unit sales of each product in the
category for the
18
CA 02841614 2014-02-03
Docket No.: 201201490
whole three month period of time including the week of the category promotion,
baseline
estimation module 48 estimates the indexed regular unit sales
(EstindexRegUnit) of a
product during the one promotional week. In one example, baseline estimation
module 48
interpolates between the IndexRegUnit sales of a product in one or more of the
weeks before
and after the week of the promotion to determine EstIndexRegUnit in the
promotional week
(202).
100591 For example, the promotion week occurs on week 8 of the thirteen week,
three-month
period of time. In one such example, baseline estimation module 48 fits a
curve to the
indexed regular unit sales of a product during weeks 1-7 and 9-13 to estimate
the indexed
regular unit sales during the promotional week 8. In another example, baseline
estimation
module 48 applies one or more of a number of regression analyses to the
indexed regular unit
sales of a product during weeks 1-7 and 9-13 to estimate the indexed regular
unit sales during
the promotional week 8. In another example, baseline estimation module 48
performs a
linear interpolation between the indexed regular unit sales of a week 7 and
week 9 to
determine EstIndexRegUnit during week 8.
100601 After determining the indexed regular unit sales of the products in the
non-
promotional and promotional weeks of the time period, baseline estimation
module 48 is
configured to determine one or more products in the category that exhibit
sales trends during
the time period that are similar to a target product. In the context of the
example of FIG. 4,
baseline estimation module 48 calculates a correlation factor (CorrFactor) for
each unique
pair of products in the category. The correlation factor is indicative of a
similarity between
the regular sales for each product of the pair of products over the period of
time.
100611 FIG. 6 is a graph of actual and estimated unit sales of six different
products for each
week in a thirteen week, three-month time period. The unit sales spikes for
products A and
C-F in week 11 and for product B correspond to promotional weeks for each of
the respective
products. In one example, baseline estimation module 48 is configured to
statistically
correlate the sales of products B-F to product A. In one example, baseline
estimation module
48 employs a Pearson Correlation Calculation to correlate the sales of
products B-F to
product A. In other examples, baseline estimation module 48 can employ other
statistical
correlation techniques to correlate the sales of products B-F to product A..
The correlation
can be based on. actual sales or regular sales (e.g. including actual regular
sales during non-
19
CA 02841614 2014-02-03
Docket No.: 201201490
promotional weeks an.d estimated regular sales during promotional weeks),
either of which
can be indexed, e.g., against average weekly sales in the manner described
above.
[0062] In one example, baseline estimation module 48 expresses the similarity
between the
sales of products in the category and the target product as a percentage
correlation. For
example, referring again to products A-F in FIG. 6, the sales trend of product
F over the 13
week time period is most closely correlated to the sales trend of product A
with a correlation
of approximately % 97.8. In contrast, the sales trend of product B over the 13
week time
period is the least correlated to the sales trend of product A with a
correlation of
approximately A 65.9. One of the differences between product B and product A
that, at least
in part, reduces the correlation between the sales of the two products is that
the promotion for
product B occurs in week 12, while the promotion for product A and the rest of
the products
C-F occurs in week 11.
100631 Referring again to the example method of FIG. 4, baseline estimation
module 48
determines one or more products that are similar to the target product based
on the
correlation factor, Cori-Factor, of each product to the target product (206).
For example,
baseline module 48 analyzes the correlation factors of each of the products to
the target
product to find one or more products that have correlation values to the
target product that
are greater than or equal to a threshold correlation value. Various threshold
correlation
values may be employed in examples according to this disclosure. In one
example, an initial
threshold correlation is set to 0.8, and if less than 5 similar products are
found at this
threshold, the correlation threshold is dynamically lowered. In one example,
the initial
threshold correlation is 0.8 and, if less than 5 similar products are found,
the threshold is
lowered to 0.6. The correlation threshold and the requirement for the number
of similar items
are parameters that can be adjusted.
[0064] in the example of products A-F in FIG. 6, product C has a correlation
factor of %
68.2 to product A. Product D has a correlation factor of % 75.6 to product A.
Product E has
a correlation factor of % 75.6 to product A. In one example, baseline module
48 analyzes the
correlation factors of each of the products B-F to target product A to find
one or more
products that have correlation values to the target product that are greater
than or equal to a
threshold correlation value of approximately % 75. Thus, in the example of
FIG. 6, baseline
estimation module 48 determines that products D, E, and F are similar to
product A.
CA 02841614 2014-02-03
Docket No.: 201201490
10065] When the estimated indexed regular sales of the similar products are
used to
determine baseline sales for the target product, the similar products may not
all be treated
equally in the calculation. One reason for weighting the similar items in the
baseline sales
calculation is that the products may have a substantially different sales
volume than the target
product. Thus, in one example, baseline estimation module 48 calculates a
weight for each
similar product that is indicative of both the degree of sales trend
correlation between the
similar product and the target product and the degree of similarity between
the absolute sales
volumes of the two products. In the example of FIG. 4, baseline estimation
module
calculates the weights for each of the similar products according to the
following formula.
Weight (il) = CorrFactor (i, j)*Scalar/VolFactor
where:
j ¨ the target product,
= similar products 1-n, and
Scalar = a constant that scales up or down the absolute value of Weight (ii-n,
VolFactor = lAvgWkUnit(i) ¨ AvgWkUnit(j)
100661 Once baseline estimation module 48 has the weighted correlations of the
similar
products to the target product and the estimated indexed regular sales of the
one or more
similar products, module 48 calculates an estimate of the baseline unit sales
for the target
product (210). In one example, baseline estimation module 48 first calculates
an estimated
indexed baseline unit sales for the target product over the time period
according to the
following formula.
CA 02841614 2014-02-03
Docket No.: 201201490
BaselndexUnit (j, wi-n) =
SUM [Weight 01_0* EstIndexRegunit(i11, wi-)}/SUM[Weight
where:
j = the target product,
i = similar products 1-n,
w1_õ, = weeks 1-m in the time period, and
[0067] Baseline estimation module 48 can also determine the non-indexed
baseline unit sales
for the target product (212). In one example, baseline estimation module 48
calculates the
baseline unit sales for the target product based on the estimated indexed
baseline unit sales
and the average weekly unit sales, Avg WkUnit, for the product across all
weeks in the time
period. In other words, baseline estimation module 48 calculates the baseline
unit sales for
the target product according to the following formula.
BaseUnit (j, w141) = BaselndexUnit (j, * AvgWkUnit(j)
where:
j = the target product,
= weeks 1-n in the time period
100681 As noted above, the sales lift calculation for a target product is a
relatively straight
forward calculation of the difference between the actual sales of the product
during a
promotion and an estimate of what the product sales would have been for that
particular time
period if the promotion did not occur, or, in other words, if the item was not
on promotion.
The estimate of what the product sales would have been for the time period if
the promotion
did not occur, in examples according to this disclosure, is denoted as the
estimated baseline
sales of the product. Thus, the sales lift calculation is executed by sales
lift module 50 of
computing device 30 by determining the difference between the actual sales of
the target
product and the estimated baseline sales of the product during the promotion
week. In the
example of FIG. 4, incremental sales lift, IncremSales (j), of the target
product is calculated
according to the following formula.
CA 02841614 2014-02-03
Docket No.: 201201490
IncremSales (j, wp) = ActualSales (j, wp) ¨ [BaseUnit (j, wp)*RegPrice(j)]
where:
ActualSales (j, wp) = actual sales dollars for target product during the
promotion week
j ¨ target product,
wp = promotional week during time period
RegPrice(j) = price of the target product without any promtion
100691 As noted above, in some examples according to this disclosure, the
sales lift for entire
category of products is determined based on the individual estimated baseline
unit sales
and/or the sales lift of each of the items in the category. In one example,
the category sales
lift is calculated as the sum of the sales lifts of each .of the items in the
category. In another
example, the category sales lift is expressed as a percentage increase in
either sales units or
sales dollars. For example, the actual sales units and the estimated baseline
units during a
promotional week of each of the items in the category are summed together to
determine a
category actual sales units and a category estimated baseline units. In this
case, the
percentage units incrementality for the category are expressed as equal to the
category actual
sales units minus the category estimated baseline units divided by the
category estimated
baseline units. In another example, the actual sales dollars and the estimated
baseline dollars
during a promotional week of each of the items in the category are summed
together to
determine a category actual sales dollars and a category estimated baseline
dollars. In this
case, the percentage dollars incrementality for the category is expressed as
equal to the
category actual sales dollars minus the category estimated baseline dollars
divided by the
category estimated baseline dollars.
100701 The techniques described in this disclosure can be implemented, at
least in part, in
hardware, software, firmware or any combination thereof. For example, various
aspects of
the described techniques can be implemented within one or more processors,
including one
or more microprocessors, digital signal processors (DSPs), application
specific integrated
circuits (ASICs), field programmable gate arrays (FPGAs), or any other
equivalent integrated
or discrete logic circuitry, as well as any combinations of such components.
The term
"processor" or "processing circuitry" may generally refer to any of the
foregoing logic
CA 02841614 2014-02-03
Docket No.: 201201490
circuitry, alone or in combination with other logic circuitry, or any other
equivalent circuitry.
A control unit including hardware can also perform one or more of the
techniques of this
disclosure.
10071] Such hardware, software, and firmware can be implemented within the
same device
or within separate devices to support the various operations and functions
described in this
disclosure. In addition, any of the described units, modules or components can
be
implemented together or separately as discrete but interoperable logic
devices. Depiction of
different features as modules or units is intended to highlight different
functional aspects and
does not necessarily imply that such modules or units must be realized by
separate hardware
or software components. Rather, functionality associated with one or more
modules or units
can be performed by separate hardware or software components, or integrated
within
common or separate hardware or software components.
100721 The techniques described in this disclosure can also be embodied or
encoded in a
computer-readable medium, such as a computer-readable storage medium,
containing
instructions. Instructions embedded or encoded in a computer-readable medium
can cause a
programmable processor, or other processor, to perform the method, e.g., when
the
instructions are executed. Computer readable storage media includes random
access memory
(RAM), read only memory (ROM), programmable read only memory (PROM), erasable
programmable read only memory (EPROM), electronically erasable programmable
read only
memory (EEPROM), flash memory, a hard disk, a CD-ROM, a floppy disk, a
cassette,
magnetic media, optical media, or other computer readable media.
100731 In some examples, computer-readable storage media includes non-
transitory media.
The term "non-transitory" may indicate that the storage medium is not embodied
in a carrier
wave or a propagated signal. In certain examples, a non-transitory storage
medium can store
data that can, over time, change (e.g., in RAM or cache).
100741 Various examples have been described. These and other examples are
within the
scope of the following claims.
24