Note: Descriptions are shown in the official language in which they were submitted.
CA 02842681 2014-01-21
WO 2013/013229
PCT/US2012/047766
Instrument and Method for Optical Particle Sensing
Field of the Invention
This application is generally in the area of single particle optical light
scattering devices, and techniques for using them, particularly measure
extremely
small particles.
Background of the Invention
It is often essential to characterize biological particles by their size,
surface
condition, states of activation of any surface receptors, distribution, and
the like. This
information is useful in cell-based assays and other processes that rely upon
those
characteristics. Additionally, it is useful in certain diagnostic applications
to detect
known changes of the surface of a biological particle. Accordingly, it can be
desirable to detect the surface and monitor changes to the surface in an
efficient and
accurate manner.
"Electrophoretic Quasi-Elastic Light Scattering" (EQELS) is one method for
characterizing biological particles. This method
uses electrophoresis that is
dependent on the particle's surface charge density to identify and
characterize
suspended biological particles. EQELS uses cells placed in an electric field,
where
the surface charge of the particle will determine how that particle moves in
the
electric field. Monitoring
the electrophoretic mobility of the cells provides
information useful in distinguishing among different particles in the field.
One can
screen and optimize drug candidates which interact with the biological
particles by
comparing the spectra of the particles alone, or bound to the drug candidates.
Coulter counters can also be used to characterize biological particles. These
devices are primarily used to count and size cells and other biological
particles. The
Coulter Counter works by drawing fluid containing the biological particle
through a
small opening located within a current between two electrodes. As the fluid is
drawn
through the opening, the biological particles flow through the current and
measurably
displace a portion of the current. The measurable displacement is translated
to a pulse
that is digitally processed by the Coulter Counter and translated to allow one
to
characterize the size and number of biological particles in the fluid.
1
CA 02842681 2014-01-21
WO 2013/013229
PCT/US2012/047766
Flow cytometry can also be used to characterize biological particles. Flow
cytometry uses a beam of light, such as a laser, trained on a fluid to
characterize,
count and optionally sort particles in the fluid. The fluid is focused into a
stream, and
detectors at the intersection of the light and the fluid stream determine
scatter ¨ both
forward and side. Additionally, a fluorescent detector may be present to
detect
fluorescent or fluorescently-tagged particles. One can determine various
physical and
chemical characteristics of each individual particle by analyzing the detected
pattern.
These methods are useful in detecting and characterizing microparticles,
including determining the number of particles, density within a fluid medium,
size,
and surface characteristics of the particle, confirming binding, or lack
thereof, and the
like. The microparticles are generally in the size of between 0.1 tim and 100
pm.
However, developments in technology demand the characterization of smaller
biological particles, including, but not limited to, nanoparticles.
The size of biological particles that can be analyzed using currently
available
technology is limited. Accordingly, there is a need for devices and processes
for
characterizing biological particles that can detect biological particles of
varying sizes,
including particles smaller than microparticles, and which can characterize
the
detected particles with accuracy, quantify the particles and/or monitor the
particles.
The present invention provides such devices and processes.
Summary of the Invention
The present invention relates to devices useful for, and methods of detecting
sizes and distributions of particles using focused light scattering
techniques. The
devices use focused light scattering techniques, and can be used, for example,
to
diagnose disease, identify therapeutic agents, and obtain other useful
information
about biological particles and/or therapeutic agents in a sample medium.
Representative particle sizes that can be measured range from between about
0.1 [tm
to about 100 [tm, more typically in the range of between about 0.1 and about
20
Briefly, focused light scattering techniques involve passing a sample media
through a particular path, where a focused beam of light passes through the
sample
media. The focused beam is of a size such that a particle in the size range of
0.1 to 10
2
CA 02842681 2014-01-21
WO 2013/013229
PCT/US2012/047766
[tm is sufficient to block all of the beam, or a significant enough part of
the beam, so
that the particle size can be measured.
When there are no particles passing through the pathway of the beam, the
beam passes through the media and onto a detector. When a particle, or part of
a
particle, passes through the beam, the beam is deflected. A diminished amount
of
light, or no light at all, then reaches the detector, thus indicating that a
particle (or part
of a particle) has interacted with the beam. The amount of diminished light
reaching
the detector provides information about the size of the particle. This is
repeated as
particles in the sample medium pass through the beam, for example, until the
sample
medium has entirely passed through the beam. Appropriate algorithms then take
the
information, and the output is a spectrum showing the particle size and
particle
distribution.
The device includes light from at least one, and, ideally, at least two laser
light
sources. Where two or more laser light sources are used, they each ideally
provide
light at different wavelengths. Where two or more light sources are used, they
can be
passed through a beam splitter, which combines the light beams. The combined
light
beams pass through a focusing lens, which focuses the light into a narrow
beam. The
beam is then passed through a flow cell.
Dispersions including particles which are to be counted and sized are passed
through a flow cell, where they pass through the focused beam of light. In one
embodiment, the solutions are introduced into the flow cell using a
hydrodynamic
sample injector. When the focused light beam comes into contact with a
particle, the
light is scattered.
The scattered light is then passed through a spatial filter, such as a
circular
spatial filter. The filter allows light reflected at certain angles,
indicative of light
hitting particles of a certain size, to pass through. Ideally, the filter does
not permit
light to pass through when it has not interacted with a particle. However, a
portion of
this light can be reflected off of a mirror, which can be a movable mirror,
onto a
detector (ideally an extinction detector).
The light passing through the spatial filter is then passed through a
collimating
lens, which focuses the beam from the reflected angles into a straight line.
Where one
3
CA 02842681 2014-01-21
WO 2013/013229
PCT/US2012/047766
laser is used, the light can then pass through a focusing lens, which then
focuses the
light into a narrower beam, which is then passed on to a detector. Where two
lasers
are used, the light can then pass through a second beam splitter, which splits
the beam
into two beams.
Ideally, the splitter does not change the orientation of one of the beams.
That
is, one beam proceeds directly through the splitter, and the other is
diverted, for
example, at a 90 degree angle. In this manner, rather than using a combination
of a
collimating lens and focusing lens, one of the beams need only be passed
through a
focusing lens. The other beam may be spread out when it passes through the
splitter,
in which case it is advantageous to use both a collimating lens and a focusing
lens.
The focused beams of light are passed through chromatic filters, which filters
out light of a wavelength produced by one of the lasers, and passes light from
the
wavelength produced by the other of the lasers onto a detector. This way, it
is
possible to detect light from each of the lasers at separate detectors. Where
some of
the particles may be labeled, and the label is detectable, for example, by
fluorescence,
one can thus obtain information about all particles, and about a subset of
particles that
fluoresces. Those particles which fluoresce are typically those which form a
complex
with a fluorescently-labeled material, such as a fluorescently-labeled
antibody. In
one embodiment, a scattered light detector is used to detect light reflected
from all
particles, and a fluorescence detector is used to detect light reflected from
particles
that either are fluorescent, or are complexed with fluorescently-labeled
materials, such
as fluorescently-labeled antibodies.
The device also includes a dynamic monitoring system and method employed
to monitor the size and/or number of particles, and, optionally, additional
information
on a subset of the particles, such as their number and/or size, which
fluoresce when
complexed to a particular fluorescent molecule, in a single particle optical
sizing
device as described herein. In one embodiment, the dynamic monitoring system
is a
computer either physically connected to the device, or connected remotely, for
example, using Bluetooth, infrared, or other such technology, and capable of
receiving information from the various detectors, as well as software which
handles
the digital interface with the device, wherein the computer and software are
capable of
counting particles, sizing particles, and storing information on the number
and size of
4
CA 02842681 2014-01-21
WO 2013/013229
PCT/US2012/047766
the particles in a given sample based on the information received from the
detectors
and algorithms that use this information to determine particle size and/or
number of
particles.
Using focused light scattering techniques, significantly smaller particles can
be detected than if techniques such as EQELS, flow cytometry, and other
conventional methods of measuring biological particles are used. Mathematical
algorithms described herein can enable one to not only detect small particles,
but also
to determine a range of particle sizes, relative quantities of such particles,
and shapes
of the particles.
Cells are one type of biological particle that can be detected. The method can
be used to determine the presence or absence of a specific type of cell in a
given
solution. For example, a sample of blood, urine, spinal fluid, and the like
can be
evaluated for the presence or absence of bacteria, fungi, viruses, and the
like. The
particle size, and, optionally, particle shape, can also provide information
about the
specific type of bacteria, fungi or virus.
In one embodiment, suitable information on the particles can be obtained
simply by obtaining a spectra using focused light scattering of a sample
medium,
wherein the particle size and distribution provides sufficient information
about the
presence or absence of certain biological particles present in the sample
medium. For
example, specific bacteria, fungi, or viruses can be identified solely on the
basis of
their size, and liposomal suspensions can be evaluated for agglomeration
solely on the
basis of the size of the agglomerated particles.
In other embodiments, where there is an interest in determining whether a
particular agent forms a complex with a particular type of biological
particle,
additional information may be required. That is, one can determine the
presence or
absence of a particular cell type, or an ejected particle from a type of cell,
by forming
a complex between a) the cell or ejected particle and b) an active agent
conjugated to
a microparticle or nanoparticle ("conjugate"). The complex has a larger
particle size
than the cell, the ejected particle, or the conjugate, so the focused light
scattering
technique can determine whether a complex was formed on the basis of particle
size.
CA 02842681 2014-01-21
WO 2013/013229
PCT/US2012/047766
The complex can be formed with a labeled material, such as a fluorescently-
labeled antibody. In one embodiment, the device includes one or more
additional
lasers that shine a beam of light at a frequency in which the fluorescently-
labeled
antibody/antibodies absorb light. Thus, one source of light can be used to
count and
size the number of particles, and another can be used to determine the number
of
particles that formed a complex with a desired fluorescently-labeled material.
In some aspects of this embodiment, the biological particle is a cell that
expresses a specific receptor, and the techniques permit high throughput
screening of
putative therapeutic agents that bind to the receptor.
In other aspects of this embodiment, the biological particle comprises cells
from a patient, for example, blood cells or cancer cells, and these cells are
incubated
with putative therapeutic agents. Agents that bind to the cells can
potentially be
useful as therapeutic agents for the patient. Accordingly, this embodiment
provides
personalized medicine approaches.
In some of these embodiments, two spectra are taken. The first is taken on the
sample media before complex formation, and the second is taken after complex
formation, so one can look for the difference in particle size and
distribution.
However, in other embodiments, where the complex has a known particle size,
and all
that is required is to show that the complex formed, one can simply incubate
the
biological particle and the substance which may or may not form a complex with
the
biological particle, and use focused light scattering techniques to determine
whether
the complex was formed.
If the sample medium, with the biological particle and the conjugate both
present, is passed repeatedly through the focused light scattering detector
over a
period of time, the kinetics of complex formation can be observed.
If the sample medium is scanned with the biological particle and the conjugate
both present, but with different scans taken with differing concentrations of
the
biological particle and/or conjugate, one can determine additional
information,
relative to binding affinity, minimum inhibitory concentration, and the like.
6
CA 02842681 2014-01-21
WO 2013/013229
PCT/US2012/047766
If the sample medium includes cells of different sizes, expressing different
receptors, then information on the selectivity of a putative therapeutic agent
for one
receptor over the other can be obtained.
If the agent binding to the cells results in cell rupture, then the efficacy
of the
active agent can be represented by a decrease in particle (cell) density in
the sample
medium over time.
Thus, complex formation provides useful information about the biological
particle, or the agent bound to the microparticle or nanoparticle. For
example, where
the cell is a known cell, one can screen putative therapeutic agents for their
ability to
bind to the cell. Where the therapeutic agent is a known therapeutic agent,
one can
determine whether a particular cell binds to the therapeutic agent. This
information
can be useful in identifying personalized medical approaches for a patient.
For example, it is critical to determine in a timely manner whether a cancer
patient will respond to a particular therapy. That is, the tumors can grow and
metastasize before the physician determines that the patient does not respond
to the
therapy.
In one embodiment, the microparticles have a particle size in the range of
between about 0.1 and 10 pia, and ideally have a relatively consistent amount
of
active agent bound to them. One way to produce particles with a relatively
consistent
amount of active agent bound to them is to use dendrimers, where the
dendrimers
include a known quantity of the active agent. Another way is to produce
polymer
particles with a) a relatively narrow size distribution, and b) a relatively
consistent
amount of protected functional groups, so that after the polymers are
produced, the
protecting groups can be removed, and the functional groups used to conjugate
the
polymer particles to an active agent.
The active agent can be conjugated with the particle in such a way that the
portion of the active agent that is known to be active (i.e., binds a
receptor) is not
significantly sterically hindered by its conjugation with the particle. In
some
embodiments, this will involve preparing an analogue of the active agent which
includes a further functional group which can be attached to the particle.
7
CA 02842681 2014-01-21
WO 2013/013229
PCT/US2012/047766
In one embodiment, metallic particles, such as gold particles, are used.
Because these particles scatter a significant amount of light, they can be
conjugated
with a specific active agent, and used to identify even small molecules that
bind to the
agent. That is, the amount of light that the particle scatters is sufficiently
large that
the binding of the agent to the molecule of interest can be measured, even
though the
molecule is not within the size range of biological particles that can be
measured.
Means for conjugating active agents to metallic particles are known to those
of skill in
the art.
The present invention will be better understood with reference to the
following
detailed description.
Brief Description of the Drawings
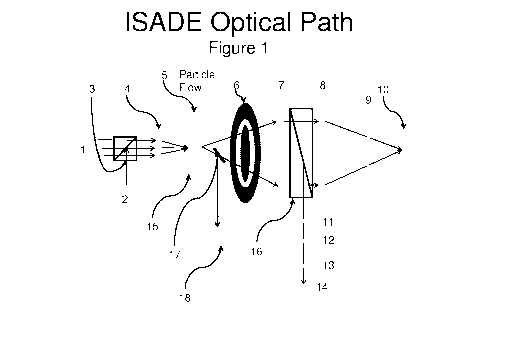
Figure 1 is a schematic illustration of a single particle optical sizing
device,
referred to herein as a "surface antigen detection enumerator" light
scattering device
capable of measuring particles as small as around 0.01 [inn in diameter.
Figure 2 is a schematic illustration of a device used for focused light
scattering, using a single light source and a single detector.
Figure 3 is a schematic illustration of a hydrodynamic flow injector.
Figure 4 is a schematic illustration of a device to apply precise mechanical
shear to a sample.
Figure 5 is a flow chart showing the path of a fluid sample from a pump
controlled by robotics, through a shearing device, to a scattering cell, where
dynamic
light scattering or electrophoretic light scattering can be measured, to where
the
sample leaves the device as effluent.
Figure 6 is a chart showing the measurement of particles in a sample
composed of 6 differently-sized polystyrene beads, assessed using the surface
antigen
detection enumerator light scattering device in terms of particle count
(number) by
particle size (m). The chart shows the remarkable resolution of very small
particle
sizes. Current flow cytometers are not capable of resolution to this degree.
Figure 7 is a chart showing similar data from the data shown in Figure 6. The
data in Figure 7 is presented as points rather than as histograms, and is
reflected in
particles per 10 ml sample, versus particle size ((m). Also, Figure 7
separates the size
distribution into 3 different windows. In this embodiment, each window has a
8
CA 02842681 2014-01-21
WO 2013/013229
PCT/US2012/047766
separate detector that has been adjusted to detect particles in a specific
size range.
The smallest particles are assessed from scatted light focused onto a high-
gain
detector, the middle window from scattered light focused onto a low gain
detector,
and the window with the largest particles by a light extinction method.
Detailed Description
The present invention relates to devices for measuring particle size using
focused light scattering techniques, and methods for using focused light
scattering
techniques in biological applications. Focused light scattering techniques
provide one
with the ability to analyze a fluid and determine the size and number of
particles in a
given sample and to, optionally, further characterize the particles in the
sample.
Where the particle is a biological particle, this information can be used to
diagnose
disease, to conduct high throughput bioassays, and to obtain information for
personalized medical treatment.
The methods described herein provide numerous advantages over the previous
methods in the art, including the ability to identify and characterize smaller
particles,
identify particles and determine particle size, number or other
characteristics without
using fluorescent antibodies or expensive flow cytometry, improving the
identification of the initial onset of the change in voltage due, which would
improve
resolution of the generated spectra, control of particle shearing, and
improved
information regarding particle shape.
The methods also provide numerous characteristics of the particles being
evaluated, including, but not limited to: identifying biological particles and
distinguishing them from various cells, quantifying particles, identifying
surface
epitopes, identifying particle shape, and correlating this information with
platelet
activation, thrombin production, disease states, and the efficacy of putative
therapeutic agents.
The present invention will be better understood with reference to the
following
definitions.
Definitions:
9
CA 02842681 2014-01-21
WO 2013/013229
PCT/US2012/047766
The term "cell" as used herein refers to any type of cell, including human
cells, animal cells (such as swine cells, rodent cells, canine cells, bovine
cells, ovine
cells and/or equestrian cells) cloned cells, plant cells, or the like. The
cells may be
blood cells, cultured cells, biopsied cells, or cells that are fixed with a
preservative.
The cells can be nucleated, such as white blood cells or suspended endothelial
cells,
or non-nucleated, such as platelets or red blood cells.
The term -focused light scattering" refers to a method for sensing single
particles, suspended in a solution, when the solution is passed through a
focused
beam. When the beam passes through the solution without being scattered by a
particle, the beam passes on to a photodetector and the intensity is measured.
When
the beam is scattered, in whole or in part, by a particle, the intensity of
the beam
hitting the photodetector is altered. The particle size and concentration can
be
calculated, for example, using light-extinction, light-scattering detection,
or both.
A "focused light scattering device" is a multi-particle optical sensor, which
has high sensitivity and responds to relatively concentrated suspensions, uses
a
relatively narrow light beam to illuminate an optical sensing zone non-
uniformly.
As used herein "particles" are small fragments or completely intact biological
cells, and related to a living organism when referred to as "biological
particles."
Intact cells may range in size from about 1 micron to 20 microns. Aggregates
of
intact cells or fragments of cells may range in size from 2 microns to 100
microns.
"Microparticles" are fragments of biological cells or particles that generally
range in
size from about 0.1 [tm to about 0.8 [an, generally 0.1 - 20 lam. Examples
include,
but are not limited to blood cells, platelets (1-3 micron), cancer cells (5 -
15 micron),
red blood cells (-71am), white blood cells (-5-10[tm), bacteria (-0.5-1 pm),
tumors,
granulocytes, monocytes, neutrophils, lymphocytes, endothelial cells, stem
cells,
viruses, and fungi.
"Light extinction" as used herein is a measurement of the absorption and/or
scattering of light in an electromagnetic field by particles as they pass
through the
field. As a particle passes through a field, there is a momentary reduction in
the
transmitted light intensity due to the light refraction, absorption and/or
scattering.
Measurement of light extinction by the particles provides additional
information
CA 02842681 2014-01-21
WO 2013/013229
PCT/US2012/047766
regarding the characteristics of the particles. A light extinction spectrum
can be
generated for each particle.
"Light scattering" occurs when there is a momentary change in the intensity of
the incident light caused by the interaction of the incident photons with the
particle.
In the case on focused scattering device, the intensity of the scattered light
reaching
the detector is proportional to the size of the particle. Thus, when the
particles being
characterized are biological particles, the method of light scattering will
involve
measuring voltage at the detector this will be proportional to the particle
size. An
exemplary focused light scattering system for detecting biological particles
is shown
in Figure 1.
"Nanoparticles" as used herein are particles or biological particles that are
generally smaller than 0.1 pm in size. Because of their small size,
nanoparticles have
a very high surface area to volume ratio. Accordingly, nanoparticles often
possess
unique physical characteristics. The present invention provides a way to both
quantify and monitor nanoparticles, in particular, cellular nanoparticles,
which are
often believed to be responsible for initiating further biochemical processes
in living
organisms.
The types of devices that can be used to carry out these diagnostic assays,
and
methods for performing these assays, are described in more detail below.
I. Focused Light Scattering Devices and Algorithms for Measuring Particle Size
and Shape
The focused light scattering device includes the following components:
a) one or more lasers which produce beams of laser light,
b) a first focusing lens positioned in the path of the beams of laser light,
which
focusing lens focuses the beams of light to a size wherein a particle with a
diameter of
about 0.1 1..tm is sufficient to block all or substantially all of the light,
c) a flow cell positioned in the path of the focused light source, wherein the
flow cell is capable of receiving a sample medium comprising a dispersion of
particles, and passing the sample medium through the focused light source,
where
11
CA 02842681 2014-01-21
WO 2013/013229
PCT/US2012/047766
light that interacts with one or more of the particles is scattered, and light
that does
not interact with one or more particles is not scattered,
d) a spatial filter, such as a circular spatial filter, positioned in the path
of the
light, which allows scattered light to pass through, and does not allow light
that is not
scattered to pass through,
e) a collimating lens positioned in the path of light passing through the
circular
spatial filter, through which scattered light is collimated,
I) a second focusing lens positioned in the path of the collimating lens,
focusing the light passing through the collimating lens,
g) a scatter detector positioned in the path of the focused light passing
through
the focusing lens,
h) a mirror positioned between the flow cell and the circular spatial filter,
which mirror reflects a portion of the scattered light, and
i) an extinction detector positioned in the path of the reflected scattered
light.
Where more than two laser light sources are used, additional focusing lenses,
collimating lenses, chromatic filters, and detectors can be used so that each
source of
laser light can be separated from the others. In one embodiment, the beam
splitter
used in these embodiments is one that is capable of splitting the beam into
multiple
beams, rather than just two beams. In another embodiment, a series of beam
splitters
is used, each of which splits a beam into two beams, so that multiple beams
can be
obtained.
The device can also include a hydrodynamic flow injector for introducing the
sample medium into the flow cell. In one embodiment, the device includes a
hydrodynamic flow injector, but only includes one source of laser light. In
another
embodiment, the device includes two or more sources of laser light, but does
not
include a hydrodynamic flow injector. In a third embodiment, the device
includes
two or more sources of laser light and a hydrodynamic flow injector.
12
CA 02842681 2014-01-21
WO 2013/013229
PCT/US2012/047766
In some embodiments, the device includes two or more lasers. In these
embodiments, the device further includes a beam splitter that combines the
light from
the two lasers, and passes the combined light beams through the first focusing
lens.
In these embodiments, the device further includes a second beam splitter
positioned
between the collimating lens and the second focusing lens, splitting the beam
into two
beams, wherein one of the beams is not diverted from its original path toward
the
second focusing lens, and the other of the beams is diverted from its original
path
toward the second focusing lens toward a second path.
In order to distinguish between light from the different laser, so that light
from
only one laser passes through to a given detector, chromatic filters are used
to block
out light from one or the other of the lasers before the light impinges on a
detector.
For example, a first chromatic filter can be positioned between the second
focusing
lens and the scatter detector, which chromatic filter permits light from one
of the laser
beams to pass through, and which does not permit light from the other of the
laser
beams to pass through, to the scatter detector. A second collimating lens can
be
positioned along the second path, which lens collimates the diverted light
beam. A
focusing lens can be positioned in the path of light passing through the
second
collimating lens. A second chromatic filter can be positioned in the path of
light
passing through the focusing lens, which second chromatic filter permits light
from
the laser beam that did not pass through the first chromatic filter to pass
through. A
detector, for example, a fluorescence detector, can be positioned in the path
of the
light passing through the second chromatic filter.
The device also includes a dynamic monitoring system and method employed
to monitor the size and/or number of particles, and, optionally, additional
information
on a subset of the particles, such as their number and/or size, which
fluoresce when
complexed to a particular fluorescent molecule, in a single particle optical
sizing
device as described herein. In one embodiment, the dynamic monitoring system
is a
computer either physically connected to the device, or connected remotely, for
example, using Bluetooth, infrared, or other such technology, and capable of
receiving information from the various detectors, as well as software which
handles
the digital interface with the device, wherein the computer and software are
capable of
counting particles, sizing particles, and storing information on the number
and size of
13
CA 02842681 2014-01-21
WO 2013/013229
PCT/US2012/047766
the particles in a given sample based on the information received from the
detectors
and algorithms that use this information to determine particle size and/or
number of
particles.
The monitoring system includes a data acquisition module operatively coupled
to the one or more detectors, and (iii) a processing and display unit
operatively
coupled to the data acquisition module for determining the size and/or number
of
particles in a given sample and responsively outputting a graphical
representation of
the size and/or number of the particles in the sample. The data acquisition
module
uses the data obtained from the detectors in the single particle optical
sensing device
described herein, and an algorithm which conelates the data to the size and/or
number
of particles in the sample medium.
The processing and display unit that is coupled to the data acquisition module
may utilize any suitable processing means, e.g., a general purpose
programmable
digital computer or central processing unit (CPU) including memory and
processor
components. The processor may be arranged to communicate with the memory by
means of an address/data bus, and can be constituted by a commercially
available or
custom microprocessor. The memory can include, without limitation, devices of
varied type, such as cache, ROM, PROM, EPROM, EEPROM, flash memory,
SRAM, and DRAM.
The memory may include several categories of software and data used in the
data processing system: the operating system; the application programs; the
input/output (I/0) device drivers and the data. The data may include a
database of
known profiles of particle sizes, for example, a reference library of the size
of
platelets, bacteria, viruses, fungi, cancer cells. stem cells, and complexes
of the cells
with various molecules, including fluorescently-labeled molecules, such as
fluorescently-labeled antibodies, and the like.
It will be appreciated that the operating system in the processing and display
unit can be of any suitable type for use with a data processing system.
Illustrative
examples of operating systems that can be usefully employed include, without
limitation, OS/2, AIX, OS/390 or 5y5tem390 (International Business Machines
Corporation, Armonk, NY), Windows CE, Windows NT, Windows95, Windows98,
Windows2000, or WindowsXP (Microsoft Corporation, Redmond, WA), Unix or
14
CA 02842681 2014-01-21
WO 2013/013229
PCT/US2012/047766
Linux or FreeBSD, Palm OS from Palm, Inc., Mac OS (Apple Computer, Inc.),
Lab View or proprietary operating systems.
The I/0 device drivers typically include software routines accessed through
the operating system by the application programs to communicate with devices
such
as I/0 data port(s), data storage and certain components of the memory.
The application programs are illustrative of the programs that implement the
various features of the system and can suitably include one or more
applications that
support analysis of the data. The data represent the static and dynamic data
used by
the application programs, the operating system, the I/O device drivers, and
other
software programs that may reside in the memory.
Any configuration of the processor capable of carrying out the operations for
the methodology of the invention can be advantageously employed.
The I/0 data port of the processing and display unit can be used to transfer
information between the processing and display unit and another computer
system or
a network (e.g., the Internet) or to other devices controllable by the
processor.
The processing and display unit optionally, but ideally, includes a display
for
graphically outputting information on the size and/or number of particles in a
sample,
in the form of a representation of the sample being assayed and the size
and/or
number of particles in the sample. This representation may be a graphic
depiction, in
which the size and/or number of particles are schematically depicted in a
graphical
output, as a two-dimensional column listing the size and/or number of
particles, and
the like. Such type of depictions can provide an intuitive and readily
visually
perceptible indication of the size and/or number of particles in the sample.
Where the dynamic monitoring system is a computer, which is either
physically connected to the device, or capable of receiving information
remotely, for
example, via Bluetooth or infrared, the computer is capable of receiving
information
from the various detectors. The computer also includes software which handles
the
digital interface with the device. The computer and software are capable of
counting
particles, sizing particles, and storing information on the number and size of
the
particles in a given sample based on the information received from the
detectors. The
types of algorithms used to relate information from the various detectors to
particle
size and/or particle number are described in more detail below.
An exemplary apparatus useful for performing the methods described herein is
disclosed in U.S. Patent Application Publication No. 20040011975. The
apparatus is
described therein is useful in performing particle analysis using focused
light
scattering techniques. However, as described herein, other similar apparatus
can be
employed, including detectors for focused light scattering and/or light
extinction.
The principal defining characteristic of the focused light scattering method
described in U.S. Patent Publication No. 20070010974 is not simply a
significant
reduction in the size of the illuminated area, Ao, resulting in a significant
reduction in
Vosz and improvement in sensitivity. Rather, it concerns the nature of the
illuminating
beam and the resulting OSZ thereby defined.
The term "focused light scattering" refers to a method for sensing single
particles, suspended in a solution, when the solution is passed through a
focused
beam. When the beam passes through the solution without being scattered by a
particle, the beam passes on to a photodetector and the intensity is measured.
When
the beam is scattered, in whole or in part, by a particle, the intensity of
the beam
hitting the photodetector is altered. The particle size and concentration can
be
calculated, for example, using light-extinction, light-scattering detection,
or both.
In one embodiment, the beam is produced by a laser. The laser beam interacts
with the particles, and produces scattered light when the laser beam interacts
with a
particle. In one aspect of this embodiment, the apparatus includes two or more
different lasers, which can give off light at two or more different
wavelengths, and/or
which can interact with the particles at different angles. The use of light at
different
wavelengths can enable one to identify specific epitopes. Particles can
interact with
specific molecules, including fluorescently-labeled molecules, and the
fluorescence
can be detected using a laser with light at a predetermined wavelength that
interacts
with the fluorescent label. The use of more than two lasers can enable the use
of two
or more fluorescent labels, which labels fluoresce at different wavelengths.
This
technique is described in more detail below.
16
CA 2842681 2019-06-26
CA 02842681 2014-01-21
WO 2013/013229
PCT/US2012/047766
A beam of light (usually laser light) of a single wavelength is directed onto
a
hydrodynamically-focused stream of fluid that includes the platelets. A number
of
detectors are aimed at the point where the stream passes through the light
beam. In
one aspect of this embodiment, one detector is in line with the light beam
(Forward
Scatter or FSC) and one or more detectors are perpendicular to it, including
Side
Scatter or SSC detectors and one or more fluorescent detectors. Each suspended
platelet passing through the beam scatters the ray, and fluorescent chemicals
either
present within the platelet or attached to the platelet are excited into
emitting light at a
longer wavelength than the light source. This combination of scattered and
fluorescent
light is picked up by the detectors, and, by analyzing fluctuations in
brightness at each
detector (one for each fluorescent emission peak), it is then possible to
derive various
types of information about the physical and chemical structure of each
individual
platelet.
Thus, in some embodiments of the apparatus described herein, there are three
or more detectors. For example, one can include one detector for extinction
[used to
measure particles with a size > 0.7 microns], one for scattered light [used to
measure
particles with a size in the range of 0.15 to 0.7 microns] and one or more for
fluorescence [used for phenotyping].
The sources of light can include lamps (i.e., mercury, xenon); high-power
water-cooled lasers (i.e., argon, krypton, dye laser); low-power air-cooled
lasers (i.e.,
argon (488 nm), red-HeNe (633 nm), green-HeNe, HeCd (UV)); diode lasers (i.e.,
blue, green, red, violet). The detectors can convert fluorescence signals from
light
into electrical signals that can be processed by a computer.
The process of collecting data from samples is termed "acquisition."
Acquisition is typically mediated by a computer physically connected to the
apparatus, and the software which handles the digital interface with the
apparatus. The
software is capable of adjusting parameters (i.e. voltage, compensation, etc.)
for the
sample being tested, and also assists in displaying initial sample information
while
acquiring sample data to insure that parameters are set correctly. An
interactive
database can allow the apparatus to be used in applications for both clinical
and
research purposes. A wide variety of analysis software and fluorescently-
labeled
antibodies has been developed, and are well known to those of skill in the
art.
The apparatus can include multiple lasers (between 2 and 5, typically between
two and four) and fluorescence detectors (typically between 2 and 18, more
typically
17
CA 02842681 2014-01-21
WO 2013/013229
PCT/US2012/047766
between 2 and 10). Increasing the number of lasers and detectors allows for
multiple
antibody labeling, and can more precisely identify a target population by
their
phenotypic markers.
Gating
The data generated by the apparatus can be plotted in a single dimension, in
two dimensions, or even in three dimensions. The regions on these plots can be
sequentially separated, based on fluorescence intensity, by creating a series
of subset
extractions, termed "gates." Specific gating protocols exist for diagnostic
and clinical
purposes especially in relation to hematology.
The plots are often made on logarithmic scales. Because different fluorescent
dyes' emission spectra overlap, signals at the detectors have to be
compensated
electronically as well as computationally. Data accumulated using the
apparatus can
be analyzed using software, e.g., Flowjo, FCS Express, VenturiOne or CellQuest
Pro.
Data analysis can be performed on a separate computer, if desired.
Computational analysis
Automated population identification using computational methods can be used
as an alternative to traditional gating strategies. Automated identification
systems can
potentially help find rare and/or hidden populations. Representative automated
methods include FLOCK in Immunology Database and Analysis Portal (ImmPort),
FLAME in GenePattern and flowClust, in Bioconductor.
Fluorescent labels
A wide range of fluorophores can be used as labels in flow cytometry.
Fluorophores, or simply "fluors", are typically attached to an antibody that
recognizes
a target feature, epitope, on or in the cell; they may also be attached to a
chemical
entity with affinity for the cell membrane or another cellular structure. Each
fluorophore has a characteristic peak excitation and emission wavelength, and
the
emission spectra of different labels often overlap. Consequently, the
combination of
labels which can be used depends on the wavelength of the lamp(s) or laser(s)
used to
excite the fluorochromes and on the detectors available (Loken MR (1990).
Immunofluorescence Techniques in Flow Cytometry and Sorting (2nd ed.). Wiley.
pp.
341-53). The maximum number of distinguishable fluorescent labels is thought
to be
18
CA 02842681 2014-01-21
WO 2013/013229
PCT/US2012/047766
17 or 18, and this level of plexy necessitates laborious optimization to limit
artifacts,
as well as complex deconvolution algorithms to separate overlapping spectra
(Ornatsky, O.; Bandura, D.; Baranov, V.; Nitz, M.; Winnik, M. A.; Tanner, S.
(2010).
"Highly multiparametric analysis by mass cytometry". Journal of Immunological
Methods 361 (1-2): 1-20)
Quantum dots are sometimes used in place of traditional fluorophores because
of their narrower emission peaks.
The fluorescent labels can be used, for example, to determine the degree of
protein expression and localization, the existence of any protein
modifications or
intracellular antigens (various cytokines, secondary mediators, etc.),
membrane
fluidity, platelet viability, and platelet adherence.
Representative fluorescent labels are provided below:
Probe Ex (nm) Em (nm)
Hydroxycoumarin 325 386
Aminocoumarin 350 445
Methoxycoumarin 360 410
Cascade Blue (375);401 423
Pacific Blue 403 455
Pacific Orange 403 551
Lucifer yellow 425 528
NBD 466 539
R-Phycoerythrin (PE) 480;565 578
PE-Cy5 conjugates 480;565;650 670
PE-Cy7 conjugates 480;565;743 767
Red 613 480;565 613
PerCP 490 675
TruRed 490,675 695
FluorX 494 520
Fluorescein 495 519
BODIPY-FL 503 512
TRITC 547 572
X-Rhodamine 570 576
Lissamine Rhodamine B 570 590
Texas Red 589 615
Allophycocyanin (APC) 650 660
APC-Cy7 conjugates 650;755 767
Alexa Fluor 350 343 442
Alexa Fluor 405 401 421
Alexa Fluor 430 434 540
Alexa Fluor 488 499 519
Alexa Fluor 500 503 525
Alexa Fluor 514 517 542
Alexa Fluor 532 530 555
Alexa Fluor 546 561 572
19
CA 02842681 2014-01-21
WO 2013/013229
PCT/US2012/047766
Alexa Fluor 555 553 568
Alexa Fluor 568 579 603
Alexa Fluor 594 591 618
Alexa Fluor 610 610 629
Alexa Fluor 633 632 648
Alexa Fluor 647 652 668
Alexa Fluor 660 663 691
Alexa Fluor 680 680 702
Alexa Fluor 700 696 719
Alexa Fluor 750 752 776
Alexa Fluor 790 782 804
Cy2 489 506
Cy3 (512);550 570;(615)
Cy3B 558 572;(620)
Cy3.5 581 594;(640)
Cy5 (625);650 670
Cy5.5 675 694
Cy7 743 767
DyLight 350 353 432
DyLight 405 400 420
DyLight 488 493 518
DyLight 549 562 576
DyLight 594 593 618
DyLight 633 638 658
DyLight 649 654 673
DyLight 680 692 712
DyLight 750 752 778
DyLight 800 777 794
Hoechst 33342 343 483
DAPI 345 455
Hoechst 33258 345 478
SYTOX Blue 431 480
Chromomycin A3 445 575
Mithramycin 445 575
YOYO-1 491 509
Ethidium Bromide 493 620
Acridine Orange 503 530/640
SYTOX Green 504 523
TOTO-1, TO-PRO-1 509 533
Thiazole Orange 510 530
Propidium Iodide (PI) 536 617
LDS 751 543;590 712;607
7-AAD 546 647
SYTOX Orange 547 570
TOTO-3, TO-PRO-3 642 661
DRAQ5 647 681,697
Indo-1 361/330 490/405
Fluo-3 506 526
DCFH 505 535
DHR 505 534
CA 02842681 2014-01-21
WO 2013/013229
PCT/US2012/047766
SNARF 548/579 587/635
Y66H 360 442
Y66F 360 508
EBFP 380 440
EBFP2 383 448
Azurite 383 447
GFPuv 385 508
T-Sapphire 399 511
TagB FP 402 457
Cerulean 433 475
mCFP 433 475
ECFP 434 477
CyPet 435 477
Y66W 436 485
dKeima-Red 440 616
mKeima-Red 440 620
TagCFP 458 480
AmCyanl 458 489
mTFP1 (Teal) 462 492
S65A 471 504
Midoriishi-Cyan 472 495
Wild Type GFP 396,475 508
S65C 479 507
TurboGFP 482 502
TagGFP 482 505
TagGFP2 483 506
AcGFP1 484 510
S65L 484 510
Emerald 487 509
S65T 488 511
EGFP 488 507
Azami-Green 492 505
ZsGreenl 493 505
Dronp a-Green 503 518
TagYFP 508 524
EYFP 514 527
Topaz 514 527
Venus 515 528
mCitrine 516 529
YPet 517 530
TurboYFP 525 538
PhiYFP 525 537
PhiYFP-m 525 537
ZsYellowl 529 539
mBanana 540 553
Kusabira-Orange 548 559
mOrange 548 562
m0range2 549 565
mK0 548 559
TurboRFP 553 574
21
CA 02842681 2014-01-21
WO 2013/013229
PCT/US2012/047766
tdTomato 554 581
D sRed-Expres s 2 554 591
TagRFP 555 584
DsRed monomer 557 592
DsRed2 ("RFP") 563 582
mStrawberry 574 596
TurboFP602 574 602
AsRed2 576 592
mRFP1 584 607
J-Red 584 610
mCherry 587 610
HcRedl 588 618
mKate2 588 633
Katushka (TurboFP635) 588 635
mKate (TagFP635) 588 635
TurboFP635 588 635
mPlum 590 649
mRaspberry 598 625
mNeptune 600 650
E2-Crimson 611 646
Monochlorobimane 380 461
Calcein 496 517
In some applications, particularly clinical applications, it can be desirable
to
use microfluidics to introduce samples to the apparatus. The microfluidic
device can
be disposable (i.e., used once or perhaps a few times, followed by disposal
and
replacement) and/or composed of a polymeric material. The microfluidic device
can
be adapted to reduce the amount of sample used to determine whether a patient
can
benefit from a particular anti-thrombotic therapy. The microfluidic device
preferably
provides a tip adapted for delivering the biological sample including the
platelets into
the cell through which light passes, so that the platelets can then travel
through the
light beam(s). In some embodiments, the tip is adapted for sheath spraying. In
other
embodiments, the tip is adapted for non-sheath spraying. In any of the
embodiments
herein the apparatus may include a disposable inlet capillary.
The apparatus can also include an autodiluter, which can start with the most
dilute sample, rather than the most concentrated sample, and can therefore use
less
sample. Autodiluters are well known to those of skill in the art.
Representative
autodiluters include the AutoDiluter-5.2, the CETAC ADX-500 Autodiluter, the
ProLiquid AutoDiluter, and the DYNATECH Autodiluter
In high-throughput screening, it can be preferable to include robotics, which
can introduce the samples to the apparatus. Ideally, the apparatus can then be
cleaned
22
CA 02842681 2014-01-21
WO 2013/013229
PCT/US2012/047766
in between samples, for example, by flushing the various lines, and subsequent
samples introduced, enabling the screening to be automated. Information on the
screening results can be stored, for example, in a memory map, and the
information
correlated with the patient's identity.
A "focused light scattering device" is a single-particle optical sensor, which
has high sensitivity and responds to relatively concentrated suspensions, uses
a
relatively narrow light beam to illuminate an optical sensing zone non-
uniformly. It
differs from conventional SPOS devices in that it can handle more concentrated
solutions and smaller particle sizes.
In use, a solution including suspended platelets passes through a zone. The
zone is smaller than the flow channel, so that the sensor responds to only a
fraction of
the total number of platelets flowing through the channel, detecting a
statistically
significant number of particles of any relevant diameter.
Because different particle trajectories flow through different parts of the
zone
illuminated at different intensities, it is necessary to deconvolute the
result. Two
methods of deconvolution can be used: modified matrix inversion or successive
subtraction. Both methods use a few basis vectors measured empirically or
computed
from a theoretical model, and the remaining basis vectors are derived from
these few.
The sensor is compensated for turbidity.
The sensor apparatus for single-particle optical sizing of particles in a
fluid
suspension typically includes a means for establishing flow of the suspension
through
a physically well-defined measurement flow channel. There is also an
illumination
means for effectively directing a relatively narrow beam of light, having an
axis,
through the measurement flow channel to form an optical sensing zone within
the
measurement flow channel. The beam of light and the optical sensing zone are
of
such size relative to the size of the measurement flow channel that the sensor
apparatus responds to only a fraction of the total number of particles flowing
through
the measurement flow channel. In this manner, the sensor apparatus responds
effectively to a relatively concentrated fluid suspension.
The beam has a maximum intensity portion and a continuum of lesser
intensities for positions spaced transverse to the axis from the maximum
intensity
portion. In this manner, some of the particles have trajectories through the
maximum
intensity portion, others of the particles have trajectories through the
lesser intensity
positions, and still others of the particles may have trajectories outside the
zone.
23
CA 02842681 2014-01-21
WO 2013/013229
PCT/US2012/047766
Typically, the maximum intensity portion of the beam is in a central portion
of the
beam.
The device also includes a detector means for photo-detecting light from the
zone to provide pulse height signals. These signals each respond to a particle
flowing
through the zone. The pulse height signals are functions of the sizes and
trajectories
of detected particles. Particles of a given size provide a maximum pulse
height signal
when flowing through the maximum intensity portion, and lesser pulse height
signals
when flowing through the lesser intensity positions of the zone. The pulse
height
signals, collectively, form a pulse height distribution PHD.
The device further includes a means for mathematically deconvoluting the
pulse height distribution to extract a particle size distribution of the PSD
particles in
the fluid suspension. The sensor apparatus can detect a statistically
significant
number of particles of any given diameter or range of diameters that are
relevant to
the fluid suspension.
In one embodiment, the measurement flow channel has a thickness dimension
axially of the beam of light, a width dimension transverse to the beam, and a
flow
direction substantially perpendicular to the thickness and width dimensions.
The
beam is narrower than the measurement flow channel in the width direction. The
beam can be focused with a depth of field which is substantially larger than
the
thickness dimension, and the beam substantially has an effective width which
does
not vary substantially over the thickness dimension.
In another embodiment, the beam has an effective width between opposing
positions transverse to the axis in the beam, at which the lesser intensities
have fallen
to a given fraction of the maximum intensity. The effective width is chosen so
that
the largest particles of interest can be effectively sized. The given fraction
can be, for
example, 1/e2 of the maximum intensity, where e is the base of the natural
system of
logarithms, and the effective width is substantially one half the size of the
largest
particle to be sized.
In yet another embodiment, the apparatus uses hydrodynamic sample
injection, such as is described in Pelssers et al., Journal of Colloid and
Interface
Science, Volume 137, Issue 2, July 1990, Pages 350-361. Colloidal dispersions,
such
as platelets in serum or other media, can be hydrodynamically focused into a
narrow
stream, with widths ranging from about 3 to about 10, preferably about lam
width.
The use of a focused light scattering technique allows one to measure
relatively small
24
CA 02842681 2014-01-21
WO 2013/013229
PCT/US2012/047766
particle sizes. However, where a focused beam hits particles in a relatively
wide
sample stream (as described above, where the beam is narrower than the
measurement
flow channel in the width direction), the detection method relies somewhat on
statistics. That is, where the beam is substantially narrower than the sample
stream,
an assumption is made that there is an equal distribution of particles in the
sample
stream, so that one can extrapolate the results of the interaction of the
light in the
narrow beam with the particles in its path over the entire width of the sample
stream.
By hydrodynamically focusing the sample into a stream with a relatively narrow
width, and using a focused light source, it is possible to count all or most
of the
particles in the sample stream, and rely to a lesser extent on statistics.
The light beam can have, for example, a Gaussian intensity profile, a circular
cross-section, or an elliptical cross-section being wider in a direction
transverse to
particle flow.
The detector means can be include a light extinction-type detector, and can be
a combination of detectors, for example, a light-extinction detector type and
a light-
scattering type detector. The light-scattering type detector means can include
means
for passing a portion of scattered light from the zone through a mask to
select light
scattered between a first and a second angle to the beam and a means for
directing a
portion of the light transmitted through the zone to a light-extinction type
detector.
The detector means can include a mirror for deflecting a portion of the light
from the optical-sensing zone to the light-extinction detector. The
illuminating means
can include a light source and optical fiber means for conveying light from
the light
source to the optical sensing zone, and projecting the light through the zone.
The detector means can also include an optical fiber means for conveying the
light passing through the optical sensing zone to the light-extinction type
detector.
The detector means can also include means for passing a portion of the light
scattered
from the zone through a mask. to select light scattered between a first and
second
angle to the beam, and an optical fiber means for conveying the portion of the
light to
a light-scattering type detector. The detector means can also include a light-
scattering
detector.
In one embodiment, the illumination means provides two light beams directed
through a pair of optical sensing zones positioned within the measuring flow
channel,
CA 02842681 2014-01-21
WO 2013/013229
PCT/US2012/047766
and each beam has an effective width determined by a desired maximum particle
size.
The detector means can include a light-scattering detector and a means for
passing light scattered from the zone through a mask means. The mask means can
include a plurality of masks and means for selecting one of the masks for
passing the
light scattered from the zone, each mask defining different angles between
which the
light is scattered. The masks can be located on a rotatable wheel, and a mask
can be
selected by rotating the wheel to a desired position.
The illuminating means can project a relatively wide collimated beam through
the optical sensing zone, and can include an acceptance aperture to capture
only those
light rays that closely surround the axis of the beam. This reduces the
effective width
of the beam to a width in a direction transverse to the axis of the light beam
which is
substantially one-half the size of the largest particle to be sized. The
illuminating
means can also include a means for coupling the light rays to the detector
means.
This can be, for example, an optical fiber means.
In one aspect of the invention, a statistically significant number of
particles of
each relevant size flow through all portions and positions of the zone.
In another aspect of the invention, the fluid suspension is relatively
concentrated and the apparatus further comprises means to compensate for
turbidity
of the suspension. In this aspect, the detector means can operate on a light
extinction
principle, and provide a signal having a baseline voltage level. The pulse
height
signals appear as downwardly extending pulses from the baseline voltage level,
and
the means for compensation for turbidity of the suspension can include means
to
sense the baseline voltage level and automatically increase the level to
approximately
the baseline voltage level present in the absence of turbidity in the
suspension. The
detector means can operate on a light extinction principle, and provide a
signal having
a baseline voltage level, wherein the means to compensate for turbidity can
include a
computer means for correcting the pulse height signals in response to the
ratio of the
baseline voltage level when the fluid suspension is not turbid, to the
baseline voltage
level for the turbid fluid suspension.
The detector means can also operate on a light extinction principle and
provide
a signal having a baseline voltage level, wherein the means to compensate for
turbidity includes a means to adjust the intensity of the beam of light by
increasing the
amount of light produced by the illuminating means in response to the ratio of
the
26
CA 02842681 2014-01-21
WO 2013/013229
PCT/US2012/047766
baseline voltage level when the fluid suspension is not turbid, to the
baseline voltage
level for the turbid fluid suspension.
The particle trajectories can be substantially uniformly distributed across
the
width of the measurement flow channel.
The means for deconvoluting the pulse height distribution can include basis
vectors, each corresponding to a particular particle size, and a source vector
representing a measured pulse height distribution for a fluid suspension as
detected by
the detector means. There can also be a means using a deconvolution algorithm
to
derive the particle size distribution from the pulse height distribution. At
least some of
the basis vectors can have values based upon measurements of particles of
known
size. Some of the basis vectors can also have values based upon measurements
of
particles of known size and others of the basis vectors can be computed from
the sum
of the basis vectors by interpolation and/or extrapolation.
The basis vectors can be computed, and the basis vectors can be column basis
vectors of a matrix, where the means using a deconvolution algorithm performs
matrix inversion and vector multiplication, or the means using a deconvolution
algorithm can perform successive subtraction.
The means using a deconvolution algorithm can provide a deconvoluted pulse
height distribution dPHD, and the apparatus further comprises means providing
a
calibration curve of the relationship of pulse height and diameter, and means
using the
calibration curve to transform each deconvoluted pulse height value in the
dPHD into
a unique particle diameter associated with this pulse height value. This can
yield a
"raw" particle size distribution PSD. There can also be a means for converting
the
raw PSD into a final PSD by renormalizing the raw PSD by multiplying by the
value
1/PHId, where PHId is the fraction of particles actually detected by the
device for
particles of each size.
The particle trajectories can be distributed non-uniformly across the width of
the measurement flow channel, and the basis vectors can be based upon the
response
of particles of known size flowing through the measurement flow channel with
the
same non-uniform distribution of particle trajectories as the fluid
suspension.
The sensor apparatus may respond only to a fraction of the total number of
particles flowing through the measurement flow channel.
One can prepare a matrix for deconvoluting pulse height distributions derived
from particles of unknown size flowing along different trajectories through a
non-
27
CA 02842681 2014-01-21
WO 2013/013229
PCT/US2012/047766
uniform light field of a single-particle optical sizing device. This can
enable one to
size particles in a fluid suspension. To do this, one can determine the value
of at least
one empirical basis vector for the matrix by measuring the response of
particles of
known size flowing through the single-particle optical sizing device. Then,
one can
compute other basis vectors for the matrix corresponding to particles of other
sizes, by
interpolating and/or extrapolating the other basis vectors from the empirical
basis
vector.
One can also determine the value of additional empirical basis vectors for the
matrix by measuring the response of particles of known sizes flowing through
the
single-particle optical sizing device, and computing the other basis vectors
for the
matrix corresponding to particles of other sizes from the at least one
empirical basis
vector and the additional empirical basis vectors.
Another way to prepare a matrix for deconvoluting pulse height distributions
derived from particles of unknown size flowing along different trajectories
through a
non-uniform light field of a single-particle optical sizing device for sizing
particles in
a fluid suspension involves determining the value of at least one computed
basis
vector corresponding to particles of at least one size for the matrix. One can
compute
other basis vectors for the matrix corresponding to particles of other sizes
from
computed basis vectors.
Also disclosed is a method of deconvoluting a pulse height distribution
derived from particles of unknown size flowing along different trajectories
through a
non-uniform light field of a single-particle optical sizing device for sizing
particles in
a fluid suspension. The method involves setting up a matrix having a plurality
of
columns, each containing a basis vector comprising a pulse height distribution
of
particles of a known size corresponding to the response of a photo-detector of
the
device to the particles of known size. Each successive column contains a basis
vector
for particles of successively larger sizes. The matrix also has a like
plurality of rows,
each corresponding to a successive pulse height channel, each channel
including a
range of pulse heights, with successive rows corresponding to successively
larger
pulse heights, and with each column having a maximum count pulse height value
at a
location for a row which relates to a pulse height corresponding to the
particle of
known size associated with the column. The maximum count pulse height values
for
successive columns are arranged on a diagonal of the matrix. The matrix is
modified
by setting all terms corresponding to pulse height values greater than the
maximum
28
CA 02842681 2014-01-21
WO 2013/013229
PCT/US2012/047766
count pulse height value in a column to zero. A deconvolution algorithm is
used to
perform matrix inversion and vector multiplication of the pulse height
distribution and
the matrix as modified.
Before the modifying step, one can renormalize the values of the basis vectors
in the columns by setting the maximum count pulse height value to equal 1.0
and all
other count pulse height values in the column to a value maintaining the same
proportionate value to 1.0 that the other count pulse height values had to the
maximum count pulse height value of the column.
The response of the photo-detection to the particles of known size is
developed empirically for some of the basis vectors by sending particles of
the
substantially known size through the device and providing a response by the
device to
the particles of known size. The response to the photo-detector for the
remaining
basis vectors can be computed by interpolating and/or extrapolating the
response for
the remaining basis vectors from the some of basis vectors.
The response of the photo-detector to the particles of known size can be
computed for some of the basis vectors and the response to the photo-detector
for the
remaining basis vectors can be computed by interpolating and/or extrapolating
the
response from the some basis vectors.
A pulse height distribution ("PHD") can be derived from particles of unknown
size flowing along different trajectories through a non-uniform light field of
a single-
particle optical sizing device for sizing particles in a fluid suspension can
be
deconvoluted by setting up a matrix having a plurality of columns. Each column
includes a basis vector comprising a pulse height distribution of particles of
a
substantially known size corresponding to the response of a photo-detector of
the
device to the particles of known size, and each successive column contains a
basis
vector for particles of successively larger sizes. The matrix can also include
a like
plurality of rows, each corresponding to a successive pulse height channel,
each
channel including a range of pulse heights, successive rows corresponding to
successively larger pulse heights, each column having a maximum count pulse
height
value at a location for a row which relates to a pulse height corresponding to
the
particle of known size associates with the column. The maximum count pulse
height
values for successive columns can be arranged on a diagonal of the matrix. A
successive subtraction algorithm can be implemented, by starting with the
basis vector
with its maximum count value in the largest row number; scaling a column basis
29
CA 02842681 2014-01-21
WO 2013/013229
PCT/US2012/047766
vector by a factor corresponding to the value of the row in the PHD that
matches the
column number; subtracting the scaled basis vector from the PHD to form an
element
of a deconvoluted PHD (dPHD), leaving an intermediate PHD vector with a
smaller
number of total particles; and repeating this process using the remaining
basis vectors
until the entire PHD has been consumed and all the elements of the
deconvoluted
dPHD have been formed.
A single-particle optical sizing sensor for sizing particles in a relatively
concentrated fluid suspension sample for turbidity of the suspension sample
can be
compensated using a sensor operating on a light extinction principle whereby a
photo-
detector produces signal V1(t) having a baseline voltage level and a response
to
blockage of light by a particle as a downwardly extending pulse from the
baseline
voltage level. The compensation method involves passing a non-turbid
suspension
through the sensor; measuring a baseline voltage level Vo produced in response
to the
non-turbid suspension; passing the relatively concentrated suspension sample
through
the sensor; measuring a baseline voltage Vol produced in response to the
relatively
concentrated suspension sample, calculating the ratio VoVoT; and adjusting the
sensor
in response to G to compensate for the turbidity when the relatively
concentrated
suspension sample passes through the sensor.
The baseline voltage VoT can effectively be subtracted from the signal \ILO),
the remaining signal can be inverted to produce a pulse height signal 2
VLET(t), and an
adjustable gain amplifying means can be used to amplify the pulse height
signal 3
VLLT(t). The adjustable gain amplifying means can be controlled by the ratio G
to
provide a compensated pulse height signal AVLE(t).
The signal Vu(t) produced by the sensor in response to the relatively
concentrated suspension sample can be amplified by adjustable gain amplifier
means,
the gain of which is controlled by the ratio G to provide a compensated signal
VT,F(t)
having a compensated baseline voltage Vo, subtracting the baseline voltage Vo
from
the compensated signal VLE(t), and inverting the remaining signal to produce
compensated pulse height signal AVLE(t).
In one embodiment, the single-particle optical sizing sensor comprises a light
source producing a light beam of adjustable intensity, wherein the intensity
is
increased in response to the ratio G to compensate for the turbidity.
Particles in a fluid suspension can also be optically sized by establishing a
flow of the suspension through a physically well-defined measurement flow
channel
CA 02842681 2014-01-21
WO 2013/013229
PCT/US2012/047766
of a single-particle optical sizing sensor apparatus wherein a beam of light,
having an
axis, is directed through the measurement flow channel to form an optical
sensing
zone within the measurement flow channel. The beam of light and the optical
sensing
zone are ideally of such size relative to the size of the measurement flow
channel that
the sensor apparatus responds to only a fraction of the total number of
particles
flowing through the measurement flow channel. The sensor apparatus can respond
effectively to a relatively concentrated fluid suspension. The beam can have a
maximum intensity portion in the beam and a continuum of lesser intensities
for
positions in the beam spaced transversely from the axis, whereby some of the
particles
have a trajectory through the maximum intensity portion, others of the
particles have
trajectories through the lesser intensity positions, and still others of the
particles may
have trajectories outside the zone. Light from the zone can be detected to
provide
pulse height signals, each responsive to a particle flowing through the zone.
The
pulse height signals are functions of the sizes and trajectories of detected
particles,
and the pulse height signals collectively form a pulse height distribution
PHD. The
PDH can be mathematically deconvoluted and processed to extract from the PHD a
particle size distribution PSD of the particles in the fluid suspension.
The step of mathematically deconvoluting the PHD can involve determining
the value of at least one empirical basis vector by measuring the response to
particles
of known size flowing through the single-particle optical sizing device. Other
basis
vectors corresponding to particles of other sizes can be computed by
interpolating
and/or extrapolating the other basis vectors from the empirical basis vector.
The value of additional empirical basis vectors for particles of known sizes
flowing through the single-particle optical sizing device can be determined;
and the
other basis vectors for the matrix corresponding to particles of other sizes
can be
calculated by interpolating and/or extrapolating the other basis vectors from
at least
one empirical basis vector and the additional empirical basis vectors. The
method can
further involve determining the value of at least one computed basis vector
corresponding to particles of at least one size. Other basis vectors
corresponding to
particles of other sizes can also be computed by interpolating and/or
extrapolating the
other basis vectors from computed basis vectors.
The step of deconvoluting and processing the PHD can involve setting up a
matrix having a plurality of columns, each containing a basis vector
comprising a
pulse height distribution of particles of a known size corresponding to the
response of
31
CA 02842681 2014-01-21
WO 2013/013229
PCT/US2012/047766
a photo-detector of the device to the particles of known size, each successive
column
containing a basis vector for particles of successively larger sizes. The
matrix can
also have a like plurality of rows, each corresponding to a successive pulse
height
channel, each channel including a range of pulse heights, successive rows
corresponding to successively larger pulse heights, each column having a
maximum
count pulse height value at a location for a row which relates to pulse
heights
corresponding to the particle of known size associated with the column. The
maximum count pulse height values for successive columns can be arranged on a
diagonal of the matrix. The matrix can be modified by setting all terms
corresponding
to pulse height values greater than the maximum count pulse height value in a
column
to zero. A deconvolution algorithm can be used to perform matrix inversion and
vector multiplication of the pulse height distribution and the inverted matrix
as
modified. The response of the photo-detector to the particles of known size
can be
developed empirically for some of the basis vectors by directing a flow of
particles of
the known size through the device and providing a response by the device to
the
particles of known size. The response to the photo-detector for the remaining
basis
vectors can be calculated by interpolating and/or extrapolating the response
for the
remaining basis vectors from the some of basis vectors.
The step of mathematically deconvoluting the PHD can also involve using a
deconvolution algorithm to provide a deconvoluted pulse height distribution
dPHD.
The method can further involve providing a calibration curve of the
relationship of
pulse height and diameter, and using the calibration curve to translate each
deconvoluted pulse height value in the dPHD into a unique particle diameter
associated with this pulse height value yielding a "raw" particle size
distribution in
PSD. The raw PSD can be converted into a final PSD by renormalizing the raw
PSD
by multiplying by the value 1/PHId, where PHId is the fraction of particles
actually
detected by the device for particles of each size.
In use, a focused laser light beam passes through a chamber through which
fluid flows, and the laser light scatters as the particles pass through the
focused laser
beam. An extinction detector determines when particles have passed through the
beam. In the absence of a particle interfering with the beam of light, the
light would
pass, uninterrupted, to the extinction detector. When a particle blocks the
passage of
light, the resulting loss of light hitting the extinction detector signals
that a particle
32
CA 02842681 2014-01-21
WO 2013/013229
PCT/US2012/047766
has passed through the beam. The light hitting the particles is reflected, and
passed
through a scatter collimating lens, which re-focuses the light, which then
passes
through a scatter focus lens, which sends a single beam through to a scatter
detector.
A representative focused light scattering device is shown in Figure 1. A first
laser (1) emits light at a first wavelength, and a second laser (2) emits
light at a second
wavelength. Both beams of light pass through a first beam splitter (3) and
through a
first focusing lens (4) before they enter into a flow cell (15). The flow cell
includes a
site (5) for hydrodynamic injection of the sample. As the platelets in the
flow cell
pass through the beams of light, the light is scattered as it hits the
platelets. The
scattered light passes through a circular spatial filter (6) and then through
a first
collimating lens (7). The light beam passes through a second beam splitter
(16),
which splits the light into two beams. A first beam passes through a second
focusing
lens (8) and through a first chromatic filter (9) that passes scattered light
from the first
laser (1) through a first detector (10). The second beam passes through a
second
collimating lens (11), a third focusing lens (12) and a second chromatic
filter (13) that
passes scattered light from the second laser (2) to a second detector (14).
The two photodetectors (10 and 14) each are able to detect light at a certain
frequency, so that light transmitted at different frequencies (as a result of
the two
lasers hitting particles, and which may interact with fluorescent tags on the
particles)
can be separately determined.
A third detector (an extinction detector) (18) receives a portion of the light
passing through the flow cell. A portion of the light passing through the flow
cell is
reflected off of a movable mirror (17) and onto the third detector.
As is shown in Figure 2, there are two important features inherent in the
optical design. First, the incident beam alone (in conjunction with the front
and back
windows 36 and 37 of the measurement flow channel 35) defines the OSZ. The
side
walls 38 and 39 that confine the fluid-particle suspension along the x-axis
are no
longer of any consequence with respect to definition of the OSZ. Second, the
physical
volume associated with the OSZ can no longer be described by a single value;
rather,
it now depends on the size of the particles being measured.
33
CA 02842681 2014-01-21
WO 2013/013229
PCT/US2012/047766
The approach shown schematically in Figure 2 involves illuminating
measurement flow channel 35 with a light beam 41 from a laser light source 40
which
is focused by a lens 42 to form a beam 44 of relatively narrow cross section--
i.e.,
smaller than. a typical illuminated width, a, of the flow cell in a
conventional LE-type
sensor. The resulting OSZ is therefore defined approximately by a "pencil"
beam of
light 46, together with the front and back windows of the flow cell, separated
by
dimension "b." The schematic diagram in Figure 2 provides a simplified picture
of the
OSZ defined by focused light beam 46. First, the region of illumination that
comprises the OSZ is not sharply defined, as implied by the approximately
cylindrical
zone indicated in Figure. 1. Rather, the outer boundary of the OSZ is "fuzzy,"
extending well beyond the zone indicated, as discussed below. Second, the beam
passing through the flow channel 10, assuming that it has been focused,
typically is
not uniform in width. Rather, in the case of a focused beam, its width varies
over the
depth of the measurement flow cell 35. The extent to which the beam waist
varies
over the depth of the channel depends on the depth of field of the focused
beam,
defined as the distance (y-axis) between the points at which the beam waist
grows to 2
times its minimum value. Ideally, the depth of field is significantly greater
than the
channel thickness, b, resulting in a relatively uniform beam width throughout
the flow
channel.
Consequently, focused light scattering devices may include a fundamentally
different sensor. In the conventional design, the physical width of the flow
channel 10
and the effective width (x-axis) of the OSZ are one and the same, equal to
dimension
"a." By contrast, the physical width of the flow channel in a sensor used for
focused
light scattering devices (also defined as "a") is typically much larger than
the nominal
width, 2w, of the incident light beam and therefore has no significant
influence on the
OSZ. Hence, the spacers (or shims) 38 and 39 that separate the front and back
windows 36 and 37, determining the depth, b, of the flow cell (and OSZ), no
longer
need to be opaque or smooth on an optical scale to avoid scattering by the
edges. This
is a significant advantage, making fabrication of the flow cell easier and
less
expensive.
It is usually convenient and effective to employ a "circularized" light beam,
in
which the incident intensity ideally depends only on the radial distance, r,
from the
beam axis (coincident with the y-axis, with x=z=0, as seen in FIG. 1).
Typically, one
employs a "Gaussian" light beam--i.e. one having a Gaussian intensity profile,
34
CA 02842681 2014-01-21
WO 2013/013229
PCT/US2012/047766
described in the focal plane (minimum beam waist), at y=b/2, by I(r)=I0exp(-
2r2/w2)
(7) where r2=x2+z2 for the assumed circular beam.
Quantity 2w is the diameter of an imaginary cylinder containing most of the
incident light flux. The intensity on its surface equals 1/e2, where e is the
base for
natural logarithms, or 0.135 times its value, I , at the center of the beam
(r=0).
Essentially 100% (apart from losses due to reflections at optical interfaces
and
extinction by particles in the beam) of the light flux contained in the
incident beam
traverses the fluid-particle mixture in the flow channel and impinges on the
distant
detector D. This causes detector DLE to provide a light extinction signal VLE
in the
form of a downwardly extending pulse.
This behavior is in sharp contrast to the illumination scheme employed in a
conventional LE-type sensor. There, the starting light beam is expanded
greatly along
the lateral (x) axis of the flow cell, so that its width (1/e2 intensity) is
much larger than
the width, a, of the front window (and OSZ). As a result, there is relatively
little
variation in the incident intensity along the x-axis (i.e. for y=z=0) where
the beam
enters the flow cell, because the light is captured at the top of the x-
expanded
Gaussian beam. Therefore, a particle passing through the OSZ will experience
substantially the same maximum beam intensity (i.e. at z=0), regardless of its
trajectory. The specific values of x and y defining the trajectory ideally
have no
influence on the resulting sensor response, i.e. the pulse height.
There is a sharp contrast between the conventional optical design and the
scheme employed in the sensor used for focused light scattering devices. There
is a
large variation in the incident intensity as a function of position (x-axis)
across the
width of the flow channel. In the case in which the incident light beam has a
symmetric (circular) Gaussian profile, the intensity variation is given by
Equation 7,
with r=x. The maximum intensity, I, is achieved at the center of the beam
(x==0),
where for simplicity x=0 represents the midpoint of the channel (with the side
walls at
x= a/2). As noted, the intensity occurring at x= w, z=0 is reduced
substantially, to
0.135 lo. The intensity drops steeply with increasing distance from the beam,
falling,
for example, to 0.018 l0 at x= 2w, z=0 and 0.00033 To at x= 4 w, z=0.
The consequences for the light-extinction signal thus generated by the passage
of particles through the new OSZ are far-reaching. First, as for a
conventional LE-
type sensor, the pulse height, AVLE, generated by passage of a particle
through the
OSZ in general increases with increasing particle size, all other factors
being equal. In
CA 02842681 2014-01-21
WO 2013/013229
PCT/US2012/047766
general, the larger the particle, the larger the fraction of light "removed"
from the
incident beam, thus unable to reach the detector DIE. However, with the new
sensor
the fraction of light removed from the beam now depends on the precise
trajectory of
the particle--specifically, the minimum distance, Ixl, of the particle to the
center of the
beam, x=0. (To first approximation, the response of the sensor will not vary
significantly with changes in the y-axis value of the trajectory, assuming
that the
beam width is approximately constant over the depth of the flow channel, given
an
appropriately large depth of field, as discussed above.)
For a particle of given size and composition (hereinafter assumed to be
spherical and homogeneous, for simplicity), the maximum "signal," or pulse
height, is
achieved when the particle passes through the center of the beam, x=0. A
particle of
given effective cross-sectional area, AA, blocks the largest amount of
incident light at
the center of the beam, where the intensity is greatest. Particles of
identical size that
pass through the flow channel along different trajectories, with different
minimum
distances, Ixl, from the beam axis, are exposed to varying, but smaller,
maximum
levels of illumination. The greater the distance from the beam axis, the lower
the
integrated intensity incident on a particle and, hence, the less light flux
removed from
the beam, and the smaller the resulting pulse height. The response therefore
consists
of a continuous "spectrum" of pulse heights, ranging from a maximum value, for
trajectories that pass through the center of the beam, to essentially zero
(i.e.
indistinguishable from noise fluctuations), for trajectories located very far
from the
incident beam (Ixl>>w). The maximum pulse height depends on the beam waist,
2w,
and the size of the particles, as well as in some cases the refractive indices
of the
particles and surrounding fluid. (This depends on the extent to which light
scattering
is significant relative to refraction and reflection in contributing to the
overall light
extinction signal.) A crucial assumption is that the particle trajectories are
distributed
randomly (i.e. occur with equal frequency) within the flow channel. This
assumption
is usually valid, given the typical dimensions of the flow channel and the
relatively
low flow rates utilized. It is also assumed that the number of particles
passing through
the sensor is sufficiently large that the statistical fluctuations in the
number of
particles having trajectories with any given x-axis value (i.e. over any
(narrow) range
of x values) can be ignored.
The relationship between particle size and pulse height for the sensor in a
focused light scattering device is therefore radically different from that
obtained for a
36
CA 02842681 2014-01-21
WO 2013/013229
PCT/US2012/047766
sensor of conventional design. In the latter case, irrespective of their
trajectories,
particles of a given size (and composition) give rise to pulses of nearly
uniform
height. This behavior is important for sensor design for the conventional SPOS
method. The typically small variations in pulse height that occur, for
example, when
measuring polystyrene latex "standard" particles of essentially uniform size
are
caused by variations in the incident beam intensity within the OSZ along the x-
and y-
axes, for a given z-axis value. These variations ultimately determine the
resolution of
the sensor. The resulting width of the PSD is therefore mostly a consequence
of
residual non-uniformity of illumination across the OSZ, rather than an actual
range of
particle diameters.
By contrast, there is an obvious deterioration in the particle size resolution
for
sensor design for focused light scattering devices. When a single particle
passes
through the sensor, it gives rise to a light-extinction pulse with a height,
AV LE that can
vary between a given maximum value and essentially zero. Conversely, given a
single
detected pulse, it is impossible to determine the size of the particle that
has produced
it, solely from knowledge of the pulse height. For example, a particle that is
relatively
small, but which passes directly through the beam axis, yields the maximum
pulse
height possible for a particle of that size (and composition). Alternatively,
a particle
that is much larger but which passes relatively far from the beam axis yields
a pulse
height that could actually be the same, depending on its size and trajectory.
Even
though the large particle is able to intercept a much larger area of incident
illumination than the small one, the average intensity incident on it is
smaller than the
intensity incident on the small particle. Hence, the resulting pulse height
could turn
out to be the same as that produced by the small particle. Obviously, there
are an
infinite number of pairs, {d, kW of particle diameters and minimum beam-
trajectory
distances that can give rise to the same pulse height. The particle diameter,
d, and the
resulting pulse height, AVLE, are effectively "decoupled" from each other.
This is the
problem of "trajectory ambiguity", which for more than twenty years has
motivated
the search for new light-scattering based schemes for particle size
determination using
Gaussian beams.
The effects of trajectory ambiguity described above might present a difficulty
in measuring the size of a single particle, or a relatively small number of
particles.
However, the apparently poor size resolution associated with the sensor used
for
focused light scattering devices can be restored to a very acceptable level by
means of
37
CA 02842681 2014-01-21
WO 2013/013229
PCT/US2012/047766
appropriate mathematical deconvolution of the pulse-height data. The resulting
dramatic improvement in the effective sensor resolution is possible by virtue
of the
fact that the sensor in a focused light scattering device is intended to be
exposed to a
large, statistically significant number of particles of every relevant
diameter, or range
of diameters, contained in the sample of interest. This is the circumstance
that renders
the new sensing method very useful for particle size analysis, in sharp
contrast to the
situation that holds for "contamination" applications. There, the sensor is
exposed to
relatively small numbers of particles of any given size, for which statistical
significance is often not achieved.
The "raw" response of the sensor used in a focused-beam device, like its
conventional SPOS predecessor, consists of the pulse height distribution (PHD)-
-a
histogram of particle "counts" vs pulse height, AVLE. The pulse-height scale
is
typically divided into a relatively large number (e.g. 32, 64 or 128) of
"channels," or
"bins," each of which encompasses an appropriately narrow range of pulse
height
voltages, thus defining the voltage resolution of the PH). It is usually
convenient to
establish channels that are evenly spaced on a logarithmic voltage scale.
Measurement
of a new pulse causes the number of particle counts stored in the appropriate
pulse
height channel in the histogram to be incremented by one. Data are ideally
collected
from the particle suspension of interest for a sufficiently long time that the
resulting
PHD becomes statistically reliable, and thus smooth and reproducible. This
means
that the number, NI, of particle counts collected in the I-th pulse-height
channel is
statistically significant, dominating the fluctuations due to statistical
"noise," for all I,
e.g. for 1 < I <128, in the case of 128 channels. Assuming Poisson statistics,
this
means that NI>> NI, for all I.
Relatively high levels of particle concentration are possible because the
sensor
responds to only a small fraction of the total number of particles passing
through it.
For example, concentrations in the range of hundreds of thousands of
particles/ml, in
sample sizes of tens of mls, can be measured. That is, millions of particles
can be
present, a portion of which is passed through the beam of light and counted.
The
fraction of particles that are actually counted, relative to the number of
particles
present in the sample (Np), is known as phid, or "sensor efficiency," and is
calculated
by taking the ratio of the particles actually detected over the number of
particles in the
sample. The number of particles detected over the number of particles in the
sample
typically ranges from about 0.5 to about 5%.
38
CA 02842681 2014-01-21
WO 2013/013229
PCT/US2012/047766
The fact that the sensor efficiency is so relatively small is not surprising.
In the
case of a tightly focused beam, the width, a, of the flow channel is
invariably much
larger than the nominal width, 2w, of the focused beam. Therefore, most of the
particles passing through the sensor are exposed to negligible levels of light
intensity,
because their trajectories are located so relatively far from the beam axis--
i.e. Ixl>>w.
Consequently, only a small fraction of the total number of particles is able
to "block"
enough light to give rise to detectable pulses, relative to the prevailing
noise level.
The great majority of particles pass undetected through the sensor.
While this limitation may appear to be serious, in practice it is of little
concern, for two reasons. First, the fraction, phid, of particles that produce
detectable,
measurable pulses will be fixed for a given sensor width, a, even though the
value
changes with particle diameter, d. Second, the new sensing method is intended
for use
in determining the particle size distribution (PSD) for samples that, by
definition, are
highly concentrated to begin with. Even following dilution, if required, the
concentration of particles of any given size (i.e. within any (narrow) size
range) is, by
definition, relatively high. Assuming a suitable flow rate and data collection
time, the
resulting PHD will possess an acceptable signal/noise ratio, with a low level
of
statistical fluctuations. Hence, even though only a small fraction of the
available
particles will contribute to the raw data, the resulting PHD will be
representative of
the much larger number of particles in the sample that are ignored. Therefore,
a
reliable and accurate PSD, representative of. the entire sample, can be
obtained from
the "inefficient" sensor used in the focused light scattering devices
described herein.
Several additional features of the PHD that can be obtained are noteworthy.
First, as a consequence of the fact that the particle trajectories span a
large range of lx1
values, passage of uniform particles through the sensor indeed results in a
PHD
containing a wide range of pulse heights. In this case, these range from the
threshold
of individual pulse detection (dictated by the prevailing r.m.s. noise level),
roughly 5
millivolts (mV), to a maximum of approximately 326 mV for the nominal "end" of
the
distribution. (This excludes a small number of "outlier" pulses, due to
agglomerates
and over-size primaries that extend to 500 mV). Given the uniformity of the
particles,
this 65-fold range of pulse heights can only be ascribed to differences in
particle
trajectory. (To a first approximation, one can neglect variations in the beam
width
over the depth of the flow channel, as discussed earlier.)
39
CA 02842681 2014-01-21
WO 2013/013229
PCT/US2012/047766
Second, as expected, the PHD is highly asymmetric, skewed greatly in the
direction of smaller pulse heights. Clearly, there are many particle
trajectories that
sample a large range of Ix' values (and, hence, beam intensities), but only
relatively
few that probe the central portion of the Gaussian profile, where the
intensity is
substantially uniform. The PHD exhibits a broad, smooth upswing in the number
of
particles with increasing pulse height, accelerating to a relatively sharp
peak, followed
by a dramatic decline to the baseline, representing zero pulse events. This
sharp "cut-
off" at the upper end of the distribution defines the maximum pulse height,
referred to
hereafter as mAVLE. The counts collected at this maximum value represent
particles
that passed through, or very close to, the center of the beam--i.e.
trajectories with x
approximately equal to 0--where the fraction of total incident light flux
"blocked" by
the particles is the largest value possible. The counts collected in smaller
pulse height
channels represent particles that passed further from the beam axis; the
greater
parameter lxl, the smaller the resulting pulse heights.
There is a relationship between the particle trajectory and the resulting
pulse
height. Trajectory "A" gives rise to extinction pulses having the maximum
pulse
height, mAVLE, immediately preceding the upper cut-off of the PHD.
Trajectories "B,"
"C," "D" and "E" located progressively further from the beam axis, give rise
to pulses
with correspondingly lower pulse heights and progressively lower numbers of
particle
counts. Eventually, the number of particle counts per channel approaches zero,
as the
pulse height reaches the detection limit (approximately equal to 5 mV).
The reproducibility of the PHD depends only on the degree to which the
number of counts contained in the various channels is large compared to
statistical
fluctuations. Therefore, the "reliability" (i.e. the smoothness and
reproducibility) of
the PHD should depend on the total number of particles counted during a
measurement. For a given particle size there will obviously exist a minimum
number
of pulses that should be counted and analyzed, below which the PHD should be
expected to exhibit significant, irreproducible "structure" from one
measurement to
the next, due to statistical noise. Again, the PHDs produced by the new sensor
have
meaning only to the extent that relatively large, statistically meaningful
numbers of
particles of the same size are detected during the data collection period.
Only if this is
true can one expect to obtain optimal, reproducible PHD results, and
correspondingly
accurate, representative particle size distribution (PSD) results derived from
the latter
using the methods discussed below.
CA 02842681 2014-01-21
WO 2013/013229
PCT/US2012/047766
To confirm that the data measured is significant, one can overlay two or more
PHDs taken from measuring the same sample in multiple runs.
Exposing the sensor to larger particles will yield a PHD that is shifted to
larger
pulse heights. Specifically, the maximum pulse height, mAVTE, corresponding to
particle trajectories passing through, or very close to, the beam axis.
increases.
An LS-type sensor can be used in place of, or in addition to, an LE sensor.
The LS-type sensor uses a light collection means--typically one or more lenses-
-in
order to gather scattered light rays originating from individual particles
passing
through the OSZ, created by the incident light beam.
The lens system is designed to collect scattered light over a particular,
optimal
range of angles, typically encompassing relatively small angles of scattering.
In the
scheme shown in Figure 2, a mask 50 has been placed in front of the first
collection
lens. Mask 50 comprises an outer opaque ring 52 and an inner opaque area 54,
which
form a transparent ring 56. Mask 50 allows only light rays with scattering
angles,
theta, located within an imaginary annular cone defined by angles theta] and
theta2
(i.e. thetaL < theta2) to impinge on the first collection lens 62. Typically,
this lens is
centered on the axis of the incident beam, at an appropriate distance (i.e.
its focal
length) from the center of the flow channel, causing a portion of the
diverging
scattered light rays from the OSZ to be captured by the lens and become
approximately collimated. A second lens 64 can then be used to focus the
resulting
parallel scattered rays onto a suitable (small-area) detector DLs. The
resulting signal
is "conditioned" by one or more electronic circuits, typically including the
functions
of current-to-voltage conversion and amplification.
There is a crucial difference between the signal, VLs, created by this optical
scheme and the signal, VLE, produced by the LE-type sensor. Unlike the latter,
the
LS-type sensor, by design, prevents the incident light beam emerging from the
back
window of the flow cell from reaching the detector, DLs. Instead, the incident
beam is
either "trapped" by means of a suitable small opaque beam "stop" (e.g., the
inner
opaque area 54) or deflected by a small mirror away from the lens that is used
to
collect the scattered light rays originating from the OSZ. Consequently, the
relatively
large "baseline" level, V<sub>0</sub>, necessarily present in the overall signal,
VEE,
produced by the LE-type sensor is now absent from the LS signal, VLs. Ideally,
the
new "baseline" signal level is zero--i.e. there should be no scattered light
generated
from sources within the OSZ in the absence of a particle. In practice, of
course, there
41
CA 02842681 2014-01-21
WO 2013/013229
PCT/US2012/047766
will be some amount of background light caused by light scattered from the
surfaces
of the front and/or back windows of the flow channel, due to imperfections on,
or
contaminants attached to, the latter surfaces. In addition, there may be
fluctuating
background light due to scattering from small contaminant particles suspended
in the
diluent fluid. Also, for some samples there may be fluctuations in background
light
produced by a "sea" of ultra-fine particles which comprise a major fraction of
the
overall particle population, but which are too small to be detected
individually.
When a particle of sufficient size passes through the OSZ, defined by the
incident Gaussian light beam and front and back windows of flow channel 35, a
momentary pulse occurs in the output signal produced by the detector, DLs, and
associated signal-conditioning circuit. In general, one might naively expect
that the
larger the particle, the greater the amount of light scattered by it, assuming
the same
trajectory, and therefore the greater the height of the signal pulse.
In practice, the actual pulse height depends not only on the size of the
particle,
but also its composition--specifically, its index of refraction (and that of
the
surrounding fluid) and absorbance, if any, at the incident wavelength. The
pulse
height also depends on the wavelength of the beam and the orientation of the
particle
as it passes through the OSZ, if it is not spherical and homogeneous. Finally,
for
particles comparable in size to, or larger than, the wavelength, the
scattering intensity
varies significantly with the scattering angle. Consequently, in this case the
pulse
height depends on the range of angles over which the scattered light is
collected and
measured.
The relationship between the scattered light "radiation pattern" (i.e.
intensity
vs angle) and all of these variables is described by classical Mie scattering
theory,
which takes into account the mutual interference of the scattered light waves
within
the particle. In general, the larger the particle, the more complex (i.e. non-
isotropic)
the angular dependence of the scattered intensity resulting from intra-
particle
interference. In order to optimize the response and performance of the LS-type
sensor,
one must confine the collection of scattered light to a range of angles,
theta, for which
the net integrated response, AV, increases monotonically with the diameter, d,
of
particles of a given composition (i.e. refractive index) over the largest
possible, or
expected, size range. This requirement can usually be satisfied by choosing a
range of
relatively small angles, theta1<theta<theta2. close to the forward direction.
In this way,
one avoids "reversals" in the integrated scattering intensity with increasing
particle
42
CA 02842681 2014-01-21
WO 2013/013229
PCT/US2012/047766
size due to variations of the intensity with changes in angle, especially
significant at
larger angles as a consequence of Mie intra-particle interference.
There are two properties of the signal, VLs, produced by the new LS-type
sensor that are qualitatively different from the properties of the signal,
VIE, produced
by the corresponding LE-type sensor. First, the signal pulse caused by passage
of a
particle through the OSZ and the "overall" signal, \Its, are essentially the
same in the
case of the LS-type sensor. The relatively high background signal level that
accompanies the pulse of interest in the LE-type sensor is absent: (The same
situation
clearly holds for a conventional LS-type sensor).
Therefore, in the case of relatively small particles that give rise to pulses
of
low magnitude, the signal/noise ratio achieved in practice using the LS method
should
be significantly better than that realized using the LE method. This advantage
becomes more important the smaller the particle and the weaker the resulting
pulse, as
the latter approaches the prevailing noise fluctuations. Another way of
appreciating
the inherent advantage of the LS method over its LE counterpart is to realize
that the
former is based on "detection at null." That is, quantitative detection of a
pulse ideally
is carried out in the presence of zero background signal. From a signal/noise
perspective, this is in sharp contrast to the situation that obtains for the
LE method,
which requires high "common-mode rejection." The "common-mode" signal, Vo, is
always present in the raw signal, VIE, and must be subtracted, or otherwise
suppressed, in order to extract the (often small) signal pulse of interest.
There is a second important and distinguishing property of the LS signal, VLs.
The signal/noise ratio associated with the measurement of AN/Ls can in
principle be
improved by increasing the power of the incident light beam, so as to increase
the
light intensity incident on a particle at all points within the OSZ.
Therefore, in
principle one can reduce the lower size detection limit for the new LS sensor
by
increasing the power of the light source, as for a conventional LS sensor.
Eventually,
a lowest size limit will be reached, based on noise fluctuations associated
with the
suspending fluid and/or the light source and detection system. Of course, as
discussed
above, the lower particle size limit can also be improved for the new LS-type
sensor
by reducing the width, 2w, of the incident beam, assuming no change in the
power of
the latter. This action will obviously increase the maximum intensity incident
on the
particles that pass through the beam axis (x=0), and therefore the height of
the largest
resulting pulse for a particle of given size, as well. However, this method of
43
CA 02842681 2014-01-21
WO 2013/013229
PCT/US2012/047766
improving the sensitivity eventually reaches a point of diminishing return,
due to
limitations imposed by diffraction theory (establishing a minimum beam width)
and
excessive variation of the focused beam width over the depth, b, of the flow
cell due
to excessively-long depth of field.
By contrast, an increase in the power of the light source has relatively
little
effect on the lowest particle size that can be measured using the LE method.
For
example, a doubling of the power of the light source will result in a doubling
of the
baseline signal level (FIG. 2), to 2V0. The height of the pulse, AVLE,
produced by a
particle of the same size and trajectory will also be doubled, assuming no
change in
the beam width. However, the root-mean-square magnitude of the noise
fluctuations
associated with the relatively high baseline signal level will typically also
be
approximately doubled, because these fluctuations are usually associated with
the
light source and therefore scale with the output power. Hence, one expects
little or no
improvement in the signal/noise level for the LE-type sensor. Consequently,
there
should be little or no reduction in the lower size detection limit achievable
by the LE
method as a consequence of increasing the power of the light source. An
improvement
will be realized only if the signal/noise ratio associated with the light
source improves
with increased power.
When uniform size particles flow through the new LS-type sensor, depending
on their trajectories they are individually exposed to different values of
maximum
incident intensity, given by Equation 7, with r=x, z=0. (For simplicity, it
can be
assumed that the particles are much smaller than the beam width, so that every
point
in a given particle is exposed to the same intensity at any given time.)
Therefore, as
with the new LE-type sensor, the height, AVLs, of the resulting pulse
generated by a
particle of given size depends on the distance, lxl, of closest approach (z=0)
to the axis
of the incident beam. The smaller the distance lxl, the larger the value of
AVis. Hence,
like its LE counterpart, the LS-type sensor generates a distribution of widely
varying
pulse heights, AVLs, when a suspension of uniform particles passes through it
at an
appropriate flow rate. The shape of the resulting PHD bears a strong
qualitative
resemblance to the highly asymmetric shape of the PHDs obtained using the new
LE
method, exemplified in FIGS. 4, 6 and 7. That is, the number of pulse counts
(y-axis)
is relatively small at the smallest measurable pulse height just above the
noise
fluctuations) and rises with increasing pulse height, AVLs. The pulse count
value
culminates in a peak value at a maximum pulse height, referred to as mAVLs,
44
CA 02842681 2014-01-21
WO 2013/013229
PCT/US2012/047766
corresponding to particle trajectories for which Ixl.apprxeqØ Above AAVLs
the
number of pulse counts ideally falls to zero, assuming that the particle
concentration
is below the coincidence concentration (discussed earlier) for particles of
that size, so
that at most one particle effectively occupies the OSZ at any given time. Of
course, a
PHD obtained using the new LS method usually pertains to particles that are
smaller--
often significantly so--than those used to generate a typical PHD using the
new LE
method.
As noted above, the shape of the PHD--number of pulse counts vs AVLs--
generated for uniform particles using the new LS method is qualitatively
similar to the
shape of the PHD obtained for uniform (typically larger) particles using the
new LE
method. Both kinds of PHDs share the distinguishing characteristic of a sharp
"cut-
off" following their respective peak number of pulse counts, coinciding with
their
maximum pulse height values, mAVEs and mAVLE. However, it should be
appreciated
that there are quantitative differences in the shapes of the two kinds of d=1,
notwithstanding their qualitative similarities, even for the same particle
size--e.g. d=1
[tm. The "front end" design of the new LS-type sensor--i.e. the focused light
beam and
relatively thin flow cell--is essentially the same as that utilized for the
new LE-type
sensor. Therefore, what distinguishes one type of sensor from the other
concerns the
means and manner of light detection and the type and magnitude of the response
pulses generated by each method, even in the case of particles of the same
size. For
the new LS method, the response is due only to light scattering, and its
magnitude,
AVEs, is proportional to the intensity of the light incident on the particle,
all other
relevant variables being the same.
By contrast, for the new LE method the magnitude of the response, AVLE, is a
more complex function of the intensity incident on the particle. First, the
response is
due to a combination of physical effects--refraction (and reflection) plus
light
scattering. However, the scattering phenomenon asserts itself in an "inverse"
sense.
That is, a small fraction of the incident light flux is removed from the beam
before it
reaches the detector. Second, over the typical size range for which the new LE
method
is applicable, there is a substantial variation in the incident intensity
across the
particle. Therefore, it should not be surprising that the fractional change of
pulse
height due to a given change in Ixl, dependent on both particle size and
trajectory, is
generally different for the two methods. Similarly, the fractional change in
pulse
CA 02842681 2014-01-21
WO 2013/013229
PCT/US2012/047766
height with particle diameter, dependent on both particle size and trajectory,
is also
generally different for the two methods.
The task of converting the "raw" data--the PHD--obtained from a sample of
suspended particles into the object ultimately desired--the particle size
distribution, or
PSD, is described in detail below.
It is useful to compare this task conceptually with the operation required in
the
case of a conventional LE- or LS-type sensor. There, the height of the pulse
due to
passage of a particle through the OSZ is nearly independent of its trajectory,
because
the intensity of the incident beam is designed to be approximately constant
across the
flow channel (i.e. along the x-axis) for a given z-axis value (e.g. z=0).
Consequently,
particles of a given size ideally give rise to pulses of substantially the
same height,
and the resulting PHD is therefore, in effect, equivalent to the final desired
PSD.
There is a one-to-one correspondence between a given, measured pulse height,
AVLE
(or AVLs), and the particle diameter, d. If particles of a larger or smaller
size pass
through the sensor, the resulting pulse heights are larger or smaller,
respectively. A
"calibration curve," consisting of pulse height vs particle diameter, is all
that is needed
to obtain, by simple interpolation, the PSD from the PHD. Obtaining the raw
PHD
data using the conventional SPOS method is equivalent to determining the
final,
desired PSD.
By contrast, as discussed earlier, the response of the LE- (or LS-) type
sensor
is much more "convoluted." Even in the simplest case of particles of a single
size, the
resulting PHD consists of a broad spectrum of pulse heights, from the smallest
values
just above the prevailing noise fluctuations, to the maximum value, mAVLE (or
mAVLs), associated with that size. Therefore, in the typical case of particles
of widely
varying size, the resulting PHD consists of an even wider assortment of pulse
heights.
No longer is there a simple correspondence between pulse height and particle
size. It
is therefore no longer a simple, straightforward procedure to transform the
set of
particle counts vs pulse-height values contained in the PHD into the desired
size
distribution¨particle counts vs particle diameter.
It typically involves three procedures to convert the PHD to the desired PSD.
First, the raw PHD must be inverted, or deconvoluted, using a specialized
mathematical algorithm. Its purpose is to convert the "wide-spectrum" PHD
produced
by the new LE- (or LS-) type sensor into a "sharp", idealized PHD. equivalent,
in
effect, to what would have been obtained using a conventional LE- (or LS-)
type
46
CA 02842681 2014-01-21
WO 2013/013229
PCT/US2012/047766
sensor. Such an idealized, deconvoluted PHD--hereinafter referred to as the
dPHD--
has the property that all pulses of a given height, AVLE (or AVLs), belong
exclusively
to particles of a given size (assuming, always, particles of a given
composition). The
dPHD is equivalent to what would have been obtained if all of the particles
contributing to the original PHD had passed through the center (axis) of the
incident
beam.
A second straightforward procedure is then carried out. A preliminary, or
"raw", PSD is obtained from the dPHD by simple interpolation of the
calibration
curve that applies to the specific new LE- (or LS-) type sensor utilized--e.g.
the curve
shown in FIG. 8A. This procedure permits a one-to-one translation of each
deconvoluted pulse height value in the dPHD into a unique particle diameter
associated with this value, thus yielding the raw PSD. A third procedure is
then
needed to convert the raw PSD thus obtained into a final PSD that is
quantitatively
accurate. The number of particle counts in each diameter channel of the raw
PSD is
the number of this size that actually contributed to the measured PHD. As
discussed
above, this is typically only a small fraction of the total number of
particles of the
same size (i.e. within the size range defined by the diameter channel)
residing in the
volume of sample suspension that passed through the sensor during data
collection.
This fraction, phid, of particles actually detected by the new LE- (or LS-)
type sensor
varies significantly with the particle diameter, d.
The third procedure involves multiplying the number of particles contained in
each diameter channel of the raw PSD by the value of 1/phi1 that applies for
that
channel. This operation yields the final, desired PSD, describing the number
of
particles of each size estimated to reside in the quantity of sample
suspension that
passed through the sensor during data acquisition. Values of 1/phid for each
value of
diameter, d, can be obtained from the sensor efficiency curve. phid vs d, by
interpolation.
There are two independent algorithms presented herein for deconvoluting a
measured PHD, to obtain the dPHD, hereinafter referred to as "matrix
inversion" and
"successive subtraction." Implementation of either procedure is based on the
property
that the response of the new LE- (or LS-) type sensor--like its conventional
SPOS
counterpart¨is additive. Because the particles passing through the sensor give
rise to
signal pulses one at a time, the resulting PHD can be considered to be
composed of a
linear combination, or weighted sum, of individual PHDs corresponding to
uniform
47
CA 02842681 2014-01-21
WO 2013/013229
PCT/US2012/047766
particles of various sizes, referred to as "basis vectors." (This term is well
known in
linear algebra.) Each of these basis vectors represents the response of the
system to a
statistically significant number of particles of a single, given size.
In one embodiment, the focused light scattering device described herein
incorporates both the new LE- and LS-type SPOS sensors in a single sensor,
having
two independent output signals, VLE and VLs. The resulting dual "LE+LS" design
offers increased capability and flexibility, providing single-particle
counting and
sizing over a relatively large range of particle sizes. The LS-type sensor
subsystem
can be used to extend the size range below the lower detection limit provided
by the
new LE-type sensor subsystem. The extent to which the lower particle size
limit can
be extended depends on a variety of parameters. These include: the width, 2w,
of the
narrow (typically focused) beam within the measurement flow cell; the power of
the
light source; the range of angles over which scattered light is collected for
implementation of the new LS-type sensing function; and the physical
properties,
including the refractive index, of both the particles and the suspending
fluid.
The dual LE+LS sensor includes a light source, preferably consisting of a
laser
diode module, typically having an output wavelength in the range of 600 to
1100
nanometers (nm). The beam produced by the light source means preferably is
collimated (parallel) and "circularized"--i.e. the intensity is a function
only of the
distance, r, from the central axis. Furthermore, the beam preferably has a
Gaussian
intensity profile, along any axis normal to the axis of propagation of the
beam. The
new LE+LS sensor also includes a focusing means, typically a single- or multi-
element lens, capable of focusing the starting collimated light beam to the
desired
beam width, 2w, at the center of the measurement flow channel in the OSZ,
consistent
with the desired particle size range. It is assumed that the focusing means
has an
appropriate focal length, thus yielding acceptable values for both the width
and depth
of field of the focused beam. The latter is preferably significantly longer
than the
thickness, b, of the flow channel, in order to optimize the resolution of the
resulting
PSD.
A measurement flow cell is typically fabricated from a suitable transparent
material, such as glass, quartz or sapphire, or alternative semi-transparent
material,
such as PTFE (e.g. Teflonlm, manufactured by DuPont) or other suitable plastic
that is
sufficiently transparent at the operating wavelength and compatible with the
fluid-
particle mixture. A suitable fluidics system, including a flow pump means and
48
CA 02842681 2014-01-21
WO 2013/013229
PCT/US2012/047766
optional means for automatic dilution of the starting sample suspension (if
needed),
are typically required to facilitate the steady flow of the particle-fluid
suspension
through the flow cell. The flow rate, F, is usually chosen to be the same as,
or close
to, the value used to generate the calibration curve for the LE- or LS-type
sensor.
The thickness, b, of the flow channel should be small enough to achieve a
high coincidence concentration limit and as uniform a beam width as possible
(ideally
with b<<depth of field), resulting in improved resolution for the final PSD.
However,
it must be large enough to prevent frequent clogging by over-size particles
(e.g.
agglomerated primaries and contaminants in the fluid/diluent). The width, a,
of the
flow channel is also chosen to strike a compromise between two competing
effects. A
relatively large value reduces the impedance to the flowing fluid-particle
mixture and
lowers the velocity (and increases the pulse width) for a given flow rate, F.
However,
the larger parameter a, the smaller the sensor efficiency, phid, for any given
particle
diameter, d. This results in a smaller fraction of particles in the sample
actually
contributing to the measured PHD and final PSD, which, if too small, may be
undesirable.
The new LE+LS sensor contains two separate light collection and detection
subsystems, used independently to extract the desired LE- and LS-type signals.
The
LE-type signal can be captured using a small light reflecting means M (e.g.
mirror),
positioned so as to intercept the narrow beam of incident light after it
passes through
the flow cell and fluid-particle mixture. The resulting transmitted beam, thus
deflected
away from the optical axis of the combined sensor, is caused to impinge on a
nearby
light detection means D. The latter typically consists of a small-area, solid-
state
(silicon) detector, operating in a linear region and having a spectral
response that is
matched to the wavelength of the light source, thus providing an output signal
with an
acceptable signal/noise (S/N) ratio. The output of the detector means is
typically a
current (the "photocurrent"), which can be conditioned by a current-to-voltage
converter ("transimpedance" amplifier), yielding an output signal in the
generally
desired form of a time-varying voltage. VLb(t).
Alternatively, a small detector element can be placed directly in the path of
the
light beam after it emerges from the flow cell, thus eliminating the need for
the
intermediate light reflecting means discussed above. Regardless of whether a
mirror
or detector element is used to "capture" the transmitted light beam, there are
two
requirements. First, the means used must function as an effective beam "stop."
That is,
49
CA 02842681 2014-01-21
WO 2013/013229
PCT/US2012/047766
it must be able to prevent any significant fraction of the arriving light flux
from being
reflected back toward the flow cell, thus becoming a source of "stray" light.
Through
unintended internal reflections from the various optical surfaces, a portion
of the stray
light can find its way to the scattering detection means Dis, thus corrupting
the
resulting LS signal, by contributing a portion of the incident intensity to
the latter.
Second, the means used to capture the LE signal must be small enough not to
intercept, and therefore block, scattered light rays at any angles that are
intended to be
captured and redirected to the light detection means Di_s, as discussed below.
Separately, scattered light originating from particles passing through the OSZ
is collected over a range of scattering angles, theta, with
theta1<theta<theta2, where
angles thetai and theta2 are defined by a suitable aperture means, such as an
annular
mask fabricated from a photographic negative with an outer opaque portion, a
transparent intermediate portion, and an inner opaque portion. The scattered
rays
selected by the mask are allowed to impinge on a collecting lens of
appropriate focal
length and location, which converts the diverging scattered rays into an
approximately
parallel beam. A second lens is then typically used to refocus the rays onto a
relatively
small light detection means Dis. As in the case of the LE subsystem, the
output signal
of Dibs is typically a current, which can be optionally conditioned, typically
by means
of a transimpedance amplifier, so that the final output is in the form of a
time-varying
voltage, Vis(t).
The signals VLE(t) and VLs(t) can be organized into respective pulse height
distributions PHD by pulse height analyzers. The PHDs are then respectively
deconvoluted in computer deconvolution means, which ultimately compute a pair
of
respective particle size distributions ("PSD").
This embodiment can be implemented as an LE-type or LS-type sensor only,
simply by removing (or not installing in the first place) the optical
elements, detection
means and signal conditioning circuitry associated with the unwanted
subsystem. In
this case, it may be useful to adjust the width, 2w, of the focused beam
within the
measurement flow channel, in order to optimize the resulting performance of
the LE-
or LS-type sensor. This parameter will impact the usable particle size range,
coincidence concentration limit and minimum detectable particle size
differently for
the two sensing modes, as discussed earlier.
Hydrodynamic Sample Injection
In one embodiment, the apparatus uses hydrodynamic sample injection, such
as is described in Pelssers et al., Journal of Colloid and Interface Science,
Volume
137, Issue 2, July 1990, Pages 350-361. Colloidal dispersions, such as
platelets in
serum or other media, can be hydrodynamically focused laser. into a narrow
stream,
with widths ranging from about 3 to about 10, preferably about nm width. The
use of
a focused light scattering technique allows one to measure relatively small
particle
sizes. However, where a focused beam hits particles in a relatively wide
sample
stream (as described above, where the beam is narrower than the measurement
flow
channel in the width direction), the detection method relies somewhat on
statistics.
That is, where the beam is substantially narrower than the sample stream, an
assumption is made that there is an equal distribution of particles in the
sample
stream, so that one can extrapolate the results of the interaction of the
light in the
narrow beam with the particles in its path over the entire width of the sample
stream.
By hydrodynamically focusing the sample into a stream with a relatively narrow
width, and using a focused light source, it is possible to count all or most
of the
particles in the sample stream, and rely to a lesser extent on statistics.
A representative injector for carrying out hydrodynamic injection is shown in
more detail in Figure 3. As shown in Figure 3, a sample passes through an
inlet port
(100), through a fluid sheath (110), and outward through the bottom of the
injector
into a flow cell (120). The sample travels through the sample injection tube,
with fluid
from a fluid sheath surrounding the stream, and hydrodynamic focusing within
the
flow cell forcing particles into a single-particle-file stream where laser
light intercepts
the stream at a sample interrogation point. The design of the flow cell, when
a
hydrodynamic injector is used, permits particles to flow through the center of
the flow
cell. Increasing the sample pressure increases the core diameter and the flow
rate.
The device described herein is similar to the device disclosed in U.S. Patent
Application Publication No. 20040011975. The main differences between the
device
disclosed in U.S. Patent Application Publication No. 20040011975 and the
instant
51
CA 2842681 2019-06-26
CA 02842681 2014-01-21
WO 2013/013229
PCT/US2012/047766
device are that the instant device further includes a hydrodynamic injector,
or
additional lasers and detectors, such as detectors that can detect fluorescent
labels.
The apparatus is described therein is useful in performing particle analysis
using focused light scattering techniques. However, as described herein, other
similar
apparatus can be employed, including detectors for focused light scattering
and/or
light extinction.
The principal defining characteristic of the focused light scattering method
described herein is not simply a significant reduction in the size of the
illuminated
area, Ao, resulting in a significant reduction in Vosz and improvement in
sensitivity.
Rather, it concerns the nature of the illuminating beam and the resulting OSZ
thereby
defined.
The term "focused light scattering" refers to a method for sensing single
particles, suspended in a solution, when the solution is passed through a
focused
beam. When the beam passes through the solution without being scattered by a
particle, the beam passes on to a photodetector and the intensity is measured.
When
the beam is scattered, in whole or in part, by a particle, the intensity of
the beam
hitting the photodetector is altered. The particle size and concentration can
be
calculated, for example, using light-extinction, light-scattering detection,
or both.
In one embodiment, the beam is produced by a laser. The laser beam interacts
with the particles, and produces scattered light when the laser beam interacts
with a
particle. In one aspect of this embodiment, the apparatus includes two or more
different lasers, which can give off light at two or more different
wavelengths, and/or
which can interact with the particles at different angles. The use of light at
different
wavelengths can enable one to identify specific epitopes. Particles can
interact with
specific molecules, including fluorescently-labeled molecules, and the
fluorescence
can be detected using a laser with light at a predetermined wavelength that
interacts
with the fluorescent label. The use of more than two lasers can enable the use
of two
or more fluorescent labels. which labels fluoresce at different wavelengths.
This
technique is described in more detail below.
52
CA 02842681 2014-01-21
WO 2013/013229
PCT/US2012/047766
A beam of light (usually laser light) of a single wavelength is directed onto
a
stream of a fluid, in one embodiment, a hydrodynamically-focused stream of a
fluid,
which includes particles whose size and number is to be determined.
A number of detectors are aimed at the point where the stream passes through
the light beam. In one aspect of this embodiment, one detector is in line with
the light
beam (Forward Scatter or FSC) and one or more detectors are perpendicular to
it,
including Side Scatter or SSC detectors and one or more fluorescent detectors.
Each
suspended particle passing through the beam scatters the ray, and fluorescent
chemicals either present within the particle or attached to the particle are
excited into
emitting light at a longer wavelength than the light source. This combination
of
scattered and fluorescent light is picked up by the detectors, and, by
analyzing
fluctuations in brightness at each detector (one for each fluorescent emission
peak), it
is then possible to derive various types of information about the physical and
chemical structure of each individual particle.
Thus, in some embodiments of the apparatus described herein, there are three
or more detectors. For example, one can include one detector for extinction
[useful
for measuring particles with a size > 0.7 microns], one for scattered light
[useful for
measuring particles with a size between 0.15 and 0.7 microns] and one or more
for
determining fluorescence [used for phenotyping].
xaxv
Light Sources
The sources of light can include lamps (i.e., mercury, xenon); high-power
water-cooled lasers (i.e., argon, krypton, dye laser); low-power air-cooled
lasers (i.e.,
argon (488 nm), red-HeNe (633 nm), green-HeNe, HeCd (UV)); diode lasers (i.e.,
blue, green, red, violet). The detectors can convert fluorescence signals from
light
into electrical signals that can be processed by a computer.
Data Acquisition
The process of collecting data from samples is termed -acquisition."
Acquisition is typically mediated by a computer physically connected to the
apparatus, and the software which handles the digital interface with the
apparatus. The
software is capable of adjusting parameters (i.e. voltage, compensation, etc.)
for the
sample being tested, and also assists in displaying initial sample information
while
acquiring sample data to insure that parameters are set correctly. An
interactive
53
CA 02842681 2014-01-21
WO 2013/013229
PCT/US2012/047766
database can allow the apparatus to be used in applications for both clinical
and
research purposes. A wide variety of analysis software and fluorescently-
labeled
antibodies has been developed, and are well known to those of skill in the
art.
The apparatus can include multiple lasers (between 2 and 5, typically between
two and four) and fluorescence detectors (typically between 2 and 18, more
typically
between 2 and 10). Increasing the number of lasers and detectors allows for
multiple
antibody labeling, and can more precisely identify a target population by
their
phenotypic markers.
Gating
The data generated by the apparatus can be plotted in a single dimension, in
two dimensions, or even in three dimensions. The regions on these plots can be
sequentially separated, based on fluorescence intensity, by creating a series
of subset
extractions, termed "gates." Specific gating protocols exist for diagnostic
and clinical
purposes especially in relation to hematology.
The plots are often made on logarithmic scales. Because different fluorescent
dyes' emission spectra overlap, signals at the detectors have to be
compensated
electronically as well as computationally. Data accumulated using the
apparatus can
be analyzed using software, e.g., Flowjo, FCS Express, VenturiOne or CellQuest
Pro.
Data analysis can be performed on a separate computer, if desired.
Computational analysis
Automated population identification using computational methods can be used
as an alternative to traditional gating strategies. Automated identification
systems can
potentially help find rare and/or hidden populations. Representative automated
methods include FLOCK in Immunology Database and Analysis Portal (ImmPort),
FLAME in GenePattern and flowClust, in Bioconductor.
Microfluidics
In some applications, particularly clinical applications, it can be desirable
to
use microfluidics to introduce samples to the apparatus. The microfluidic
device can
be disposable (i.e., used once or perhaps a few times, followed by disposal
and
replacement) and/or composed of a polymeric material. The microfluidic device
can
be adapted to reduce the amount of sample used to determine whether a patient
can
54
CA 02842681 2014-01-21
WO 2013/013229
PCT/US2012/047766
benefit from a particular therapy. The microfluidic device preferably provides
a tip
adapted for delivering the biological sample including the platelets into the
cell
through which light passes, so that the platelets can then travel through the
light
beam(s). In some embodiments, the tip is adapted for sheath spraying. In other
embodiments, the tip is adapted for non-sheath spraying. In any of the
embodiments
herein the apparatus may include a disposable inlet capillary.
Auto-Diluters
The apparatus can also include an autodiluter, which can start with the most
dilute sample, rather than the most concentrated sample, and can therefore use
less
sample. Autodiluters are well known to those of skill in the art.
Representative
autodiluters include the AutoDiluter-5.2, the CETAC ADX-500 Autodiluter, the
ProLiquid AutoDiluter, and the DYNATECH Autodiluter III.
Mechanical Shearing Devices (For EQELS and/or ISADE Devices)
Certain biological and non-biological species require mechanical shear for
activation. Species may be a cell, a protein, ribo- or deoxyribonucleic acid,
polysaccharides, aggregated cells or molecules or the like. Representative
examples
of cells include, but are not limited to, endothelial cells and platelets, and
representative examples of molecules include von Willebrand factor and DNA.
Both
biological and non-biological species may aggregate to exhibit an effect on
the
mechanical properties of a fluid. Examples would be thixotropy (shear
thinning) and
rheopexy (shear thickening). Biological cells, molecules like fibrin, vWF,
tubulin,
myosin, and the like, and non-biological materials, like paints or inks, are
examples.
The provision of mechanical shear can be accomplished by integrating a
mechanical shearing device into the apparatus described herein. Although there
are
many means for introducing mechanical shear, any one of which can be used, in
one
embodiment, a suitable device is shown in Figure 4. In this device, a sample
is placed
in a suitable container. The sample in the container may then be extricated
from the
container manually, or by a robotic and then introduced into a pump. In one
aspect of
this embodiment, the pump is a precision pump that can produce a precise and
continuous flow rate of the sample within the shearing device (200). The
shearing
device (200) is composed of a hollow fiber that may be linear or coiled,
though in the
embodiment shown in Figure 4, it is coiled. In one aspect of this embodiment,
the
CA 02842681 2014-01-21
WO 2013/013229
PCT/US2012/047766
hollow fiber is composed of materials that minimize interaction with the
sample or
under certain other cases or circumstances may interact with the sample in a
specific
manner. For example, the inner surface of the hollow fiber may be coated with
collagen that interacts with vWF or with platelets. The length of the hollow
fiber and
the inter diameter of the hollow fiber can be precisely known. Further, the
pressure
drop across the fiber can be precisely known, from the flow rates, volume
flux, and/or
from pressure sensors located at each end of the hollow fiber. From these
data, the
mechanical shear rate experienced by the sample can be calculated. The
effluent
sample can then be passed on to the scattering chamber of EQELS or the
hydrodynamic injector of the ISADE device described herein by means of a
linking
hollow fiber. In this manner, the entire system is closed, and the sample can
pass in a
continuous manner from the original sample container though the shearing
device and
into the respective scattering chambers or hydrodynamic injector, then into an
effluent
chamber via an exit port (210).
In use, the sample follows a path from a storage device, via a pump (310)
controlled by robotics (300) through a shearing device (320), into a cell
where
scattered light can be detected (330), and then to an effluent container
(340).
Although a scattering chamber of an EQELS device is shown in Figure 5, when
the
shearing device is used in connection with the hydrodynamic injector of an
ISADE
device as described herein, the hydrodynamic injector can substitute for the
scattering
chamber shown in Figure 5.
In an alternative embodiment, shear can be provided using ultrasound;
vibration; radiowaves; cone-plate, parallel plate or coutte shearing surfaces;
a coaxial
plunger device and the like).
Robotics
In high-throughput screening, it can be preferable to include robotics, which
can introduce the samples to the apparatus. Ideally, the apparatus can then be
cleaned
in between samples, for example, by flushing the various lines, and subsequent
samples introduced, enabling the screening to be automated. Information on the
screening results can be stored, for example, in a memory map, and the
information
con-elated with the patient's identity.
56
CA 02842681 2014-01-21
WO 2013/013229
PCT/US2012/047766
A "focused light scattering device" is a single-particle optical sensor, which
has high sensitivity and responds to relatively concentrated suspensions, uses
a
relatively narrow light beam to illuminate an optical sensing zone non-
uniformly. It
differs from conventional single particle optical sizing (SPOS) devices in
that it can
handle more concentrated solutions and smaller particle sizes.
In use, a solution including suspended particles passes through a zone. The
zone is smaller than the flow channel, so that the sensor responds to only a
fraction of
the total number of particles flowing through the channel, detecting a
statistically
significant number of particles of any relevant diameter.
Because different particle trajectories flow through different parts of the
zone
illuminated at different intensities, it is necessary to deconvolute the
result. Two
methods of deconvolution can be used: modified matrix inversion or successive
subtraction. Both methods use a few basis vectors measured empirically or
computed
from a theoretical model, and the remaining basis vectors are derived from
these few.
The sensor is compensated for turbidity.
The sensor apparatus for single-particle optical sizing of particles in a
fluid
suspension typically includes a means for establishing flow of the suspension
through
a physically well-defined measurement flow channel. There is also an
illumination
means for effectively directing a relatively narrow beam of light, having an
axis,
through the measurement flow channel to form an optical sensing zone within
the
measurement flow channel. The beam of light and the optical sensing zone are
of
such size relative to the size of the measurement flow channel that the sensor
apparatus responds to only a fraction of the total number of particles flowing
through
the measurement flow channel. In this manner, the sensor apparatus responds
effectively to a relatively concentrated fluid suspension.
The beam has a maximum intensity portion and a continuum of lesser
intensities for positions spaced transverse to the axis from the maximum
intensity
portion. In this manner, some of the particles have trajectories through the
maximum
intensity portion, others of the particles have trajectories through the
lesser intensity
positions, and still others of the particles may have trajectories outside the
zone.
Typically, the maximum intensity portion of the beam is in a central portion
of the
beam.
The device also includes a detector means for photo-detecting light from the
zone to provide pulse height signals. These signals each respond to a particle
flowing
57
CA 02842681 2014-01-21
WO 2013/013229
PCT/US2012/047766
through the zone. The pulse height signals are functions of the sizes and
trajectories
of detected particles. Particles of a given size provide a maximum pulse
height signal
when flowing through the maximum intensity portion, and lesser pulse height
signals
when flowing through the lesser intensity positions of the zone. The pulse
height
signals, collectively, form a pulse height distribution PHD.
The device further includes a means for mathematically deconvoluting the
pulse height distribution to extract a particle size distribution of the PSD
particles in
the fluid suspension. The sensor apparatus can detect a statistically
significant
number of particles of any given diameter or range of diameters that are
relevant to
the fluid suspension.
In one embodiment, the measurement flow channel has a thickness dimension
axially of the beam of light, a width dimension transverse to the beam, and a
flow
direction substantially perpendicular to the thickness and width dimensions.
The
beam is narrower than the measurement flow channel in the width direction. The
beam can be focused with a depth of field which is substantially larger than
the
thickness dimension, and the beam substantially has an effective width which
does
not vary substantially over the thickness dimension.
In another embodiment, the beam has an effective width between opposing
positions transverse to the axis in the beam, at which the lesser intensities
have fallen
to a given fraction of the maximum intensity. The effective width is chosen so
that
the largest particles of interest can be effectively sized. The given fraction
can be, for
example, 1/e2 of the maximum intensity, where e is the base of the natural
system of
logarithms, and the effective width is substantially one half the size of the
largest
particle to be sized.
The light beam can have, for example, a Gaussian intensity profile, a circular
cross-section, or an elliptical cross-section being wider in a direction
transverse to
particle flow.
The detector means can be include a light extinction-type detector, and can be
a combination of detectors, for example, a light-extinction detector type and
a light-
scattering type detector. The light-scattering type detector means can include
means
for passing a portion of scattered light from the zone through a mask to
select light
scattered between a first and a second angle to the beam and a means for
directing a
portion of the light transmitted through the zone to a light-extinction type
detector.
58
CA 02842681 2014-01-21
WO 2013/013229
PCT/US2012/047766
The detector means can include a mirror for deflecting a portion of the light
from the optical-sensing zone to the light-extinction detector. The
illuminating means
can include a light source and optical fiber means for conveying light from
the light
source to the optical sensing zone, and projecting the light through the zone.
The detector means can also include an optical fiber means for conveying the
light passing through the optical sensing zone to the light-extinction type
detector.
The detector means can also include means for passing a portion of the light
scattered
from the zone through a mask, to select light scattered between a first and
second
angle to the beam, and an optical fiber means for conveying the portion of the
light to
a light-scattering type detector. The detector means can also include a light-
scattering
detector.
In one embodiment, the illumination means provides two light beams directed
through a pair of optical sensing zones positioned within the measuring flow
channel,
and each beam has an effective width determined by a desired maximum particle
size.
The detector means can include a light-scattering detector and a means for
passing light scattered from the zone through a mask means. The mask means can
include a plurality of masks and means for selecting one of the masks for
passing the
light scattered from the zone, each mask defining different angles between
which the
light is scattered. The masks can be located on a rotatable wheel, and a mask
can be
selected by rotating the wheel to a desired position.
The illuminating means can project a relatively wide collimated beam through
the optical sensing zone, and can include an acceptance aperture to capture
only those
light rays that closely surround the axis of the beam. This reduces the
effective width
of the beam to a width in a direction transverse to the axis of the light beam
which is
substantially one-half the size of the largest particle to be sized. The
illuminating
means can also include a means for coupling the light rays to the detector
means.
This can be, for example, an optical fiber means.
In one aspect of the invention, a statistically significant number of
particles of
each relevant size flow through all portions and positions of the zone.
In another aspect of the invention, the fluid suspension is relatively
concentrated and the apparatus further comprises means to compensate for
turbidity
of the suspension. In this aspect, the detector means can operate on a light
extinction
principle, and provide a signal having a baseline voltage level. The pulse
height
59
CA 02842681 2014-01-21
WO 2013/013229
PCT/US2012/047766
signals appear as downwardly extending pulses from the baseline voltage level,
and
the means for compensation for turbidity of the suspension can include means
to
sense the baseline voltage level and automatically increase the level to
approximately
the baseline voltage level present in the absence of turbidity in the
suspension. The
detector means can operate on a light extinction principle, and provide a
signal having
a baseline voltage level, wherein the means to compensate for turbidity can
include a
computer means for correcting the pulse height signals in response to the
ratio of the
baseline voltage level when the fluid suspension is not turbid, to the
baseline voltage
level for the turbid fluid suspension.
The detector means can also operate on a light extinction principle and
provide
a signal having a baseline voltage level, wherein the means to compensate for
turbidity includes a means to adjust the intensity of the beam of light by
increasing the
amount of light produced by the illuminating means in response to the ratio of
the
baseline voltage level when the fluid suspension is not turbid, to the
baseline voltage
level for the turbid fluid suspension.
The particle trajectories can be substantially uniformly distributed across
the
width of the measurement flow channel.
Dec on voluti n g the Pulse Height Distribution
The means for deconvoluting the pulse height distribution can include basis
vectors, each corresponding to a particular particle size, and a source vector
representing a measured pulse height distribution for a fluid suspension as
detected by
the detector means. There can also be a means using a deconvolution algorithm
to
derive the particle size distribution from the pulse height distribution. At
least some of
the basis vectors can have values based upon measurements of particles of
known
size. Some of the basis vectors can also have values based upon measurements
of
particles of known size and others of the basis vectors can be computed from
the sum
of the basis vectors by interpolation and/or extrapolation.
The basis vectors can be computed, and the basis vectors can be column basis
vectors of a matrix, where the means using a deconvolution algorithm performs
matrix inversion and vector multiplication, or the means using a deconvolution
algorithm can perform successive subtraction.
The means using a deconvolution algorithm can provide a deconvoluted pulse
height distribution dPHD, and the apparatus further comprises means providing
a
CA 02842681 2014-01-21
WO 2013/013229
PCT/US2012/047766
calibration curve of the relationship of pulse height and diameter, and means
using the
calibration curve to transform each deconvoluted pulse height value in the
dPHD into
a unique particle diameter associated with this pulse height value. This can
yield a
"raw" particle size distribution PSD. There can also be a means for converting
the
raw PSD into a final PSD by renormalizing the raw PSD by multiplying by the
value
1/PHId, where PHId is the fraction of particles actually detected by the
device for
particles of each size.
The particle trajectories can be distributed non-uniformly across the width of
the measurement flow channel, and the basis vectors can be based upon the
response
of particles of known size flowing through the measurement flow channel with
the
same non-uniform distribution of particle trajectories as the fluid
suspension.
The sensor apparatus may respond only to a fraction of the total number of
particles flowing through the measurement flow channel.
One can prepare a matrix for deconvoluting pulse height distributions derived
from particles of unknown size flowing along different trajectories through a
non-
uniform light field of a single-particle optical sizing device. This can
enable one to
size particles in a fluid suspension. To do this, one can determine the value
of at least
one empirical basis vector for the matrix by measuring the response of
particles of
known size flowing through the single-particle optical sizing device. Then,
one can
compute other basis vectors for the matrix corresponding to particles of other
sizes, by
interpolating and/or extrapolating the other basis vectors from the empirical
basis
vector.
One can also determine the value of additional empirical basis vectors for the
matrix by measuring the response of particles of known sizes flowing through
the
single-particle optical sizing device, and computing the other basis vectors
for the
matrix corresponding to particles of other sizes from the at least one
empirical basis
vector and the additional empirical basis vectors.
Another way to prepare a matrix for deconvoluting pulse height distributions
derived from particles of unknown size flowing along different trajectories
through a
non-uniform light field of a single-particle optical sizing device for sizing
particles in
a fluid suspension involves determining the value of at least one computed
basis
vector corresponding to particles of at least one size for the matrix. One can
compute
other basis vectors for the matrix corresponding to particles of other sizes
from
computed basis vectors.
61
CA 02842681 2014-01-21
WO 2013/013229
PCT/US2012/047766
Also disclosed is a method of deconvoluting a pulse height distribution
derived from particles of unknown size flowing along different trajectories
through a
non-uniform light field of a single-particle optical sizing device for sizing
particles in
a fluid suspension. The method involves setting up a matrix having a plurality
of
columns, each containing a basis vector comprising a pulse height distribution
of
particles of a known size corresponding to the response of a photo-detector of
the
device to the particles of known size. Each successive column contains a basis
vector
for particles of successively larger sizes. The matrix also has a like
plurality of rows,
each corresponding to a successive pulse height channel, each channel
including a
range of pulse heights, with successive rows corresponding to successively
larger
pulse heights, and with each column having a maximum count pulse height value
at a
location for a row which relates to a pulse height corresponding to the
particle of
known size associated with the column. The maximum count pulse height values
for
successive columns are arranged on a diagonal of the matrix. The matrix is
modified
by setting all terms corresponding to pulse height values greater than the
maximum
count pulse height value in a column to zero. A deconvolution algorithm is
used to
perform matrix inversion and vector multiplication of the pulse height
distribution and
the matrix as modified.
Before the modifying step, one can renormalize the values of the basis vectors
in the columns by setting the maximum count pulse height value to equal 1.0
and all
other count pulse height values in the column to a value maintaining the same
proportionate value to 1.0 that the other count pulse height values had to the
maximum count pulse height value of the column.
The response of the photo-detection to the particles of known size is
developed empirically for some of the basis vectors by sending particles of
the
substantially known size through the device and providing a response by the
device to
the particles of known size. The response to the photo-detector for the
remaining
basis vectors can be computed by interpolating and/or extrapolating the
response for
the remaining basis vectors from the some of basis vectors.
The response of the photo-detector to the particles of known size can be
computed for some of the basis vectors and the response to the photo-detector
for the
remaining basis vectors can be computed by interpolating and/or extrapolating
the
response from the some basis vectors.
62
CA 02842681 2014-01-21
WO 2013/013229
PCT/US2012/047766
A pulse height distribution ("PHD") can be derived from particles of unknown
size flowing along different trajectories through a non-uniform light field of
a single-
particle optical sizing device for sizing particles in a fluid suspension can
be
deconvoluted by setting up a matrix having a plurality of columns. Each column
includes a basis vector comprising a pulse height distribution of particles of
a
substantially known size corresponding to the response of a photo-detector of
the
device to the particles of known size, and each successive column contains a
basis
vector for particles of successively larger sizes. The matrix can also include
a like
plurality of rows, each corresponding to a successive pulse height channel,
each
channel including a range of pulse heights, successive rows corresponding to
successively larger pulse heights, each column having a maximum count pulse
height
value at a location for a row which relates to a pulse height corresponding to
the
particle of known size associates with the column. The maximum count pulse
height
values for successive columns can be arranged on a diagonal of the matrix. A
successive subtraction algorithm can be implemented, by starting with the
basis vector
with its maximum count value in the largest row number; scaling a column basis
vector by a factor corresponding to the value of the row in the PHD that
matches the
column number; subtracting the scaled basis vector from the PHD to form an
element
of a deconvoluted PHD (dPHD), leaving an intermediate PHD vector with a
smaller
number of total particles; and repeating this process using the remaining
basis vectors
until the entire PHD has been consumed and all the elements of the
deconvoluted
dPHD have been formed.
A single-particle optical sizing sensor for sizing particles in a relatively
concentrated fluid suspension sample for turbidity of the suspension sample
can be
compensated using a sensor operating on a light extinction principle whereby a
photo-
detector produces signal V(t) having a baseline voltage level and a response
to
blockage of light by a particle as a downwardly extending pulse from the
baseline
voltage level. The compensation method involves passing a non-turbid
suspension
through the sensor; measuring a baseline voltage level Vo produced in response
to the
non-turbid suspension; passing the relatively concentrated suspension sample
through
the sensor; measuring a baseline voltage Vol' produced in response to the
relatively
concentrated suspension sample, calculating the ratio VoVoT; and adjusting the
sensor
in response to G to compensate for the turbidity when the relatively
concentrated
suspension sample passes through the sensor.
63
CA 02842681 2014-01-21
WO 2013/013229
PCT/US2012/047766
The baseline voltage Voir can effectively be subtracted from the signal VLE(0,
the remaining signal can be inverted to produce a pulse height signal 2
VLET(t), and an
adjustable gain amplifying means can be used to amplify the pulse height
signal 3
Vi,E1(t). The adjustable gain amplifying means can be controlled by the ratio
G to
provide a compensated pulse height signal AVLfio.
The signal Vu(t) produced by the sensor in response to the relatively
concentrated suspension sample can be amplified by adjustable gain amplifier
means,
the gain of which is controlled by the ratio G to provide a compensated signal
VLE(t)
having a compensated baseline voltage Vo, subtracting the baseline voltage Vo
from
the compensated signal VLE(t), and inverting the remaining signal to produce
compensated pulse height signal AVLL(0.
In one embodiment, the single-particle optical sizing sensor comprises a light
source producing a light beam of adjustable intensity, wherein the intensity
is
increased in response to the ratio G to compensate for the turbidity.
Particles in a fluid suspension can also be optically sized by establishing a
flow of the suspension through a physically well-defined measurement flow
channel
of a single-particle optical sizing sensor apparatus wherein a beam of light,
having an
axis, is directed through the measurement flow channel to form an optical
sensing
zone within the measurement flow channel. The beam of light and the optical
sensing
zone are ideally of such size relative to the size of the measurement flow
channel that
the sensor apparatus responds to only a fraction of the total number of
particles
flowing through the measurement flow channel. The sensor apparatus can respond
effectively to a relatively concentrated fluid suspension. The beam can have a
maximum intensity portion in the beam and a continuum of lesser intensities
for
positions in the beam spaced transversely from the axis, whereby some of the
particles
have a trajectory through the maximum intensity portion, others of the
particles have
trajectories through the lesser intensity positions, and still others of the
particles may
have trajectories outside the zone. Light from the zone can be detected to
provide
pulse height signals, each responsive to a particle flowing through the zone.
The
pulse height signals are functions of the sizes and trajectories of detected
particles,
and the pulse height signals collectively form a pulse height distribution
PHD. The
PDH can be mathematically deconvoluted and processed to extract from the PHD a
particle size distribution PSD of the particles in the fluid suspension.
64
CA 02842681 2014-01-21
WO 2013/013229
PCT/US2012/047766
The step of mathematically deconvoluting the PHD can involve determining
the value of at least one empirical basis vector by measuring the response to
particles
of known size flowing through the single-particle optical sizing device. Other
basis
vectors corresponding to particles of other sizes can be computed by
interpolating
and/or extrapolating the other basis vectors from the empirical basis vector.
The value of additional empirical basis vectors for particles of known sizes
flowing through the single-particle optical sizing device can be determined;
and the
other basis vectors for the matrix corresponding to particles of other sizes
can be
calculated by interpolating and/or extrapolating the other basis vectors from
at least
one empirical basis vector and the additional empirical basis vectors. The
method can
further involve determining the value of at least one computed basis vector
corresponding to particles of at least one size. Other basis vectors
corresponding to
particles of other sizes can also be computed by interpolating and/or
extrapolating the
other basis vectors from computed basis vectors.
The step of deconvoluting and processing the PHD can involve setting up a
matrix having a plurality of columns, each containing a basis vector
comprising a
pulse height distribution of particles of a known size corresponding to the
response of
a photo-detector of the device to the particles of known size, each successive
column
containing a basis vector for particles of successively larger sizes. The
matrix can
also have a like plurality of rows, each corresponding to a successive pulse
height
channel, each channel including a range of pulse heights, successive rows
corresponding to successively larger pulse heights, each column having a
maximum
count pulse height value at a location for a row which relates to pulse
heights
corresponding to the particle of known size associated with the column. The
maximum count pulse height values for successive columns can be arranged on a
diagonal of the matrix. The matrix can be modified by setting all terms
corresponding
to pulse height values greater than the maximum count pulse height value in a
column
to zero. A deconvolution algorithm can be used to perform matrix inversion and
vector multiplication of the pulse height distribution and the inverted matrix
as
modified. The response of the photo-detector to the particles of known size
can be
developed empirically for some of the basis vectors by directing a flow of
particles of
the known size through the device and providing a response by the device to
the
particles of known size. The response to the photo-detector for the remaining
basis
CA 02842681 2014-01-21
WO 2013/013229
PCT/US2012/047766
vectors can be calculated by interpolating and/or extrapolating the response
for the
remaining basis vectors from the some of basis vectors.
The step of mathematically deconvoluting the PHD can also involve using a
deconvolution algorithm to provide a deconvoluted pulse height distribution
dPHD.
The method can further involve providing a calibration curve of the
relationship of
pulse height and diameter, and using the calibration curve to translate each
deconvoluted pulse height value in the dPHD into a unique particle diameter
associated with this pulse height value yielding a "raw" particle size
distribution in
PSD. The raw PSD can be converted into a final PSD by renormalizing the raw
PSD
by multiplying by the value 1/PHId, where PHId is the fraction of particles
actually
detected by the device for particles of each size.
II. Particles that can be Detected
Using the techniques described herein, various biological particles can be
detected. Cells are one type of biological particle that can be detected. The
method
can be used to determine the presence or absence of a specific type of cell in
a given
solution. For example, a sample of blood, urine, spinal fluid, and the like
can be
evaluated for the presence or absence of bacteria, fungi, viruses, and the
like. The
particle size, and, optionally, particle shape, can also provide information
about the
specific type of bacteria, fungi or virus.
Microparticles and Nanoparticles Suitable for Use in Focused Light
Scattering
In some embodiments, where the complex between an active agent and a
biological particle does not result in a change in particle size (i.e., no
particle
agglomeration or cell rupture), it may be necessary to conjugate the active
agent with
a microparticle (such as a nanoparticle, polystyrene bead, gold particle, and
the like).
Thus, when the agent forms a complex with the biological particle, the complex
increases the size of the biological particle by the size of the
microparticle, and this
increased particle size is measurable using the techniques described herein.
In one embodiment, the particles have a particle size in the range of between
about 0.1 and 10 pm, and ideally have a relatively consistent amount of active
agent
bound to them. That is, if all that is important is to determine that the
biological
66
CA 02842681 2014-01-21
WO 2013/013229
PCT/US2012/047766
particles bound to an active agent of interest, then one can simply incubate
the
biological particle with the conjugate, and look for the decrease in peak
corresponding
to the biological particle. This will confirm that a complex of the biological
particle
and the active agent was formed.
If there is an interest in quantifying how much of the biological particle was
present, then it may be important to use particles with a nearly uniform
particle size,
defined as having 90% or more of the particles within 5% of the mean particle
size,
more preferably around 99% uniformity or better. In addition to a uniform
particle
size, in some embodiments, it may be desirable to have uniform substitution on
the
particles themselves. That is, rather than having particles of a relatively
uniform
particle size form complexes of different particle sizes with the biological
particle of
interest, it may be desirable to form complexes with a relatively uniform
particle size,
to ease their quantification.
One way to produce particles with a relatively constant particle size, and
with
a relatively consistent amount of active agent conjugated to the particles, is
to use
dendrimers. The dendrimers can include a known quantity of the active agent,
by
virtue of the active functional groups at the terminus on the dendrimers.
Another way is to produce polymer particles with: a) a relatively narrow size
distribution, and b) a relatively consistent amount of protected functional
groups, so
that after the polymers are produced, the protecting groups can be removed,
and the
functional groups used to conjugate the polymer particles to an active agent.
The active agent can be conjugated with the particle in such a way that the
portion of the active agent that is known to be active (i.e., binds a
receptor) is not
significantly sterically hindered by its conjugation with the particle. In
some
embodiments, this will involve preparing an analogue of the active agent which
includes a further functional group which can be attached to the particle.
In one embodiment, metallic particles, such as gold particles, are used.
Because these particles scatter a significant amount of light, they can be
conjugated
with a specific active agent, and used to identify even small molecules that
bind to the
agent. That is, the amount of light that the particle scatters is sufficiently
large that
the binding of the agent to the molecule of interest can be measured, even
though the
67
CA 02842681 2014-01-21
WO 2013/013229
PCT/US2012/047766
molecule is not within the size range of biological particles that can be
measured.
Means for conjugating active agents to metallic particles are known to those
of skill in
the art.
Metallic particles, such as gold particles, can also be used. These can be
conjugated with active agents using known methodology to form particles
capable of
forming a complex with a biological particle, including particles too small to
detect
using focused light scattering techniques. Because the particles are highly
dense, they
produce enough light scattering to be detected, despite their small size.
Binding of
even a small molecule to the particles can be detected because of the intense
scattering from the metallic bead so that enough light is scattered for the
complex
formation to be measured.
IV. Methods for Detecting the Presence or Absence of Specific Particles in a
Solution
A sample medium can be evaluated for the presence or absence of specific
particles. For example. a sample of blood, urine, spinal fluid, amniotic
fluid, pleural
fluid, peritoneal fluid and the like, can be evaluated for the presence or
absence of
specific microbes (cells (lymphocytes, B-cells, T-cells, neutrophils,
monocytes, and
the like), bacteria, fungi, viruses, and the like), and/or for the presence of
relatively
high concentrations of white blood cells or other biological particles
indicative of a
disease state. The methods also permit one to determine presence or absence of
shed
particles.
The particle (intact cell, microparticle, bacteria, virus, fungus, and the
like)
can be further identified and characterized by addition of probe particles
that are
coated with a specific agent that recognizes and binds to the specific surface
epitope
on the unknown particle surface. If the recognition and binding of the probe
particle
occurs, a new particle size will be created and appear, thus identifying the
unknown
particle. For example if the unknown particle was a stem cell and the probe
particle
was labled with an anti-CD34 antibody, binding of the probe particle with the
stem
cell would occur and a new sized particle would appear that would identify the
presence of CD34 positive stem cells.
68
CA 02842681 2014-01-21
WO 2013/013229
PCT/US2012/047766
Once the particles are identified by size, one can confirm the identity of the
particles, for example, by using a reference library correlating the particle
size to a
given biological species. Thus, in one embodiment, the method involves
comparing
information obtained on a biological particle using focused light scattering
techniques, with a library of data on biological particles obtained using
similar
focused light scattering techniques. The library can include information on
two or
more biological particles, preferably, ten or more particles, more preferably,
one
hundred or more particles, and, most preferably, more than a thousand
particles.
After a preliminary identification has been made on the type of biological
particle, other biological techniques can optionally be used to confirm the
identity of
the particle. For example, an EQELS spectra of the particle can be taken, and
compared to a library of EQELS spectra of known particles, to confirm the
identity of
the particle.
Antibodies or other molecules specific for the specific biological particle
can
be added to the solution, and if the particles bind to the antibodies, the
method will
detect the absence of the particles. Ideally, the molecules will be conjugated
with a
microparticle or nanoparticle, such as a latex particle. As the conjugate
interacts with
a biological particle, peaks representing the particle and the conjugate will
decrease,
and peaks corresponding to the complex of the particle and the conjugate will
increase.
In one embodiment, the biological particle is a microbe. The technique can be
used to identify the type of microbe (i.e., bacteria, fungi, or virus), and,
ideally, the
specific class of microbe (i.e., Pneumonia, Clostridia, and the like). In
this
embodiment, once a preliminary identification of the microbe is made, a
confirmation
assay can be conducted by first taking an EQELS spectra of the microbe in
solution,
subjecting the microbe to an antibody specific for the microbe, and taking a
second
EQELS spectra. If the EQELS spectra are different, this provides confirmation
that
the microbe was properly identified and was bound by the antibody. Further,
once a
microbe has been identified, a putative antimicrobial compound can be put in
solution/suspension along with the microbe, to determine whether it is able to
kill the
microbe.
69
CA 02842681 2014-01-21
WO 2013/013229
PCT/US2012/047766
In one embodiment, the methods can be used to identify a potential therapeutic
agent capable of interacting with a known cell, such as a cancer cell,
bacteria, fungi,
or virus. In this embodiment, one first uses focused light scattering
techniques to
generate a spectrum showing the particle size and distribution for the known
cancer
cell, bacteria, fungi, or virus in a sample medium. Then, a putative
therapeutic agent
conjugated to a microparticle or nanoparticle is added to the sample medium
and
allowed to incubate with the known cell, microbe or virus. A second spectrum
is
generated using focused light scattering techniques. If peaks corresponding to
a
complex of the microparticle-conjugated therapeutic agent and the known cell
or
microbe are observed, then the therapeutic agent has bound to the cell. This
is
indicative of the potential utility of the putative therapeutic agent against
the known
cell, microbe or virus.
In one aspect of this embodiment, spectra of a microbe in a sample medium
are compared with a reference database of spectra of known microbes, thus
providing
a rapid means for identifying a particular microbe. The spectra can also
provide an
initial determination of particle size and/or particle density in the medium.
Bacterial detection
In one example of identifying microbes, one can determine whether the
microbes are mono-dispersed or poly-dispersed by their number and size. Since
E.
coli tend to mono-disperse and Streptococcus tend to poly-disperse, this
embodiment
can be used to observe particle size in a sample, where observation of
clumping
identifies presence bacteria known to clump (i.e. Streptococcus).
Detection of Particle Shedding:
In another embodiment, the method is used to detect particle shedding.
Representative biological particles which shed smaller particles include
tumors, red
blood cells, white blood cells, granulocytes, platelets, monocytes,
neutrophils,
lymphocytes, endothelial cells, cancer cells, stem cells, bacteria, viruses,
and fungi.
Particle shedding may result from cell interactions, a change of cellular
state such as
activation or deactivation, as a result of expression, cell death, etc. The
methods
described herein can be used to identify such particle shedding.
CA 02842681 2014-01-21
WO 2013/013229
PCT/US2012/047766
In one embodiment, a drug or ligand is added to a vessel with a cell. Where
the drug or ligand reacts with the cell, the cell may shed membrane particles
or other
particles. As described in detail herein, the method can be used to detect the
size,
number and/or type of particles shed by the reaction. Therefore, where the
cell is
known, this technique may be used to detect efficacy of unknown drug agent;
and
where the drug is known, the technique may be used to identify the presence of
a
specific cell type.
The ejected particles can be observed using the methods described herein.
The ejected particles can similarly be characterized by comparing the size
and/or
shape with a library of data collected using focused light scattering
techniques on
known ejected particles, and/or by binding some or all of the ejected
particles to an
antibody or other such molecule.
V. Detection of Microparticles Ejected from Cells
In another embodiment, the ISADe device can be used to detect particle
shedding. Representative biological particles which shed smaller particles
include
tumors, red blood cells. white blood cells, granulocytes, platelets,
monocytes,
neutrophils, lymphocytes, endothelial cells, cancer cells, stem cells,
bacteria, viruses,
and fungi. Particle shedding may result from cell interactions, a change of
cellular
state such as activation or deactivation, as a result of expression, cell
death, etc. The
methods described herein can be used to identify such particle shedding.
In one embodiment, a drug or ligand is added to a vessel with a cell. Where
the drug or ligand reacts with the cell, the cell may shed membrane particles
or other
particles. As described in detail herein, the method can be used to detect the
size,
number and/or type of particles shed by the reaction. Therefore, where the
cell is
known, this technique may be used to detect efficacy of unknown drug agent;
and
where the drug is known, the technique may be used to identify the presence of
a
specific cell type.
The ejected particles can be observed using the devices and methods described
herein. The ejected particles can similarly be characterized by comparing the
size
and/or shape with a library of data collected using focused light scattering
techniques
71
CA 02842681 2014-01-21
WO 2013/013229
PCT/US2012/047766
on known ejected particles, and/or by binding some or all of the ejected
particles to an
antibody or other such molecule.
The ISADe device described above can be used to identify particles in the
given size range (i.e., the size of the ejected (shed) microparticles and the
size of the
platelets). As shown in Figure 6, a sample composed of 6 differently-sized
polystyrene beads was introduced to the device, and assessed using the device
in
terms of particle count (number) by particle size (m). The chart
shows the
remarkable resolution of very small particle sizes. Current flow cytometers
are not
capable of resolution to this degree.
Figure 7 is a chart showing similar data from the data shown in Figure 6. The
data in Figure 7 is presented as points rather than as histograms, and is
reflected in
particles per 10 ml sample, versus particle size (m). Also, Figure 7 separates
the size
distribution is separated into 3 different windows. In this embodiment. each
window
has a separate detector that has been adjusted to detect particles in a
specific size
range. The smallest particles are assessed from scatted light focused onto a
high-gain
detector, the middle window from scattered light focused onto a low gain
detector,
and the window with the largest particles by a light extinction method.
Detecting Individual Molecules
In one embodiment, the methods permit one to detect the presence of specific
molecules, where the molecules are of a size below the threshold limit of
detection for
focused light scattering techniques. In this embodiment, highly reflective
metallic
particles, such as gold particles, are covalently linked to a ligand that
binds to the
molecules of interest. Because the metallic particles are dense and highly
efficient
light scattering particles, the amount of light scattering when the ligand
binds to a
molecule of interest can be measured using the focused light scattering
technique,
thus confirming the presence or absence of a molecule of interest in the
solution. In
another embodiment, microparticles conjugated to an active agent known to bind
in a
specific manner to a particular secies of shed particles are used, rather than
metallic
particles. The complex of the shed particle and the microparticle is then
measured.
Representative agents include antibodies and small molecules known to bind to
the
particular shed particles.
72
CA 02842681 2014-01-21
WO 2013/013229
PCT/US2012/047766
Detection of Particle Aggregation
In another embodiment, the method is used to determine particle aggregation
and types of aggregation. Such aggregation may include, but is not limited to
aggregation of a particle with other particles, or aggregation of a particle
with a drug.
Particularly with respect to liposomal therapy, agglomeration of particles
(such as liposomes) can result in significant mortality or morbidity when the
agglomerated particles are administered. Accordingly, the method can be used
to
evaluate a sample of liposomes before administration to ensure that the
particles have
not agglomerated before a patient is treated.
VI. Methods for Detecting Binding of a Particle to a Known Molecule
In some embodiments, one knows the identity of a known molecule, for
example, a drug molecule that is known to interact with the receptor on a
biological
particle that may or may not be present in the sample medium. By incubating
the
sample medium with a conjugate of the drug molecule and a microparticle, one
can
look for complex formation indicative of the binding of the drug molecule with
biological particles in the sample medium. The complex formation can be
observed
over time, or simply after a suitable incubation period.
The methods can be performed by using, as a starting material, either a drug
or
a biological microparticle in a vessel, and then adding a known material
(either a
known cell or microbe, for example) to test for interaction with drug; or a
known drug
to test for interaction with microparticle). Then, focused light scattering
techniques
can be performed to look for change in particle size from size of starting
material,
where an increase or decrease in particle size is indicative of interaction
and binding.
In order to preserve the ability of the known molecule to bind to the particle
of
interest, in those embodiments where a molecule is conjugated to a
microparticle, it is
conjugated in a way that does not adversely impact its ability to bind to the
particle of
interest. This may involve developing a modified molecule, wherein the
molecule is
modified to include a functional group capable of being conjugated to the
microparticle, such that the molecule still maintains its ability to form a
complex with
the particle of interest. Such modifications are routine in the art.
73
CA 02842681 2014-01-21
WO 2013/013229
PCT/US2012/047766
By using a biological particle known to form a complex with the active agent,
one can evaluate such modified compounds for their ability to maintain their
binding
affinity for the particle of interest by incubating the modified compound, or
the
conjugate of the compound with the microparticle with the particle. Those
compounds which maintain the ability to bind the particle of interest can be
identified
using focused light scattering techniques, because the particle size of the
complex is
larger than the particle size of the non-complexed particle and non-complexed
conjugate.
Column-Based Approaches to Removing Biological Particles
Rather than forming a complex of the biological particle and a conjugate of an
active agent and a microparticle, one can optionally prepare a column
including
microparticles conjugated to agents that bind to the biological particle of
interest, and
pass the sample medium through a column including the microparticles. The
sample,
minus any complexed biological particles, will elute from the column. By
performing
the focused light scattering method on the eluted material, one can identify
changes in
particle number/population density. as compared to the starting material. A
decrease
in particle number/population density is indicative of interaction and binding
in the
column, and, therefore, an indication that the biological particle of interest
was
present in the sample.
Magnetic Bead-Based Approaches to Remove Biological Particles
Rather than forming a complex of the biological particle and a conjugate of an
active agent and a microparticle, and using focused light scattering methods
to
identify the presence of the complex between the biological particle and the
conjugate, one can optionally use a magnetic microparticle conjugated to the
active
agent. Thus, one can first obtain a focused light scattering spectra using the
methods
described herein, then use magnetic particles to complex with the biological
particle
of interest. The complex can be removed from the sample media using a magnet.
Then, one can obtain a second focused light scattering spectra, and identify
whether
the number of biological particles of interest has been reduced.
VII. Methods for Determining Binding of a Known Particle to an Unknown
Compound
74
CA 02842681 2014-01-21
WO 2013/013229
PCT/US2012/047766
In other embodiments, it is desired to learn whether a putative therapeutic
agent can bind to known biological particles. In these embodiments, putative
therapeutic agents are conjugated to a microparticle or metallic nanoparticle,
such as a
gold nanoparticle, and incubated with the known biological particles. Thus,
one can
determine whether a compound forms a complex with the biological particles.
In some aspects of this embodiment, it is desirable to know the minimum
inhibitory concentration, or binding affinity, of an active agent. The agent
can be
complexed with the biological particle at differing concentrations, and this
information can be obtained. Some degree of extrapolation may be required,
since the
agent is conjugated to a microparticle, and therefore may behave differently
than the
native drug.
In other aspects of this embodiment, it is desired to know the selectivity of
an
active agent for one receptor over another. In this aspect, the agent can be
complexed
with a plurality of biological particles expressing differing receptors, and
binding
information can be obtained for each of the receptors. Thus, selectivity can
be
determined.
Determining Therapeutic Activity/Efficacy/Selectivity
In another embodiment, the method is used to identify therapeutic agents.
While small molecules, proteins and peptides are not likely to be large enough
to see,
even with this technique, they can either be coupled to a microparticle, such
as a latex
particle or magnetic bead, which can be incubated with the molecules, or
placed on a
column.
In one aspect of this embodiment, a biological particle with a target for the
therapeutic agent (i.e., a receptor) is placed in suspension, and
microparticles
conjugated to one or more putative therapeutic agents are added to the
suspension.
If the therapeutic agent binds to the biological particle, the binding can be
observed because the size of the complex of the biological particle and the
conjugate
is greater than that of the conjugate or the biological particle.
CA 02842681 2014-01-21
WO 2013/013229
PCT/US2012/047766
This technique can be used, for example, to determine the efficacy of specific
antibacterial or other drug candidates for a particular infection, or to
identify agents
useful for treating specific types of cancer. In one aspect of this
embodiment, the
techniques are useful for personalized medicine, where a particular patient's
bacterial
infection, platelet or cancer cells, or erythrocytes, are analyzed for their
ability to bind
to and interact with specific therapeutic agents. In another aspect of this
embodiment,
one can generate a plurality of spectra and compare the results, to determine
minimum
inhibitory concentrations and, therefore, useful dosage ranges for a given
drug (where
the drug is an inhibitor).
VIII. Methods for Identifying Patients Likely to Benefit from Treatment
Certain patients respond to therapy due to an interaction of a cellular
receptor
with a drug molecule. However, certain other patients have genetic mutations
which
do not permit the patients cells to bind to the drug molecule, thus rendering
the drug
ineffective. To determine whether a patient will respond to a given therapy, a
solution
of the patient's cells can be combined with a drug molecule of interest, where
the
molecule is bound to a probe particle, which can be a microparticle or
nanoparticle. If
the drug molecule of interest binds to the patient's cells, then the
concentration of the
conjugate, and/or the patient's cells will be lower, and a new peak
corresponding to
the complex of the cells and the conjugate will be observed. The absence of a
new
peak corresponding to the complex of the cells and the conjugate is indicative
that the
patient will not respond to the particular drug therapy. Thus, the method can
confirm
that the patient will or will not achieve a benefit using the particular drug
therapy.
This enables a personalized medicine approach using rapid and inexpensive
methods.
In one aspect of this embodiment, the cells are cancer cells from an
individual
patient, and sample media containing the cancer cells are incubated with a
series of
therapeutic agents bound to a microparticle or nanoparticle. Those therapeutic
agents
that form a complex with the cancer cells are potential candidates for
personalized
treatment of the patient, since they bind to and interact with the cancer
cells. This
technique can provide a relatively quick and inexpensive method for
identifying
patients who have certain mutations, such as HER2 positive patients, patients
whose
cancer cells have vitamin D receptors, patients with estrogen-responsive
cancer cells,
and the like.
76
CA 02842681 2014-01-21
WO 2013/013229
PCT/US2012/047766
In another aspect of this embodiment, the cells are blood cells from a patient
suffering from atherosclerosis, and who is being evaluated to see if his blood
cells
will respond to treatment with clopridogrel bisulfate (Plavix ). The
interaction with
the blood cells and clopidogrel bisulfate is a surface interaction, but a
small
percentage of patients have a mutation in their blood cells that inhibits the
surface
interaction with this compound. For most of those patients, there is an
alternative
therapeutic agent, but it is important to identify those patients before the
symptoms
worsen. possibly leading to a heart attack. In this aspect, blood cells of a
patient are
incubated with microparticles conjugated to clopidogrel bisulfate, and a
spectrum is
obtained using focused light scattering techniques. For example interaction of
the
probe particle can be between the ADP receptor and Plavix target, P2Y12 or to
the
activation of the of VASP pathway. The presence of a complex between the
clopidogrel bisulfate and the blood cells can be observed. Further, if the
patient is
responsive to Plavix, no activation will occur when ADP or other specific
agonists are
added to the patient's platelets. Thus, no activation will occur and specific
activation
epitopes, like CD62, dycoprotein a1pha2, beta3, etc., will be detected by
specific
probe particles. Because the size of blood cells and the
microparticle/clopidogrel
bisulfate conjugate are known, only one spectrum needs to be obtained, and the
only
peak of interest is the peak corresponding to the complex of the conjugate
with the
blood cells.
IX. Methods for Performing High Throughput Bioassays
Any and all of these assays can be optimized for high throughput screening
using suitable robotics. Liquid handlers can transfer samples to a multi-tube
or multi-
well plate, and a "memory map" can be used to correlate the samples to their
location
on the plate. Information on each sample can then be stored, and used to
provide
information about drug candidates, patient diagnoses, and proposed patient
treatment
options.
Robotics systems are known in the art, and can be used to move samples taken
from individual patients to known positions in a multi-tube or multi-well
plate. Once
information on the sample is obtained using the focused light scattering
techniques
described herein, the information can be correlated to the individual patient
via the
stored information correlating the location of the tube and the patient
identification.
77
CA 02842681 2014-01-21
WO 2013/013229
PCT/US2012/047766
Liquid handlers can take portions of the sample and evaluate a plurality
(i.e., at least
two) of different screening assays, for example, by incubating portions of the
sample
with different microparticles, bound to different active agents.
Automated processes using known robotics can be used to pull and place
samples (like high throughput screening) with use of a "memory map". A user
can
then pick desired screens to be run and the robotic apparatus will implement
desired
processes.
In another aspect of the embodiments described herein, the methods can be
automated using robotics to pull and place samples (analogous to conventional
high
throughput screening methods), optionally in conjunction with a "memory map".
A
user can then pick desired screens to be performed, and the robotic apparatus
can
implement the desired processes. In this embodiment, a laboratory can be set
up to
automatically screen numerous samples.
In a preferred embodiment, the personalized medicine processes described
herein are automated, to provide relatively inexpensive, and relatively fast,
high
throughput screening methods to identify preferred therapies for patients
suffering
from disease.
X. Reference Libraries
A reference database of information gained by performing focused light
scattering on known compounds can be used. One can compare the sample to the
reference database in order to identify or characterize the particles in the
tested
sample. A reference database includes at least two, preferably more than ten,
more
preferably greater than a hundred, and most preferably, greater than a
thousand bits of
information on particle size that can be used to correlate the particle size
measured
using the techniques described herein with particle sizes for known biological
particles that are stored in the reference database.
The present invention will be better understood with reference to the
following
non-limiting examples.
Example 1: Representative Focused Light Scattering Device
78
CA 02842681 2014-01-21
WO 2013/013229
PCT/US2012/047766
A representative focused light scattering device is shown in Figure 1. A first
laser (1) emits light at a first wavelength, and a second laser (2) emits
light at a second
wavelength. Both beams of light pass through a first beam splitter (3) and
through a
first focusing lens (4) before they enter into a flow cell (15). The flow cell
includes a
site (5) for hydrodynamic injection of the sample. As the platelets in the
flow cell
pass through the beams of light, the light is scattered as it hits the
platelets. The
scattered light passes through a circular spatial filter (6) and then through
a first
collimating lens (7). The light beam passes through a second beam splitter
(16),
which splits the light into two beams. A first beam passes through a second
focusing
lens (8) and through a first chromatic filter (9) that passes scattered light
from the first
laser (1) through a first detector (10). The second beam passes through a
second
collimating lens (11), a third focusing lens (12) and a second chromatic
filter (13) that
passes scattered light from the second laser (2) to a second detector (14).
The two photodetectors (10 and 14) each are able to detect light at a certain
frequency, so that light transmitted at different frequencies (as a result of
the two
lasers hitting particles, and which may interact with fluorescent tags on the
particles)
can be separately determined.
A third detector (an extinction detector) (18) receives a portion of the light
passing through the flow cell. A portion of the light passing through the flow
cell is
reflected off of a movable mirror (17) and onto the third detector.
Example 2: Detection of Microparticle's (MP) present in a biological sample.
In this example, a specimen is subject to particle sizing and counting. After
an
appropriate dilution of the sample, the diluted specimen is introduced into
the device
for analysis. As counting proceeds, counts will accumulate in the size region
less that
1 micron. The appearance of MP in this size region will indicate the presence
of MPs.
Example 3: Microparticle Characterization
Once MPs are detected, as described in Example 2, it may be important to
determine the source of the MP (from platelets neutrophils, tumor cell, etc.).
This
Example provides two different options for characterizing the MP.
79
CA 02842681 2014-01-21
WO 2013/013229
PCT/US2012/047766
The first option is to use MP sizing and counts. In this case, the specimen is
incubated with a second particle with a specific ligand conjugated to its
surface. The
choice of the ligand will depend on the specific MP be characterized. For
example, if
the MP of interest has coagulation tissue factor (TF) on its surface, the
conjugated
particle can be conjugated with an antibody against TF-particle or with
coagulation
factor FVII. Either ligand will specifically bind to MPs with TF on their
surfaces.
When the conjugated particles are incubated with the anti-TF conjugated
particles, a new size corresponding to the TF-MP+anti-TF-particles will appear
when
the MP and the probe particle are counted. In a like manner, other MPs can be
characterized by developing probe particles with a conjugated ligand specific
for the
MP of interest.
The second option is to use an EQELS device to analyze the MPs. The basic
procedure is the same, except that differences in the particles
electrophoretic mobility
can be analyzed.
Specifically, a baseline electrophoretic mobility of the MP can be obtained.
The MP will then be mixed with the probe particle that is conjugated with the
specific
ligand for the MP of interest, or just with the ligand without conjugation to
a probe
particle. When the probe particle binds to the MP of interest, a difference in
the
electrophoretic mobility is observed. These data will provide a specific
identification
of the MP. If the ligand alone was used to bind to the MP, the EQELS data, in
addition to IP of the particle, will also provide binding constants for the
ligand to the
MP.
Example 4: Determination of Cellular Activation
In this Example, the cellular activation, such as platelet activation, is
determined. A baseline resting platelet run on the sizing-counting device is
determined. The platelet or cell is then activated using appropriate agonists.
Once
activation occurs, new surface epitopes appear on the surface. In the case of
the
platelet DC62, CD41, various integrins, and the like, begin to appear.
A probe particle with a ligand for the specific epitope of interest is then
added
to the activated platelets (or other cells). The ligand can be an antibody, or
small
molecule, that specifically binds to the activated epitope. When binding
occurs, a
particle is created (the activated cell + the probe particle) which has a
larger size than
CA 02842681 2014-01-21
WO 2013/013229
PCT/US2012/047766
either the activated cell or the probe particle. The appearance of these new
particles
represents the appearance of the activated platelet + the bound probe
particle.
Example 5: Microbe identification.
In this Example, microbes are identified using the techniques described
herein.
The microbe may be bacterial, viral, fungal, or protozoa. A sample containing
a
microbe is analyzed using the counting/sizing device described herein. The
sample
can be from a water supply, from a patient (human or animal), or other source.
The
size distribution will be determined, and compared to a database, to determine
whether one or more of the particles in the sample fall into any of the sizes
typical for
known microbes. If so, a probe particle conjugated with a ligand that
specifically
binds to certain microbes can be added. The identity of the microbe is
confirmed
when a new size distribution is obtained when the sample is incubated with the
probe
particle.
Additional verification can be obtained if the specimen is examined by
EQELS, where a swim rate is determined for flagellated organisms using the
velocimetry mode of the EQELS device. The EQELS device can also determine the
microbe's electrophoretic mobility. This information can be compared with data
in an
EQELS database for further confirmation of the identity of the particle.
If indicated, EQELS will then be used to help determine the appropriate
antimicrobial (antibiotic, antiviral, etc) agent. A know concentration of
antimicrobial
agent will be added to the specimen. Binding of the agent to the microbe will
be
determined by a change in the microbe's electrophoretic mobility. Further, if
the drug
kills the microbe, its surface charge density changes resulting in a rather
large change
in the killed microbe's electrophoretic mobility.
Example 6: Drug Efficacy: Effectiveness of Cell Inhibition.
Specific example of Aspirin or/and P2Y12 inhibition of platelet activation
Platelet inhibition in arterial thrombophilic diseases is considered the
standard
of care. Unfortunately, in some patients, conventional drugs do not inhibit
the
patient's platelets. Approximately 25% of ASA-treated and 29% of Plavix-
treated
patients do not respond to treatment. Currently, there is no accepted assay to
identify
the resistant/refractory patients.
81
CA 02842681 2014-01-21
WO 2013/013229
PCT/US2012/047766
The assay described herein can use particle sizing, based on the following
concept, to identify resistant/refractory patients. The goal of treatment with
anti-
platelet drugs is to inhibit activation. When the platelet is activated, new
surface
epitopes appear. So, in this embodiment, the patient's platelets are first
obtained as
platelet rich plasma (PRP). A baseline measurement of the particle size and/or
distribution is then made. Next, an aliquot of the patient PRP can be mixed
with a
platelet activator (agonist). If the drug works, no activation occurs. If it
does not
work, the platelet will activate. The assay can then probe the platelet
surface for the
appearance of new epitopes like CD62, CD4l and the like. The surface can be
probed
with a ligand (antibody or otherwise) that is conjugated to a particle. If
binding
occurs, the probe particle will bind with the activated platelet, and a
particle with a
different (larger) particle size (i.e., the activated platelet+conjugated-
probe particle)
will appear. If the drug works, no change in the particle size distribution
will occur.
Example 7: Lipid Droplets as Drug Delivery Vehicles.
Certain sized particles do not perfuse capillaries well. Since a typical
capillary
is approximately 2-3 microns in diameter, particles larger that that size must
have a
surface to volume ratio that will permit the distortion of the particle so
that is can
enter the capillary system: similar to a red blood cell. In this Example,
particle sizing
is used to identify particles which fall into a range that will not be
perfused, and result
in potential malaise or death to the patient. Further, the surface
characteristics of
some particles lead to instability, that may cause particle aggregation or
fragmentation. Similar problems are well recognized in colloidal chemistry.
In this embodiment, drugs like Ambisomelm, DaunosomeTm, DoxilTm, or other
liposomal drug delivery vehicles, can be screened for a safe particle size
distribution
prior to infusion. The screen can identify particles by particle size and
distribution, so
if relatively large particles, corresponding to agglomerated liposomal or
other
particles are observed, then the sample can be rejected before being infused.
Alternatively, the sample can be subjected to conditions which de-agglomerate
the
particles (for example, ultrasound and the like), and the sample re-tested.
These
assays can also be used to optimize the solution, and particle surface
optimization for
identifying the best lead compound(s).
82
CA 02842681 2014-01-21
WO 2013/013229
PCT/US2012/047766
Example 8: Small Molecule Distribution Assays. Specific examples of vWF or
serum plasma.
vWF is a polydispersed molecule with a molecular weight distribution range
of 500,000 to 20 million or even higher. Thus, there is a substantial
difference in the
molecular size distribution. Current technology requires a minimum of several
days
to complete an analysis.
In this embodiment, gold beads are conjugated with an anti-vWF antibody in a
manner that would bind one bead to one vWF multimer. Since the mass density of
the gold bead results in more efficient light scattering, vWF molecules bound
to the
gold beads will be visible to the focused scattering sizing and counting
device. Thus,
the presence of, and in some embodiments, the amount of, vWF can be
determined.
Accordingly, although the invention has been described herein with reference
to various illustrative aspects, features and embodiments, it will be
recognized that the
invention is not thus limited, but rather extends to and encompasses other
variations,
modifications and alternative embodiments, such as will suggest themselves to
those
of ordinary skill in the art, based on the disclosure herein. The claims
hereafter set
forth therefore are intended to be broadly construed and interpreted as
including all
such variations, modifications and alternative embodiments within their spirit
and
scope.
83