Note: Descriptions are shown in the official language in which they were submitted.
CA 02849120 2014-03-18
WO 2013/055530
PCT/US2012/057777
DIAGNOSTIC METHYLATION MARKERS OF EPITHELIAL OR MESENCHYMAL PHENOTYPE AND
RESPONSE TO EGFR KINASE INHIBITOR IN TUMOURS OR TUMOUR CELLS
CROSS REFERENCE TO RELATED APPLICATIONS
[001] This application claims the benefit of U.S. Provisional Application
No. 61/542,141 filed
September 30, 2011, the disclosure of which is incorporated herein by
reference in its entirety.
FIELD OF THE INVENTION
[002] The present invention provides methods of predicting response to a
cancer therapy based
on gene methylation status.
BACKGROUND OF THE INVENTION
[003] The present invention is directed to methods for diagnosing and
treating cancer patients.
In particular, the present invention is directed to methods for determining
which patients will most
benefit from treatment with an epidermal growth factor receptor (EGFR) kinase
inhibitor.
[004] Cancer is a generic name for a wide range of cellular malignancies
characterized by
unregulated growth, lack of differentiation, and the ability to invade local
tissues and metastasize.
These neoplastic malignancies affect, with various degrees of prevalence,
every tissue and organ in
the body.
[005] A multitude of therapeutic agents have been developed over the past few
decades for the
treatment of various types of cancer. The most commonly used types of
anticancer agents include:
DNA-alkylating agents (e.g., cyclophosphamide, ifosfamide), antimetabolites
(e.g., methotrexate, a
folate antagonist, and 5-fluorouracil, a pyrimidine antagonist), microtubule
disrupters (e.g.,
vincristine, vinblastine, paclitaxel), DNA intercalators (e.g., doxorubicin,
daunomycin, cisplatin), and
hormone therapy (e.g., tamoxifen, flutamide).
[006] The epidermal growth factor receptor (EGFR) family comprises four
closely related receptors
(HER1/EGFR, HER2, HER3 and HER4) involved in cellular responses such as
differentiation and
proliferation. Over-expression of the EGFR kinase, or its ligand TGF-alpha, is
frequently associated
with many cancers, including breast, lung, colorectal, ovarian, renal cell,
bladder, head and neck
cancers, glioblastomas, and astrocytomas, and is believed to contribute to the
malignant growth of
these tumors. A specific deletion-mutation in the EGFR gene (EGFRvIII) has
also been found to
increase cellular tumorigenicity. Activation of EGFR stimulated signaling
pathways promote multiple
processes that are potentially cancer-promoting, e.g. proliferation,
angiogenesis, cell motility and
invasion, decreased apoptosis and induction of drug resistance. Increased
HER1/EGFR expression is
frequently linked to advanced disease, metastases and poor prognosis. For
example, in NSCLC and
gastric cancer, increased HER1/EGFR expression has been shown to correlate
with a high metastatic
rate, poor tumor differentiation and increased tumor proliferation.
1
CA 02849120 2014-03-18
WO 2013/055530 PCT/US2012/057777
[007] Mutations which activate the receptor's intrinsic protein tyrosine
kinase activity and/or
increase downstream signaling have been observed in NSCLC and glioblastoma.
However the role of
mutations as a principle mechanism in conferring sensitivity to EGF receptor
inhibitors, for example
erlotinib (TARCEVA ) or gefitinib (IRESSATm), has been controversial.
Recently, a mutant form of
the full length EGF receptor has been reported to predict responsiveness to
the EGF receptor tyrosine
kinase inhibitor gefitinib (Paez, J. G. et al. (2004) Science 304:1497-1500;
Lynch, T. J. et al. (2004)
N. Engl. J. Med. 350:2129-2139). Cell culture studies have shown that cell
lines which express the
mutant form of the EGF receptor (i.e. H3255) were more sensitive to growth
inhibition by the EGF
receptor tyrosine kinase inhibitor gefitinib, and that much higher
concentrations of gefitinib was
required to inhibit the tumor cell lines expressing wild type EGF receptor.
These observations
suggests that specific mutant forms of the EGF receptor may reflect a greater
sensitivity to EGF
receptor inhibitors but do not identify a completely non-responsive phenotype.
[008] The development for use as anti-tumor agents of compounds that directly
inhibit the kinase
activity of the EGFR, as well as antibodies that reduce EGFR kinase activity
by blocking EGFR
activation, are areas of intense research effort (de Bono J.S. and Rowinsky,
E.K. (2002) Trends in
Mol. Medicine 8:S19-S26; Dancey, J. and Sausville, E.A. (2003) Nature Rev.
Drug Discovery 2:92-
313). Several studies have demonstrated, disclosed, or suggested that some
EGFR kinase inhibitors
might improve tumor cell or neoplasia killing when used in combination with
certain other anti-cancer
or chemotherapeutic agents or treatments (e.g. Herbst, R.S. et al. (2001)
Expert Opin. Biol. Ther.
1:719-732; Solomon, B. et al (2003) Int. J. Radiat. Oncol. Biol. Phys. 55:713-
723; Krishnan, S. et al.
(2003) Frontiers in Bioscience 8, el-13; Grunwald, V. and Hidalgo, M. (2003)
J. Nat. Cancer Inst.
95:851-867; Seymour L. (2003) Current Opin. Investig. Drugs 4(6):658-666;
Khalil, M.Y. et al.
(2003) Expert Rev. Anticancer Ther.3:367-380; Bulgaru, A.M. et al. (2003)
Expert Rev. Anticancer
Ther.3:269-279; Dancey, J. and Sausville, E.A. (2003) Nature Rev. Drug
Discovery 2:92-313;
Ciardiello, F. et al. (2000) Clin. Cancer Res. 6:2053-2063; and Patent
Publication No: US
2003/0157104).
[009] Erlotinib (e.g. erlotinib HC1, also known as TARCEVA or OSI-774) is an
orally available
inhibitor of EGFR kinase. In vitro, erlotinib has demonstrated substantial
inhibitory activity against
EGFR kinase in a number of human tumor cell lines, including colorectal and
breast cancer (Moyer
J.D. et al. (1997) Cancer Res. 57:4838), and preclinical evaluation has
demonstrated activity against a
number of EGFR-expressing human tumor xenografts (Pollack, V.A. et al (1999)
J. Pharmacol. Exp.
Ther. 291:739). More recently, erlotinib has demonstrated promising activity
in phase I and II trials in
a number of indications, including head and neck cancer (Soulieres, D., et al.
(2004) J. Clin. Oncol.
22:77), NSCLC (Perez-Soler R, et al. (2001) Proc. Am. Soc. Clin. Oncol.
20:310a, abstract 1235),
CRC (Oza, M., et al. (2003) Proc. Am. Soc. Clin. Oncol. 22:196a, abstract 785)
and MBC (Winer, E.,
et al. (2002) Breast Cancer Res. Treat. 76:5115a, abstract 445). In a phase
III trial, erlotinib
monotherapy significantly prolonged survival, delayed disease progression and
delayed worsening of
2
CA 02849120 2014-03-18
WO 2013/055530 PCT/US2012/057777
lung cancer-related symptoms in patients with advanced, treatment-refractory
NSCLC (Shepherd, F.
et al. (2004) J. Clin. Oncology, 22:14S (July 15 Supplement), Abstract 7022).
While much of the
clinical trial data for erlotinib relate to its use in NSCLC, preliminary
results from phase I/II studies
have demonstrated promising activity for erlotinib and capecitabine/erlotinib
combination therapy in
patients with wide range of human solid tumor types, including CRC (Oza, M.,
et al. (2003) Proc.
Am. Soc. Clin. Oncol. 22:196a, abstract 785) and MBC (Jones, R.J., et al.
(2003) Proc. Am. Soc. Clin.
Oncol. 22:45a, abstract 180). In November 2004 the U.S. Food and Drug
Administration (FDA)
approved erlotinib for the treatment of patients with locally advanced or
metastatic non-small cell
lung cancer (NSCLC) after failure of at least one prior chemotherapy regimen.
Erlotinib is the only
drug in the epidermal growth factor receptor (EGFR) class to demonstrate in a
Phase III clinical trial
an increase in survival in advanced NSCLC patients.
[010] An anti-neoplastic drug would ideally kill cancer cells selectively,
with a wide therapeutic
index relative to its toxicity towards non-malignant cells. It would also
retain its efficacy against
malignant cells, even after prolonged exposure to the drug. Unfortunately,
none of the current
chemotherapies possess such an ideal profile. Instead, most possess very
narrow therapeutic indexes.
Furthermore, cancerous cells exposed to slightly sub-lethal concentrations of
a chemotherapeutic
agent will very often develop resistance to such an agent, and quite often
cross-resistance to several
other antineoplastic agents as well. Additionally, for any given cancer type
one frequently cannot
predict which patient is likely to respond to a particular treatment, even
with newer gene-targeted
therapies, such as EGFR kinase inhibitors, thus necessitating considerable
trial and error, often at
considerable risk and discomfort to the patient, in order to find the most
effective therapy.
[011] Thus, there is a need for more efficacious treatment for neoplasia and
other proliferative
disorders, and for more effective means for determining which tumors will
respond to which
treatment. Strategies for enhancing the therapeutic efficacy of existing drugs
have involved changes in
the schedule for their administration, and also their use in combination with
other anticancer or
biochemical modulating agents. Combination therapy is well known as a method
that can result in
greater efficacy and diminished side effects relative to the use of the
therapeutically relevant dose of
each agent alone. In some cases, the efficacy of the drug combination is
additive (the efficacy of the
combination is approximately equal to the sum of the effects of each drug
alone), but in other cases
the effect is synergistic (the efficacy of the combination is greater than the
sum of the effects of each
drug given alone).
[012] Target-specific therapeutic approaches, such as erlotinib, are generally
associated with
reduced toxicity compared with conventional cytotoxic agents, and therefore
lend themselves to use in
combination regimens. Promising results have been observed in phase I/II
studies of erlotinib in
combination with bevacizumab (Mininberg, E.D., et al. (2003) Proc. Am. Soc.
Clin. Oncol. 22:627a,
abstract 2521) and gemcitabine (Dragovich, T., (2003) Proc. Am. Soc. Clin.
Oncol. 22:223a, abstract
895). Recent data in NSCLC phase III trials have shown that first-line
erlotinib or gefitinib in
3
CA 02849120 2014-03-18
WO 2013/055530 PCT/US2012/057777
combination with standard chemotherapy did not improve survival (Gatzemeier,
U., (2004) Proc. Am.
Soc. Clin. Oncol. 23:617 (Abstract 7010); Herbst, R.S., (2004) Proc. Am. Soc.
Clin. Oncol. 23:617
(Abstract 7011); Giaccone, G., et al. (2004) J. Clin. Oncol. 22:777; Herbst,
R., et al. (2004) J. Clin.
Oncol. 22:785). However, pancreatic cancer phase III trials have shown that
first-line erlotinib in
combination with gemcitabine did improve survival.
[013] Several groups have investigated potential biomarkers to predict a
patient's response to EGFR
inhibitors (see for example, WO 2004/063709, WO 2005/017493, WO 2004/111273,
WO
2004/071572; US 2005/0019785, and US 2004/0132097). One such biomarker is
epithelial and
mesenchymal phenotype. During most cancer metastases, an important change
occurs in a tumor cell
known as the epithelial-to-mesenchymal transition (EMT) (Thiery, J.P. (2002)
Nat. Rev. Cancer
2:442-454; Savagner, P. (2001) Bioessays 23:912-923; Kang Y. and Massague, J.
(2004) Cell
118:277-279; Julien-Grille, S., et al. Cancer Research 63:2172-2178; Bates,
R.C. et al. (2003)
Current Biology 13:1721-1727; Lu Z., et al. (2003) Cancer Cell. 4(6):499-
515)). Epithelial cells,
which are bound together tightly and exhibit polarity, give rise to
mesenchymal cells, which are held
together more loosely, exhibit a loss of polarity, and have the ability to
travel. These mesenchymal
cells can spread into tissues surrounding the original tumor, invade blood and
lymph vessels, and
travel to new locations where they divide and form additional tumors. EMT does
not occur in healthy
cells except during embryogenesis. Under normal circumstances TGF-I3 acts as a
growth inhibitor,
however, during cancer metastasis, TGF-I3 begins to promote EMT.
[014] Epithelial and mesenchymal phenotypes have been associated with
particular gene expression
patterns. For example, epithelial phenotype was shown in W02006101925 to be
associated with high
expression levels of E-cadherin, Brk, 7-catenin, a-catenin, keratin 8, keratin
18, connexin 31,
plakophilin 3, stratafin 1, laminin alpha-5 and ST14 whereas mesenchymal
phenotype was associated
with high expression levels of vimentin, fibronectin, fibrillin-1, fibrillin-
2, collagen alpha-2(IV),
collagen alpha-2(V), LOXL1, nidogen, Cllorf9, tenascin, N-cadherin, embryonal
EDB+ fibronectin,
tubulin alpha-3 and epimorphin.
[015] Epigenetics is the study of heritable changes in gene expression or
cellular phenotype caused
by mechanisms other than changes in the underlying DNA sequence ¨ hence the
name epi- (Greek:
over, above, outer) -genetics. Examples of such changes include DNA
methylation and histone
modifications, both of which serve to modulate gene expression without
altering the sequence of the
associated genes. These changes can be somatically heritable through cell
division for the remainder
of the life of the organism and may also be passed on to subsequent
generations of the organism.
However, there is no change in the underlying DNA sequence of the organism;
instead, non-genetic
factors cause the organism's genes to behave or express differently.
[016] DNA methylation is a crucial part of normal organismal development and
cellular
differentiation in higher organisms. DNA methylation stably alters the gene
expression pattern in
cells such that cells can "remember where they have been"; for example, cells
programmed to be
4
CA 02849120 2014-03-18
WO 2013/055530 PCT/US2012/057777
pancreatic islets during embryonic development remain pancreatic islets
throughout the life of the
organism without continuing signals telling them that they need to remain
islets. In addition, DNA
methylation suppresses the expression of viral genes and other deleterious
elements that have been
incorporated into the genome of the host over time. DNA methylation also forms
the basis of
chromatin structure, which enables cells to form the myriad characteristics
necessary for multicellular
life from a single immutable sequence of DNA. DNA methylation also plays a
crucial role in the
development of nearly all types of cancer. DNA methylation at the 5 position
of cytosine has the
specific effect of reducing gene expression and has been found in every
vertebrate examined. In adult
somatic tissues, DNA methylation typically occurs in a CpG dinucleotide
context while non-CpG
methylation is prevalent in embryonic stem cells.
[017] "CpG" is shorthand for "¨C¨phosphate¨G¨", that is, cytosine and guanine
separated by
only one phosphate; phosphate links any two nucleosides together in DNA. The
"CpG" notation is
used to distinguish this linear sequence from the CG base-pairing of cytosine
and guanine. Cytosines
in CpG dinucleotides can be methylated to form 5-methylcytosine (5-mC). In
mammals, methylating
the cytosine within a gene can turn the gene off Enzymes that add a methyl
group to DNA are called
DNA methyltransferases. In mammals, 70% to 80% of CpG cytosines are
methylated. There are
regions of the genome that have a higher concentration of CpG sites, known as
CpG islands. These
"CpG islands" also have a higher than expected GC content (i.e. >50%). Many
genes in mammalian
genomes have CpG islands associated with the start of the gene. Because of
this, the presence of a
CpG island is used to help in the prediction and annotation of genes. CpG
islands are refractory to
methylation, which may help maintain an open chromatin configuration. In
addition, this could result
in a reduced vulnerability to transition mutations and, as a consequence, a
higher equilibrium density
of CpGs surviving. Methylation of CpG sites within the promoters of genes can
lead to their
silencing, a feature found in a number of human cancers (for example the
silencing of tumor
suppressor genes). In contrast, the hypomethylation of CpG sites has been
associated with the over-
expression of oncogenes within cancer cells.
SUMMARY OF THE INVENTION
[018] One aspect of the invention provides for a method of determining whether
a tumor cell has an
epithelial phenotype comprising detecting the presence or absence of
methylation of DNA at any one
of the CpG sites identified in Table 2 or Table 4 in the tumor cell, wherein
the presence of
methylation at any of the CpG sites indicates that the tumor cell has an
epithelial phenotype. In
certain embodiments, the CpG sites are in the PCDH8, PEX5L, GALR1 or ZEB2
gene. In certain
embodiments, the tumor cell is a NSCLC cell.
[019] Another aspect of the invention provides for a method of determining
whether a tumor cell
has an epithelial phenotype comprising detecting the presence or absence of
methylation of DNA at
any one of the CpG sites identified in Table lor Table 3, wherein the absence
of methylation at any
CA 02849120 2014-03-18
WO 2013/055530 PCT/US2012/057777
of the CpG sites indicates that the tumor cell has an epithelial phenotype. In
certain embodiments, the
CpG sites are in the CLDN7, HOXC4, P2L3, TBCD, ESPR1, GRHL2, or C20orf55 gene.
In certain
embodiments, the tumor cell is a NSCLC cell.
[020] Another aspect of the invention provides for a method of determining the
sensitivity of tumor
growth to inhibition by an EGFR kinase inhibitor, comprising detecting the
presence or absence of
methylation of DNA at any one of the CpG sites identified in Table 2 or Table
4 in a sample tumor
cell, wherein the presence of DNA methylation at any one of the CpG sites
indicates that the tumor
growth is sensitive to inhibition with the EGFR inhibitor. In one embodiment,
the EGFR inhibitor is
erlotinib, cetuximab, or panitumumab. In certain embodiments, the tumor cell
is a NSCLC cell.
[021] Another aspect of the invention provides for a method of identifying a
cancer patient who is
likely to benefit from treatment with an EFGR inhibitor comprising detecting
the presence or absence
of methylation of DNA at any one of the CpG sites identified in Table 1 or
Table 3 in a sample from
the patient's cancer, wherein the patient is identified as being likely to
benefit from treatment with the
EGFR inhibitor if the absence of DNA methylation at any one of the CpG sites
is detected. In certain
embodiments, the CpG sites are in the CLDN7, HOXC4, P2L3, TBCD, ESPR1, GRHL2,
or C20orf55
gene. In certain embodiments, the EGFR inhibitor is erlotinib, cetuximab, or
panitumumab. In certain
embodiments, the cancer is NSCLC.
[022] Yet another aspect of the invention provides for a method of identifying
a cancer patient who
is likely to benefit from treatment with an EFGR inhibitor comprising
detecting the presence or
absence of methylation of DNA at any one of the CpG sites identified in Table
2 or Table 4 in a
sample from the patient's cancer, wherein the patient is identified as being
likely to benefit from
treatment with the EGFR inhibitor if the presence of DNA methylation at any
one of the CpG sites is
detected. In certain embodiments, the patient is administered a
therapeutically effective amount of an
EGFR inhibitor if the patient is identified as one who will likely benefit
from treatment with the
EGFR inhibitor. In certain embodiments, the EGFR inhibitor is erlotinib,
cetuximab, or panitumumab.
In certain embodiments, the cancer is NSCLC.
[023] Another aspect of the invention provides for a method of determining
whether a tumor cell
has a mesenchymal phenotype comprising detecting the presence or absence of
methylation of DNA
at any one of the CpG sites identified in Table 2 or Table 4 in the tumor
cell, wherein the absence of
methylation at any of the CpG sites indicates that the tumor cell has a
mesenchymal phenotype. In
certain embodiments, the CpG sites are in the PCDH8, PEX5L, GALR1 or ZEB2
gene. In certain
embodiments, the tumor cell is a NSCLC cell.
[024] Another aspect of the invention provides for a method of determining
whether a tumor cell
has a mesenchymal phenotype comprising detecting the presence or absence of
methylation of DNA
at any one of the CpG sites identified in Table 1 or Table 3, wherein the
presence of methylation at
6
CA 02849120 2014-03-18
WO 2013/055530 PCT/US2012/057777
any of CpG sites indicates that the tumor cell has a mesenchymal phenotype. In
certain embodiments,
the CpG sites are in the CLDN7, HOXC4, P2L3, TBCD, ESPR1, GRHL2, or C20orf55
gene. In
certain embodiments, the tumor cell is a NSCLC cell.
[025] Yet another aspect of the invention provides for a method of determining
the sensitivity of
tumor growth to inhibition by an EGFR kinase inhibitor, comprising detecting
the presence or absence
of methylation of DNA at any one of the CpG sites identified in Table 2 or
Table 4 in a sample tumor
cell, wherein the absence of DNA methylation at any one of the CpG sites
indicates that the tumor
growth is resistant to inhibition with the EGFR inhibitor. In certain
embodiments, the EGFR
inhibitor is erlotinib, cetuximab, or panitumumab. In certain embodiments, the
tumor cell is a NSCLC
cell.
[026] Another aspect of the invention provides for a method of determining the
sensitivity of tumor
growth to inhibition by an EGFR kinase inhibitor, comprising detecting the
presence or absence of
methylation of DNA at any one of the CpG sites identified in Table 1 or Table
3 in a sample tumor
cell, wherein the presence of DNA methylation at any one of the CpG sites
indicates that the tumor
growth is resistant to inhibition with the EGFR inhibitor, such as for
example, erlotinib, gefitinib,
lapatinib, cetuximab or panitumumab. In certain embodiments, the CpG sites are
in the CLDN7,
HOXC4, P2L3, TBCD, ESPR1, GRHL2, or C20orf55 gene. In certain embodiments, the
EGFR
inhibitor is erlotinib, cetuximab, or panitumumab. In certain embodiments, the
tumor cell is a NSCLC
cell.
[027] Another aspect of the invention provides for a method of treating a
cancer in a patient
comprising administering a therapeutically effective amount of an EGFR
inhibitor to the patient,
wherein the patient, prior to administration of the EGFR inhibitor, was
diagnosed with a cancer which
exhibits presence of methylation of DNA at one of the CpG sites identified in
Table 2 or Table 4. In
certain embodiments, the EGFR inhibitor is erlotinib, cetuximab, or
panitumumab. In certain
embodiments, the cancer is NSCLC.
[028] Another aspect of the invention provides for a method of treating a
cancer in a patient
comprising administering a therapeutically effective amount of an EGFR
inhibitor to the patient,
wherein the patient, prior to administration of the EGFR inhibitor, was
diagnosed with a cancer which
exhibits absence of methylation of DNA at one of the CpG sites identified in
Table 1 or Table 3. In
certain embodiments, the EGFR inhibitor is erlotinib, cetuximab, or
panitumumab. In certain
embodiments, the cancer is NSCLC.
[029] Another aspect of the invention provides for a method of selecting a
therapy for a cancer
patient, comprising the steps of detecting the presence or absence of DNA
methylation at one of the
CpG sites identified in Table 2 or Table 4 in a sample from the patient's
cancer, and selecting an
EGFR inhibitor for the therapy when the presence of methylation at one of the
one of the CpG sites
7
CA 02849120 2014-03-18
WO 2013/055530 PCT/US2012/057777
identified in Table 2 or Table 4 is detected. In one embodiment, the patient
is administered a
therapeutically effective amount of the EGFR inhibitor, such as erlotinib,
cetuximab, or
panitumumab, if the EGFR therapy is selected. In certain embodiments, the
patient is suffering from
NSCLC.
[030] Another aspect of the invention provides for a method of selecting a
therapy for a cancer
patient, comprising the steps of detecting the presence or absence of DNA
methylation at one of the
CpG sites identified in Table 1 or Table 3 in a sample from the patient's
cancer, and selecting an
EGFR inhibitor for the therapy when the absence of methylation at one of the
CpG sites identified in
Table 1 or Table 3 is detected. In one embodiment, the patient is administered
a therapeutically
effective amount of the EGFR inhibitor, such as erlotinib, cetuximab, or
panitumumab, if the EGFR
therapy is selected. . In certain embodiments, the patient is suffering from
NSCLC.
[031] In certain embodiments of the above aspects, the presence or absence of
methylation is
detected by pyrosequencing. In certain embodiments of the above aspects, the
DNA is isolated from
a formalin-fixed paraffin embedded (FFPE) tissue or from fresh frozen tissue.
In one embodiment, the
DNA isolated from the tissue sample is preamplified before pyrosequencing.
BRIEF DESCRIPTION OF THE FIGURES
[032] The patent or application file contains at least one drawing executed in
color. Copies of this
patent or patent application publication with color drawing(s) will be
provided by the Office upon
request and payment of the necessary fee.
[033] Figure 1. NSCLC cell lines classified as epithelial and mesenchymal
phenotype according to
Fluidigm EMT gene expression panel.
[034] Figure 2. Hierarchical clustering characterizing cell lines as
epithelial-like or mesenchymal-
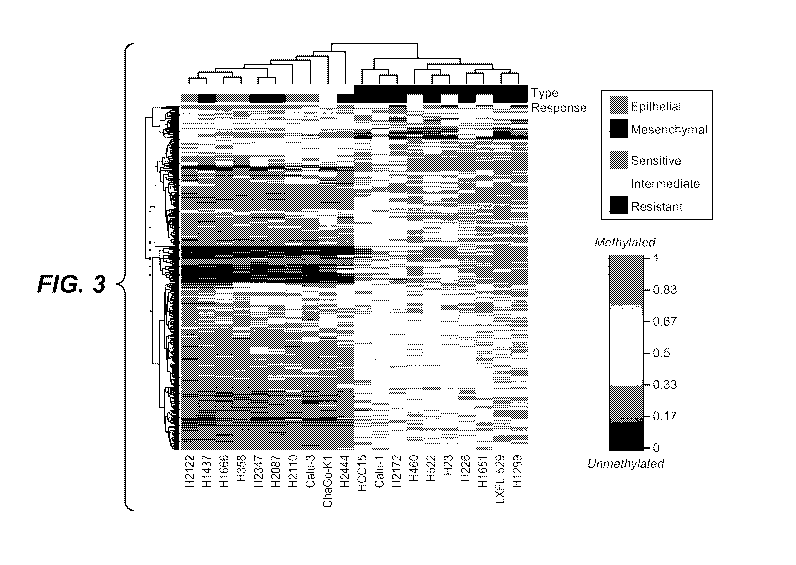
like.
[035] Figure 3. DNA methylation of patterns of epithelial and mesenchymal
NSCLC cell lines
classified as sensitive, intermediate, and resistant to EGFR inhibitor
erlotinib
[036] Figure 4. Annotation of DMRs selected for sodium bisulfite sequencing or
qMSP and
pyrosequencing array design.
[037] Figure 5A. Pyrosequencing of the CLDN7 promoter region differentiates 42
NSCLC cell
lines on the basis of epithelial-like/mesenchymal-like phenotype
[038] Figure 5B. Relative expression of CLDN7 mRNA determined using a standard
ACt method
in 42 (n = 20 epithelial-like, 19 mesenchymal-like, 3 intermediate) DMSO-
treated and 5-aza-dC¨
treated NSCLC cell lines.
8
CA 02849120 2014-03-18
WO 2013/055530
PCT/US2012/057777
[039] Figure 6 A-H. TaqMan-based methylation detection assays specific for
DMRs associated
with the genes (A) MST1R/RON, (C) FAM110A, (E) CP2L3/GRHL2, and (G) ESRP1 and
Receiver
operating characteristic (ROC) plots for (B) RON, (D) FAM110A, (F) GRHL2, and
(H) ESRP1.
[040] Figure 7 A-M. Receiver operating characteric (ROC) curves of
quantitative methylation
specific PCR assays in erlotinib sensitive versus erlotinib resistant NSCLC
cell lines - PEX5L (A),
PCDH8 (B), ZEB2 (C), ME3 (D), MSTR1 (E), STX2 (F), HOXC5 (G), C20orf55 (H),
ESRP1 (I),
BCAR3 (J), CLDN7 (K), NKX6.2 (L), CP2L3 (M).
[041] Figure 8A-B. Table showing the epithelial (E) or mesenchymal (M)
classification of 82
NSCLC Cell Lines and erlotinib IC50 values.
List of Tables
[042] Table 1. Methylated cytosine nucleotides (CpG) associated with
mesenchymal phenotype.
[043] Table 2. Methylated cytosine nucleotides (CpG) associated with
epithelial phenotype.
[044] Table 3. Methylated cytosine nucleotides (CpG) associated with
mesenhymal phenotype
identified by chromosome number, nucleotide position and Entrez ID of the
gene.
[045] Table 4. Methylated cytosine nucleotides (CpG) associated with epithial
phenotype
identified by chromosome number, nucleotide position and Entrez ID of the
gene.
DETAILED DESCRIPTION OF THE INVENTION
[046] The term "cancer" in an animal refers to the presence of cells
possessing characteristics
typical of cancer-causing cells, such as uncontrolled proliferation,
immortality, metastatic potential,
rapid growth and proliferation rate, and certain characteristic morphological
features. Often, cancer
cells will be in the form of a tumor, but such cells may exist alone within an
animal, or may circulate
in the blood stream as independent cells, such as leukemic cells.
[047] "Abnormal cell growth", as used herein, unless otherwise indicated,
refers to cell growth
that is independent of normal regulatory mechanisms (e.g., loss of contact
inhibition). This includes
the abnormal growth of: (1) tumor cells (tumors) that proliferate by
expressing a mutated tyrosine
kinase or overexpression of a receptor tyrosine kinase; (2) benign and
malignant cells of other
proliferative diseases in which aberrant tyrosine kinase activation occurs;
(4) any tumors that
proliferate by receptor tyrosine kinases; (5) any tumors that proliferate by
aberrant serine/threonine
kinase activation; and (6) benign and malignant cells of other proliferative
diseases in which aberrant
serine/threonine kinase activation occurs.
[048] The term "treating" as used herein, unless otherwise indicated, means
reversing, alleviating,
inhibiting the progress of, or preventing, either partially or completely, the
growth of tumors, tumor
9
CA 02849120 2014-03-18
WO 2013/055530 PCT/US2012/057777
metastases, or other cancer-causing or neoplastic cells in a patient. The term
"treatment" as used
herein, unless otherwise indicated, refers to the act of treating.
[049] The phrase "a method of treating" or its equivalent, when applied to,
for example, cancer
refers to a procedure or course of action that is designed to reduce or
eliminate the number of cancer
cells in an animal, or to alleviate the symptoms of a cancer. "A method of
treating" cancer or another
proliferative disorder does not necessarily mean that the cancer cells or
other disorder will, in fact, be
eliminated, that the number of cells or disorder will, in fact, be reduced, or
that the symptoms of a
cancer or other disorder will, in fact, be alleviated.
[050] The term "therapeutically effective agent" means a composition that
will elicit the
biological or medical response of a tissue, system, animal or human that is
being sought by the
researcher, veterinarian, medical doctor or other clinician.
[051] The term "therapeutically effective amount" or "effective amount"
means the amount of the
subject compound or combination that will elicit the biological or medical
response of a tissue,
system, animal or human that is being sought by the researcher, veterinarian,
medical doctor or other
clinician.
[052] The terms "ErbBl", "HER1", "epidermal growth factor receptor" and
"EGFR" and "EGFR
kinase" are used interchangeably herein and refer to EGFR as disclosed, for
example, in Carpenter et
al. Ann. Rev. Biochem. 56:881-914 (1987), including naturally occurring mutant
forms thereof (e.g. a
deletion mutant EGFR as in Humphrey et al. PNAS (USA) 87:4207-4211(1990)).
erbB1 refers to the
gene encoding the EGFR protein product.
[053] As used herein, the term "EGFR kinase inhibitor" and "EGFR inhibitor"
refers to any
EGFR kinase inhibitor that is currently known in the art or that will be
identified in the future, and
includes any chemical entity that, upon administration to a patient, results
in inhibition of a biological
activity associated with activation of the EGF receptor in the patient,
including any of the downstream
biological effects otherwise resulting from the binding to EGFR of its natural
ligand. Such EGFR
kinase inhibitors include any agent that can block EGFR activation or any of
the downstream
biological effects of EGFR activation that are relevant to treating cancer in
a patient. Such an inhibitor
can act by binding directly to the intracellular domain of the receptor and
inhibiting its kinase activity.
Alternatively, such an inhibitor can act by occupying the ligand binding site
or a portion thereof of the
EGF receptor, thereby making the receptor inaccessible to its natural ligand
so that its normal
biological activity is prevented or reduced. Alternatively, such an inhibitor
can act by modulating the
dimerization of EGFR polypeptides, or interaction of EGFR polypeptide with
other proteins, or
enhance ubiquitination and endocytotic degradation of EGFR. EGFR kinase
inhibitors include but are
not limited to low molecular weight inhibitors, antibodies or antibody
fragments, antisense constructs,
small inhibitory RNAs (i.e. RNA interference by dsRNA; RNAi), and ribozymes.
In a preferred
embodiment, the EGFR kinase inhibitor is a small organic molecule or an
antibody that binds
specifically to the human EGFR.
CA 02849120 2014-03-18
WO 2013/055530
PCT/US2012/057777
[054] Inhibitors of EGF receptor function have shown clinical utility and
the definition of key
EGF receptor signaling pathways which describe patient subsets most likely to
benefit from therapy
has become an important area of investigation. Mutations which activate the
receptor's intrinsic
protein tyrosine kinase activity and/or increase downstream signaling have
been observed in NSCLC
and glioblastoma. In vitro and clinical studies have shown considerable
variability between wt EGF
receptor cell lines and tumors in their cellular responses to EGF receptor
inhibition, which in part has
been shown to derive from EGF receptor independent activation of the
phosphatidyl inositol 3-kinase
pathway, leading to the continued phosphorylation of the anti-apoptotic serine-
threonine kinase Akt.
The molecular determinants to alternative routes of P13 -kinase activation and
consequent EGF
receptor inhibitor insensitivity are an active area of investigation. For
example the insulin-like growth
factor-1 receptor (IGF-1 receptor), which strongly activates the P13 -kinase
pathway, has been
implicated in cellular resistance to EGF inhibitors. The roles of cell-cell
and cell-adhesion networks,
which can also exert survival signals through the P13-kinase pathway in
mediating insensitivity to
selective EGF receptor inhibition are less clear and would be postulated to
impact cell sensitivity to
EGF receptor blockade. The ability of tumor cells to maintain growth and
survival signals in the
absence of adhesion to extracellular matrix or cell-cell contacts is important
not only in the context of
cell migration and metastasis but also in maintaining cell proliferation and
survival in wound-like
tumor environments where extracellular matrix is being remodeled and cell
contact inhibition is
diminished.
[055] An EMT gene expression signature that correlates with in vitro
sensitivity of NSCLC cell
lines to erlotinib was previously developed. (Yauch et al., 2005, Clin Cancer
Res 11, 8686-8698). A
fluidigm-based EMT expression signature associated with epithelial and
mesenchymal phenotypes
was developed based on this work (Figure 1).
[056] The present invention is based, in part, on the use of an integrated
genomics approach
combining gene expression analysis with whole genome methylation profiling to
show that
methylation biomarkers are capable of classifying epithelial and mesenchymal
phenotypes in cancer
(such as NSCLC), demonstrating that genome-wide differences in DNA methylation
patterns are
associated with distinct biologic and clinically relevant subsets of that
cancer. The use of
methylation patterns to classify phenotypic subsets of cancers using the
methods described herein is
advantageous as it requires less quantity of test tissue as compared to more
traditional methods of
DNA- and RNA-based analyses. This feature is particularly useful when
analyzing clinical samples
where tissue is limited.
[057] A major challenge in the development of predictive biomarkers is the
need to establish a
robust "cut-point" for prospective evaluation. This is particularly
problematic for protein-based assays
such as immunohistochemistry. While widely used, immunohistochemistry is
subject to a number of
technical challenges that limit its use in the context of predictive biomarker
development. These
11
CA 02849120 2014-03-18
WO 2013/055530 PCT/US2012/057777
limitations include antibody specificity and sensitivity, epitope availability
and stability, and the
inherent subjectivity of data interpretation by different pathologists (24
25). Molecular assays that
can leverage the dynamic range and specificity of PCR are much more desirable.
However, there are
also limitations with PCR-based assays: RNA is highly unstable and requires
that a cutoff point be
defined prospectively. Mutation detection assays, while potentially binary,
are limited by the
availability of high prevalence mutation hot spots and target sequences. As
shown in the Examples,
PCR-based methylation assays potentially address many of these issues because
they have many of
the properties of mutation assays, including a broad dynamic range and an
essentially binary readout
with similar sensitivity to mutation assays, yet due to the locally correlated
behavior of CpG
methylation states, the target regions for assay design can be quite large.
Most importantly, DNA
methylation can be used to infer the biologic state of tumors in much the same
way as gene expression
has been used in the past.
[058] The data presented in the Examples herein demonstrate that tumor
cells, such as NSCLC or
pancreatic cancer cells, containing wild type EGFR, grown either in cell
culture or in vivo, show a
range of sensitivities to inhibition by EGFR kinase inhibitors, dependent on
whether they have
undergone an epithelial to mesenchymal transition (EMT). Prior to EMT, tumor
cells are very
sensitive to inhibition by EGFR kinase inhibitors such as erlotinib HC1
(Tarceva ), whereas tumor
cells which have undergone an EMT are substantially less sensitive to
inhibition by such compounds.
The data indicates that the EMT may be a general biological switch that
determines the level of
sensitivity of tumors to EGFR kinase inhibitors. It is demonstrated herein
that the level of sensitivity
of tumors to EGFR kinase inhibitors can be assessed by determining the level
of biomarkers
expressed by a tumor cell that are characteristic for cells either prior to or
subsequent to an EMT
event. For example, high levels of tumor cell expression of epithelial
biomarkers such as E-cadherin,
indicative of a cell that has not yet undergone an EMT, correlate with high
sensitivity to EGFR kinase
inhibitors. Conversely, high levels of tumor cell expression of mesenchymal
biomarkers such as
vimentin or fibronectin, indicative of a cell that has undergone an EMT,
correlate with low sensitivity
to EGFR kinase inhibitors. Thus, these observations can form the basis of
diagnostic methods for
predicting the effects of EGFR kinase inhibitors on tumor growth, and give
oncologists a tool to assist
them in choosing the most appropriate treatment for their patients.
[059] As described in the Examples, cancer can be differentiated into
epithelial-like (EL) and
mesenchymal -like (ML) tumors based on DNA methylation patterns. Mesenchymal
phenotype (or a
tumor cell that has undergone EMT) is associated with methylation of
particular genes shown in Table
1 and Table 3. Accordingly, the present invention provides a method of
determining whether a tumor
cell has a mesenchymal phenotype comprising detecting the presence or absence
of methylation of
DNA at anyone of the CpG sites identified in Table 1 or Table 3 in the tumor
cell, wherein the
methylation at any of the CpG sites indicates that the tumor cell has a
mesenchymal phenotype.
12
CA 02849120 2014-03-18
WO 2013/055530 PCT/US2012/057777
Conversely, the absence of DNA methylation at any one of the CpG sites
identified in Table 1 or
Table 3 indicates the tumor has an epithelial phenotype.
[060] In a particular embodiment, the method of determining whether a tumor
cell has a
mesenchymal phenotype comprises detecting the presence or absence of
methylation at CpG sites in
one or more of CLDN7 (claudin-7), HOXC4 (homeobox C4), CP2L3 (grainyhead like-
3), STX2
(syntaxin 2), RON (macrophage stimulating 1 receptor), TBCD (tubulin-specific
chaperone D),
ESRP1 (epithelial splicing regulatory protein 1), GRHL2 (grainyhead-like 2),
ERBB2, and C20orf55
(chromosome 20 open reading frame 55) genes, wherein the presence of
methylation at any one of the
CpG sites indicates the tumor has a mesenchymal phenotype. Conversely, the
absence of DNA
methylation at any one of the CpG sites indicates the tumor has an epithelial
phenotype. In a
particular embodiment, the method comprises detecting methylation at CpG sites
in one or more of
CLDN7, HOXC4, CP2L3, STX2, RON, TBCD, ESRP1, GRHL2. ERBB2, and C20orf55 genes,
wherein the presence of methylation at any one of the CpG sites indicates the
tumor has a
mesenchymal phenotype. In a particular embodiment, detecting the presence of
methylation at CpG
sites in two of the genes in Table lor Table 3 indicates that the tumor has a
mesenchymal phenotype.
In a particular embodiment, detecting the presence of methylation at CpG sites
in three of the genes in
Table 1 or Table 3 indicates that the tumor has a mesenchymal phenotype. In a
particular
embodiment, detecting the presence of methylation at CpG sites in four of the
genes in Table lor
Table 3 indicates that the tumor has a mesenchymal phenotype. In a particular
embodiment, detecting
the presence of methylation at CpG sites in five of the genes in Table 1 or
Table 3 indicates that the
tumor has a mesenchymal phenotype. In a particular embodiment, detecting the
presence of
methylation at CpG sites in two, three, or four, five, six, seven, eight, or
all nine of CLDN7, HOXC4,
CP2L3, STX2, RON, TBCD, ESRP1, GRHL2 and C20orf55 genes indicates that the
tumor has a
mesenchymal phenotype. In another embodiment, detecting the presence of
methylation at CpG sites
in two, three, or four of CLDN7, RON, ESRP1, and GRHL2 indicates that the
tumor has a
mesenchymal phenotype. In another embodiment, detecting the presence of
methylation at CpG sites
in all four of CLDN7, RON, ESRP1, and GRHL2 indicates that the tumor has a
mesenchymal
phenotype.
[061] Further, the invention provides a method of predicting the
sensitivity of tumor growth to
inhibition by an EGFR inhibitor, comprising detecting the presence or absence
of methylation of
DNA at any one of the CpG sites identified in Table 1 or Table 3 in a sample
cell taken from the
tumor, wherein the presence of DNA methylation at any one of the CpG sites
indicates the tumor
growth is resistant to inhibition with an EGFR inhibitor. Conversely, the
absense of methylation of
DNA at any one of the CpG sites indicates the tumor growth is sensitive (i.e.
responsive) to inhibition
by an EGFR inhibitor. In a particular embodiment, detecting the presence of
methylation at CpG sites
in two of the genes in Table lor Table 3 indicates the tumor growth is
resistant to inhibition with an
13
CA 02849120 2014-03-18
WO 2013/055530 PCT/US2012/057777
EGFR inhibitor. In a particular embodiment, detecting the presence of
methylation at CpG sites in
three of the genes in Table 1 or Table 3 indicates the tumor growth is
resistant to inhibition with an
EGFR inhibitor. In a particular embodiment, detecting the presence of
methylation at CpG sites in
four of the genes in Table lor Table 3 indicates the tumor growth is resistant
to inhibition with an
EGFR inhibitor. In a particular embodiment, detecting the presence of
methylation at CpG sites in
five of the genes in Table 1 or Table 3 indicates the tumor growth is
resistant to inhibition with an
EGFR inhibitor. In a particular embodiment, detecting the presence of
methylation at CpG sites in
two, three, or four, five, six, seven, eight, or all nine of CLDN7, HOXC4,
CP2L3, STX2, RON,
TBCD, ESRP1, GRHL2, ERBB2, and C20orf55 genes indicates the tumor growth is
resistant to
inhibition with an EGFR inhibitor. In another embodiment, detecting the
presence of methylation at
CpG sites in two, three, or four of CLDN7, RON, ESRP1, and GRHL2 indicates the
tumor growth is
resistant to inhibition with an EGFR inhibitor. In another embodiment,
detecting the presence of
methylation at CpG sites in all four of CLDN7, RON, ESRP1, and GRHL2 indicates
the tumor
growth is resistant to inhibition with an EGFR inhibitor.
[062] Another aspect of the invention provides a method of identifying a
cancer patient who is
likely to benefit from treatment with EGFR inhibitor, comprising detecting the
presence or absence of
methylation of DNA at any one of the CpG sites identified in Table 1 or Table
3 in a sample from the
patient's cancer, wherein the patient is identified as being likely to benefit
from treatment with an
EGFR inhibitor if the absence of DNA methylation at any one of the CpG sites
is detected.
Conversely, the presence of methylation of DNA at any one of the CpG sites
indicates patient is less
likely to benefit from treatment with an EGFR inhibitor. In a particular
embodiment, detecting the
absence of methylation at CpG sites in two of the genes in Table lor Table 3
indicates the patient is
likely to benefit from treatment with an EGFR inhibitor. In a particular
embodiment, detecting the
absence of methylation at CpG sites in three of the genes in Table 1 or Table
3 indicates the patient is
likely to benefit from treatment with an EGFR inhibitor. In a particular
embodiment, detecting the
absence of methylation at CpG sites in four of the genes in Table lor Table 3
indicates the patient is
likely to benefit from treatment with an EGFR inhibitor. In a particular
embodiment, detecting the
absence of methylation at CpG sites in five of the genes in Table 1 or Table 3
indicates the patient is
likely to benefit from treatment with an EGFR inhibitor. In a particular
embodiment, detecting the
absence of methylation at CpG sites in two, three, or four, five, six, seven,
eight, or all nine of
CLDN7, HOXC4, CP2L3, STX2, RON, TBCD, ESRP1, GRHL2, ERBB2, and C20orf55 genes
indicates the patient is likely to benefit from treatment with an EGFR
inhibitor. In another
embodiment, detecting the absence of methylation at CpG sites in two, three,
or four of CLDN7,
RON, ESRP1, and GRHL2 indicates the patient is likely to benefit from
treatment with an EGFR
inhibitor. In another embodiment, detecting the absence of methylation at CpG
sites in all four of
CLDN7, RON, ESRP1, and GRHL2 indicates the patient is likely to benefit from
treatment with an
14
CA 02849120 2014-03-18
WO 2013/055530
PCT/US2012/057777
EGFR inhibitor. In certain embodiments, the patient who has been deemed likely
to benefit from
treatment with an EGFR inhibitor is administered a therapeutically effective
amount of an EGFR
inhibitor.
[063] As described in the Examples, epithelial phenotype in a tumor cell is
associated with
methylation of particular genes shown in Table 2 and in Table 4. Accordingly,
the present invention
provides a method of determining whether a tumor cell has an epithelial
phenotype comprising
detecting the presence or absence of methylation of DNA at any one of the
cytosine nucleotides (CpG
sites) identified in Table 2 or in Table 4 in the tumor cell, wherein the
presence of methylation at any
of the cytosine nucleotides (CpG sites) indicates that the tumor cell has an
epithelial phenotype.
Conversely, the present invention futher provides a method of detemining
whether a tumor cell has an
epithelial phenotype comprising detecting the presence or absence of
methylation of DNA at any one
of the CpG sites identified in Table 2 or Table 4 in the tumor cell, wherein
the absence of methylation
at CpG sites indicates that the tumor has a mesenchymal phenotype.
[064] In a particular embodiment, the method comprises detecting the
presence or absence of
methylation at CpG sites in one or more of PCDH8 (protocadherin 8), PEX5L
(peroxisomal
biogenesis factor 5-like), GALR1 (galanin receptor 1), ZEB2 (zinc finger E-box
binding homeobox 2)
and ME3 (malic enzyme 3) genes, wherein the presence of methylation at CpG
sites indicates that the
tumor has an epithelial phenotype. In a particular embodiment, the method
comprises detecting the
presence or absence of methylation at CpG sites in the ZEB2 gene, wherein the
presence of
methylation at CpG sites indicates that the tumor has an epithelial phenotype.
In a particular
embodiment, detecting the presence of methylation at CpG sites in two of the
genes in Table 2 or
Table 4 indicates that the tumor has an epithelial phenotype. In a particular
embodiment, detecting
the presence of methylation at CpG sites in three of the genes in Table 2 or
Table 4 indicates that the
tumor has an epithelial phenotype. In a particular embodiment, detecting the
presence of methylation
at CpG sites in four of the genes in Table 2 or Table 4 indicates that the
tumor has an epithelial
phenotype. In a particular embodiment, detecting the presence of methylation
at CpG sites in five of
the genes in Table 2 or Table 4 indicates that the tumor has an epithelial
phenotype. In a particular
embodiment, detecting the presence of methylation at CpG sites in each of
PCDH8, PEX5L, GALR1
or ZEB2 genes indicates that the tumor has an epithelial phenotype.
[065] Further, the invention provides a method of predicting the
sensitivity of tumor growth to
inhibition by an EGFR inhibitor, comprising detecting the presence or absence
of methylation of
DNA at any one of the CpG sites identified in Table 2 or Table 4 in a sample
cell taken from the
tumor, wherein the presence of DNA methylation at any one of the CpG sites
indicates the tumor
growth is sensitive to inhibition with an EGFR inhibitor. Conversely, the
absense of methylation of
DNA at any one of the CpG sites indicates the tumor growth is resistant to
inhibition by an EGFR
inhibitor. In a particular embodiment, the method comprises detecting
methylation of CpG sites of
CA 02849120 2014-03-18
WO 2013/055530 PCT/US2012/057777
one or more of PCDH8, PEX5L, GALR1 or ZEB2 genes, wherein the presence of
methylation at any
one of the CpG sites indicates the tumor growth is sensitive to inhibition
with an EGFR inhibitor. In a
particular embodiment, the method comprises detecting methylation of CpG sites
in the ZEB2 gene,
wherein the presence of methylation of CpG sites in the ZEB2 gene indicates
the tumor growth is
sensitive to inhibition with an EGFR inhibitor. In a particular embodiment,
detecting the presence of
methylation at CpG sites in two of the genes in Table 2 or Table 4 indicates
the tumor growth is
sensitive to inhibition with an EGFR inhibitor. In a particular embodiment,
detecting the presence of
methylation at CpG sites in three of the genes in or Table 4 indicates the
tumor growth is sensitive to
inhibition with an EGFR inhibitor. In a particular embodiment, detecting the
presence of methylation
at CpG sites in four of the genes in or Table 4 indicates the tumor growth is
sensitive to inhibition
with an EGFR inhibitor. In a particular embodiment, detecting the presence of
methylation at CpG
sites in five of the genes in or Table 4 indicates the tumor growth is
sensitive to inhibition with an
EGFR inhibitor. In a particular embodiment, detecting the presence of
methylation at CpG sites in
each of PCDH8, PEX5L, GALR1 or ZEB2 genes indicates the tumor growth is
sensitive to inhibition
with an EGFR inhibitor.
[066] Another aspect of the invention provides a method of identifying a
cancer patient who is
likely to benefit from treatment with EGFR inhibitor, comprising detecting the
presence or absence of
methylation of DNA at any one of the CpG sites identified in Table 2 or Table
4 in a sample from the
patient's cancer, wherein the patient is identified as being likely to benefit
from treatment with an
EGFR inhibitor if the presence of DNA methylation at any one of the CpG sites
is detected.
Conversely, the absence of methylation of DNA at any one of the CpG sites
indicates patient is less
likely to benefit from treatment with an EGFR inhibitor. In a particular
embodiment, detecting the
presence of methylation at CpG sites in two of the genes in Table 2 or Table 4
indicates the patient is
likely to benefit from treatment with an EGFR inhibitor. In a particular
embodiment, detecting the
presence of methylation at CpG sites in three of the genes in Table 2 or Table
4 indicates the patient is
likely to benefit from treatment with an EGFR inhibitor. In a particular
embodiment, detecting the
presence of methylation at CpG sites in four of the genes in Table 2 or Table
4 indicates the patient is
likely to benefit from treatment with an EGFR inhibitor. In a particular
embodiment, detecting the
presence of methylation at CpG sites in five of the genes in Table 2 or Table
4 indicates the patient is
likely to benefit from treatment with an EGFR inhibitor. In a particular
embodiment, detecting the
presence of methylation at CpG sites two, three, or four of PCDH8, PEX5L,
GALR1 or ZEB2
indicates the patient is likely to benefit from treatment with an EGFR
inhibitor. In another
embodiment, detecting the presence of methylation at CpG sites in ZEB2
indicates the patient is
likely to benefit from treatment with an EGFR inhibitor. In certain
embodiments, the patient who has
been deemed likely to benefit from treatment with an EGFR inhibitor is
administered a therapeutically
effective amount of an EGFR inhibitor.
16
CA 02849120 2014-03-18
WO 2013/055530 PCT/US2012/057777
[067] Another aspect of the invention provides for a method of treating a
cancer patient who has
previously been identified as one likely to benefit from treatment with an
EGFR inhibitor using the
DNA methylation profiling described herein, comprising administering to the
patient a therapeutically
effective amount of an EGFR inhibitor.
[068] Another aspect of the invention provides for a method of selecting a
therapy for a cancer
patient based on the DNA methylation profiling methods described herein. In
one embodiment, the
method comprises detecting the presence or absence of DNA at one of the CpG
sites identified in
Table 2 or Table 4 in a sample from the patient's cancer and selecting an EGFR
inhibitor for the
therapy when the presence of methylation at one of the CpG sites identified in
Table 2 or Table 4 is
detected. In another embodiment, the method comprises detecting the presence
or absence of DNA
methylation at one of the CpG sites identified in Table 1 or Table 3 in a
sample from the patient's
cancer and selecting an EGFR inhibitor for the therapy when the absence of
methylation at one of the
one of the CpG sites identified in Table 1 or Table 3 is detected. In certain
embodiments, the patient
is administered therapeutically effective amount of the EGFR inhibitor, such
as is erlotinib,
cetuximab, or panitumumab, if the EGFR inhibitor therapy is selected.
[069] One of skill in the medical arts, particularly pertaining to the
application of diagnostic tests
and treatment with therapeutics, will recognize that biological systems may
exhibit variability and
may not always be entirely predictable, and thus many good diagnostic tests or
therapeutics are
occasionally ineffective. Thus, it is ultimately up to the judgement of the
attending physician to
determine the most appropriate course of treatment for an individual patient,
based upon test results,
patient condition and history, and his own experience. There may even be
occasions, for example,
when a physician will choose to treat a patient with an EGFR inhibitor even
when a tumor is not
predicted to be particularly sensitive to EGFR kinase inhibitors, based on
data from diagnostic tests or
from other criteria, particularly if all or most of the other obvious
treatment options have failed, or if
some synergy is anticipated when given with another treatment. The fact that
the EGFR inhibitors as a
class of drugs are relatively well tolerated compared to many other anti-
cancer drugs, such as more
traditional chemotherapy or cytotoxic agents used in the treatment of cancer,
makes this a more viable
option.
[070] Accordingly, the present invention provides a method of predicting
the sensitivity of tumor
cell growth to inhibition by an EGFR kinase inhibitor, comprising: assessing
the DNA methylation
level of one or more (or a panel of) epithelial biomarkers in a tumor cell;
and predicting the
sensitivity of tumor cell growth to inhibition by an EGFR inhibitor, wherein
simultaneous high DNA
methylation levels of all of the tumor cell epithelial biomarkers correlates
with high sensitivity to
inhibition by EGFR inhibitors. In one particular embodiment of this method the
epithelial biomarkers
comprise genes PCDH8, PEX5L, GALR1, ZEB2 and ME3, wherein simultaneous high
expression
17
CA 02849120 2014-03-18
WO 2013/055530 PCT/US2012/057777
level of the two tumor cell epithelial biomarkers correlates with high
sensitivity to inhibition by
EGFR kinase inhibitor.
[071] The present invention also provides a method of predicting the
sensitivity of tumor cell
growth to inhibition by an EGFR kinase inhibitor, comprising: assessing the
level of one or more (or a
panel of) mesenchymal biomarkers in a tumor cell; and predicting the
sensitivity of tumor cell growth
to inhibition by an EGFR inhibitor, wherein simultaneous high levels of all of
the tumor cell
mesenchymal biomarkers correlates with resistance to inhibition by EGFR
inhibitors. In one
particular embodiment of this method the mesenchymal biomarkers comprise genes
CLDN7,
HOXC4, CP2L3, TBCD, ESRP1, GRHL2, and C20orf55, wherein simultaneous high DNA
methylation levels of at least two tumor cell mesenchymal biomarkers
correlates with resistance to
inhibition by EGFR inhibitor.
[072] The present invention also provides a method of predicting whether a
cancer patient is
afflicted with a tumor that will respond effectively to treatment with an EGFR
kinase inhibitor,
comprising: assessing the DNA methylation level of one or more (or a panel of)
epithelial biomarkers
PCDH8, PEX5L, GALR1, ZEB2 and ME3 in cells of the tumor; and predicting if the
tumor will
respond effectively to treatment with an EGFR inhibitor, wherein simultaneous
high expression levels
of all of the tumor cell epithelial biomarkers correlates with a tumor that
will respond effectively to
treatment with an EGFR inhibitor.
[073] The present invention also provides a method of predicting whether a
cancer patient is
afflicted with a tumor that will respond effectively to treatment with an EGFR
kinase inhibitor,
comprising: assessing the level of one or more (or a panel of) mesenchymal
biomarkers CLDN7,
HOXC4, CP2L3, TBCD, ESRP1, GRHL2, and C20orf55 in cells of the tumor; and
predicting if the
tumor will respond effectively to treatment with an EGFR inhibitor, wherein
high DNA methylation
levels of all of such tumor cell mesenchymal biomarkers correlates with a
tumor that is resistant to
treatment with an EGFR inhibitor.
[074] In the methods described herein the tumor cell will typically be from
a patient diagnosed
with cancer, a precancerous condition, or another form of abnormal cell
growth, and in need of
treatment. The cancer may be lung cancer (e.g. non-small cell lung cancer
(NSCLC)), pancreatic
cancer, head and neck cancer, gastric cancer, breast cancer, colon cancer,
ovarian cancer, or any of a
variety of other cancers described herein below. The cancer is one known to be
potentially treatable
with an EGFR inhibitor. Tumor cells may be obtained from a patients sputum,
saliva, blood, urine,
feces, cerebrospinal fluid or directly from the tumor, e.g. by fine needle
aspirate.
[075] Presence and/or level/amount of various biomarkers in a sample can be
analyzed by a
number of methodologies, many of which are known in the art and understood by
the skilled artisan,
including, but not limited to, immunohistochemical ("IHC"), Western blot
analysis,
18
CA 02849120 2014-03-18
WO 2013/055530 PCT/US2012/057777
immunoprecipitation, molecular binding assays, ELISA, ELIFA, fluorescence
activated cell sorting
("FACS"), MassARRAY, proteomics, quantitative blood based assays (as for
example Serum
ELISA), biochemical enzymatic activity assays, in situ hybridization, Southern
analysis, Northern
analysis, whole genome sequencing, polymerase chain reaction ("PCR") including
quantitative real
time PCR ("qRT-PCR") and other amplification type detection methods, such as,
for example,
branched DNA, SISBA, TMA and the like), RNA-Seq, FISH, microarray analysis,
gene expression
profiling, and/or serial analysis of gene expression ("SAGE"), as well as any
one of the wide variety
of assays that can be performed by protein, gene, and/or tissue array
analysis. Typical protocols for
evaluating the status of genes and gene products are found, for example in
Ausubel et al., eds., 1995,
Current Protocols In Molecular Biology, Units 2 (Northern Blotting), 4
(Southern Blotting), 15
(Immunoblotting) and 18 (PCR Analysis). Multiplexed immunoassays such as those
available from
Rules Based Medicine or Meso Scale Discovery ("MSD") may also be used.
[076] Methods for evaluation of DNA methylation are well known. For
example, Laird (2010)
Nature Reviews Genetics 11:191-203 provides a review of DNA methylation
analysis. In some
embodiments, methods for evaluating methylation include randomly shearing or
randomly
fragmenting the genomic DNA, cutting the DNA with a methylation-dependent or
methylation-
sensitive restriction enzyme and subsequently selectively identifying and/or
analyzing the cut or uncut
DNA. Selective identification can include, for example, separating cut and
uncut DNA (e.g., by size)
and quantifying a sequence of interest that was cut or, alternatively, that
was not cut. See, e.g., U.S.
Pat. No. 7,186,512. In some embodiments, the method can encompass amplifying
intact DNA after
restriction enzyme digestion, thereby only amplifying DNA that was not cleaved
by the restriction
enzyme in the area amplified. See, e.g., U.S. Patent Application Nos.
10/971,986; 11/071,013; and
10/971,339. In some embodiments, amplification can be performed using primers
that are gene
specific. Alternatively, adaptors can be added to the ends of the randomly
fragmented DNA, the DNA
can be digested with a methylation-dependent or methylation-sensitive
restriction enzyme, intact
DNA can be amplified using primers that hybridize to the adaptor sequences. In
some embodiments, a
second step can be performed to determine the presence, absence or quantity of
a particular gene in an
amplified pool of DNA. In some embodiments, the DNA is amplified using real-
time, quantitative
PCR.
[077] In some embodiments, the methods comprise quantifying the average
methylation density
in a target sequence within a population of genomic DNA. In some embodiments,
the method
comprises contacting genomic DNA with a methylation-dependent restriction
enzyme or methylation-
sensitive restriction enzyme under conditions that allow for at least some
copies of potential
restriction enzyme cleavage sites in the locus to remain uncleaved;
quantifying intact copies of the
locus; and comparing the quantity of amplified product to a control value
representing the quantity of
19
CA 02849120 2014-03-18
WO 2013/055530 PCT/US2012/057777
methylation of control DNA, thereby quantifying the average methylation
density in the locus
compared to the methylation density of the control DNA.
[078] The quantity of methylation of a locus of DNA can be determined by
providing a sample
of genomic DNA comprising the locus, cleaving the DNA with a restriction
enzyme that is either
methylation-sensitive or methylation-dependent, and then quantifying the
amount of intact DNA or
quantifying the amount of cut DNA at the DNA locus of interest. The amount of
intact or cut DNA
will depend on the initial amount of genomic DNA containing the locus, the
amount of methylation in
the locus, and the number (i.e., the fraction) of nucleotides in the locus
that are methylated in the
genomic DNA. The amount of methylation in a DNA locus can be determined by
comparing the
quantity of intact DNA or cut DNA to a control value representing the quantity
of intact DNA or cut
DNA in a similarly-treated DNA sample. The control value can represent a known
or predicted
number of methylated nucleotides. Alternatively, the control value can
represent the quantity of intact
or cut DNA from the same locus in another (e.g., normal, non-diseased) cell or
a second locus.
[079] By using methylation-sensitive or methylation-dependent restriction
enzyme under
conditions that allow for at least some copies of potential restriction enzyme
cleavage sites in the
locus to remain uncleaved and subsequently quantifying the remaining intact
copies and comparing
the quantity to a control, average methylation density of a locus can be
determined. If the
methylation-sensitive restriction enzyme is contacted to copies of a DNA locus
under conditions that
allow for at least some copies of potential restriction enzyme cleavage sites
in the locus to remain
uncleaved, then the remaining intact DNA will be directly proportional to the
methylation density,
and thus may be compared to a control to determine the relative methylation
density of the locus in
the sample. Similarly, if a methylation-dependent restriction enzyme is
contacted to copies of a DNA
locus under conditions that allow for at least some copies of potential
restriction enzyme cleavage
sites in the locus to remain uncleaved, then the remaining intact DNA will be
inversely proportional to
the methylation density, and thus may be compared to a control to determine
the relative methylation
density of the locus in the sample. Such assays are disclosed in, e.g., U.S.
patent application Ser. No.
10/971,986.
[080] In some embodiments, quantitative amplification methods (e.g.,
quantitative PCR or
quantitative linear amplification) can be used to quantify the amount of
intact DNA within a locus
flanked by amplification primers following restriction digestion. Methods of
quantitative
amplification are disclosed in, e.g., U.S. Pat. Nos. 6,180,349; 6,033,854; and
5,972,602, as well as in,
e.g., Gibson et al., Genome Research 6:995-1001 (1996); DeGraves et al.,
Biotechniques 34(1):106-
10, 112-5 (2003); Deiman Bet al., Mol Biotechnol. 20(2):163-79 (2002).
[081] Additional methods for detecting DNA methylation can involve genomic
sequencing
before and after treatment of the DNA with bisulfite. See, e.g., Frommer et
al., Proc. Natl. Acad. Sci.
CA 02849120 2014-03-18
WO 2013/055530
PCT/US2012/057777
USA 89:1827-1831 (1992). When sodium bisulfite is contacted to DNA,
unmethylated cytosine is
converted to uracil, while methylated cytosine is not modified.
[082] In some embodiments, restriction enzyme digestion of PCR products
amplified from
bisulfite-converted DNA is used to detect DNA methylation. See, e.g., Sadri &
Hornsby, Nucl. Acids
Res. 24:5058-5059 (1996); Xiong & Laird, Nucleic Acids Res. 25:2532-2534
(1997).
[083] In some embodiments, a MethyLight assay is used alone or in
combination with other
methods to detect DNA methylation (see, Eads et al., Cancer Res. 59:2302-2306
(1999)). Briefly, in
the MethyLight process genomic DNA is converted in a sodium bisulfite reaction
(the bisulfite
process converts unmethylated cytosine residues to uracil). Amplification of a
DNA sequence of
interest is then performed using PCR primers that hybridize to CpG
dinucleotides. By using primers
that hybridize only to sequences resulting from bisulfite conversion of
unmethylated DNA, (or
alternatively to methylated sequences that are not converted) amplification
can indicate methylation
status of sequences where the primers hybridize. Similarly, the amplification
product can be detected
with a probe that specifically binds to a sequence resulting from bisulfite
treatment of an
unmethylated (or methylated) DNA. If desired, both primers and probes can be
used to detect
methylation status. Thus, kits for use with MethyLight can include sodium
bisulfite as well as primers
or detectably-labeled probes (including but not limited to Taqman or molecular
beacon probes) that
distinguish between methylated and unmethylated DNA that have been treated
with bisulfite. Other
kit components can include, e.g., reagents necessary for amplification of DNA
including but not
limited to, PCR buffers, deoxynucleotides; and a thermostable polymerase.
[084] In some embodiments, a Ms-SNuPE (Methylation-sensitive Single
Nucleotide Primer
Extension) reaction is used alone or in combination with other methods to
detect DNA methylation
(see Gonzalgo & Jones Nucleic Acids Res. 25:2529-2531 (1997)). The Ms-SNuPE
technique is a
quantitative method for assessing methylation differences at specific CpG
sites based on bisulfite
treatment of DNA, followed by single-nucleotide primer extension. Briefly,
genomic DNA is reacted
with sodium bisulfite to convert unmethylated cytosine to uracil while leaving
5-methylcytosine
unchanged. Amplification of the desired target sequence is then performed
using PCR primers
specific for bisulfite-converted DNA, and the resulting product is isolated
and used as a template for
methylation analysis at the CpG site(s) of interest.
[085] In some embodiments, a methylation-specific PCR ("MSP") reaction is
used alone or in
combination with other methods to detect DNA methylation. An MSP assay entails
initial
modification of DNA by sodium bisulfite, converting all unmethylated, but not
methylated, cytosines
to uracil, and subsequent amplification with primers specific for methylated
versus unmethylated
DNA. See, Herman et al., Proc. Natl. Acad. Sci. USA 93:9821-9826, (1996); U.S.
Pat. No. 5,786,146.
21
CA 02849120 2014-03-18
WO 2013/055530 PCT/US2012/057777
In some embodiments, DNA methylation is detected by a QIAGEN PyroMark CpG
Assay
predesigned Pyrosequencing DNA Methylation assays.
[086] In some embodiments, cell methylation status is determined using high-
throughput DNA
methylation analysis to determine sensitivity to EGFR inhibitors. Briefly,
genomic DNA is isolated
from a cell or tissue sample (e.g. a tumor sample or a blood sample) and is
converted in a sodium
bisulfite reaction (the bisulfite process converts unmethylated cytosine
residues to uracil) using
standard assays in the art. The bisulfite converted DNA product is amplified,
fragmented and
hybridized to an array containing CpG sites from across a genome using
standard assays in the art.
Following hybridization, the array is imaged and processed for analysis of the
DNA methylation
status using standard assays in the art. In some embodiments, the tissue
sample is formalin-fixed
paraffin embedded (FFPE) tissue. In some embodiments, the tissue sample is
fresh frozen tissue. In
some embodiments, the DNA isolated from the tissue sample is preamplified
before bisulfite
conversion. In some embodiments, the DNA isolated from the tissue sample is
preamplified before
bisulfite conversion by using the Invitrogen Superscript III One-Step RT-PCR
System with Platinum
Taq. In some embodiments, the DNA isolated from the tissue sample is
preamplified before bisulfite
conversion using a Taqman based assay. In some embodiments, the sodium
bisulfite reaction is
conducted using the Zymo EZ DNA Methylation Kit. In some embodiments, the
bisulfite converted
DNA is amplified and hybridized to an array using the Illumina Infinium
HumanMethylation450
Beadchip Kit. In some embodiments, the array is imaged on an Illumina iScan
Reader. In some
embodiments, the images are processed with the GenomeStudio software
methylation module. In
some embodiments, the methylation data is analyzed using the Bioconductor lumi
software package.
See Du et al., Bioinformatics, 24(13):1547-1548 (2008).
[087] In some embodiments, DNA methylation sites are identified using
bisulfite sequencing
PCR (BSP) to determine sensitivity to EGFR inhibitors. Briefly, genomic DNA is
isolated from a cell
or tissue sample (e.g., a tumor sample or a blood sample) and is converted in
a sodium bisulfite
reaction (the bisulfite process converts unmethylated cytosine residues to
uracil) using standard assays
in the art. The bisulfite converted DNA product is amplified using primers
designed to be specific to
the bisulfite converted DNA (e.g., bisulfite-specific primers) and ligated
into vectors for
transformation into a host cell using standard assays in the art. After
selection of the host cells
containing the PCR amplified bisulfite converted DNA product of interest, the
DNA product is
isolated and sequenced to determine the sites of methylation using standard
assays in the art. In some
embodiments, the tissue sample is formalin-fixed paraffin embedded (FFPE)
tissue. In some
embodiments, the tissue sample is an FFPE tissue that has been processed for
IHC analysis; for
example, for gene expression. In some embodiments, the tissue sample is an
FFPE tissue that showed
little or no gene expression by IHC. In some embodiments, the tissue sample is
fresh frozen tissue.
In some embodiments, the DNA isolated from the tissue sample is preamplified
before bisulfite
22
CA 02849120 2014-03-18
WO 2013/055530 PCT/US2012/057777
conversion. In some embodiments, the DNA isolated from the tissue sample is
preamplified before
bisulfite conversion using the Invitrogen Superscript III One-Step RT-PCR
System with Platinum
Taq. In some embodiments, the DNA isolated from the tissue sample is
preamplified before bisulfite
conversion using a Taqman based assay. In some embodiments, the sodium
bisulfite reaction is
conducted using the Zymo EZ DNA Methylation-Gold Kit. In some embodiments, the
primers
designed to be specific to the bisulfite converted DNA are designed using
Applied Biosystems Methyl
Primer Express software. In some embodiments, the bisulfite converted DNA
product is PCR
amplified using the Invitrogen Superscript III One-Step RT-PCR System with
Platinum Taq. In
further embodiments, the PCR amplified bisulfite converted DNA product is
ligated into a vector
using the Invitrogen TOPO TA Cloning kit. In some embodiments, the host cell
is bacteria. In some
embodiments, the isolated PCR amplified bisulfite converted DNA product of
interest is sequenced
using Applied Biosystems 3730x1 DNA Analyzer. In some embodiments, the primers
designed to be
specific to the bisulfite converted DNA are designed using Qiagen PyroMark
Assay Design software.
In some embodiments, the bisulfite converted DNA product is PCR amplified
using the Invitrogen
Superscript III One-Step RT-PCR System with Platinum Taq. In further
embodiments, the PCR
amplified bisulfite converted DNA product is sequenced using Qiagen Pyromark
Q24 and analyzed
Qiagen with PyroMark software.
[088] In some embodiments, DNA methylation sites are identified using
quantitative
methylation specific PCR (QMSP) to determine sensitivity to EGFR inhibitors.
Briefly, genomic
DNA is isolated from a cell or tissue sample and is converted in a sodium
bisulfite reaction (the
bisulfite process converts unmethylated cytosine residues to uracil) using
standard assays in the art.
In some embodiments, the tissue sample is formalin-fixed paraffin embedded
(FFPE) tissue. In some
embodiments, the tissue sample is an FFPE tissue that has been processed for
IHC analysis. In some
embodiments, the tissue sample is an FFPE tissue that showed little or no gene
expression by IHC. In
some embodiments, the tissue sample is fresh frozen tissue. The bisulfite
converted DNA product is
amplified using primers designed to be specific to the bisulfite converted DNA
(e.g., quantitative
methylation specific PCR primers). The bisulfite converted DNA product is
amplified with
quantitative methylation specific PCR primers and analyzed for methylation
using standard assays in
the art. In some embodiments, the tissue sample is formalin-fixed paraffin
embedded (FFPE) tissue.
In some embodiments, the tissue sample is fresh frozen tissue. In some
embodiments, the DNA
isolated from the tissue sample is preamplified before bisulfite conversion
using the Invitrogen
Superscript III One-Step RT-PCR System with Platinum Taq. In some embodiments,
the DNA
isolated from the tissue sample is preamplified before bisulfite conversion.
In some embodiments, the
DNA isolated from the tissue sample is preamplified before bisulfite
conversion using a Taqman
based assay. In some embodiments, the sodium bisulfite reaction is conducted
using a commercially
available kit. In some embodiments, the sodium bisulfite reaction is conducted
using the Zymo EZ
23
CA 02849120 2014-03-18
WO 2013/055530 PCT/US2012/057777
DNA Methylation-Gold Kit. In some embodiments, the primers designed to be
specific to the
bisulfite converted DNA are designed using Applied Biosystems Methyl Primer
Express software. In
some embodiments, the bisulfite converted DNA is amplified using a Taqman
based assay. In some
embodiments, the bisulfite converted DNA is amplified on an Applied Biosystems
7900HT and
analyzed using Applied Biosystems SDS software.
[089] In some embodiments, the invention provides methods to determine
methylation by 1) IHC
analysis of tumor samples, followed by 2) quantitative methylation specific
PCR of DNA extracted
from the tumor tissue used in the IHC ananlysis of step 1. Briefly, coverslips
from IHC slides are
removed by one of two methods: the slide are placed in a freezer for at least
15 minutes, then the
coverslip is pried off of the microscope slide using a razor blade. Slides are
then incubated in xylene
at room temp to dissolve the mounting media. Alternatively, slides are soaked
in xylene until the
coverslip falls off This can take up to several days. All slides are taken
through a deparaffinization
procedure of 5 min xylene (x3), and 5 min 100% ethanol (x2). Tissues are
scraped off slides with
razor blades and placed in a tissue lysis buffer containing proteinase K and
incubated overnight at
56 C. In cases where tissue is still present after incubation, an extra 10 [L1
Proteinase K may be added
and the tissue is incubated for another 30 min. DNA extraction was continued;
for example, by using
a QIAamp DNA FFPE Tissue kit. DNA extracted directly from IHC slides was
subject to QMSP
analysis using the QMSP3 primers and probes as described above.
[090] In some embodiments, the bisulfite-converted DNA is sequenced by a
deep sequencing.
Deep sequencing is a process, such as direct pyrosequencing, where a sequence
is read multiple times.
Deep sequencing can be used to detect rare events such as rare mutations.
Ultra-deep sequencing of a
limited number of loci may been achieved by direct pyrosequencing of PCR
products and by
sequencing of more than 100 PCR products in a single run. A challenge in
sequencing bisulphite-
converted DNA arises from its low sequence complexity following bisulfite
conversion of cytosine
residues to thymine (uracil) residues. Reduced representation bisulphite
sequencing (RRBS) may be
introduced to reduce sequence redundancy by selecting only some regions of the
genome for
sequencing by size-fractionation of DNA fragments (Laird, PW Nature Reviews
11:195-203 (2010)).
Targeting may be accomplished by array capture or padlock capture before
sequencing. For example,
targeted capture on fixed arrays or by solution hybrid selection can enrich
for sequences targeted by a
library of DNA or RNA oligonucleotides and can be performed before or after
bisulphite conversion.
Alternatively, padlock capture provides improved enrichment efficiency by
combining the increased
annealing specificity of two tethered probes, and subsequent amplification
with universal primers
allows for a more uniform representation than amplification with locus-
specific primers.
[091] Additional methylation detection methods include, but are not limited
to, methylated CpG
island amplification (see Toyota et al., Cancer Res. 59:2307-12 (1999)) and
those described in, e.g.,
U.S. Patent Publication 2005/0069879; Rein et al., Nucleic Acids Res. 26 (10):
2255-64 (1998); Olek
24
CA 02849120 2014-03-18
WO 2013/055530
PCT/US2012/057777
et al., Nat Genet. 17(3): 275-6 (1997); Laird, PW Nature Reviews 11:195-203
(2010); and PCT
Publication No. WO 00/70090).
[092] The level of DNA methylation may be represented by a methylation
index as a ratio of the
methylated DNA copy number (cycle time) to the cycle time of a reference gene,
which amplifies
equally both methylated and unmethylated targets. A high level of DNA
methylation may be the
determined by comparison of the level of DNA methylation in a sample of non-
neoplastic cells,
particularly of the same tissue type of from peripheral blood mononuclear
cells. In a particular
embodiment, a high level of DNA methylation of the particular gene is
detectable at a higher level
compared to that in a normal cell. In another particular embodiment, a high
level of DNA
methylation is about 2X or greater compared to that in a normal cell. In a
particular embodiment, a
high level of DNA methylation is about 3X or greater compared to that in a
normal cell. In a
particular embodiment, a high level of DNA methylation is about 4X or greater
compared to that in a
normal cell. In a particular embodiment, a high level of DNA methylation is
about 5X or greater
compared to that in a normal cell. In a particular embodiment, a high level of
DNA methylation is
about 6X or greater compared to that in a normal cell. In a particular
embodiment, a high level of
DNA methylation is about 7X or greater compared to that in a normal cell. In a
particular
embodiment, a high level of DNA methylation is about 8X or greater compared to
that in a normal
cell. In a particular embodiment, a high level of DNA methylation is about 9X
or greater compared
to that in a normal cell. In a particular embodiment, a high level of DNA
methylation is about 10X
or greater compared to that in a normal cell.
[093] By "hypomethylation" is meant that a majority of the possibly methylated
CpG sites are
unmethylated. In certain embodiments, hypomethylation means that less than
50%, less than 45%,
less than 40% , less than 35%, less than 30% , less than 25%, less than 20% ,
less than 15%, less
than 10%, less than 5%, or less than 1% of the possible methylation sites in a
part of the gene is
methylated. In yet another embodiment, hypomethylation means that fewer
possible methylation
sites are methylated compared to a gene that is expressed at a normal level,
for example, in a non-
tumor cell. In another embodiment, hypomethylation means that none of the CpG
sites are
methylated.
[094] By "hypermethylation" is meant that a majority of the possibly
methylated CpG sites are
methylated. In certain embodiments, hypermethylation means that more than 50%,
more than 55%,
more than 60% , more than 65%, more than 70% , more than 75%, more than 80%,
more than 85%,
more than 90%, more than 95%, or more than 99% of the possible methylation
sites in a part of the
gene is methylated. In yet another embodiment, hypermethylation means that
more of the possible
methylation sites are methylated compared to a gene that is expressed at a
normal level, for example,
in a non-tumor cell. In another embodiment, hypermethylation means that all of
the CpG sites are
methylated.
CA 02849120 2014-03-18
WO 2013/055530
PCT/US2012/057777
10951 In some embodiments, the expression of a biomarker in a cell is
determined by evaluating
mRNA in a cell. Methods for the evaluation of mRNAs in cells are well known
and include, for
example, hybridization assays using complementary DNA probes (such as in situ
hybridization using
labeled riboprobes specific for the one or more genes, Northern blot and
related techniques) and
various nucleic acid amplification assays (such as RT-PCR using complementary
primers specific for
one or more of the genes, and other amplification type detection methods, such
as, for example,
branched DNA, SISBA, TMA and the like). In some embodiments, the expression of
a biomarker in
a test sample is compared to a reference sample. For example, the test sample
may be a tumor tissue
sample and the reference sample may be from normal tissue or cells such as
PBMCs.
[096] Samples from mammals can be conveniently assayed for mRNAs using
Northern, dot blot
or PCR analysis. In addition, such methods can include one or more steps that
allow one to determine
the levels of target mRNA in a biological sample (e.g., by simultaneously
examining the levels a
comparative control mRNA sequence of a "housekeeping" gene such as an actin
family member).
Optionally, the sequence of the amplified target cDNA can be determined.
[097] Optional methods of the invention include protocols which examine or
detect mRNAs,
such as target mRNAs, in a tissue or cell sample by microarray technologies.
Using nucleic acid
microarrays, test and control mRNA samples from test and control tissue
samples are reverse
transcribed and labeled to generate cDNA probes. The probes are then
hybridized to an array of
nucleic acids immobilized on a solid support. The array is configured such
that the sequence and
position of each member of the array is known. For example, a selection of
genes whose expression
correlates with increased or reduced clinical benefit of anti-angiogenic
therapy may be arrayed on a
solid support. Hybridization of a labeled probe with a particular array member
indicates that the
sample from which the probe was derived expresses that gene.
[098] According to some embodiments, presence and/or level/amount is
measured by observing
protein expression levels of an aforementioned gene. In certain embodiments,
the method comprises
contacting the biological sample with antibodies to a biomarker described
herein under conditions
permissive for binding of the biomarker, and detecting whether a complex is
formed between the
antibodies and biomarker. Such method may be an in vitro or in vivo method.
[099] In certain embodiments, the presence and/or leveVamount of biomarker
proteins in a
sample are examined using IHC and staining protocols. IHC staining of tissue
sections has been
shown to be a reliable method of determining or detecting presence of proteins
in a sample. In one
aspect, level of biomarker is determined using a method comprising: (a)
performing IHC analysis of a
sample (such as a subject cancer sample) with an antibody; and b) determining
level of a biomarker in
the sample. In some embodiments, IHC staining intensity is determined relative
to a reference value.
26
CA 02849120 2014-03-18
WO 2013/055530
PCT/US2012/057777
[0100] IHC may be performed in combination with additional techniques such
as morphological
staining and/or fluorescence in-situ hybridization. Two general methods of IHC
are available; direct
and indirect assays. According to the first assay, binding of antibody to the
target antigen is
determined directly. This direct assay uses a labeled reagent, such as a
fluorescent tag or an enzyme-
labeled primary antibody, which can be visualized without further antibody
interaction. In a typical
indirect assay, unconjugated primary antibody binds to the antigen and then a
labeled secondary
antibody binds to the primary antibody. Where the secondary antibody is
conjugated to an enzymatic
label, a chromogenic or fluorogenic substrate is added to provide
visualization of the antigen. Signal
amplification occurs because several secondary antibodies may react with
different epitopes on the
primary antibody.
101011 The primary and/or secondary antibody used for IHC typically will be
labeled with a
detectable moiety. Numerous labels are available which can be generally
grouped into the following
categories: (a) Radioisotopes, such as 35,
14C, 125-r,
1 3H, and 1311; (b) colloidal gold particles; (c)
fluorescent labels including, but are not limited to, rare earth chelates
(europium chelates), Texas Red,
rhodamine, fluorescein, dansyl, Lissamine, umbelliferone, phycocrytherin,
phycocyanin, or
commercially available fluorophores such SPECTRUM ORANGE7 and SPECTRUM GREEN7
and/or derivatives of any one or more of the above; (d) various enzyme-
substrate labels are available
and U.S. Patent No. 4,275,149 provides a review of some of these. Examples of
enzymatic labels
include luciferases (e.g., firefly luciferase and bacterial luciferase; U.S.
Patent No. 4,737,456),
luciferin, 2,3-dihydrophthalazinediones, malate dehydrogenase, urease,
peroxidase such as
horseradish peroxidase (HRPO), alkaline phosphatase, I3-galactosidase,
glucoamylase, lysozyme,
saccharide oxidases (e.g., glucose oxidase, galactose oxidase, and glucose-6-
phosphate
dehydrogenase), heterocyclic oxidases (such as uricase and xanthine oxidase),
lactoperoxidase,
microperoxidase, and the like.
[0102] Examples of enzyme-substrate combinations include, for example,
horseradish peroxidase
(HRPO) with hydrogen peroxidase as a substrate; alkaline phosphatase (AP) with
para-Nitrophenyl
phosphate as chromogenic substrate; and P-D-galactosidase (I3-D-Gal) with a
chromogenic substrate
(e.g., p-nitropheny1-13-D-galactosidase) or fluorogenic substrate (e.g., 4-
methylumbellifery1-13-D-
galactosidase). For a general review of these, see U.S. Patent Nos. 4,275,149
and 4,318,980.
[0103] Specimens thus prepared may be mounted and coverslipped. Slide
evaluation is then
determined, e.g., using a microscope, and staining intensity criteria,
routinely used in the art, may be
employed. In some embodiments, a staining pattern score of about 1+ or higher
is diagnostic and/or
prognostic. In certain embodiments, a staining pattern score of about 2+ or
higher in an IHC assay is
diagnostic and/or prognostic. In other embodiments, a staining pattern score
of about 3 or higher is
diagnostic and/or prognostic. In one embodiment, it is understood that when
cells and/or tissue from a
tumor or colon adenoma are examined using IHC, staining is generally
determined or assessed in
27
CA 02849120 2014-03-18
WO 2013/055530 PCT/US2012/057777
tumor cell and/or tissue (as opposed to stromal or surrounding tissue that may
be present in the
sample).
[0104] In alternative methods, the sample may be contacted with an antibody
specific for the
biomarker under conditions sufficient for an antibody-biomarker complex to
form, and then detecting
the complex. The presence of the biomarker may be detected in a number of
ways, such as by Western
blotting and ELISA procedures for assaying a wide variety of tissues and
samples, including plasma
or serum. A wide range of immunoassay techniques using such an assay format
are available, see,
e.g., U.S. Pat. Nos. 4,016,043, 4,424,279 and 4,018,653. These include both
single-site and two-site or
"sandwich" assays of the non-competitive types, as well as in the traditional
competitive binding
assays. These assays also include direct binding of a labeled antibody to a
target biomarker.
[0105] Presence and/or level/amount of a selected biomarker in a tissue or
cell sample may also
be examined by way of functional or activity-based assays. For instance, if
the biomarker is an
enzyme, one may conduct assays known in the art to determine or detect the
presence of the given
enzymatic activity in the tissue or cell sample.
[0106] In certain embodiments, the samples are normalized for both
differences in the amount of
the biomarker assayed and variability in the quality of the samples used, and
variability between assay
runs. Such normalization may be accomplished by detecting and incorporating
the level of certain
normalizing biomarkers, including well known housekeeping genes, such as ACTB.
Alternatively,
normalization can be based on the mean or median signal of all of the assayed
genes or a large subset
thereof (global normalization approach). On a gene-by-gene basis, measured
normalized amount of a
subject tumor mRNA or protein is compared to the amount found in a reference
set. Normalized
expression levels for each mRNA or protein per tested tumor per subject can be
expressed as a
percentage of the expression level measured in the reference set. The presence
and/or expression
level/amount measured in a particular subject sample to be analyzed will fall
at some percentile within
this range, which can be determined by methods well known in the art.
[0107] In certain embodiments, relative expression level of a gene is
determined as follows:
[0108] Relative expression genel samplel = 2 exp (Ct housekeeping gene ¨ Ct
genel) with Ct
determined in a sample.
[0109] Relative expression genel reference RNA = 2 exp (Ct housekeeping
gene ¨ Ct genel) with
Ct determined in the reference sample.
[0110] Normalized relative expression genel samplel = (relative expression
genel samplel /
relative expression genel reference RNA) x 100
[0111] Ct is the threshold cycle. The Ct is the cycle number at which the
fluorescence generated
within a reaction crosses the threshold line.
28
CA 02849120 2014-03-18
WO 2013/055530 PCT/US2012/057777
[0112] All experiments are normalized to a reference RNA, which is a
comprehensive mix of
RNA from various tissue sources (e.g., reference RNA #636538 from Clontech,
Mountain View, CA).
Identical reference RNA is included in each qRT-PCR run, allowing comparison
of results between
different experimental runs.
[0113] In one embodiment, the sample is a clinical sample. In another
embodiment, the sample is
used in a diagnostic assay. In some embodiments, the sample is obtained from a
primary or metastatic
tumor. Tissue biopsy is often used to obtain a representative piece of tumor
tissue. Alternatively,
tumor cells can be obtained indirectly in the form of tissues or fluids that
are known or thought to
contain the tumor cells of interest. For instance, samples of lung cancer
lesions may be obtained by
resection, bronchoscopy, fine needle aspiration, bronchial brushings, or from
sputum, pleural fluid or
blood. In some embodiments, the sample includes circulating tumor cells; for
example, circulating
cancer cells in blood, urine or sputum. Genes or gene products can be detected
from cancer or tumor
tissue or from other body samples such as urine, sputum, serum or plasma. The
same techniques
discussed above for detection of target genes or gene products in cancerous
samples can be applied to
other body samples. Cancer cells may be sloughed off from cancer lesions and
appear in such body
samples. By screening such body samples, a simple early diagnosis can be
achieved for these cancers.
In addition, the progress of therapy can be monitored more easily by testing
such body samples for
target genes or gene products.
[0114] In certain embodiments, a reference sample, reference cell,
reference tissue, control
sample, control cell, or control tissue is a single sample or combined
multiple samples from the same
subject or individual that are obtained at one or more different time points
than when the test sample
is obtained. For example, a reference sample, reference cell, reference
tissue, control sample, control
cell, or control tissue is obtained at an earlier time point from the same
subject or individual than
when the test sample is obtained. Such reference sample, reference cell,
reference tissue, control
sample, control cell, or control tissue may be useful if the reference sample
is obtained during initial
diagnosis of cancer and the test sample is later obtained when the cancer
becomes metastatic.
[0115] In certain embodiments, a reference sample, reference cell,
reference tissue, control
sample, control cell, or control tissue is a combined multiple samples from
one or more healthy
individuals who are not the subject or individual. In certain embodiments, a
reference sample,
reference cell, reference tissue, control sample, control cell, or control
tissue is a combined multiple
samples from one or more individuals with a disease or disorder (e.g., cancer)
who are not the subject
or individual. In certain embodiments, a reference sample, reference cell,
reference tissue, control
sample, control cell, or control tissue is pooled RNA samples from normal
tissues or pooled plasma or
serum samples from one or more individuals who are not the subject or
individual. In certain
embodiments, a reference sample, reference cell, reference tissue, control
sample, control cell, or
29
CA 02849120 2014-03-18
WO 2013/055530 PCT/US2012/057777
control tissue is pooled RNA samples from tumor tissues or pooled plasma or
serum samples from
one or more individuals with a disease or disorder (e.g., cancer) who are not
the subject or individual.
[0116] In the methods of this invention, the tissue samples may be bodily
fluids or excretions such
as blood, urine, saliva, stool, pleural fluid, lymphatic fluid, sputum,
ascites, prostatic fluid,
cerebrospinal fluid (CSF), or any other bodily secretion or derivative thereof
By blood it is meant to
include whole blood, plasma, serum or any derivative of blood. Assessment of
tumor epithelial or
mesenchymal biomarkers in such bodily fluids or excretions can sometimes be
preferred in
circumstances where an invasive sampling method is inappropriate or
inconvenient.
[0117] In the methods of this invention, the tumor cell can be a lung
cancer tumor cell (e.g. non-
small cell lung cancer (NSCLC)), a pancreatic cancer tumor cell, a breast
cancer tumor cell, a head
and neck cancer tumor cell, a gastric cancer tumor cell, a colon cancer tumor
cell, an ovarian cancer
tumor cell, or a tumor cell from any of a variety of other cancers as
described herein below. The
tumor cell is preferably of a type known to or expected to express EGFR, as do
all tumor cells from
solid tumors. The EGFR kinase can be wild type or a mutant form.
[0118] In the methods of this invention, the tumor can be a lung cancer
tumor (e.g. non-small cell
lung cancer (NSCLC)), a pancreatic cancer tumor, a breast cancer tumor, a head
and neck cancer
tumor, a gastric cancer tumor, a colon cancer tumor, an ovarian cancer tumor,
or a tumor from any of
a variety of other cancers as described herein below. The tumor is preferably
of a type whose cells are
known to or expected to express EGFR, as do all solid tumors. The EGFR can be
wild type or a
mutant form.
Inhibitors and Pharmaceutical Compositions
[0119] Exemplary EGFR kinase inhibitors suitable for use in the invention
include, for example
quinazoline EGFR kinase inhibitors, pyrido-pyrimidine EGFR kinase inhibitors,
pyrimido-pyrimidine
EGFR kinase inhibitors, pyrrolo-pyrimidine EGFR kinase inhibitors, pyrazolo-
pyrimidine EGFR
kinase inhibitors, phenylamino-pyrimidine EGFR kinase inhibitors, oxindole
EGFR kinase inhibitors,
indolocarbazole EGFR kinase inhibitors, phthalazine EGFR kinase inhibitors,
isoflavone EGFR
kinase inhibitors, quinalone EGFR kinase inhibitors, and tyrphostin EGFR
kinase inhibitors, such as
those described in the following patent publications, and all pharmaceutically
acceptable salts and
solvates of the EGFR kinase inhibitors: International Patent Publication Nos.
WO 96/33980, WO
96/30347, WO 97/30034, WO 97/30044, WO 97/38994, WO 97/49688, WO 98/02434, WO
97/38983, WO 95/19774, WO 95/19970, WO 97/13771, WO 98/02437, WO 98/02438, WO
97/32881, WO 98/33798, WO 97/32880, WO 97/3288, WO 97/02266, WO 97/27199, WO
98/07726,
WO 97/34895, WO 96/31510, WO 98/14449, WO 98/14450, WO 98/14451, WO 95/09847,
WO
97/19065, WO 98/17662, WO 99/35146, WO 99/35132, WO 99/07701, and WO 92/20642;
European
Patent Application Nos. EP 520722, EP 566226, EP 787772, EP 837063, and EP
682027; U.S. Patent
CA 02849120 2014-03-18
WO 2013/055530
PCT/US2012/057777
Nos. 5,747,498, 5,789,427, 5,650,415, and 5,656,643; and German Patent
Application No. DE
19629652. Additional non-limiting examples of low molecular weight EGFR kinase
inhibitors include
any of the EGFR kinase inhibitors described in Traxler, P., 1998, Exp. Opin.
Ther. Patents
8(12):1599-1625.
[0120]
Specific preferred examples of low molecular weight EGFR kinase inhibitors
that can be
used according to the present invention include [6,7-bis(2-methoxyethoxy)-4-
quinazolin-4-y1]-(3-
ethynylphenyl) amine (also known as OSI-774, erlotinib, or TARCEVATm
(erlotinib HC1); OSI
Pharmaceuticals/Genentech/Roche) (U.S. Pat. No. 5,747,498; International
Patent Publication No.
WO 01/34574, and Moyer, J.D. et al. (1997) Cancer Res. 57:4838-4848); CI-1033
(formerly known
as PD183805; Pfizer) (Sherwood et al., 1999, Proc. Am. Assoc. Cancer Res.
40:723); PD-158780
(Pfizer); AG-1478 (University of California); CGP-59326 (Novartis); PKI-166
(Novartis); EKB-569
(Wyeth); GW-2016 (also known as GW-572016 or lapatinib ditosylate ; GSK); and
gefitinib (also
known as ZD1839 or IRESSATM; Astrazeneca) (Woodburn et al., 1997, Proc. Am.
Assoc. Cancer
Res. 38:633). A particularly preferred low molecular weight EGFR kinase
inhibitor that can be used
according to the present invention is [6,7-bis(2-methoxyethoxy)-4-quinazolin-4-
y1]-(3-ethynylphenyl)
amine (i.e. erlotinib), its hydrochloride salt (i.e. erlotinib HC1,
TARCEVATm), or other salt forms (e.g.
erlotinib mesylate).
[0121] Antibody-based EGFR kinase inhibitors include any anti-EGFR antibody or
antibody
fragment that can partially or completely block EGFR activation by its natural
ligand. Non-limiting
examples of antibody-based EGFR kinase inhibitors include those described in
Modjtahedi, H., et al.,
1993, Br. J. Cancer 67:247-253; Teramoto, T., et al., 1996, Cancer 77:639-645;
Goldstein et al., 1995,
Clin. Cancer Res. 1:1311-1318; Huang, S. M., et al., 1999, Cancer Res.
15:59(8):1935-40; and Yang,
X., et al., 1999, Cancer Res. 59:1236-1243. Thus, the EGFR kinase inhibitor
can be the monoclonal
antibody Mab E7.6.3 (Yang, X.D. et al. (1999) Cancer Res. 59:1236-43), or Mab
C225 (ATCC
Accession No. HB-8508), or an antibody or antibody fragment having the binding
specificity thereof
Suitable monoclonal antibody EGFR kinase inhibitors include, but are not
limited to, IMC-C225 (also
known as cetuximab or ERBITUXTm; Imclone Systems), ABX-EGF (Abgenix), EMD
72000 (Merck
KgaA, Darmstadt), RH3 (York Medical Bioscience Inc.), and MDX-447 (Medarex/
Merck KgaA).
[0122] The methods of this invention can be extended to those compounds which
inhibit EGFR
and an additional target. These compounds are referred to herein as
"bispecific inhibitors". In one
embodiment, the bispecific inhibitor is a bispecific HER3/EGFR, EGFR/HER2,
EGFR/ HER4 or
EGFR c- Met, inhibitor. In one embodiment, the bispecific inhibitor is a
bispecific antibody. In one
embodiment, the bispecific inhibitor is a bispecific antibody which comprises
an antigen binding
domain that specifically binds to EGFR and a second target. In one embodiment,
the bispecific
inhibitor is a bispecific antibody which comprises an antigen binding domain
that specifically binds to
HER3 and EGFR. In one embodiment, the bispecific HER3/EGFR inhibitor is a
bispecific antibody
31
CA 02849120 2014-03-18
WO 2013/055530 PCT/US2012/057777
which comprises two identical antigen binding domains. Such antibodies are
described in US
8,193,321, 20080069820, W02010108127, U520100255010 and Schaefer et al, Cancer
Cell, 20: 472-
486 (2011). In one embodiment, the bispecific HER2/EGFR is lapatinib/GW572016.
[0123] Additional antibody-based inhibitors can be raised according to known
methods by
administering the appropriate antigen or epitope to a host animal selected,
e.g., from pigs, cows,
horses, rabbits, goats, sheep, and mice, among others. Various adjuvants known
in the art can be used
to enhance antibody production.
[0124] Although antibodies useful in practicing the invention can be
polyclonal, monoclonal
antibodies are preferred. Monoclonal antibodies can be prepared and isolated
using any technique that
provides for the production of antibody molecules by continuous cell lines in
culture. Techniques for
production and isolation include but are not limited to the hybridoma
technique originally described
by Kohler and Milstein (Nature, 1975, 256: 495-497); the human B-cell
hybridoma technique (Kosbor
et al., 1983, Immunology Today 4:72; Cote et al., 1983, Proc. Nati. Acad. Sci.
USA 80: 2026-2030);
and the EBV-hybridoma technique (Cole et al, 1985, Monoclonal Antibodies and
Cancer Therapy,
Alan R. Liss, Inc., pp. 77-96).
[0125] Alternatively, techniques described for the production of single
chain antibodies (see, e.g.,
U.S. Patent No. 4,946,778) can be adapted to produce single chain antibodies
with desired specificity.
Antibody-based inhibitors useful in practicing the present invention also
include antibody fragments
including but not limited to F(ab')<sub>2</sub> fragments, which can be generated by
pepsin digestion of an
intact antibody molecule, and Fab fragments, which can be generated by
reducing the disulfide
bridges of the F(ab')<sub>2</sub> fragments. Alternatively, Fab and/or scFv
expression libraries can be
constructed (see, e.g., Huse et al., 1989, Science 246: 1275-1281) to allow
rapid identification of
fragments having the desired specificity.
[0126] Techniques for the production and isolation of monoclonal antibodies
and antibody
fragments are well-known in the art, and are described in Harlow and Lane,
1988, Antibodies: A
Laboratory Manual, Cold Spring Harbor Laboratory, and in J. W. Goding, 1986,
Monoclonal
Antibodies: Principles and Practice, Academic Press, London. Humanized anti-
EGFR antibodies and
antibody fragments can also be prepared according to known techniques such as
those described in
Vaughn, T. J. et al., 1998, Nature Biotech. 16:535-539 and references cited
therein, and such
antibodies or fragments thereof are also useful in practicing the present
invention.
[0127] Inhibitors for use in the present invention can alternatively be
based on antisense
oligonucleotide constructs. Anti-sense oligonucleotides, including anti-sense
RNA molecules and
anti-sense DNA molecules, would act to directly block the translation of
target mRNA by binding
thereto and thus preventing protein translation or increasing mRNA
degradation, thus decreasing the
level of the target protein, and thus activity, in a cell. For example,
antisense oligonucleotides of at
least about 15 bases and complementary to unique regions of the mRNA
transcript sequence encoding
32
CA 02849120 2014-03-18
WO 2013/055530 PCT/US2012/057777
EGFR or HER2 can be synthesized, e.g., by conventional phosphodiester
techniques and administered
by e.g., intravenous injection or infusion. Methods for using antisense
techniques for specifically
inhibiting gene expression of genes whose sequence is known are well known in
the art (e.g. see U.S.
Patent Nos. 6,566,135; 6,566,131; 6,365,354; 6,410,323; 6,107,091; 6,046,321;
and 5,981,732).
[0128] Small inhibitory RNAs (siRNAs) can also function as inhibitors for
use in the present
invention. Target gene expression can be reduced by contacting the tumor,
subject or cell with a small
double stranded RNA (dsRNA), or a vector or construct causing the production
of a small double
stranded RNA, such that expression of the target gene is specifically
inhibited (i.e. RNA interference
or RNAi). Methods for selecting an appropriate dsRNA or dsRNA-encoding vector
are well known in
the art for genes whose sequence is known (e.g. see Tuschi, T., et al. (1999)
Genes Dev. 13(24):3191-
3197; Elbashir, S.M. et al. (2001) Nature 411:494-498; Hannon, G.J. (2002)
Nature 418:244-251;
McManus, M.T. and Sharp, P. A. (2002) Nature Reviews Genetics 3:737-747;
Bremmelkamp, T.R. et
al. (2002) Science 296:550-553; U.S. Patent Nos. 6,573,099 and 6,506,559; and
International Patent
Publication Nos. WO 01/36646, WO 99/32619, and WO 01/68836).
[0129] Ribozymes can also function as inhibitors for use in the present
invention. Ribozymes are
enzymatic RNA molecules capable of catalyzing the specific cleavage of RNA.
The mechanism of
ribozyme action involves sequence specific hybridization of the ribozyme
molecule to complementary
target RNA, followed by endonucleolytic cleavage. Engineered hairpin or
hammerhead motif
ribozyme molecules that specifically and efficiently catalyze endonucleolytic
cleavage of mRNA
sequences are thereby useful within the scope of the present invention.
Specific ribozyme cleavage
sites within any potential RNA target are initially identified by scanning the
target molecule for
ribozyme cleavage sites, which typically include the following sequences, GUA,
GUU, and GUC.
Once identified, short RNA sequences of between about 15 and 20
ribonucleotides corresponding to
the region of the target gene containing the cleavage site can be evaluated
for predicted structural
features, such as secondary structure, that can render the oligonucleotide
sequence unsuitable. The
suitability of candidate targets can also be evaluated by testing their
accessibility to hybridization with
complementary oligonucleotides, using, e.g., ribonuclease protection assays.
[0130] Both antisense oligonucleotides and ribozymes useful as inhibitors
can be prepared by
known methods. These include techniques for chemical synthesis such as, e.g.,
by solid phase
phosphoramadite chemical synthesis. Alternatively, anti-sense RNA molecules
can be generated by in
vitro or in vivo transcription of DNA sequences encoding the RNA molecule.
Such DNA sequences
can be incorporated into a wide variety of vectors that incorporate suitable
RNA polymerase
promoters such as the T7 or 5P6 polymerase promoters. Various modifications to
the oligonucleotides
of the invention can be introduced as a means of increasing intracellular
stability and half-life.
Possible modifications include but are not limited to the addition of flanking
sequences of
ribonucleotides or deoxyribonucleotides to the 5' and/or 3' ends of the
molecule, or the use of
33
CA 02849120 2014-03-18
WO 2013/055530 PCT/US2012/057777
phosphorothioate or 2'-0-methyl rather than phosphodiesterase linkages within
the oligonucleotide
backbone.
[0131] In the context of the methods of treatment of this invention,
inhibitors (such as an EGFR
inhibitor) are used as a composition comprised of a pharmaceutically
acceptable carrier and a non-
toxic therapeutically effective amount of an EGFR kinase inhibitor compound
(including
pharmaceutically acceptable salts thereof).
[0132] The term "pharmaceutically acceptable salts" refers to salts
prepared from pharmaceutically
acceptable non-toxic bases or acids. When a compound of the present invention
is acidic, its
corresponding salt can be conveniently prepared from pharmaceutically
acceptable non-toxic bases,
including inorganic bases and organic bases. Salts derived from such inorganic
bases include
aluminum, ammonium, calcium, copper (cupric and cuprous), ferric, ferrous,
lithium, magnesium,
manganese (manganic and manganous), potassium, sodium, zinc and the like
salts. Particularly
preferred are the ammonium, calcium, magnesium, potassium and sodium salts.
Salts derived from
pharmaceutically acceptable organic non-toxic bases include salts of primary,
secondary, and tertiary
amines, as well as cyclic amines and substituted amines such as naturally
occurring and synthesized
substituted amines. Other pharmaceutically acceptable organic non-toxic bases
from which salts can
be formed include ion exchange resins such as, for example, arginine, betaine,
caffeine, choline,
N',N'-dibenzylethylenediamine, diethylamine, 2-diethylaminoethanol, 2-
dimethylaminoethanol,
ethanolamine, ethylenediamine, N-ethylmorpholine, N-ethylpiperidine,
glucamine, glucosamine,
histidine, hydrabamine, isopropylamine, lysine, methylglucamine, morpholine,
piperazine, piperidine,
polyamine resins, procaine, purines, theobromine, triethylameine,
trimethylamine, tripropylamine,
tromethamine and the like.
[0133] When a compound used in the present invention is basic, its
corresponding salt can be
conveniently prepared from pharmaceutically acceptable non-toxic acids,
including inorganic and
organic acids. Such acids include, for example, acetic, benzenesulfonic,
benzoic, camphorsulfonic,
citric, ethanesulfonic, fumaric, gluconic, glutamic, hydrobromic,
hydrochloric, isethionic, lactic,
maleic, malic, mandelic, methanesulfonic, mucic, nitric, pamoic, pantothenic,
phosphoric, succinic,
sulfuric, tartaric, p-toluenesulfonic acid and the like. Particularly
preferred are citric, hydrobromic,
hydrochloric, maleic, phosphoric, sulfuric and tartaric acids.
[0134] Pharmaceutical compositions used in the present invention comprising
an inhibitor
compound (including pharmaceutically acceptable salts thereof) as active
ingredient, can include a
pharmaceutically acceptable carrier and optionally other therapeutic
ingredients or adjuvants. Other
therapeutic agents may include those cytotoxic, chemotherapeutic or anti-
cancer agents, or agents
which enhance the effects of such agents, as listed above. The compositions
include compositions
suitable for oral, rectal, topical, and parenteral (including subcutaneous,
intramuscular, and
intravenous) administration, although the most suitable route in any given
case will depend on the
particular host, and nature and severity of the conditions for which the
active ingredient is being
34
CA 02849120 2014-03-18
WO 2013/055530 PCT/US2012/057777
administered. The pharmaceutical compositions may be conveniently presented in
unit dosage form
and prepared by any of the methods well known in the art of pharmacy
[0135] In practice, the inhibitor compounds (including pharmaceutically
acceptable salts thereof)
of this invention can be combined as the active ingredient in intimate
admixture with a pharmaceutical
carrier according to conventional pharmaceutical compounding techniques. The
carrier may take a
wide variety of forms depending on the form of preparation desired for
administration, e.g. oral or
parenteral (including intravenous). Thus, the pharmaceutical compositions of
the present invention
can be presented as discrete units suitable for oral administration such as
capsules, cachets or tablets
each containing a predetermined amount of the active ingredient. Further, the
compositions can be
presented as a powder, as granules, as a solution, as a suspension in an
aqueous liquid, as a non-
aqueous liquid, as an oil-in-water emulsion, or as a water-in-oil liquid
emulsion. In addition to the
common dosage forms set out above, an inhibitor compound (including
pharmaceutically acceptable
salts of each component thereof) may also be administered by controlled
release means and/or
delivery devices. The combination compositions may be prepared by any of the
methods of
pharmacy. In general, such methods include a step of bringing into association
the active ingredients
with the carrier that constitutes one or more necessary ingredients. In
general, the compositions are
prepared by uniformly and intimately admixing the active ingredient with
liquid carriers or finely
divided solid carriers or both. The product can then be conveniently shaped
into the desired
presentation.
[0136] An inhibitor compound (including pharmaceutically acceptable salts
thereof) used in this
invention, can also be included in pharmaceutical compositions in combination
with one or more
other therapeutically active compounds. Other therapeutically active compounds
may include those
cytotoxic, chemotherapeutic or anti-cancer agents, or agents which enhance the
effects of such agents,
as listed above.
[0137] Thus in one embodiment of this invention, the pharmaceutical
composition can comprise an
inhibitor compound in combination with an anticancer agent, wherein the anti-
cancer agent is a
member selected from the group consisting of alkylating drugs,
antimetabolites, microtubule
inhibitors, podophyllotoxins, antibiotics, nitrosoureas, hormone therapies,
kinase inhibitors, activators
of tumor cell apoptosis, and antiangiogenic agents.
[0138] The pharmaceutical carrier employed can be, for example, a solid,
liquid, or gas. Examples
of solid carriers include lactose, terra alba, sucrose, talc, gelatin, agar,
pectin, acacia, magnesium
stearate, and stearic acid. Examples of liquid carriers are sugar syrup,
peanut oil, olive oil, and water.
Examples of gaseous carriers include carbon dioxide and nitrogen.
[0139] In preparing the compositions for oral dosage form, any convenient
pharmaceutical media
may be employed. For example, water, glycols, oils, alcohols, flavoring
agents, preservatives,
coloring agents, and the like may be used to form oral liquid preparations
such as suspensions, elixirs
and solutions; while carriers such as starches, sugars, microcrystalline
cellulose, diluents, granulating
CA 02849120 2014-03-18
WO 2013/055530
PCT/US2012/057777
agents, lubricants, binders, disintegrating agents, and the like may be used
to form oral solid
preparations such as powders, capsules and tablets. Because of their ease of
administration, tablets
and capsules are the preferred oral dosage units whereby solid pharmaceutical
carriers are employed.
Optionally, tablets may be coated by standard aqueous or nonaqueous
techniques.
[0140] A tablet containing the composition used for this invention may be
prepared by
compression or molding, optionally with one or more accessory ingredients or
adjuvants.
Compressed tablets may be prepared by compressing, in a suitable machine, the
active ingredient in a
free-flowing form such as powder or granules, optionally mixed with a binder,
lubricant, inert diluent,
surface active or dispersing agent. Molded tablets may be made by molding in a
suitable machine, a
mixture of the powdered compound moistened with an inert liquid diluent. Each
tablet preferably
contains from about 0.05mg to about 5g of the active ingredient and each
cachet or capsule preferably
contains from about 0.05mg to about 5g of the active ingredient.
[0141] For example, a formulation intended for the oral administration to
humans may contain
from about 0.5mg to about 5g of active agent, compounded with an appropriate
and convenient
amount of carrier material that may vary from about 5 to about 95 percent of
the total composition.
Unit dosage forms will generally contain between from about lmg to about 2g of
the active
ingredient, typically 25mg, 50mg, 100mg, 200mg, 300mg, 400mg, 500mg, 600mg,
800mg, or
1000mg.
[0142] Pharmaceutical compositions used in the present invention suitable
for parenteral
administration may be prepared as solutions or suspensions of the active
compounds in water. A
suitable surfactant can be included such as, for example,
hydroxypropylcellulose. Dispersions can
also be prepared in glycerol, liquid polyethylene glycols, and mixtures
thereof in oils. Further, a
preservative can be included to prevent the detrimental growth of
microorganisms.
[0143] Pharmaceutical compositions used in the present invention suitable
for injectable use
include sterile aqueous solutions or dispersions. Furthermore, the
compositions can be in the form of
sterile powders for the extemporaneous preparation of such sterile injectable
solutions or dispersions.
In all cases, the final injectable form must be sterile and must be
effectively fluid for easy
syringability. The pharmaceutical compositions must be stable under the
conditions of manufacture
and storage; thus, preferably should be preserved against the contaminating
action of microorganisms
such as bacteria and fungi. The carrier can be a solvent or dispersion medium
containing, for
example, water, ethanol, polyol (e.g., glycerol, propylene glycol and liquid
polyethylene glycol),
vegetable oils, and suitable mixtures thereof
[0144] Pharmaceutical compositions for the present invention can be in a
form suitable for topical
sue such as, for example, an aerosol, cream, ointment, lotion, dusting powder,
or the like. Further, the
compositions can be in a form suitable for use in transdermal devices. These
formulations may be
prepared, utilizing an inhibitor compound (including pharmaceutically
acceptable salts thereof), via
conventional processing methods. As an example, a cream or ointment is
prepared by admixing
36
CA 02849120 2014-03-18
WO 2013/055530 PCT/US2012/057777
hydrophilic material and water, together with about 5wt% to about lOwt% of the
compound, to
produce a cream or ointment having a desired consistency.
[0145] Pharmaceutical compositions for this invention can be in a form
suitable for rectal
administration wherein the carrier is a solid. It is preferable that the
mixture forms unit dose
suppositories. Suitable carriers include cocoa butter and other materials
commonly used in the art.
The suppositories may be conveniently formed by first admixing the composition
with the softened or
melted carrier(s) followed by chilling and shaping in molds.
[0146] In addition to the aforementioned carrier ingredients, the
pharmaceutical formulations
described above may include, as appropriate, one or more additional carrier
ingredients such as
diluents, buffers, flavoring agents, binders, surface-active agents,
thickeners, lubricants, preservatives
(including anti-oxidants) and the like. Furthermore, other adjuvants can be
included to render the
formulation isotonic with the blood of the intended recipient. Compositions
containing an inhibitor
compound (including pharmaceutically acceptable salts thereof) may also be
prepared in powder or
liquid concentrate form.
[0147] Dosage levels for the compounds used for practicing this invention
will be approximately as
described herein, or as described in the art for these compounds. It is
understood, however, that the
specific dose level for any particular patient will depend upon a variety of
factors including the age,
body weight, general health, sex, diet, time of administration, route of
administration, rate of
excretion, drug combination and the severity of the particular disease
undergoing therapy.
[0148] Many alternative experimental methods known in the art may be
successfully substituted
for those specifically described herein in the practice of this invention, as
for example described in
many of the excellent manuals and textbooks available in the areas of
technology relevant to this
invention (e.g. Using Antibodies, A Laboratory Manual, edited by Harlow, E.
and Lane, D., 1999,
Cold Spring Harbor Laboratory Press, (e.g. ISBN 0-87969-544-7); Roe B.A. et.
al. 1996, DNA
Isolation and Sequencing (Essential Techniques Series), John Wiley &
Sons.(e.g. ISBN 0-471-97324-
0); Methods in Enzymology: Chimeric Genes and Proteins", 2000, ed. J.Abelson,
M.Simon, S.Emr,
J.Thorner. Academic Press; Molecular Cloning: a Laboratory Manual, 2001, 3rd
Edition, by Joseph
Sambrook and Peter MacCallum, (the former Maniatis Cloning manual) (e.g. ISBN
0-87969-577-3);
Current Protocols in Molecular Biology, Ed. Fred M. Ausubel, et. al. John
Wiley & Sons (e.g. ISBN
0-471-50338-X); Current Protocols in Protein Science, Ed. John E. Coligan,
John Wiley & Sons (e.g.
ISBN 0-471-11184-8); and Methods in Enzymology: Guide to protein Purification,
1990, Vol. 182,
Ed. Deutscher, M.P., Acedemic Press, Inc. (e.g. ISBN 0-12-213585-7)), or as
described in the many
university and commercial websites devoted to describing experimental methods
in molecular
biology.
[0149] It will be appreciated by one of skill in the medical arts that the
exact manner of
administering to the patient of a therapeutically effective amount of an
inhibitor as described herein
(for example an EGFR kinase inhibitor, bispecific EGFR kinase inhibitor, or
HER2 inhibitor)
37
CA 02849120 2014-03-18
WO 2013/055530 PCT/US2012/057777
following a diagnosis of a patient's likely responsiveness to the inhibitor
will be at the discretion of
the attending physician. The mode of administration, including dosage,
combination with other anti-
cancer agents, timing and frequency of administration, and the like, may be
affected by the diagnosis
of a patient's likely responsiveness to the inhibitor, as well as the
patient's condition and history.
Thus, even patients diagnosed with tumors predicted to be relatively
insensitive to the type of
inhibitor may still benefit from treatment with such inhibitor, particularly
in combination with other
anti-cancer agents, or agents that may alter a tumor's sensitivity to the
inhibitor.
[0150] For purposes of the present invention, "co-administration of' and
"co-administering" an
inhibitor with an additional anti-cancer agent (both components referred to
hereinafter as the "two
active agents") refer to any administration of the two active agents, either
separately or together,
where the two active agents are administered as part of an appropriate dose
regimen designed to
obtain the benefit of the combination therapy. Thus, the two active agents can
be administered either
as part of the same pharmaceutical composition or in separate pharmaceutical
compositions. The
additional agent can be administered prior to, at the same time as, or
subsequent to administration of
the inhibitor, or in some combination thereof Where the inhibitor is
administered to the patient at
repeated intervals, e.g., during a standard course of treatment, the
additional agent can be
administered prior to, at the same time as, or subsequent to, each
administration of the inhibitor, or
some combination thereof, or at different intervals in relation to the
inhibitor treatment, or in a single
dose prior to, at any time during, or subsequent to the course of treatment
with the inhibitor.
[0151] The inhibitor will typically be administered to the patient in a
dose regimen that provides
for the most effective treatment of the cancer (from both efficacy and safety
perspectives) for which
the patient is being treated, as known in the art, and as disclosed, e.g. in
International Patent
Publication No. WO 01/34574. In conducting the treatment method of the present
invention, the
inhibitor can be administered in any effective manner known in the art, such
as by oral, topical,
intravenous, intra-peritoneal, intramuscular, intra-articular, subcutaneous,
intranasal, intra-ocular,
vaginal, rectal, or intradermal routes, depending upon the type of cancer
being treated, the type of
inhibitor being used (for example, small molecule, antibody, RNAi, ribozyme or
antisense construct),
and the medical judgement of the prescribing physician as based, e.g., on the
results of published
clinical studies.
[0152] The amount of inhibitor administered and the timing of inhibitor
administration will
depend on the type (species, gender, age, weight, etc.) and condition of the
patient being treated, the
severity of the disease or condition being treated, and on the route of
administration. For example,
small molecule inhibitors can be administered to a patient in doses ranging
from 0.001 to 100 mg/kg
of body weight per day or per week in single or divided doses, or by
continuous infusion (see for
example, International Patent Publication No. WO 01/34574). In particular,
erlotinib HC1 can be
administered to a patient in doses ranging from 5-200 mg per day, or 100-1600
mg per week, in single
38
CA 02849120 2014-03-18
WO 2013/055530 PCT/US2012/057777
or divided doses, or by continuous infusion. A preferred dose is 150 mg/day.
Antibody-based
inhibitors, or antisense, RNAi or ribozyme constructs, can be administered to
a patient in doses
ranging from 0.1 to 100 mg/kg of body weight per day or per week in single or
divided doses, or by
continuous infusion. In some instances, dosage levels below the lower limit of
the aforethe range may
be more than adequate, while in other cases still larger doses may be employed
without causing any
harmful side effect, provided that such larger doses are first divided into
several small doses for
administration throughout the day.
[0153] The inhibitors and other additional agents can be administered
either separately or together
by the same or different routes, and in a wide variety of different dosage
forms. For example, the
inhibitor is preferably administered orally or parenterally. Where the
inhibitor is erlotinib HC1
(TARCEVATm), oral administration is preferable. Both the inhibitor and other
additional agents can
be administered in single or multiple doses.
[0154] The inhibitor can be administered with various pharmaceutically
acceptable inert carriers
in the form of tablets, capsules, lozenges, troches, hard candies, powders,
sprays, creams, salves,
suppositories, jellies, gels, pastes, lotions, ointments, elixirs, syrups, and
the like. Administration of
such dosage forms can be carried out in single or multiple doses. Carriers
include solid diluents or
fillers, sterile aqueous media and various non-toxic organic solvents, etc.
Oral pharmaceutical
compositions can be suitably sweetened and/or flavored.
[0155] The inhibitor can be combined together with various pharmaceutically
acceptable inert
carriers in the form of sprays, creams, salves, suppositories, jellies, gels,
pastes, lotions, ointments,
and the like. Administration of such dosage forms can be carried out in single
or multiple doses.
Carriers include solid diluents or fillers, sterile aqueous media, and various
non-toxic organic
solvents, etc.
[0156] All formulations comprising proteinaceous inhibitors should be
selected so as to avoid
denaturation and/or degradation and loss of biological activity of the
inhibitor.
[0157] Methods of preparing pharmaceutical compositions comprising an
inhibitor are known in
the art, and are described, e.g. in International Patent Publication No. WO
01/34574. In view of the
teaching of the present invention, methods of preparing pharmaceutical
compositions comprising an
inhibitor will be apparent from the above-cited publications and from other
known references, such as
Remington's Pharmaceutical Sciences, Mack Publishing Company, Easton, Pa.,
18th edition (1990).
[0158] For oral administration of inhibitors, tablets containing one or
both of the active agents are
combined with any of various excipients such as, for example, micro-
crystalline cellulose, sodium
citrate, calcium carbonate, dicalcium phosphate and glycine, along with
various disintegrants such as
starch (and preferably corn, potato or tapioca starch), alginic acid and
certain complex silicates,
together with granulation binders like polyvinyl pyrrolidone, sucrose, gelatin
and acacia. Additionally,
39
CA 02849120 2014-03-18
WO 2013/055530 PCT/US2012/057777
lubricating agents such as magnesium stearate, sodium lauryl sulfate and talc
are often very useful for
tableting purposes. Solid compositions of a similar type may also be employed
as fillers in gelatin
capsules; preferred materials in this connection also include lactose or milk
sugar as well as high
molecular weight polyethylene glycols. When aqueous suspensions and/or elixirs
are desired for oral
administration, the inhibitor may be combined with various sweetening or
flavoring agents, coloring
matter or dyes, and, if so desired, emulsifying and/or suspending agents as
well, together with such
diluents as water, ethanol, propylene glycol, glycerin and various like
combinations thereof
[0159] For parenteral administration of either or both of the active
agents, solutions in either
sesame or peanut oil or in aqueous propylene glycol may be employed, as well
as sterile aqueous
solutions comprising the active agent or a corresponding water-soluble salt
thereof Such sterile
aqueous solutions are preferably suitably buffered, and are also preferably
rendered isotonic, e.g., with
sufficient saline or glucose. These particular aqueous solutions are
especially suitable for intravenous,
intramuscular, subcutaneous and intraperitoneal injection purposes. The oily
solutions are suitable for
intra-articular, intramuscular and subcutaneous injection purposes. The
preparation of all these
solutions under sterile conditions is readily accomplished by standard
pharmaceutical techniques well
known to those skilled in the art. Any parenteral formulation selected for
administration of
proteinaceous inhibitors should be selected so as to avoid denaturation and
loss of biological activity
of the inhibitor.
[0160] Additionally, it is possible to topically administer either or both
of the active agents, by
way of, for example, creams, lotions, jellies, gels, pastes, ointments, salves
and the like, in accordance
with standard pharmaceutical practice. For example, a topical formulation
comprising an inhibitor in
about 0.1% (w/v) to about 5% (w/v) concentration can be prepared.
[0161] For veterinary purposes, the active agents can be administered
separately or together to
animals using any of the forms and by any of the routes described above. In a
preferred embodiment,
the inhibitor is administered in the form of a capsule, bolus, tablet, liquid
drench, by injection or as an
implant. As an alternative, the inhibitor can be administered with the animal
feedstuff, and for this
purpose a concentrated feed additive or premix may be prepared for a normal
animal feed. Such
formulations are prepared in a conventional manner in accordance with standard
veterinary practice.
[0162] One of skill in the medical arts, particularly pertaining to the
application of diagnostic tests
and treatment with therapeutics, will recognize that biological systems may
exhibit variability and
may not always be entirely predictable, and thus many good diagnostic tests or
therapeutics are
occasionally ineffective. Thus, it is ultimately up to the judgement of the
attending physician to
determine the most appropriate course of treatment for an individual patient,
based upon test results,
patient condition and history, and his own experience. There may even be
occasions, for example,
when a physician will choose to treat a patient with an EGFR inhibitor even
when a tumor is not
CA 02849120 2014-03-18
WO 2013/055530 PCT/US2012/057777
predicted to be particularly sensitive to EGFR kinase inhibitors, based on
data from diagnostic tests or
from other criteria, particularly if all or most of the other obvious
treatment options have failed, or if
some synergy is anticipated when given with another treatment. The fact that
the EGFR inhibitors as a
class of drugs are relatively well tolerated compared to many other anti-
cancer drugs, such as more
traditional chemotherapy or cytotoxic agents used in the treatment of cancer,
makes this a more viable
option.
Methods of Advertising
[0163] The invention herein also encompasses a method for advertising an
EGFR, or a
pharmaceutically acceptable composition thereof, comprising promoting, to a
target audience, the use
of the inhibitor or pharmaceutical composition thereof for treating a patient
population with a type of
cancer which is characterized by a methylation pattern indicative of a
epithethial-like tumor, or
promoting, to a target audience, the non-use of the inhibitor or
pharmaceutical composition thereof for
treating a patient population with a type of cancer which is characterized by
a methylation pattern
indicative of a mesenchymal-like tumor.
[0164] Advertising is generally paid communication through a non-personal
medium in which the
sponsor is identified and the message is controlled. Advertising for purposes
herein includes
publicity, public relations, product placement, sponsorship, underwriting, and
sales promotion. This
term also includes sponsored informational public notices appearing in any of
the print
communications media designed to appeal to a mass audience to persuade,
inform, promote, motivate,
or otherwise modify behavior toward a favorable pattern of purchasing,
supporting, or approving the
invention herein.
[0165] The advertising and promotion of the diagnostic method herein may be
accomplished by
any means. Examples of advertising media used to deliver these messages
include television, radio,
movies, magazines, newspapers, the internet, and billboards, including
commercials, which are
messages appearing in the broadcast media. Advertisements also include those
on the seats of grocery
carts, on the walls of an airport walkway, and on the sides of buses, or heard
in telephone hold
messages or in-store PA systems, or anywhere a visual or audible communication
can be placed.
[0166] More specific examples of promotion or advertising means include
television, radio,
movies, the intern& such as webcasts and webinars, interactive computer
networks intended to reach
simultaneous users, fixed or electronic billboards and other public signs,
posters, traditional or
electronic literature such as magazines and newspapers, other media outlets,
presentations or
individual contacts by, e.g., e-mail, phone, instant message, postal, courier,
mass, or carrier mail, in-
person visits, etc.
[0167] The type of advertising used will depend on many factors, for
example, on the nature of
the target audience to be reached, e.g., hospitals, insurance companies,
clinics, doctors, nurses, and
41
CA 02849120 2014-03-18
WO 2013/055530
PCT/US2012/057777
patients, as well as cost considerations and the relevant jurisdictional laws
and regulations governing
advertising of medicaments and diagnostics. The advertising may be
individualized or customized
based on user characterizations defined by service interaction and/or other
data such as user
demographics and geographical location.
42
CA 02849120 2014-03-18
WO 2013/055530
PCT/US2012/057777
TABLES
Table 1 methylated cytosine nucleotides associated with mesenchymal
phenotype
gene chrom position gene chrom
position
PON2 7 94888497 TBCD 17 78440559
1 113544125 TBCD 17 78440498
BET1 7 93459766 TBCD 17 78440426
X 48900705 MYST1, PRSS8 16 31050024
X 48900845 ARHGEF38 4 106693255
X 48900694 1 27023897
SCNN1A 12 6353969 LIMA1 12 48882614
SCNN1A 12 6354033 7 80389667
SCNN1A 12 6354000 KIAA0182 16 84236385
ELMO3 16 65791484 19 49971610
ELMO3 16 65791362 19 49971605
NRBP1, KRTCAP3 2 27519047 ITGB6 2 160822102
LOC643008,
NRBP1, KRTCAP3 2 27519011 RECQL5 17 71147845
LOC643008,
KRTCAP3 2 27519215 RECQL5 17 71147779
KRTCAP3 2 27519142 CCDC57 17 77655395
NRBP1, KRTCAP3 2 27518810 7 155407896
NRBP1, KRTCAP3 2 27518521 7 155407740
NRBP1, KRTCAP3 2 27518632 7 155407629
NRBP1, KRTCAP3 2 27518654 16 86850497
NRBP1, KRTCAP3 2 27518645 16 86850474
NRBP1, KRTCAP3 2 27518643 16 29204205
NRBP1, KRTCAP3 2 27518583 16 29204115
MST1R 3 49914707 16 29204298
SLC9A7 X 46499386 16 29204194
LYN 8 57066177 7 2447019
ACAP2 3 196640585 7 2447061
TBC1D14 4 7008013 TMEM79 1 154520773
PITPNM3 17 6396092 L0C254559 15 87723993
11963508 CCDC19 1 158137355
1 41738700 CCDC19 1 158137539
ARHGAP39 8 145777560 4 129368833
ARHGAP39 8 145777354 1 24156244
COX10 17 14050396 3 135552584
7 27744012 CAMK2G 10 75302072
COL18A1,
SLC19A1 21 45757802 2 74006703
RAB25 1 154297806 2 74006825
CGN 1 149753111 2 74006594
TBCD 17 78440835 2 74006721
TBCD 17 78440951 PPP1R13L 19 50595498
TBCD 17 78440786 3 49919159
43
CA 02849120 2014-03-18
WO 2013/055530 PCT/US2012/057777
Table 1 (cont.) methylated cytosine nucleotides associated with mesenchymal
phenotype
gene chromosome position gene chromosome position
VPS37C 11 60682632 FURIN 15 89213122
NA, RCC1 1 28726284 BRE 2 28261767
CTNND1 11 57305264 11 67106174
EPHB2 1 23025895 11 67106217
6 134742250 11 67106166
FRMD6 14 51101498 11 67105913
GRHL2 8 102576558 11 67105885
P2RY6 11 72658514 SLC44A2 19 10596482
VTI1A 10 114516704 SLC44A2 19 10596548
5100A14 1 151855406 SLC44A2 19 10596578
5100A14 1 151855551 SLC44A2 19 10596594
PRSS8 16 31054183 RNF144A 2 7089748
THSD4 15 69416262 1 201755387
2 189266325 QS0X1 1 178404541
SIPA1L1 14 71183551 CCDC85C 14 99114910
ARL13B, STX19 3 95230100 PLA2G4F 15 40236307
ARL13B, STX19 3 95230218 PLA2G4F 15 40236078
PVRL4 1 159326278 FTO 16 52372627
PVRL4 1 159326159 1 234153824
PVRL4 1 159326053 PPFIBP2 11 7578132
PVRL4 1 159326082 NINJ2 12 587066
ARHGAP32 11 128399061 2 30294748
ARHGAP32 11 128399150 4 189558130
8 125219633 4 189558238
15 76213522 1 206105036
PNKD 2 218868246 KRT8 12 51586560
CD44 11 35152089 4 185905387
ANKRD22 10 90600502 LIMK2 22 30001702
BOLA2,
CEACAM19 19 49866511 GDPD3 16 30023636
CEACAM19 19 49866752 3 129636934
CEACAM19 19 49866521 4 154136934
11 71134595 9 131184926
11 71134808 19 1855554
SCYL3 1 168127429 8 102519033
CPA4 7 129749798 1 100204254
CLUAP1 16 3499552 IMMP2L 7 110988180
CLUAP1 16 3499688 19 60699327
CLUAP1 16 3499569 PLEKHG6 12 6292029
8 28514725 PLEKHG6 12 6292067
JMJD7-
ASAP2 2 9458210 PLA2G4B 15 39918027
44
CA 02849120 2014-03-18
WO 2013/055530
PCT/US2012/057777
Table 1 (cont.) methylated cytosine nucleotides associated with mesenchymal
phenotype
gene chrom position gene chrom position
JMJD7-PLA2G4B 15 39917942 2 216504192
JMJD7-PLA2G4B 15 39917954 PLEKHF1 19 34854611
PNPLA8 7 107955947 PLEKHF1 19 34854406
PNPLA8 7 107955918 10 6202160
PNPLA8 7 107955957 10 6202194
HIVEP3 1 41753450 10 6202124
RAI1 17 17572988 SH3KBP1 X 19812050
DIXDC1 11 111337086 10 28996094
BOLA2, TBX6 16 30009181 11 73806817
SEMA3A 7 83655334 8 82806235
2 27838190 11 354805
TNFAIP8 5 118637864 11 354809
SNX8 7 2267181 11 354623
JARID2 6 15564181 11 354752
AHRR 5 439883 10 31428642
CDH5 16 64970341 17 52465903
CDH5 16 64970599 12 15846291
6 8381465 TESK2 1 45587219
SLC35B3 6 8381262 1 2456135
6 8381295 TSEN54 17 71032445
DAGLA 11 61221452 TSEN54 17 71032354
19 2105603 ACOT2 14 73109663
SVOPL 7 137999314 PDGFRA, LNX1 4 54153003
17 8252319 PDGFRA, LNX1 4 54152866
17 8252561 SLC40A1 2 190154739
17 8252360 ATL1 14 50069808
17 8252425 ZNF398 7 148472457
IGF1R 15 97074397 17 37862949
WDR82 3 52277292 17 37862906
WDR82 3 52277190 4 40328026
FBX034 14 54834400 2 41940393
RAB11FIP1 8 37868570 AFF1 4 88113322
VPS37B 12 121944095 INPP5A 10 134254904
NAV2 11 19732081 INPP5A 10 134254935
C4orf36 4 88031692 MST1R 3 49913008
PLXNB2 22 49062415 PHGDH 1 120075342
PLXNB2 22 49062595 GLI2 2 121266304
C19orf46 19 41191166 GLI2 2 121266336
2 70222288 GLI2 2 121266195
VTI1A 10 114492308 C2orf54 2 241484135
CA 02849120 2014-03-18
WO 2013/055530 PCT/US2012/057777
Table 1 (cont.) methylated cytosine nucleotides associated with mesenchymal
phenotype
gene chrom position gene chrom position
C2orf54 2 241484343 TBCD 17 78426815
6 112413022 TBCD 17 78426927
4 100956161 TBCD 17 78427378
CCNY 10 35716880 TBCD 17 78427517
MLPH 2 238063229 2 64687610
CDKAL1 6 21131464 16 52025113
GPR81 12 121777086 PPARD 6 35417845
17 41697531 8 144892671
F11R 1 159258976 8 144892697
F11R 1 159258982 8 144892896
CDC42SE2 5 130692428 8 144892814
FTO 16 52472915 LRP5 11 67866681
10 73752495 XAB2 19 7590468
MY018A 17 24529971 RAP1GAP2 17 2815637
MY018A 17 24529383 SLC37A1 21 42809566
DGAT1 8 145518703 13 109313445
SDCBP2 20 1258000 12 13179838
SDCBP2 20 1257800 OFCC1 6 10271555
SDCBP2 20 1257722 PTK7 6 43172438
TRAK1 3 42147101 TEAD3 6 35562412
SCNN1A 12 6354480 TEAD3 6 35562047
SCNN1A 12 6354974 TEAD3 6 35561916
SCNN1A 12 6354868 C16orf72 16 9097893
SCNN1A 12 6354990 ARID1A 1 26953185
SCNN1A 12 6354782 SGK223 8 8276184
ZCCHC14 16 86078911 GNA12 7 2739598
ZCCHC14 16 86078864 GNA12 7 2739653
GLIS1 1 53831204 GNA12 7 2739536
TSPAN1 1 46418811 PWWP2B 10 134072208
TSPAN1 1 46418555 PWWP2B 10 134072043
TSPAN1 1 46418745 SMARCD2 17 59270462
ST3GAL2 16 68973602 GPR56 16 56211203
ST3GAL2 16 68973365 GPR56 16 56211170
C10orf95 10 104201478 GPR56 16 56211418
C10orf95 10 104201378 GPR56 16 56211405
C10orf95 10 104201309 GPR110 6 47117696
C10orf95 10 104201286 GPR110 6 47118136
C10orf95 10 104201414 GPR110 6 47118050
C10orf95 10 104201318 EHF 11 34599461
TBCD 17 78426682 21 38521991
46
CA 02849120 2014-03-18
WO 2013/055530
PCT/US2012/057777
Table 1 (cont.)
methylated cytosine nucleotides associated with mesenchymal phenotype
gene chrom position gene chrom position
14 64792338 CDS1 4 85724598
NSMCE2 8 126223268 GNAI3 1 109914827
PPCDC 15 73115889 NCOA2 8
71402682
WISP1 8 134293893 12 103938284
WISP1 8 134294072 CPEB3 10
93872825
WISP1 8 134293996 TACC2 10 123744125
17 36932205 1 227296135
8 144727414 6 7477665
CHD2 15 91266091 19
50356091
1 8053252 LLGL2 17 71057739
DDR1 6 30959396 ANKFY1 17 4098222
DDR1 6 30958847 CLDN7 17 7106144
DDR1 6 30958892 1
59052878
DDR1 6 30958855 17
75403317
DDR1 6 30959065 17
75403479
DDR1 6 30959030 16
66828383
DDR1 6 30959048 ESRP2 16
66826542
DDR1 6 30958956 ESRP2 16
66826796
BAIAP2 17 76626137 OVOL1 11
65310618
BAIAP2 17 76625735 8
95720275
BAIAP2 17 76625947 FAM110A 20 770788
BAIAP2 17 76625872 SPINT1 15
38924311
MANE 3 51401417 GRHL2 8 102575162
PVRL4 1 159325891 SH3YL1 2 253559
PVRL4 1 159325951 SH3YL1 2 253656
RHOBTB3 5 95089583 TMEM159, DNAH3 16
21078740
2 70221961 TMEM159, DNAH3 16 21078585
GPR56 16 56211848 TMEM159, DNAH3 16
21078568
RAB25 1 154297433 TMEM159, DNAH3 16
21078598
RAB25 1 154297468 C1orf210 1
43524150
3 53164930 C1orf210 1 43523857
RAB24 5 176661226 C1orf210 1
43524084
SPINT1 15 38925452 C1orf210 1
43523963
RAB24 5 176661618 C1orf210 1
43523950
8 8356184 C1orf210 1 43524056
20 36661934 C1orf210 1 43524091
1 113106832 C1orf210 1 43523957
CHD3 17 7732607 CLDN7 17 7105979
ABCF1 6 30667066 CLDN7 17 7105734
16 83945057 CLDN7 17 7106573
47
CA 02849120 2014-03-18
WO 2013/055530 PCT/US2012/057777
Table 1 (cont.) methylated cytosine nucleotides associated with mesenchymal
phenotype
gene chrom position gene chrom position
CLDN7 17 7106633 1 1088914
CLDN7 17 7106571 1 1088855
CLDN7 17 7106564 AGAP3 7 150443215
CLDN7 17 7106566 ARHGEF1 19 47084177
CLDN7 17 7106555 4 100955681
GRHL2 8 102575727 ARHGAP39 8 145777081
GRHL2 8 102575565 STX2 12 129869431
GRHL2 8 102575811 STX2 12 129869200
GRHL2 8 102574732 STX2 12 129869047
GRHL2 8 102574469 STX2 12 129869147
GRHL2 8 102574689 STX2 12 129868969
TMEM3OB 14 60817996 22 35136360
TMEM3OB 14 60818107 22 35136601
TMEM3OB 14 60818193 22 35136526
TMEM3OB 14 60818089 22 35136389
PDGFRA, LNX1 4 54152685 CLDN15 7 100662856
PDGFRA, LNX1 4 54152402 E2F4, ELMO3 16 65790422
PDGFRA, LNX1 4 54152494 E2F4, ELMO3 16 65790778
PDGFRA, LNX1 4 54152599 ELMO3 16 65790933
PDGFRA, LNX1 4 54152503 PTPRF 1 43788610
GRHL2 8 102573922 PTPRF 1 43788636
GRHL2 8 102574035 PTPRF 1 43788601
GRHL2 8 102573658 PWWP2B 10 134071493
GRHL2 8 102573623 PWWP2B 10 134071845
GRHL2 8 102573655 PWWP2B 10 134071623
GRHL2 8 102573797 14 64239711
GRHL2 8 102573842 14 64239802
GRHL2 8 102573677 ETV6 12 11922571
GRHL2 8 102573740 SH3BP5 3 15344685
4 124687980 GAS8 16 88638299
4 124687986 SULT2B1 19 53747224
4 124688290 SULT2B1 19 53747250
1 117976728 SULT2B1 19 53747255
1 1088243 SULT2B1 19 53747202
1 1089514 SULT2B1 19 53747244
1 1089426 LAMA3 18 19707129
1 1089493 LAMA3 18 19706893
1 1089446 LAMA3 18 19706728
1 1088763 LAMA3 18 19706786
1 1089029 LAMA3 18 19706817
48
CA 02849120 2014-03-18
WO 2013/055530
PCT/US2012/057777
Table 1 (cont.) methylated cytosine nucleotides associated with mesenchymal
phenotype
gene chrom position gene chrom position
LAMA3 18 19706827 APBB1 11 6375542
LAMA3 18 19706842 ABCA7 19 1016712
NCRNA00093, DNMBP 10 101680658 ABCA7 19 1016728
C1orf106 1 199130846 ABCA7 19 1016688
C1orf106 1 199130930 11 66580163
12 6942075 11 66580192
12 6941973 11 66580260
12 6943440 ANK3 10 62162307
12 6943501 ANK3 10 62161917
12 6943503 ANK3 10 62162163
12 6943508 ABLIM1 10 116269176
12 6943525 14 53642609
12 6942988 XDH 2 31491126
12 6943026 XDH 2 31491353
12 6943152 DAPP1 4 100957034
12 6942957 DAPP1 4 100956844
TALD01 11 753339 DAPP1 4 100956853
TALD01 11 753485 TNS4 17 35911401
CNKSR1 1 26376210 TNS4 17 35911460
CNKSR1 1 26376363 TNS4 17 35911441
CNKSR1 1 26376365 TNS4 17 35911475
CNKSR1 1 26376449 PARD3 10 34756309
CNKSR1 1 26376445 RGL2 6 33373111
CNKSR1 1 26376434 RGL2 6 33373221
CNKSR1 1 26376520 RGL2 6 33373245
CNKSR1 1 26376566 19 17763242
CNKSR1 1 26376606 1 150076158
CNKSR1 1 26376578 PCCA 13 99941258
3 37200270 RAP1GAP2 17 2855119
MERTK 2 112421048 EPHB3 3 185766002
RGS3 9 115383006 TNFRSF10C 8 23019312
PLXNB2 22 49062679 MICAL2 11 12226862
PLXNB2 22 49062940 SGSM2 17 2197812
16 86381426 RABGAP1L 1 173111020
75306867 RABGAP1L 1 173111113
FAM83A 8 124264314 ARHGEF1OL 1 17750038
FAM83A 8 124264583 TBC1D1 4 37666838
FAM83A 8 124264373 CGN 1 149751930
TAF1B 2 9955012 ELF3 1 200243703
ERI3 1 44566745 PROM2 2 95304202
49
CA 02849120 2014-03-18
WO 2013/055530
PCT/US2012/057777
Table 1 (cont.) methylated cytosine nucleotides associated with mesenchymal
phenotype
gene chrom position gene chrom position
PROM2 2 95304432 EPN3 17 45966053
PROM2 2 95303758 2 128333798
PROM2 2 95303838 GJB3 1 35020553
PHEX X 22046472 C10orf91 10 134111645
ADAP1 7 952365 C10orf91 10 134111403
ADAP1 7 952156 C10orf91 10 134111470
ADAP1 7 952310 20 30796655
ADAP1 7 952245 DLEU1 13 49829837
ADAP1 7 952140 8 101497819
VCL 10 75485630 22 28307949
11 67206458 22 28308158
11 67206243 16 86536340
14 51288831 UNC5A 5 176181830
14 51288704 4 154076297
21 36592419 4 154075997
14 34872148 4 154075953
PLA2G4F 15 40236052 USP43 17 9491021
1 201096568 USP43 17 9490981
FAM46B 1 27207475 USP43 17 9490898
OPA3 19 50723356 USP43 17 9490862
11 3454830 CXCL16 17 4588805
6 36205670 CXCL16 17 4588796
CST6 11 65535543 7 139750442
FGGY 1 59989219 7 139750014
15 72463284 7 139750140
FUT3 19 5802616 7 139750233
FUT3 19 5802465 7 139750195
FUT3 19 5802504 7 139750252
PLS3 X 114734137 7 139750206
WWC1 5 167725172 7 139750225
8 15408729 CLDN4 7 72883980
RASA3 13 113862226 ARAP1, STARD10 11 72169819
ST3GAL4 11 125781207 9 131185398
ST3GAL4 11 125781216 CDKN1A 6 36758711
12 104024772 MBP 18 72930014
IL17RE, CIDEC 3 9919512 ERBB2 17 35115639
IL17RE, CIDEC 3 9919537 C14orf43 14 73281541
SIGIRR, ANO9 11 407907 MED16 19 834879
SYT8 11 1812460 2 101234948
SYT8 11 1812427 2 101234788
CA 02849120 2014-03-18
WO 2013/055530
PCT/US2012/057777
Table 1 (cont.) methylated cytosine nucleotides associated with mesenchymal
phenotype
gene chrom position gene chrom position
IL10RB 21 33563377 MACC1 7 20223703
ESRP2 16 66825963 MACC1 7 20223521
ESRP2 16 66825753 MACC1 7 20223687
SPINT2 19 43448222 1 27160055
CCDC120 X 48803602 ST14 11 129535669
CCDC120 X 48803499 ST14 11 129535471
C19orf46, ALKBH6 19 41191679 SPINT1 15 38923139
C19orf46, ALKBH6 19 41191561 SPINT1 15 38923085
C19orf46, ALKBH6 19 41191506 SPINT1 15 38923161
CLDN7 17 7105010 SPINT1 15 38923192
PRSS8 16 31054518 C1orf172 1 27159869
PRSS8 16 31054678 2 74064398
PRSS8 16 31054500 2 74064468
PRSS8 16 31054545 2 74064365
PRSS8 16 31054555 8 102573146
PRSS8 16 31054700 8 102573120
2 238165128 8 102573068
ANKRD22 10 90601891 POU6F2 7 39022925
ANKRD22 10 90601835 LAMB3 1 207892566
ITGB6 2 160764766 LAMB3 1 207892295
ITGB6 2 160764885 LAMB3 1 207892301
ITGB6 2 160764846 LAMB3 1 207892354
BOK 2 242150379 LAMB3 1 207892472
TMC8, TMC6 17 73640271 LAMB3 1 207892370
TMC8, TMC6 17 73640278 LAMB3 1 207892479
CRB3 19 6415885 3 129911695
EPS8L1 19 60279005 16 2999774
EPS8L1 19 60278851 BMF 15 38186296
12 88144203 BMF 15 38186393
7 64096077 BMF 15 38186423
K1AA0247 14 69194460 GALNT3 2 166357860
14 64239962 8 144893629
74369044 8 144893700
16 11613936 C20orf151 20 60435990
NEURL1B 5 172048817 C20orf151 20 60436252
CLDN4 7 72882009 C20orf151 20 60436261
PAK4 19 44350154 C20orf151 20 60436106
P2RY2 11 72616798 C20orf151 20 60436134
4 69806346 C20orf151 20 60436052
MACC1 7 20223945
51
CA 02849120 2014-03-18
WO 2013/055530
PCT/US2012/057777
Table 1 (cont) methylated cytosine nucleotides associated with mesenchymal
phenotype
gene chromosome position
ADAMTS16 hg19 hr5:5139160-5139859
ANKRD34A hg19 chr1:145472863-145473562
ARID5A hg19 chr2:97215439-97216138
APC2 hg19 chr19:1467602-1468301
BMP4 hg19 chr14:54422575-54423274
CA12 hg19 chr15:63673688-63674360
CCK hg19 chr3:42306174-42306873
CCNA1 hg19 chr13:37005581-37006453
CDH4 hg19 chr20:59826862-59827561
CLDN7 hg19 chr17:7165943-7166642
DKK1 hg19 chr10:54072931-54073630
SEPTIN9 hg19 chr17:75404213-75404912
DLX1 hg19 chr2:172950047-172950746
ERBB4 hg19 chr2:213402181-213402880
ESRP1 hg19 chr8:95651545-95652244
FGFR1 hg19 chr8:38279279-38279921
FOXA1 hg19 chr14:38061638-38062337
GATA2 hg19 chr3:128202381-128203080
GNE hg19 chr10:54072931-54073630
GRHL2 hg19 chr8:102504509-102505208
GLI3 hg19 chr7:42267369-42268068
HDAC4 hg19 chr2:240113948-240114647
HOXA10 hg19 chr7:27213776-27214475
HS3TS3B1 hg19 chr17:14202839-14203538
1D2 hg19 chr2:8823406-8824105
ITIH4 hg19 chr3:52854493-52855192
LAMA1 hg19 chr18:7013604-7014303
LAD1 hg19 chr1:201368681-201369380
LHX9 hg19 chr1:197889343-197890042
MAP6 hg19 chr11:75378150-75378849
MEOX1 hg19 chr17:41738845-41739544
MGC45800 hg19 chr4:183061951-183062650
MSX1 hg19 chr4:4859635-4860334
MTMR7 hg19 chr8:17270755-17271454
PARD3 hg19 chr10:35104748-35105447
PAX6 hg19 chr11:31833994-31834693
PCDHGA8 hg19 chr5:140807001-140807700
PI3KR5 hg19 chr17:8798216-8798915
RNF220 hg19 chr1:44883347-44884046
RNLS hg19 chr10:90342854-90343553
RPS6KA2 hg19 chr6:167177930-167178629
SFRP1 hg19 chr8:41167914-41168613
52
CA 02849120 2014-03-18
WO 2013/055530
PCT/US2012/057777
Table 1(cont.) methylated cytosine nucleotides associated with mesenchymal
phenotype
gene chromosome position
WNT5B hg19 chr12:1739567-1740266
MEOX2 hg19 chr7:15727091-15727790
TP73 hg19 chr1:3569053-3569719
RASGRF1 hg19 chr15:79381517-79382216
TWIST hg19 chr7:19157773-19158472
AGAP3 hg18 chr7:150442790-150443639
ANKRD33B hg18 chr5:10617913-10618612
ARHGEF1 hg18 chr19:47083827-47084526
C10orf91 hg18 chr10:134111053-134111752
CHD3 hg18 chr17:7732182-7733031
CXCL16 hg18 chr17:4588455-4589154
ESRP2 hg18 chr16:66828033-66828732
K1AA1688 hg18 chr8:145777004-145777703
TBC1D1 hg18 chr4:37654711-37655410
SERPINB5 hg18 chr18:59295387-59296621
STX2 hg18 chr12:129868969-129869727
miR200C hg18 chr12:6942800-6943200
MST1R hg18 chr3:49916155-49916617
MACC1 hg18 chr7:20223293-20224058
HOXC4/HOXC5 hg18 chr12:52712961-52713967
CP2L3 hg19 chr8:102504509-102505208
RON hg18 chr3:49916155-49916617
TBCD hg18 chr17:78440426-78440951
C20or155 hg18 chr20:770741-770860
ERBB2 hg19 chr17:37861100-37863650
53
CA 02849120 2014-03-18
WO 2013/055530
PCT/US2012/057777
Table 2 methylated cytosine nucleotides associated with epithelial
phenotype
gene chromosome position gene chromosome position
ALDH3B2 11 67204971 COLEC10 8 120175608
2 62409583 5 147237412
AMICA1 11 117590946 5 147237649
TMPRSS13 11 117294776 5 147237518
1 20440804 1 167067800
20 1420914 DLG2 11 84558496
1 20374821 RAB19 7 139760606
PRR5-ARHGAP8,
DAPP1 4 101009384 ARHGAP8 22 43564823
AMICA1 11 117590130 2 230797885
19 47895208 CHMP4C 8 82834065
MY01D 17 28170353 7 21037502
AFAP1 4 7945103 7 21031624
SPINK5 5 147423445 20 36533851
SPINK5 5 147423477 14 74735436
SPINK5 5 147423260 MYCBPAP 17 45964331
AN03, MUC15 11 26538572 TMEM3OB 14 60814048
3 183702446 9 84869514
3 183767276 10 100127021
SYT16 14 61608563 6 80178446
SYT16 14 61532507 3 106815813
TC2N 14 91391048 CNGA1 4 47710738
TC2N 14 91375355 SLAMF9 1 158190485
CEACAM6 19 46966764 CD180 5 66513564
KIAA0040 1 173395004 ESR1 6 152166508
KIAA0040 1 173396807 12 72730512
SYK 9 92692359 MRVI1 11 10559098
SYK 9 92659288 CYP4B1 1 47037188
SEMA6D 15 45522047 MFSD4 1 203816771
ERP27 12 14982225 PLA2G2F 1 20338719
IVL 1 151148554 CYP4B1 1 47057214
IVL 1 151148439 CYP4A22 1 47375597
KRTAP3-3 17 36403692 1 47036300
KRTAP3-3 17 36403856 SDR16C5 8 57375347
55990316 5 39796557
DHRS9 2 169653716 SAMD12 8 119525751
4 55490421 1 190775347
SPAM1 7 123353161 TAT 16 70168544
8 127777938 SALL3 18 74858829
8 120206280 11 128964767
COLEC10 8 120187865 PKHD1 6 51787037
54
CA 02849120 2014-03-18
WO 2013/055530 PCT/US2012/057777
Table 2 (cont.) methylated cytosine nucleotides associated with epithelial
phenotype
gene chromosome position gene chromosome position
11 2178652 ZC4H2 X 64171340
IRF6 1 208029710 TRAM2 6 52549027
UBXN10 1 20391491 BVES 6 105690909
7 7359082 BVES 6 105690842
SCEL 13 77066219 MLLT11 1 149299631
TMC1 9 74639567 MLLT11 1 149299586
8 127457153 MLLT11 1 149299347
4 55742586 2 42128114
PHLDB2 3 113112565 2 42128123
HMHB1 5 143180348 1 113301372
7 19927552 12 95407994
16 68155671 TENC1 12 51729752
LAMA2 6 129245818 TENC1 12 51729851
LAMA2 6 129245899 3 42088628
11 65020493 SPRY4 5 141675957
SHANK2 11 70217854 SPRY4 5 141679764
SHANK2 11 70350904 19 13808229
NFIC 19 3312374 19 13808284
NFIC 19 3312154 19 13808262
FLNB 3 58020380 19 13808473
TEAD4 12 2978486 19 13808469
ABCC3 17 46113650 DGAT1 8 145510701
TMEM120B 12 120670919 NRM 6 30764049
SCNN1A 12 6347262 NRM 6 30764073
8 103890347 NRM 6 30764003
SAM D11,
NOC2L 1 869821 FLOT1 6 30817584
KIRREL 1 156231153 FLOT1 6 30817649
MYADM 19 59061828 19 52793249
INPP5B 1 38185106 LAMB3 1 207868102
INPP5B 1 38185405 LAMB3 1 207867974
INPP5B 1 38185271 AP1M2 19 10544470
INPP5B 1 38185275 MAP3K14 17 40747948
INPP5B 1 38185298 MAP3K14 17 40748115
INPP5B 1 38185331 ELOVL7 5 60094877
PDE4D 5 58457316 ADAP1 7 913183
11 65013559 17 17470224
CADPS2 7 122024033 PTK2B 8 27325072
ITGA5 12 53098352 1 19211638
ZC4H2 X 64171392 17 54761551
ZC4H2 X 64171381 ITGB3 17 42685877
CA 02849120 2014-03-18
WO 2013/055530
PCT/US2012/057777
Table 2 (cont.) methylated cytosine nucleotides associated with epithelial
phenotype
gene chromosome position gene chromosome position
ITGB3 17 42686081 INPP5B hg18 chr1:38184921-38185620
ITGB3 17 42685928 BVES hg18 chr6:105690492-105691191
ITGB3 17 42685861 ITGA5 hg18 chr12:53098002-53098701
ITGB3 17 42686060 ITGB3 hg18 chr17:42685578-42686277
C11orf70 11 101423920 JAKMIP2 hg18 chr5:147142066-
147142765
EPN3 17 45974036 MLLT11 hg18 chr1:149299281-149299980
1 20672639 NFIC hg18 chr19:3311804-3312503
LIX1L 1 144189643 NTNG2 hg18 chr9:134026339-134027038
SIGIRR 11 403594 ZEB2
hg18 chr2:144989568-144989952
17 73861330 PCDH8 hg18
chr13:52321009-52321560
11 32068730 PEX5L
hg18 chr3:181236933-181237780
KLF16 19 1810341 GALR1
hg18 chr18:73090412-73090797
1 28457982
129592716
LY6G6C 6 31795616
CDS1 4 85777370
MRVI1 11 10562607
10 17309649
10 17309781
17 23722410
16 67990001
ZEB2 2 144994583
4 40953131
ANK3 10 62002852
5 10618263
5 66600290
NTNG2 9 134026689
JAKMIP2 5 147142568
JAKMIP2 5 147142416
JAKMIP2 5 147142654
JAKMIP2 5 147142625
10 30178594
TBC1D1 4 37655153
TBC1D1 4 37655061
TBC1D1 4 37655126
56
CA 02849120 2014-03-18
WO 2013/055530
PCT/US2012/057777
Table 3 methylated cytosine ucleotides associated with mesenchymal
phenotype
Gene CHROMOSOME POSITION EntrezID CpG_island
TSPAN14 10 82209390 81619
LFNG 7 2530782 3955 CpG_35
PRKCH 14 61062573 5583
SDC4 20 43406736 6385
SCYL3 1 168127429 57147
TNXB 6 32162072 7148
ARHGAP39 8 145777560 80728 CpG_52
SPINT1 15 38937072 6692
SLC9A7 X 46499386 84679
3 49919159
TBCD 17 78440786 6904
VTI1A 10 114492308 143187
LDLRAP1 1 25767066 26119
PLEKHG6 12 6291928 55200
PNPLA8 7 107955918 50640
PNPLA8 7 107955957 50640
ARID1A 1 26953185 8289
ABTB2 11 34241186 25841
SLC9A3R1 17 70267242 9368
7 2447061
GALNTL2 3 16220636 117248
ZNF321 19 58139084 399669
DIP2B 12 49261110 57609
3 178803691
2 242481901
7 6491550
WDR82 3 52277292 80335
TRAF5 1 209569842 7188
PPARD 6 35417906 5467 CpG_65
LYN 8 57066177 4067
L0C254559 15 87723993 254559 CpG_155
L0C254559 15 87723796 254559 CpG_155
7 27744012
TMEM79 1 154520773 84283
8 102520036
JMJD7-
PLA2G4B 15 39918027 8681
57
CA 02849120 2014-03-18
WO 2013/055530
PCT/US2012/057777
Table 3 (cont.) methylated cytosine nucleotides associated with mesenchymal
phenotype
Gene CHROMOSOME POSITION EntrezID CpG_island
FTO 16 52372627 79068
15 78857906 CpG_157
BAIAP2 17 76625735 10458
8 102520234
8 102520167
NRBP1,
KRTCAP3 2 27518521 29959, 200634 CpG_42
PVRL2 19 50073777 5819
7 6491523
CSK 15 72868625 1445
PITPNM3 17 6396092 83394
GRHL2 8 102575811 79977 CpG_104
PVRL4 1 159325891 81607
LAMA3 18 19706786 3909
8 144892697
8 144892671
STX2 12 129869200 2054 CpG_56
STX2 12 129869147 2054 CpG_56
OBSCN 1 226625610 84033 CpG_30
GNA13 17 60466557 10672
ACAP2 3 196640585 23527
WDR82 3 52277190 80335
NSMCE2 8 126223268 286053
73752495
RAB24 5 176661226 53917
ETV6 12 11922571 2120
ENDOD1 11 94481032 23052
7 155407740
LIMA1 12 48882614 51474
TBCD 17 78426682 6904
TBCD 17 78426927 6904
TBCD 17 78426815 6904
C10orf91 10 134111645 170393
2 64687934
2 64687784
2 64687610
SPIRE1 18 12636025 56907
STX2 12 129869047 2054 CpG_56
LRP5 11 67866681 4041
OBSCN 1 226625713 84033 CpG_30
58
CA 02849120 2014-03-18
WO 2013/055530 PCT/US2012/057777
Table 3 (cont.) methylated cytosine nucleotides associated with mesenchymal
phenotype
Gene CHROMOSOME POSITION EntrezID CpG_island
OBSCN 1 226625944 84033 CpG_30
OBSCN 1 226625706 84033 CpG_30
OBSCN 1 226625779 84033 CpG_30
CGN 1 149753111 57530
12 6943501
RAB25 1 154297806 57111
12 6943503
12 6943508
TBCD 17 78440951 6904
MYST1, PRSS8 16 31050024 84148, 5652
TBCD 17 78440835 6904
TBCD 17 78440498 6904
TBCD 17 78440559 6904
TBCD 17 78440426 6904
GRHL2 8 102574469 79977 CpG_104
GRHL2 8 102575727 79977 CpG_104
GPR110 6 47118050 266977
6 7477665
THSD4 15 69416262 79875
3 53164930
C20orf151 20 60435990 140893
PWWP2B 10 134072208 170394
7 2447019
2 70221961
LAMA3 18 19706842 3909
LAMA3 18 19706817 3909
RHOBTB3 5 95089583 22836
GPR56 16 56211848 9289
RAB25 1 154297468 57111
RAB25 1 154297433 57111
TMEM159,
DNAH3 16 21078585 57146, 55567
C1orf210 1 43524091 149466
CCDC19 1 158136950 25790
C1orf210 1 43524084 149466
CLDN7 17 7105979 1366 CpG_159
GRHL2 8 102574035 79977 CpG_31
SPINT1 15 38925452 6692
59
CA 02849120 2014-03-18
WO 2013/055530 PCT/US2012/057777
Table 3 (cont.) methylated cytosine nucleotides associated with mesenchymal
phenotype
Gene CHROMOSOME POSITION EntrezID CpG_island
ADAP1 7 952140 11033
12 6943440
12 6943525
RAP1GAP2 17 2815637 23108
VPS37C 11 60682632 55048
IGF1R 15 97074397 3480
BOLA2, GDPD3 16 30023636 552900, 79153
22 28307742
22 28308158
NA, RCC1 1 28726284 751867, 1104
CTNND1 11 57305264 1500
2 101234788
MPRIP 17 16907618 23164
FRMD6 14 51101498 122786
16 86381426
ARHGAP39 8 145777354 80728 CpG_52
MAPK13 6 36207101 5603
5583926
10 5583949
13 109313445
F11R 1 159258982 50848
SDCBP2 20 1257722 27111
F11R 1 159258976 50848
EHF 11 34599461 26298
ABLIM1 10 116269176 3983
MCCC2 5 70933152 64087
COX10 17 14050396 1352
SLC37A1 21 42809566 54020
MY018A 17 24529971 399687
IL17RE, CIDEC 3 9919537 132014, 63924
5100A14 1 151855406 57402
IL17RE, CIDEC 3 9919512 132014, 63924
TALD01 11 753485 6888
PHGDH 1 120075342 26227
SIPA1L1 14 71183551 26037
2 189266325
CA 02849120 2014-03-18
WO 2013/055530 PCT/US2012/057777
Table 3 (cont.) methylated cytosine nucleotides associated with mesenchymal
phenotype
Gene CHROMOSOME POSITION EntrezID CpG_island
TMEM159,
DNAH3 16 21078740 57146, 55567
PPCDC 15 73115889 60490
GPR56 16 56211418 9289
LLGL2 17 71057739 3993
SPINT1 15 38923139 6692 CpG_135
CLDN15 7 100662856 24146 CpG_54
CNKSR1 1 26376445 10256
GRB7 17 35149701 2886
NRBP1,
KRTCAP3 2 27519047 29959, 200634 CpG_42
KRTCAP3 2 27519215 200634 CpG_42
16 83945057
GPR56 16 56211405 9289
TACC2 10 123744125 10579
ADAT3,
SCAM P4 19 1858677 113179, 113178 CpG_34
CHD2 15 91266091 1106
GRHL2 8 102575565 79977 CpG_104
7 139750195
8 102573120
1 227296135
PDGFRA, LNX1 4 54152503 5156, 84708
PDGFRA, LNX1 4 54152494 5156, 84708
11 3454830
ITGB6 2 160764885 3694
PDGFRA, LNX1 4 54152866 5156, 84708
20 36661934
1 1088243 CpG_183
5T14 11 129535669 6768 CpG_64
7 139750206
C20orf151 20 60436134 140893
7 139750140
LOC643008,
RECQL5 17 71147779 643008, 9400
GRB7 17 35147553 2886
GRB7 17 35147540 2886
C1orf210 1 43523857 149466
61
CA 02849120 2014-03-18
WO 2013/055530 PCT/US2012/057777
Table 3 (cont.) methylated cytosine nucleotides associated with mesenchymal
phenotype
Gene CHROMOSOME POSITION EntrezID CpG_island
CNKSR1 1 26376606 10256
CNKSR1 1 26376566 10256
CLDN7 17 7106571 1366 CpG_159
CLDN7 17 7106564 1366 CpG_159
CLDN7 17 7106566 1366 CpG_159
C1orf210 1 43523950 149466
C1orf210 1 43523957 149466
CLDN4 7 72883688 1364 CpG_46
CLDN7 17 7105734 1366 CpG_159
C1orf210 1 43523963 149466
CLDN7 17 7106573 1366 CpG_159
KRTCAP3 2 27519142 200634 CpG_42
MST1R 3 49914707 4486 CpG_23
MST1R 3 49915923 4486 CpG_53
XAB2 19 7590468 56949
KIAA0182 16 84236385 23199
PWWP2B 10 134072043 170394
CCDC57 17 77655395 284001
NRBP1,
KRTCAP3 2 27518810 29959, 200634 CpG_42
NRBP1,
KRTCAP3 2 27518583 29959, 200634 CpG_42
NRBP1,
KRTCAP3 2 27518645 29959, 200634 CpG_42
MOCOS 18 32022494 55034 CpG_141
PWWP2B 10 134071493 170394
LAMA3 18 19706893 3909
12 6943152
12 6942988
12 6943026
12 6942957
14 64239711
PRSS8 16 31054518 5652
17 75403479 CpG_427
C20orf151 20 60436252 140893
GRHL2 8 102574732 79977 CpG_104
C20orf151 20 60436106 140893
62
CA 02849120 2014-03-18
WO 2013/055530 PCT/US2012/057777
Table 3 (cont.) methylated cytosine nucleotides associated with mesenchymal
phenotype
Gene CHROMOSOME POSITION EntrezID CpG_island
SULT2B1 19 53747255 6820
SULT2B1 19 53747244 6820
SULT2B1 19 53747224 6820
SULT2B1 19 53747250 6820
CBLC 19 49973124 23624
NRBP1,
KRTCAP3 2 27519011 29959, 200634 CpG_42
NRBP1,
KRTCAP3 2 27518654 29959, 200634 CpG_42
GRHL2 8 102573658 79977 CpG_31
DOK7 4 3457234 285489
FAM110A 20 770788 83541 CpG_71
NRBP1,
KRTCAP3 2 27518643 29959, 200634 CpG_42
PWWP2B 10 134071623 170394
TALD01 11 753339 6888
OVOL1 11 65310618 5017 CpG_204
SH3YL1 2 253656 26751 CpG_176
7 139750225
LAD1 1 199635571 3898 CpG_54
TMEM159,
DNAH3 16 21078568 57146, 55567
GRHL2 8 102573922 79977 CpG_31
PDGFRA, LNX1 4 54152402 5156, 84708
LAD1 1 199635569 3898 CpG_54
LAD1 1 199635537 3898 CpG_54
KRT8 12 51586560 3856
3 135552584
19 49971605
ITGB6 2 160822102 3694
ADAP1 7 952310 11033
ADAP1 7 952245 11033
PROM2 2 95304202 150696
PROM2 2 95304432 150696
PROM2 2 95303758 150696
SYT8 11 1811862 90019
16 70401148
17 15737821
QS0X1 1 178404541 5768
CCDC85C 14 99114910 317762
63
CA 02849120 2014-03-18
WO 2013/055530 PCT/US2012/057777
Table 3 (cont.) methylated cytosine nucleotides associated with mesenchymal
phenotype
Gene CHROMOSOME POSITION EntrezID CpG_island
C1orf116 1 205273070 79098
GRHL2 8 102576558 79977
C19orf46 19 41191166 163183
CBLC 19 49973366 23624
CAMK2G 10 75302072 818
SCNN1A 12 6354990 6337
SCNN1A 12 6354868 6337
JUP 17 37182909 3728
19 60699327
VCL 10 75485630 7414
BOLA2, TBX6 16 30009181 552900, 6911
IMMP2L 7 110988180 83943
5LC44A2 19 10596548 57153 CpG_46
8 144726627
RAI1 17 17572988 10743
SYT1 12 78333487 6857
8 28514725
6 134742250
GPR56 16 56211203 9289
EPN3 17 45967146 55040
GPR56 16 56211170 9289
C4orf36 4 88031692 132989
ARL13B, STX19 3 95230218 200894, 415117
2 70222288 CpG_118
PVRL4 1 159326053 81607
1 27066922
GPR110 6 47117696 266977
EPHB2 1 23025895 2048
ANKRD22 10 90601891 118932
ZNF398 7 148472457 57541
PWWP2B 10 134071845 170394
ARHGAP32 11 128399061 9743
7 80389667
4 154136934
1 27023897
19 1855554
BAIAP2 17 76626137 10458
PLXNB2 22 49062595 23654
64
CA 02849120 2014-03-18
WO 2013/055530 PCT/US2012/057777
Table 3 (cont.) methylated cytosine nucleotides associated with mesenchymal
phenotype
Gene CHROMOSOME POSITION EntrezID CpG_island
ACAA1 3 38150460 30
DNAJC17 15 38867650 55192
7 72795287
COL18A1,
SLC19A1 21 45757802 80781, 6573
LOC643008,
RECQL5 17 71147845 643008, 9400
MANE 3 51401417 7873
TRAK1 3 42147101 22906
GRB7 17 35147329 2886
C1orf210 1 43524150 149466
RNF144A 2 7089548 9781
GRB7 17 35147290 2886
19 58230499
1 234153824
PPFIBP2 11 7578132 8495
GPR81 12 121777086 27198
19 58230695
8 101497819
CPEB3 10 93872825 22849
RABGAP1L 1 173111113 9910
RABGAP1L 1 173111020 9910
RNF207 1 6202430 388591
MUC1 1 153429495 4582
1 2456135
PLEKHG6 12 6292029 55200
PLEKHG6 12 6292067 55200
PNPLA8 7 107955947 50640
RASA3 13 113862226 22821
ARL13B, STX19 3 95230100 200894, 415117
VTI1A 10 114516704 143187
COL21A1 6 56342813 81578
2 74064468 CpG_113
SDCBP2 20 1258000 27111
FAM167A 8 11340393 83648
5100A14 1 151855551 57402
PRSS8 16 31054183 5652
HIVEP3 1 41753450 59269
CA 02849120 2014-03-18
WO 2013/055530 PCT/US2012/057777
Table 3 (cont.) methylated cytosine nucleotides associated with mesenchymal
phenotype
Gene CHROMOSOME POSITION EntrezID CpG_island
PRSS8 16 31054700 5652
SULT2B1 19 53747202 6820
C19orf46,
ALKBH6 19 41191679 163183, 84964 CpG_49
C19orf46,
ALKBH6 19 41191506 163183, 84964
C19orf46,
ALKBH6 19 41191561 163183, 84964 CpG_49
17 52465903
RAP1GAP2 17 2855119 23108
C10orf91 10 134110971 170393
8 144892814
9 131184926 CpG_71
BMF 15 38186423 90427
RGS3 9 115383006 5998
19 17763242
19 50356091
DLEU1 13 49829837 10301
MBP 18 72930014 4155
1 150076158
JMJD7-
PLA2G4B 15 39917942 8681
PARD3 10 34756309 56288
MICAL2 11 12226862 9645
ANKFY1 17 4098222 51479
CDKN1A 6 36758711 1026
19 49971610
JARID2 6 15564181 3720
SGSM2 17 2197812 9905
SMARCD2 17 59270462 6603
PNKD 2 218868246 25953
EVPLL 17 18221746 645027
EVPLL 17 18221574 645027
MED16 19 834879 10025
RAB24 5 176661618 53917
7 155407629
ERBB2 17 35115639 2064
CGN 1 149751930 57530
8 8356184
66
CA 02849120 2014-03-18
WO 2013/055530 PCT/US2012/057777
Table 3 (cont.) methylated cytosine nucleotides associated with mesenchymal
phenotype
Gene CHROMOSOME POSITION EntrezID CpG_island
GNAI3 1 109914827 2773
8 37880723
ANKRD22 10 90601835 118932
15 81670543
PAK4 19 44350154 10298
PRR15L 17 43390182 79170
RAB17 2 238164820 64284
P2RY2 11 72616798 5029
22 28307949
8 144893700 CpG_78
SPINT1 15 38923085 6692 CpG_135
PVRL4 1 159326159 81607
6 13981646 CpG_39
C1orf210 1 43524056 149466
7 139750233
TBC1D1 4 37666838 23216
7 72795153
2 238165064
ARHGAP32 11 128399150 9743
12 88144203
TMC8 17 73650109 147138
ABCF1 6 30667066 23
ST3GAL4 11 125781216 6484
ST3GAL4 11 125781207 6484
STAP2 19 4289769 55620
STAP2 19 4289932 55620
LAMA3 18 19706827 3909
1 201096568 CpG_80
GSDMC 8 130868275 56169
AFF1 4 88113322 4299
17 71380179
14 34872148
ASB13 10 5742089 79754
CLDN7 17 7106144 1366 CpG_159
CDC42BPG 11 64367663 55561
FAM46B 1 27207475 115572
EPS8L1 19 60278851 54869
16 70401060 CpG_91
67
CA 02849120 2014-03-18
WO 2013/055530 PCT/US2012/057777
Table 3 (cont.) methylated cytosine nucleotides associated with mesenchymal
phenotype
Gene CHROMOSOME POSITION EntrezID CpG_island
ESRP2 16 66825963 80004
IL1ORB 21 33563377 3588
C14orf43 14 73281541 91748
CCDC120 X 48803602 90060
CCDC120 X 48803499 90060
ESRP2 16 66825753 80004
CNKSR1 1 26377135 10256
CLDN7 17 7107442 1366 CpG_159
SCNN1A 12 6354974 6337
MUC1 1 153429380 4582
PRSS8 16 31054500 5652
SLC35B3 6 8381262 51000 CpG_68
12 13179838
EPS8L1 19 60279005 54869
GPR110 6 47118136 266977
LAMA3 18 19706728 3909
PVRL4 1 159325951 81607
PVRL4 1 159326082 81607
RIPK4 21 42058454 54101
NEURL1B 5 172048817 54492
PROM2 2 95303838 150696
FAM167A 8 11340449 83648
CLDN4 7 72882009 1364
8 102573068
CANT1 17 74513111 124583
PRR15L 17 43390296 79170
MICALL2 7 1461837 79778
NCOA2 8 71402682 10499
ITGB6 2 160764766 3694
ITGB6 2 160764846 3694
14 64792338
8 102573146
NRBP1,
KRTCAP3 2 27518632 29959, 200634 CpG_42
TMEM159,
DNAH3 16 21078598 57146, 55567
ADAP1 7 952156 11033
68
CA 02849120 2014-03-18
WO 2013/055530 PCT/US2012/057777
Table 3 (cont.) methylated cytosine nucleotides associated with mesenchymal
phenotype
Gene CHROMOSOME POSITION EntrezID CpG_island
TMEM159,
DNAH3 16 21078428 57146, 55567
SH3YL1 2 253559 26751 CpG_176
7 139750252
PR5522 16 2848212 64063
PR5522 16 2848220 64063
SDCBP2 20 1257800 27111
LAMA3 18 19707129 3909
2 74064398 CpG_113
2 74064365 CpG_113
DAPP1 4 100956844 27071
DAPP1 4 100956853 27071
DAPP1 4 100957034 27071
1 999308
ATG9B 7 150352451 285973
CLDN7 17 7107017 1366 CpG_159
9 131185398 CpG_71
STX2 12 129868969 2054 CpG_56
CNKSR1 1 26376578 10256
E2F4, ELMO3 16 65790778 1874, 79767
E2F4, ELMO3 16 65790422 1874, 79767
CNKSR1 1 26376365 10256
CNKSR1 1 26376363 10256
ARAP1,
STARD10 11 72169819 116985, 10809 CpG_41
CNKSR1 1 26376520 10256
CNKSR1 1 26376434 10256
CNKSR1 1 26376449 10256
MUC1 1 153429376 4582
PRSS8 16 31054545 5652
PRSS8 16 31054555 5652
7 72795319
PDGFRA, LNX1 4 54152685 5156, 84708
C20orf151 20 60436261 140893
LAD1 1 199635654 3898 CpG_54
PDGFRA, LNX1 4 54152599 5156, 84708
12 50912694 CpG_79
69
CA 02849120 2014-03-18
WO 2013/055530 PCT/US2012/057777
Table 3 (cont.) methylated cytosine nucleotides associated with mesenchymal
phenotype
Gene CHROMOSOME POSITION EntrezID CpG_island
GRHL2 8 102573655 79977 CpG_31
GRHL2 8 102573677 79977 CpG_31
GRHL2 8 102574689 79977 CpG_104
GRHL2 8 102573797 79977 CpG_31
GRHL2 8 102573623 79977 CpG_31
RNF144A 2 7089414 9781
NCRNA00093, 100188954,
DNMBP 10 101680658 23268
PRKCA 17 62088295 5578
K1AA0247 14 69194460 9766
ELF3 1 200246387 1999
ELF3 1 200246469 1999
ELF3 1 200246561 1999
GAS8 16 88638299 2622
HSH2D 19 16115489 84941
C10orf91 10 134111403 170393
12 88143460
SYT8 11 1812078 90019
SYT8 11 1812322 90019
126879805
4 8587017
ERGIC1 5 172264397 57222
12 50911753
SYT8 11 1812236 90019
8 144727414
16 11613936
CLDN7 17 7106555 1366 CpG_159
5 74369044
BAIAP2 17 76625947 10458
BAIAP2 17 76625872 10458
OPA3 19 50723356 80207
GRHL2 8 102573740 79977 CpG_31
GRHL2 8 102573842 79977 CpG_31
8 102085088
CLDN7 17 7106633 1366 CpG_159
CLDN7 17 7107214 1366 CpG_159
ERBB3 12 54761038 2065 CpG_116
CA 02849120 2014-03-18
WO 2013/055530 PCT/US2012/057777
Table 3 (cont.) methylated cytosine nucleotides associated with mesenchymal
phenotype
Gene CHROMOSOME POSITION EntrezID CpG_island
CLDN7 17 7105010 1366 CpG_159
16 2999774
15 72610634
11 66579429
ANKRD22 10 90601762 118932
14 64239802
14 64239962
8 144893629 CpG_78
5LC44A2 19 10596578 57153 CpG_46
Table 4 methylated cytosine nucleotides associated with epithelial
phenotype
Gene CHROMOSOME POSITION EntrezID CpG_island
HBQ1 16 170343 3049 CpG_150
HBQ1 16 170341 3049 CpG_150
118912877 CpG_110
17 44427906 CpG_255
IGF2BP1 17 44430879 10642 CpG_255
4 25120404
TC2N 14 91391048 123036
ALDH3B2 11 67204971 222
MY01D 17 28170353 4642
SYK 9 92692359 6850
SYK 9 92659288 6850
AMICA1 11 117590130 120425
MAL2 8 120326244 114569
MACROD2 20 14267035 140733
OVOL2 20 17972215 58495
CAPN13 2 30821257 92291
PLG 6 161094476 5340
71
CA 02849120 2014-03-18
WO 2013/055530
PCT/US2012/057777
Table 4 (cont.)
methylated cytosine nucleotides associated with epithelial phenotype
Gene CHROMOSOME POSITION EntrezID
CpG_island
NCALD 8 102871791 83988
6 147353266
14 100245858 CpG_79
14 100245905 CpG_79
14 100246063 CpG_79
TRIM9 14 50630238 114088 CpG_199
K1AA0040 1 173395004 9674
K1AA0040 1 173396807 9674
7 50601267
8 127777938
7 50601390
7 50601219
SYDE1 19 15079713 85360 CpG_56
11 65013559
NUAK1 12 104998452 9891
MMP2 16 54071026 4313 CpG_42
ZNF521 18 21184882 25925
ZNF521 18 21185001 25925
IRF6 1 208029710 3664
SRD5A2 2 31656355 6716
MMP2 16 54070981 4313 CpG_42
IGF2BP1 17 44430854 10642 CpG_255
ZC4H2 X 64171686 55906 CpG_71
12 72730512
IGF2BP1 17 44430757 10642 CpG_255
PAX7 1 18830954 5081 CpG_205
17 44427856 CpG_255
MLLT11 1 149299347 10962 CpG_53
MLLT11 1 149299586 10962
6 114284192
6 114284228
6 114284034
6 114284022
118912831 CpG_110
10 118912483 CpG_110
10 118912726 CpG_110
X 64171940 CpG_71
72
CA 02849120 2014-03-18
WO 2013/055530
PCT/US2012/057777
[0168] This invention will be better understood from the Examples that
follow. However, one
skilled in the art will readily appreciate that the specific methods and
results discussed are merely
illustrative of the invention as described more fully in the claims which
follow thereafter, and are not
to be considered in any way limited thereto.
EXAMPLES
[0169] Example 1 ¨ Materials and Methods
[0170] Fluidigm expression analysis: EMT gene expression analysis was
conducted on 82
NSCLC cell lines using the BioMark 96 x 96 gene expression platform (Fluidigm)
and a 20-gene
EMT expression panel (Supplementary Table Si and Methods). The ACt values were
used to cluster
cell lines according to EMT gene expression levels using Cluster v.3.0 and
Treeview v.1.60 software.
[0171]
Illumina Infinium analysis: Microarray data were collected at Expression
Analysis, Inc.
(Durham, N.C.) using the Illumina Human Methylation 450 BeadChip (Illumina,
San Diego, CA) as
described below. Array data were analyzed and a methylation classifier was
established using a
"leave-one-out" cross-validation strategy (described below and in refs. 25,
26). Array data have been
submitted to the Gene Expression Omnibus database (accession number G5E36216).
[0172] Cell Lines: All of the NSCLC cell lines were purchased from the
American Type Cell
Culture Collection (ATCC) or were provided by Adi Gazdar and John Minna at UT
Southwestern.
The immortalized bronchial epithelial (gBECs) and small airway (gSACs) cell
lines were created at
Genentech using a tricistronic vector containing cdk4, hTERT, and G418 as a
selection marker. The
tricistronic vector was engineered from the pQCXIN backbone containing hTERT.
The
immortalization process was based on previously published protocols with some
modification
(Ramirez, Sheridan et al. 2004; Sato, Vaughan et al. 2006). The gBECs and
gSACs have a diploid
karyotype and are non-tumorigenic. Treatment of cell lines with 5-azadC,
erlotinib, or TGF131 was
performed as described.
[0173] NSCLC Normal Lung Tissue, Primary Tumor and Biopsy Tissue: 31 NSCLC
fresh-frozen
primary tumor tissues (N=28 adenocarcinoma, 3 squamous cell carcinoma)
representative of early
stage, surgically resectable tumors and 60 formalin-fixed paraffin-embedded
(FFPE) NSCLC biopsies
from patients who went on to fail frontline chemotherapy. 35 fresh-frozen
normal lung tissues (31
matched to primary tumor tissues were also part of this collection). All
samples were obtained with
informed consent under an IRB approved protocol. All samples were evaluated by
a pathologist for
tissue quality and tumor stage, grade, and tumor content. Peripheral blood
mononuclear cells (N=20)
were obtained from healthy volunteers at the Genentech clinic.
73
CA 02849120 2014-03-18
WO 2013/055530 PCT/US2012/057777
[0174] 5-azadC Treatment and TGF[31 Treatment: Cells were grown in RPMI
1640 supplemented
with 10% fetal bovine serum and 2 mM L-Glutamine. Cells were seeded on day 0
at 4000-9000
cells/cm2 and dosed with 1 [LM 5-aza-2'-deoxycytidine (5-aza-dC) (SIGMA-
ALDRICH Cat No.
A3656) or DMSO control (Cat No. D2650) on days 1, 3, and 5. On day 6 cells
were washed once in
cold PBS and harvested by scraping in Trizol (Invitrogen, Cat No 15596018) and
extracted for RNA
or flash frozen for later RNA extraction. For induction of EMT, cells were
plated at 20000-50000
cells/10cm2 in complete medium and supplemented with 2 ng/mL human
transforming growth factor
beta 1 (TGF[31) (R&D Systems, Cat No 100-B/CF) or PBS control. Media and
TGF[31 were replaced
every 3 days, and RNA was extracted at 4-5 weeks following TGF[31 induction of
EMT. Gene
expression changes were assessed using Taqman assays for the 20-gene EMT panel
(Figure 1).
[0175] Erlotinib Treatment: For erlotinib IC50 determination, cells were
plated in quadruplicate at
3x10² cells per well in 384-well plates in RPMI containing 0.5% FBS (assay
medium) and incubated
overnight. 24 hours later, cells were treated with assay medium containing 3
nM TGFa and erlotinib
at a dose range of 10 [LM ¨ 1 pM final concentration. After 72 hrs, cell
viability was measured using
the Celltiter-Glo Luminescent Cell Viability Assay (Promega). The
concentration of erlotinib
resulting in 50% inhibition of cell viability was calculated from a 4-
parameter curve analysis and was
determined from a minimum of two experiments. Cell lines exhibiting an
erlotinib IC50 < 2.0 [LM
were defined as sensitive, 2.0 - 8.0 [tMas intermediate, and > 8.0 [LM as
resistant.
[0176] Fluidigm Gene Expression Analysis: 2 1 of total RNA was reverse-
transcribed to cDNA
and pre- amplified in a single reaction using Superscript III/Platinum Taq
(Invitrogen) and Pre-
amplification reaction mix (Invitrogen). 20 Taqman primer/probe sets selected
for the EMT
expression panel (Figure 1) were included in the pre-amplification reaction at
a final dilution of 0.05x
original Taqman assay concentration (Applied Biosystems). The thermocycling
conditions were as
follows: 1 cycle of 50 C for 15 min, 1 cycle of 70 C for 2 min, then 14 cycles
of 95 C for 15 sec and
60 C for 4 min.
[0177] Pre-amplified cDNA was diluted 1.94-fold and then amplified using
Taqman Universal
PCR MasterMix (Applied Biosystems) on the BioMark BMK-M-96.96 platform
(Fluidigm) according
to the manufacturer's instructions. All samples were assayed in triplicate.
Two custom-designed
reference genes that were previously evaluated for their expression stability
across multiple cell lines,
fresh-frozen tissue samples, and FFPE tissue samples, AL-1377271 and VPS-33B,
were included in
the expression panel. A mean of the Ct values for the two reference genes was
calculated for each
sample, and expression levels of EMT target genes were determined using the
delta Ct (dCt) method
as follows: Mean Ct (Target Gene) - Mean Ct (Reference Genes).
[0178] Illumina Infinium Analysis: Microarray data was collected at
Expression Analysis, Inc.
(Durham, NC; www.expressionanalysis.com) using the IlluminaHumanMethylation450
BeadChip
74
CA 02849120 2014-03-18
WO 2013/055530 PCT/US2012/057777
(Illumina). These arrays contain probes for approximately 450,000 CpG loci
sites. Target was
prepared and hybridized according to the "Illumina Infinium HD Methylation
Assay, Manual
Protocol" (Illumina Part # 15019522 Rev. A).
[0179] Bisulfite Conversion: A bisulfite conversion reaction was employed
using 500 ng of
genomic DNA according to the manufacturer's protocol for the Zymo EZ DNA
Methylation kit
(Zymo Research). DNA was added to Zymo M-Dilution buffer and incubated for 15
min at 37 C. CT-
conversion reagent was then added and the mixture was denatured by heating to
95 C for 30 s
followed by incubation for 1 h at 50 C. This denature/incubation cycle was
repeated for a total of 16
h. After bisulfite conversion, the DNA was bound to a Zymo spin column and
desulfonated on the
column using desulfonation reagent per manufacturer's protocol. The bisulfite-
converted DNA was
eluted from the column in 10 1 of elution buffer.
[0180] Infinium Methylation Assay: 4 1 of bisulfite converted product was
transferred to a new
plate with an equal amount of 0.1N NaOH and 20 ul of MA1 reagent (Illumina)
then allowed to
incubate at RT for 10 min. Immediately following incubation, 68 ul of MA2
reagent and 75 ul of
MSM reagent (both Illumina) were added and the plate was incubated at 37 C
overnight for
amplification. After amplification, the DNA was fragmented enzymatically,
precipitated and
resuspended in RA1 hybridization buffer. Hybridization and Scanning:
Fragmented DNA was
dispensed onto the multichannel HumanMethylation BeadChips and hybridization
performed in an
Illumina Hybridization oven for 20 h. BeadChips were washed, primer extended,
and stained per
manufacturer protocols. BeadChips were coated and then imaged on an Illumina
iScan Reader and
images were processed with GenomeStudio software methylation module (version
1.8 or later).
[0181] Infinium Analysis: Methylation data were processed using the
Bioconductor lumi software
package (Du, Kibbe et al. 2008). The Infinium 450K platform includes Infinium
I and II assays on the
same array. The Infinium I assay employs two bead types per CpG locus, with
the methylated state
reported by the red dye in some cases and the green dye in others (identical
to the previous Infinium
27K platform). The Infinium II assay uses one bead type and always reports the
methylated state with
the same dye, making dye bias a concern. A two-stage normalization procedure
was applied to the
arrays: First, for each array, a color-bias correction curve was estimated
from Infinium I data using a
smooth quantile normalization method; this correction curve was then applied
to all data from that
array. Second, arrays were normalized to one another by applying standard
quantile normalization to
all color-corrected signals. After pre-processing, both methylation M-values
(log2 ratios of
methylated to unmethylated probes) and -values (a rescaling of the M-values to
the 0 and 1 range via
logistic transform) were computed for each sample (Du, Zhang et al. 2010). For
visualization,
agglomerative hierarchical clustering of -values was performed using complete
linkage and Euclidean
distance.
CA 02849120 2014-03-18
WO 2013/055530 PCT/US2012/057777
[0182] Methylation Classifier: A 10x10-fold cross validation strategy was
used to select a set of
differentially methylated CpG sites (DMRs) and to simultaneously evaluate the
accuracy of a
methylation-based EL vs. ML classifier. Cell lines were split into 10 evenly
sized groups. Using 9
tenths of the lines (the training set), candidate DMRs were identified by
first computing a moving
average for each cell line's M-values (500 bp windows centered on interrogated
CpG sites); then, a t-
test was used to contrast the window scores associated epithelial-like vs.
mesenchymal-like training
lines. DMR p-values were adjusted to control the False Discovery rate
(Benjamini and Hochberg
1995) and compared to a cutoff of 0.01. To enrich for more biologically
relevant phenomena,
candidates were required to have average window scores which (i) differed by
at least 1 unit between
the epithelial and mesenchymal lines, and (ii) had opposite sign in the two
sets of cell lines. This
process yielded both mesenchymal-associated (positive signal) and epithelial-
associated (negative
signal) candidate DMRs. To assess performance, the 1 tenth of lines held out
for testing were scored
by summing their signal for positive DMRs and subtracting off signal for
negative DMRs and then
dividing through by the total number of DMRs. The known epithelial vs.
mesenchymal labels for the
test lines were compared to the sign of the result. Finally, the cross-
validation process was repeated
with each tenth taking the test set role. Finally, the cross-validation
process itself was repeated 9 more
times, and the overall accuracy assessment was the average of the 100
different test set accuracy
rates. To construct a final set of DMRs, we only retained candidates
identified as relevant in 100% of
the cross-validation splits. Contiguous DMRs which met this criterion were
merged into a single
DMR if they were separated by less than 2 kb.
[0183] Expression-based EMT score: Behavior of some genes in our 20-gene
Fluidigm expression
panel was seen to differ between cell lines and tumor samples. To identify a
more robust subset of this
panel for purposes of EL vs. ML classification, we took CDH1 expression as an
EMT anchor, and
then selected genes (13 in total) whose correlation with CDH1 showed the same
sign in both cell lines
and tumor samples. To assign an EMT expression score to the tumor samples, -
dCT values for each of
the 13 genes were first centered to have mean 0 and scaled to have standard
deviation 1. Next signs
were flipped for those genes showing negative correlation with CDH1. Finally,
individual tumor
sample scores were computed by averaging the standardized and sign-adjusted
results.
[0184] Bisulfite sequencing and analysis: Genomic DNA was bisulfite-
converted using the EZ
DNA Methylation-Gold kit (Zymo Research). Primers specific to the converted
DNA were designed
using Methyl Primer Express software v1.0 (Applied Biosystems) (Sequences
available upon request).
PCR amplification was performed with 1 1 of bisulfite- converted DNA in a 25-
1 reaction using
Platinum PCR supermix (Invitrogen). The PCR thermocycling conditions were as
follows: 1 initial
denaturation cycle of 95 C for 10 minutes, followed by 10 cycles of 94 C for
30 seconds, 65 C for 1
minute and decreasing by 1 C every cycle, and 72 C for 1 minute, followed by
30 cycles of 94 C for
30 seconds, 55 C for 1.5 minutes, and 72 C for 1 minute, followed by a final
extension at 72 C for 15
76
CA 02849120 2014-03-18
WO 2013/055530 PCT/US2012/057777
minutes. PCR products were resolved by electrophoresis using 2% agarose E-gels
containing ethidium
bromide (Invitrogen) and visualized using a FluorChem 8900 camera (Alpha
Innotech).
[0185] PCR products were ligated into the pCR4-TOPO vector using the TOPO
TA Cloning kit
(Invitrogen) according to the manufacturer's instructions. 2 1 of ligated
plasmid DNA were
transformed into TOP10 competent bacteria (Invitrogen), and 100 1 transformed
bacteria were plated
on LB-agar plates containing 50 g/m1 carbenicillin (Teknova) and incubated
overnight at 37 C.
Twelve colonies per cell line for each candidate locus were inoculated into 1
ml of LB containing 50
[tg/m1 carbenicillin and grown overnight in a shaking incubator at 37 C.
Plasmid DNA was isolated
using a Qiaprep miniprep kit in 96- well format (Qiagen) and sequenced on a
3730x1 DNA Analyzer
(Applied Biosystems).
[0186] Bisulfite sequencing analysis: Sequencing data were analyzed using
Sequencher v 4.5
software and BiQ Analyzer software (Bock, Reither et al. 2005).
[0187] Pyrosequencing: Bisulfite-specific PCR (BSP) primers were designed
using Methyl Primer
Express software v 1.0 (Applied Biosystems) or PyroMark Assay Design software
v 2.0 (Qiagen).
PCR primers were synthesized with a 5' biotin label on either the forward or
reverse primer to
facilitate binding of the PCR product to Streptavidin Sepharose beads.
Sequencing primers were
designed in the reverse direction of the 5'-biotin-labeled PCR primer using
PyroMark Assay Design
software v 2.0 (Qiagen). Primer sequences are available upon request. 1 [L1
bisulfite modified DNA
was amplified in a 25 1 reaction using Platinum PCR Supermix (Invitrogen) and
20 1 of PCR
product was used for sequencing on the Pyromark Q24 (Qiagen). PCR products
were incubated with
Streptavidin Sepharose beads for 10 minutes followed by washes with 70%
ethanol, Pyromark
denaturation solution, and Pyromark wash buffer. Denatured PCR products were
then sequenced
using 0.3 [LM sequencing primer. Pyrograms were visualized and evaluated for
sequence quality, and
percent methylation at individual CpG sites was determined using PyroMark
software version 2Ø4
(Qiagen).
[0188] Quantitative Methylation Specific PCR: A quantitative methylation
specific PCR (qMSP)
assays targeting DMRs identified by Infinium profiling was designed. Sodium
bisulfite converted
DNA was amplified with various 20x Custom Taqman Assays using TaqMan
Universal PCR
Master Mix, No AmpErase UNG (Applied Biosystems) with cycling conditions of
95 C 10 min,
then 50 cycles of 95 C for 15 sec and 60 C for 1 min. Amplification was done
on a 7900HT and
analyzed using SDS software (Applied Biosystems). DNA content was normalized
using meRNaseP
Taqman assay. qMSP of FFPE material was performed using a pre-amplification
procedure.
[0189] Pre-amplification of FFPE Tumor Material: Aa pre-amplification
method for methylation
analysis of pico gram amounts of DNA extracted from formalin-fixed paraffin
embedded (FFPE)
tissue was developed as follows. 2 1 (equivalent of 100 pg ¨ 1 ng) bisulfite
converted DNA was first
77
CA 02849120 2014-03-18
WO 2013/055530 PCT/US2012/057777
amplified in a 20 1 reaction with 0.1x qMSP primer-probe concentrations using
TaqMan Universal
PCR Master Mix, No AmpErase UNG (Applied Biosystems, Cat No. 4324018) and
cycling
conditions of 95 C 10 min, then 14 cycles of 95 C for 15 sec and 60 C for 1
min. 1 1 of the pre-
amplified material was then amplified in a second PCR reaction with cycling
conditions of 95 C 10
min, then 50 cycles of 95 C for 15 sec and 60 C for 1 min. DNA content was
confirmed using a pre-
amplification with the reference meRNaseP Taqman assay and only samples that
were positive for
meRNaseP were included in further analysis of qMSP reactions. All reactions
were performed in
duplicate.
[0190] Example 2 - Epithelial-like and mesenchymal-like expression
signatures correlate
with erlotinib sensitivity in vitro
[0191] A gene expression signature that correlates with in vitro
sensitivity of NSCLC cell lines to
erlotinib was previously defined (11). This gene set was highly enriched for
genes involved in EMT.
A quantitative reverse transcriptase PCR¨based EMT expression panel on the
Fluidigm nanofluidic
platform (Figure 1) was developed. A comparison of the 100-probe set from the
study of Yauch, et al
(11) and the 20-gene EMT Fluidigm panel for 42 of the lines profiled in the
study of Yauch, et al
showed that this 20-gene expression panel is a representative classifier of
EMT (ref 11).
[0192] To further evaluate whether the 20-gene panel was representative of
the phenotypic
changes associated with an EMT, 2 cell lines were treated with TGF131. The
results of this study
showed that TGF131 induced morphologic changes associated with an EMT. The
genes associated
with an epithelial phenotype were downregulated and genes associated with a
mesenchymal
phenotype were upregulated in these cell lines.
[0193] To determine whether DNA methylation profiling could be used to
classify NSCLC cell
lines into epithelial-like and mesenchymal-like groups, the 20-gene expression
panel was used to
assign epithelial-like versus mesenchymal-like status to 82 cell lines. The
NSCLC cell lines used in
this study include most of the lines profiled in the study of Yauch, et al
(11) and an additional 52
lines, which included 6 lines with EGFR mutations. Of the 82 cell lines, 36
were classified as
epithelial-like and 34 were classified as mesenchymal-like on the basis of
their expression of these
markers (Figure 2). The expression data were normalized and median centered
(samples and genes).
Green indicates a low level or no mRNA expression for indicated genes; red
indicates high
expression. Twelve lines (indicated in the bottom cluster of Figure 2) were
classified as epithelial-like
but express a combination of epithelial and mesenchymal markers, indicating
that these lines
represent a distinct biology designated as intermediate. Thus, of the 82 NSCLC
lines, 89% could be
classified clearly as epithelial or mesenchymal. For the most part, this
epithelial-like versus
mesenchymal-like expression phenotype was mutually exclusive, possibly
reflecting a distinct
78
CA 02849120 2014-03-18
WO 2013/055530 PCT/US2012/057777
underlying biology, which may be linked to distinct DNA methylation profiles.
A summary of cell
line descriptions including histology is shown in Figure 8A-B.
[0194] Example 3 - Genome-wide methylation profiles correlate with Fluidigm-
based EMT
signatures in NSCLC cell lines
[0195] The Illumina Infinium 450K array was analysed as a platform for high-
throughput
methylation profiling by comparing the I3-values for 52 probes and sodium
bisulfite sequencing data
on a subset of cell lines (N = 12). A highly significant, strong positive
correlation between
methylation calls by the Infinium array and direct bisulfite sequencing was
observed (r = 0.926).
[0196] To identify DMRs that distinguished between epithelial-like and
mesenchymal-like cell
lines, a cross-validation strategy which simultaneously constructed a
methylation-based classifier was
used and its prediction accuracy assessed, as described in Example 1. When
applied to the 69 cell line
training set, this analysis yielded 549 DMRs representing 915 individual CpG
sites that were selected
as defining epithelial-like versus mesenchymal-like NSCLC cell lines with a
false discovery rate¨
adjusted P value below 0.01 in 100% of the cross-validation iterations. The
cross-validation
estimated accuracy of the methylation-based classifier was 88.0% ( 2.4%, 95%
confidence interval).
[0197] Next, the CpG sites included in our methylation-based EMT classifier
were used to cluster
the 69 NSCLC cell lines (including 6 EGFR-mutant, erlotinib-sensitive lines)
and 2 primary normal
lung cell strains and their immortalized counterparts. This analysis revealed
a striking segregation of
epithelial-like, mesenchymal-like, and normal lines (Figure 3). In this assay,
seventy-two NSCLC cell
lines and normal lung epithelial cells were profiled using the Illumina
Infinium 450K Methylation
array platform. Supervised hierarchical clustering was conducted using 915
probes that were
significantly differentially methylated between epithelial-like and
mesenchymal-like cell lines (false
discovery rate = 0.01; Example 1). Annotated probes sets used for the cluster
analysis are listed. Each
row represents an individual probe on the Infinium 450K array and each column
represents a cell line.
Regions shaded blue in the heat map represent unmethylated regions, regions
shaded red represent
methylated regions. The top color bar shows columns representing the
epithelial-like or
mesenchymal-like status of each cell line as determined by Fluidigm EMT gene
expression analysis.
Green indicates epithelial-like and black indicates mesenchymal-like cell
lines. The bottom color bar
indicates the erlotinib response phenotype of each cell line. Red indicates
erlotinib-sensitive lines;
black indicates erlotinib-resistant lines; gray indicates lines with
intermediate sensitivity to erlotinib.
A Euclidian distance metric was used for clustering without centering; the
color scheme represents
absolute methylation differences.
[0198] Notably, the methylation signal from these CpG sites clustered the
epithelial-like and
mesenchymal-like cell lines into their respective epithelial-like and
mesenchymal-like groups with
only 6 exceptions: the mesenchymal-like lines H1435, HCC4017, H647, H2228,
H1755, and HCC15
79
CA 02849120 2014-03-18
WO 2013/055530 PCT/US2012/057777
clustered with the epithelial-like group. Interestingly, 5 of these 6 lines
clustered closely together into
a distinct subset of the mesenchymal-like lines by EMT gene expression
analysis, suggesting that this
gene expression phenotype associates with a somewhat distinct underlying
methylation signature.
Importantly, the mesenchymal-like phenotype harbors a larger proportion of
hypermethylated sites
than the epithelial phenotype. This suggests that changes in methylation may
be required to stabilize
the phenotypic alterations acquired during an EMT in NSCLCs.
[0199] EGFR-mutant NSCLCs typically present as well-differentiated
adenocarcinomas in the
peripheral lung. Based on their epithelial-like expression phenotype and their
characteristic histology,
the EGFR-mutant cell lines behaved more similarly to epithelial-like lines
than to mesenchymal-like
lines. A segregation pattern of the cell lines based on in vitro sensitivity
to erlotinib was noted (Figure
3, indicated by Sensitivity in the middle). Nearly all erlotinib-sensitive
lines were associated with an
epithelial-like phenotype whereas nearly all mesenchymal-like lines were
resistant to erlotinib.
However, not all epithelial-like lines were sensitive to erlotinib. Ten of the
erlotinib-resistant lines
clustered with the epithelial-like lines, and 4 erlotinib-sensitive lines,
H838, H2030, RERF-LC-MS,
and SK-MES-1, clustered with the mesenchymal-like lines. Notably, H838 and SK-
MES-1 behaved
as outliers with regard to erlotinib sensitivity when clustered by gene
expression using our previously
defined EMT expression signature (11). Some of the other outliers with respect
to erlotinib sensitivity
have mutations that explain their apparent resistance. For example, the
epithelial-like line H1975
harbors a T790M mutation in EGFR and H1993 harbors an MET amplification. These
genetic
alterations confer resistance to erlotinib specifically, suggesting that the
epigenetic signatures
observed are surrogates for the biologic state of the cell line rather than
for erlotinib sensitivity, per
se.
[0200] Example 4 -Sodium bisulfite sequencing of selected DMRs validates
Infmium
methylation profiling
[0201] 17 DMRs identified by Infinium (Figure 4) that were spatially
associated with genes (in the
5' CpG island or intragenic) were examined for their methylation status by
direct sequencing of
cloned fragments of sodium bisulfite¨converted DNA. 5 epithelial-like lines, 4
mesenchymal-like
lines, and one intermediate line were selected for sequencing validation.
Bisulfite sequencing of
approximately 10 clones per cell line for 10 loci revealed that nearly all of
these markers were almost
completely methylated in at least 4 of the mesenchymal-like cell lines and in
the intermediate line
H522. In contrast, these loci were completely unmethylated in all 5 of the
epithelial-like lines. Four of
markers that were methylated in mesenchymal-like lines, ESRP1 and CP2L3/GRHL2,
miR200C,
and MST1R1RON, are involved in epithelial differentiation (2, 27, 28). ESRP1
is an epithelial-specific
regulator of alternative splicing that is downregulated in mesenchymal cells
and CP2L3/GRHL2 is a
transcriptional regulator of the apical junctional complex (27 28); miR200C is
a known negative
regulator of the EMT inducer ZEB1 (29). ESRP1 and GRHL2 expression was
downregulated in a
CA 02849120 2014-03-18
WO 2013/055530 PCT/US2012/057777
larger panel of mesenchymal-like lines relative to all of the epithelial-like
lines, consistent with the
known absence of ESRP proteins in mesenchymal cells and the ability of these
proteins to regulate
epithelial transcripts that switch splicing during EMT. Pyrosequencing
analysis indicated that GRHL2
was also hypermethylated in this broader panel of mesenchymal-like lines
relative to epithelial-like
lines.
[0202] Example 5 - Biologic relevance of DMRs
[0203] To evaluate the role of methylation in regulating expression of the
genes associated with
select DMRs, quantitative PCR was carried out in a panel of 34 5-aza-2'-
deoxycytidine (5-aza-dC)
and dimethyl sulfoxide¨treated NSCLC cell lines. Not all DMRs were associated
with obvious gene
expression changes following 5-aza-dC treatment but a significant induction of
GRHL2, ESRP1, and
CLDN7 transcripts in mesenchymal-like versus epithelial-like lines were noted.
From this group of
genes, CLDN7 was selected as a representative marker of EMT and its
methylation status was
quantified by pyrosequencing in an extended panel of 42 cell lines. Nearly all
of the mesenchymal-
like lines were methylated at the CLDN7 promoter region and exhibited dramatic
induction of CLDN7
expression (>10-fold) in response to 5-aza-dC treatment (Figure 5A and B). In
contrast, CLDN7 was
expressed in the majority of the epithelial-like cell lines and was not
induced further by 5-aza-dC
treatment. These data show a direct link between locus-specific DNA
hypermethylation and
transcriptional silencing in a subset of genes associated with epithelial-like
and mesenchymal-like
states in NSCLC cell lines.
[0204] In Figure 5A, quantitative methylation was determined at 7 CpG sites by
PyroMark analysis
software using the equation: % methylation = (C peak height x 100/C peak
height + T peak height).
Data are represented as the mean SD percentage of methylation at 7 CpG
sites. In Figure 5B,
relative expression of CLDN7 mRNA was determined using a standard ACt method
in 42 (n = 20
epithelial-like, 19 mesenchymal-like, 3 intermediate) DMSO-treated and 5-aza-
dC¨treated NSCLC
cell lines. Expression values were calculated as a fold change in 5-aza-
dC¨treated relative to DMS0-
treated control cells. Data are normalized to the housekeeping gene GAPDH and
represented as the
mean of 2 replicates. DMSO, dimethyl sulfoxide; GAPDH, glyceraldehyde-3-
phosphate
dehydrogenase.
[0205] Example 6 - Quantitative MSP classifies NSCLC cell lines into
epithelial and
mesenchymal subtypes and predicts for erlotinib sensitivity
[0206] Following independent validation of the methylation status of 17
markers by direct
sequencing analysis, 70 NSCLC cell lines were analyzed to determine whether
these markers could
correctly classify epithelial-like and mesenchymal-like phenotypes. On the
basis of sodium bisulfite
sequencing analyses, methylated regions were selected that best distinguished
the epithelial-like lines
from mesenchymal-like lines and quantitative methylation-specific PCR (qMSP)
assays were
81
CA 02849120 2014-03-18
WO 2013/055530 PCT/US2012/057777
designed based on TaqMan technology. qMSP was used as an assay platform
because it has been
shown to have use in detecting tumor-specific promoter hypermethylation in
specimens obtained from
patients with cancer. This method is highly sensitive and specific for
quantifying methylated alleles
and is readily adaptable to high-throughput formats, making it suitable for
clinical applications (30-
33). TaqMan technology is superior to SYBR-based designs for MSP due to the
increased specificity
of the assay imparted by the fluorescent probe, which does not act as a
primer. To normalize samples
for DNA input, a bisulfite-modified RNase P reference assay was designed to
amplify input DNA
independent of its methylation status. Titration curves were conducted using
control methylated DNA,
DNA derived from peripheral blood monocytes (N = 20), and DNA from cell lines
with known
methylation status for each DMR.. Of note, nearly all of the assays developed
resulted in essentially
binary outputs for the presence or absence of methylation, which obviates the
need for defining cutoff
points.
[0207] Thirteen candidate markers of epithelial (E) or mesenchymal (M)
status were tested to
determine if they differentiated epithelial-like from mesenchymal-like cell
lines based on the EMT
gene expression classification, including RONIMST1R (M), STX2 (M), HOXC5 (M),
PEX5L (E),
FAM110A (M), ZEB2 (E), ESRP1 (M), BCAR3 (E), CLDN7 (M), PCDH8 (E), NICX6.2
(M), ME3 (E),
and GRHL2 (M). Ten of 13 markers were significantly associated with epithelial-
like or
mesenchymal-like status in using a P < 0.05 cutoff value (Figure 6). In this
assay, qMSP assays were
used to determine methylation in epithelial-like (n = 36) and mesenchymal-like
(n = 34) NSCLC cell
lines. Total input DNA was normalized using a bisulfite-specific RNase P
TaqMan probe. In Figure 6,
methylation levels are plotted as ¨AG (indicated target gene- RNase P) for
each sample on the y-axis.
An increasing ¨AG value indicates increasing methylation. Cell lines are
grouped by epithelial-
like/mesenchymal-like status on the x-axis. P values were determined using a 2-
tailed, unpaired
Student t test. Receiver operating characteristic (ROC) plots for (B) RON, (D)
FAM11 OA, (F) GRHL2,
and (H) ESRP1 are presented. P values were determined using a Wilcoxon rank-
sum test.
[0208] These same markers were examined to determine if they are predictive of
erlotinib
sensitivity in vitro. Seven of 13 DMRs were strongly predictive of erlotinib
resistance (individual P <
0.005; Figure 7) and 3 of 13 DMRs, PEX5L, ME3, and ZEB2, were significantly
associated with an
epithelial phenotype but were not statistically predictive of erlotinib
sensitivity. In this assay, qMSP
amplification of 58 NSCLC cell line DNA samples was performed using the
indicated qMSP assays.
ROC curves for erlotinib sensitive versus erlotinib resistant cell lines were
generated using R
statistical software. P-value was determined using a Student's t-test. Figure
7A-M and Figure 8A-B.
82
CA 02849120 2014-03-18
WO 2013/055530 PCT/US2012/057777
References
1. Jemal A, Siegel R, Xu J, Ward E. Cancer statistics, 2010. CA Cancer J Clin
2010;60:277-300.
2. Singh A, Greninger P, Rhodes D, Koopman L, Violette S, Bardeesy N, et al. A
gene expression
signature associated with "K-Ras addiction" reveals regulators of EMT and
tumor cell survival.
Cancer Cell 2009;15:489-500.
3. Herbst RS, Heymach JV, Lippman SM. Lung cancer. N Engl J Med 2008;359:1367-
80.
4. Travis WD, Brambilla E, Noguchi M, Nicholson AG, Geisinger KR, Yatabe Y, et
al. International
association for the study of lung cancer/ American Thoracic Society/European
Respiratory Society:
international multidisciplinary classification of lung adenocarcinoma. J
Thorac Oncol 2011;6:244-85.
5. Sato M, Shames DS, Gazdar AF, Minna JD. A translational view of the
molecular pathogenesis of
lung cancer. J Thorac Oncol 2007;2:327-43.
6. Patel NV, Acarregui MJ, Snyder JM, Klein JM, Sliwkowski MX, Kern
JA.Neuregulin-1 and human
epidermal growth factor receptors 2 and 3play a role in human lung development
in vitro. Am J
Respir Cell Mol Biol 2000;22:432-40.
7. Pao W, Chmielecki J. Rational, biologically based treatment of EGFR mutant
non-small-cell lung
cancer. Nat Rev Cancer 2010;10:760-74.
8. O'Byrne KJ, Gatzemeier U, Bondarenko I, Barrios C, Eschbach C, Martens UM,
et al. Molecular
biomarkers in non-small-cell lung cancer: a retrospective analysis of data
from the phase 3 FLEX
study. Lancet Oncol 2011;12:795-805.
9. Wu J-Y, Wu S-G, Yang C-H, Chang Y-L, Chang Y-C, Hsu Y-C, et al. Comparison
of gefitinib and
erlotinib in advanced NSCLC and the effect of EGFR mutations. Lung Cancer
2011;72:205-12.
10. Shepherd FA, Rodrigues Pereira J, Ciuleanu T, Tan EH, Hirsh V,
Thongprasert S, et al. Erlotinib
in previously treated non-small-cell
lung cancer. N Engl J Med 2005;353:123-32.
11. Yauch RL, Januario T, Eberhard DA, Cavet G, Zhu W, Fu L, et al. Epithelial
versus mesenchymal
phenotype determines in vitro sensitivity and predicts clinical activity of
erlotinib in lung cancer
patients.Clin Cancer Res 2005;11:8686-98.
83
CA 02849120 2014-03-18
WO 2013/055530 PCT/US2012/057777
12. Suda K, Tomizawa K, Fujii M, Murakami H, Osada H, Maehara Y, et al,
Epithelial to
mesenchymal transition in an epidermal growth factorreceptor-mutant lung
cancer cell line with
acquired resistance to erlotinib. J Thorac Oncol 2011;6:1152-61.
13. Sequist LV, Waltman BA, Dias-Santagata D, Digumarthy S, Turke AB,Fidias P,
et al. Genotypic
and histological evolution of lung cancers acquiring resistance to EGFR
inhibitors. Sci Transl Med
2011;3:75ra26.
14. Hanahan D, Weinberg RA. Hallmarks of cancer: the next generation. Cell
2011;144:646-74.
15. Singh A, Settleman J. EMT, cancer stem cells and drug resistance: an
emerging axis of evil in the
war on cancer. Oncogene 2010;29:4741-51.
16. Kalluri R, Weinberg RA. The basics of epithelial-mesenchymal transition. J
Clin Invest
2009;119:1420-8.
17. Mani SA, Guo W, Liao MJ, Eaton EN, Ayyanan A, Zhou AY, et al. The
epithelial-mesenchymal
transition generates cells with properties of stem cells. Cell 2008;133:704-
15.
18. Davidson NE, Sukumar S. Of Snail, mice, and women. Cancer Cell 2005;8:173-
4.
19. Kang Y, Massague J. Epithelial-mesenchymal transitions: twist in
development and metastasis.
Cell 2004;118:277-9.
20. Dumont N, Wilson MB, Crawford YG, Reynolds PA, Sigaroudinia M, Tlsty TD.
Sustained
induction of epithelial to mesenchymal transition activates DNA methylation of
genes silenced in
basal-like breast cancers. Proc Nat! Acad Sci U S A 2008;105:14867-72.
21. Wiklund ED, Bramsen JB, HuIf T, Dyrskjot L, Ramanathan R, Hanse TB, et al.
Coordinated
epigenetic repression of the miR-200 family and miR-205 in invasive bladder
cancer. Int J Cancer
2011;128:1327-34.
22. Stinson S, Lackner MR, Adai AT, Yu N, Kim HJ, O'Brien C, et al. miR-
221/222 targeting of
trichorhinophalangeal 1 (TRPS1) promotes epithelial-to-mesenchymal transition
in breast cancer. Sci
Signal 2011;4:pt5.
23. Stinson S, Lackner MR, Adai AT, Yu N, Kim HJ, O'Brien C, et al. TRPS1
targeting by miR-
221/222 promotes the epithelial-to-mesenchymal transition in breast cancer.
Sci Signal 2011;4:ra41.
24. McDonald OG, Wu H, Timp W, Doi A, Feinberg AP. Genome-scale epigenetic
reprogramming
during epithelial-to-mesenchymal transition. Nat Struct Mol Biol 2011;18:867-
74.
25. Du P, Kibbe WA, Lin SM. lumi: a pipeline for processing Illumina
microarray. Bioinformatics
2008;24:1547-8.
84
CA 02849120 2014-03-18
WO 2013/055530 PCT/US2012/057777
26. Du P, Zhang X, Huang CC, Jafari N, Kibbe WA, Hou L, et al. Comparison of
Beta-value and M-
value methods for quantifying methylation levels by microarray analysis. BMC
Bioinformatics
2010;11:587.
27. Warzecha CC, Jiang P, Amirikian K, Dittmar KA, Lu H, Shen S, et al. An
ESRP-regulated
splicing programme is abrogated during the epithelial-mesenchymal transition.
EMBO J
2010;29:3286-300.
28. Werth M, Walentin K, Aue A, Schonheit J, Wuebken A, Pode-Shakked N, et al.
The transcription
factor grainyhead-like 2 regulates the molecular composition of the epithelial
apical junctional
complex. Development 2010;137:3835-45.
29. Tryndyak VP, Beland FA, Pogribny IP. E-cadherin transcriptional down-
regulation by epigenetic
and microRNA-200 family alterations is related to mesenchymal and drug-
resistant phenotypes in
human breast cancer cells. Int J Cancer 2010;126:2575-83.
30. Belinsky SA, Liechty KC, Gentry FD, Wolf HJ, Rogers J, Vu K, et al.
Promoter hypermethylation
of multiple genes in sputum precedes lung cancer incidence in a high-risk
cohort. Cancer Res
2006;66:3338-44.
31. Brock MV, Hooker CM, Ota-Machida E, Han Y, Guo M, Ames S, et al.
DNAmethylation markers
and early recurrence in stage I lung cancer.N Engl J Med 2008;358:1118-28.
32. Shivapurkar N, Stastny V, Suzuki M, Wistuba II, Li L, Zheng Y, et al.
Application of a
methylation gene panel by quantitative PCR for lung cancers. Cancer Lett
2007;247:56-71.
33. Shames DS, Girard L, Gao B, Sato M, Lewis CM, Shivapurkar N, et al. A
genome-wide screen
for promoter genome-wide screen for promoter methylation in lung cancer
identifie novel methylation
markers for multiple malignancies. PLoS Med 2006;3:e486.
34. Hirsch FR, Varella-Garcia M, Cappuzzo F. Predictive value of EGFR and HER2
overexpression
in advanced non-small-cell lung cancer. Oncogene 2009;28 Suppl 1:S32-7.
35. Moulder SL, Yakes FM, Muthuswamy SK, Bianco R, Simpson JF, Arteaga CL.
Epidermal growth
factor receptor (HER1) tyrosine kinase inhibitor ZD1839 (Iressa) inhibits
HER2/neu (erbB2)-
overexpressing breast cancer cells in vitro and in vivo. Cancer Res
2001;61:8887-95.
36. Hoeflich KP, O'Brien C, Boyd Z, Cavet G, Guerrero S, Jung K, et al. In
vivo antitumor activity of
MEK and phosphatidylinositol 3-kinase inhibitors in basal-like breast cancer
models. Clin Cancer Res
2009; 15:4649-64.
37. Neve RM, Chin K, Fridlyand J, Yeh J, Baehner FL, Fevr T, et al.
Acollection of breast cancer cell
lines for the study of functionally distinct cancer subtypes. Cancer Cell
2006;10:515-27.
CA 02849120 2014-03-18
WO 2013/055530 PCT/US2012/057777
38. Noushmehr H,WeisenbergerDJ, Diefes K,PhillipsHS, Pujara K,Berman BP, et
al. Identification of
a CpG island methylator phenotype that defines a distinct subgroup of glioma.
Cancer Cell
2010;17:510-22.
39. Fang F, Turcan S, Rimner A, Kaufman A, Gin i D, Morris LG, et al. Breast
cancer methylomes
establish an epigenomic foundation for metastasis. Sci Transl Med
2011;3:75ra25.
40. Feinberg AP, Vogelstein B. Hypomethylation distinguishes genes of some
human cancers from
their normal counterparts. Nature 1983; 301:89-92.
41. Baylin SB, Jones PA. A decade of exploring the cancer epigenome¨biological
and translational
implications. Nat Rev Cancer 2011;11:726-34.
42. Sharma SV, Lee DY, Li B, Quinlan MP, Takahashi F, Maheswaran S,et
al.Achromatin-mediated
reversible drug-tolerant state in cancer cell subpopulations. Cell 2010;141:69-
80.
43. Benjamini, Y. and Y. Hochberg (1995). "Controlling the false discovery
rate: a practical and
powerful approach to multiple testing." J Royal Statist Soc B 57(1):289-300.
44. Du, P., W. A. Kibbe, et al. (2008). "Iumi: a pipeline for processing
Illumina microarray."
Bioinformatics 24(13):1547-1548.
45. Du, P., X. Zhang, et al. (2010). "Comparison of Beta-value and M-value
methods for quantifying
methylation levels by microarray analysis." BMC Bioinformatics 11:587.
46. Ramirez, R. D., S. Sheridan, et al. (2004). "Immortalization of human
bronchial epithelial cells in
the absence of viral oncoproteins." Cancer Res 64(24):9027-9034.
47. Sato, M., M. B. Vaughan, et al. (2006). "Multiple oncogenic changes (K-
RAS(V12), p53
knockdown, mutant EGFRs, p16 bypass, telomerase) are not sufficient to confer
a full malignant
phenotype on human bronchial epithelial cells." Cancer Res 66(4):2116-2128.
48. Walter, K., et al, (2012). "DNA Methylation Profiling Defines Clinically
Relevant Biological
Subsets of Non¨Small Cell Lung Cancer." Clin Cancer Res 18:2360.
Incorporation by Reference
All patents, published patent applications and other references disclosed
herein are hereby expressly
incorporated herein by reference.
86
CA 02849120 2014-03-18
WO 2013/055530 PCT/US2012/057777
Equivalents
Those skilled in the art will recognize, or be able to ascertain, using no
more than routine
experimentation, many equivalents to specific embodiments of the invention
described specifically
herein. Such equivalents are intended to be encompassed in the scope of the
following claims. The
term "comprising" as used herein is non-limiting and includes the specified
elements without limiting
to inclusion of further elements.
87