Note: Descriptions are shown in the official language in which they were submitted.
CA 02871303 2014-10-22
WO 2013/188481 PCT/US2013/045301
Decision Support Tool for Operation of a Facility
Technical Field
The presently disclosed subject matter relates to decision support tools for
the
operation of a facility, such as the planning and scheduling operations of the
facility. In
particular, the presently disclosed subject matter relates to a planning and
scheduling
decision support tool that utilizes a strategy based approach for planning and
scheduling
operations in and around a facility (e.g., a petrochemical or refining
facility).
Background
Conventional decision support tools for planning and scheduling problems in
the oil
and gas industry have used simulation and/or optimization models as the
principal solution
technology. These planning and scheduling tools are model-based and numerical
in nature.
The output from these tools is also numerical. For example, the output from an
optimization
model is a set of solution values for the model variables. The outputs imply
the decisions or
actions to be taken. However, the use of an optimization-based solution alone
has certain
limitations.
The set of solution values for the model variables by itself is often
insufficient for the
decision-maker. The decision-maker also needs to understand the intent,
design, or
motivation behind a particular numerical output. The optimization-based
approach does not
identify the strategy that yielded the optimal solution. In most cases, the
strategy for
optimization-based solution must be inferred. This lack of understanding
limits the effective
use of these numerically-based planning and scheduling tools. Furthermore, the
underlying
strategy used in the optimization may not be suitable or best for the
particular business at the
time. While the profitability of the optimized results can be determined, the
profitability of
the inferred strategy remains unclear. As such, the most profitable strategy
or the strategy
most suited for the particular situation may not have been found. Without a
full
understanding of the results and their implications, the results may not be
communicated
easily to higher levels of management or operations staff Furthermore, users
may be
hesitant to execute decisions that are not intuitively understood. In
particular, facility
CA 02871303 2014-10-22
WO 2013/188481 PCT/US2013/045301
operators may be more accustomed to dealing with decision-making that follows
a step-by-
step process based on business logic. In addition, relying on the optimizer
results may not
align with a consistent decision-making process. Finally, it is difficult to
properly assess the
robustness of the optimizer results in light of the uncertainty of the inputs
and the model
itself.
The simulation based approach has similar limitations. The simulation based
approach is not strategy based and frequently relies upon trial and error for
purposes of
identifying suitable planning and scheduling decisions. The decision makers
may run
hundreds of cases in order to develop a program that in the end may not meet
all of the
desired business needs. The simulation approach is rule based and like the
optimization
approach does not produce results that are intuitively understood.
Neither the simulation approach nor the optimization approach attempt to
minimize
the uncertainty associated with unknown variables or parameters (e.g.,
fluctuations in price,
availability of supply or timing of delivery). Furthermore, given the lack of
understanding
associated with the underlying strategy utilized for performing either the
simulation or the
optimization, it is difficult to measure the success of the results against a
performance metric
(e.g., net profit, product slate, timing, etc.).
Also, plans and schedules are forward looking, but conditions that will occur
in the
future may not be known with certainty. Thus, when using a decision support
tool with
uncertain future conditions, the user may need to repetitively enter multiple
different case
scenarios to cover the range of possible conditions that may occur. This
magnifies the
challenge of determining the intent or motivation behind a collection of case
scenarios and
their corresponding results. Thus, there is a need for a tool that is capable
of assessing
different approaches to solving the planning/scheduling problem and provides
output that
overcomes the deficiencies of the prior art.
Summary
The presently disclosed subject matter relates to a strategy based planning
and
scheduling tool that provides decision-makers with the ability to compare the
performance
of different strategies for the operation of the facility so that the
organization can make
2
CA 02871303 2014-10-22
WO 2013/188481 PCT/US2013/045301
better-informed judgments about which approach to use. The presently disclosed
subject
matter provides a method of planning, scheduling and operating a facility. The
method
comprises: (a) using a computer system that stores a strategy-based module
comprising
multiple different strategies, each comprising a procedure for determining the
operation of
the facility; wherein the strategies use multiple input parameters, wherein at
least one of the
input parameters is an uncertain parameter having multiple possible values;
(b) generating a
set of input cases, each input case containing a different set of values for
the parameters, and
each input case being associated with a weighting for that set of values for
the parameters;
(c) applying each strategy to the set of input cases using the strategy-based
module and
calculating a performance metric for each strategy for each input case; (d)
analyzing the
weighted distribution of the performance metric over the set of input cases
for each strategy;
(e) selecting or modifying a strategy based on the analysis of the weighted
distributions; and
(f) operating the facility according to the results of the selected or
modified strategy.
The step of generating of the set of input cases may include receiving
multiple input
values for each uncertain parameter and a weighting factor for each input
value relating to
the weighting of that input value. The weighting factors depend on the
relative impact
desired for each alternative value. For example, this may correspond to the
likelihood or
importance. The weighting of each input case is calculated using the weighting
factors of
the input values of the uncertain parameters. The weighting factor for each
input value is a
normalized relative weighting of that input value within the sample of input
values being
used, and wherein the weighting factors of the input values in each input case
are used (for
example, the weighting factors can be multiplied) to calculate the weighting
of that input
case.
The step of generating the set of input cases may also include receiving
historical
data for one or more of the uncertain parameters; fitting a model to the
historical data;
selecting multiple values from the fitted model; and assigning a weighting
factor for each of
the selected values based on the weighting of that input value occurring.
In accordance with aspects of the presently disclosed subject matter,
operating the
facility includes one or more of physically transferring a material to or from
a vessel,
physically transferring a material to or from a storage tank, physically
transferring a
3
CA 02871303 2014-10-22
WO 2013/188481 PCT/US2013/045301
material to or from processing equipment, or transforming a feed or raw
material into a
different material.
The presently disclosed subject matter provides a computer system for
planning,
scheduling and determining the operation of a facility, the computer system
being
programmed to perform steps that comprise: (a) storing a strategy-based module
comprising
multiple different strategies, each comprising a procedure for determining the
operation of
the facility; wherein the strategies use multiple input parameters, wherein at
least one of the
input parameters is an uncertain parameter having multiple possible values;
(b) generating a
set of input cases, each input case containing a different set of values for
the parameters, and
each input case being associated with a weighting for that set of values for
the parameters;
(c) applying each strategy to the set of input cases using the strategy-based
module and
calculating a performance metric for each strategy for each input case; and
(d) analyzing the
weighting distribution of the performance metric over the set of input cases
for each
strategy. In another embodiment, the present invention provides a non-
transitory machine-
readable storage medium comprising instructions which, when executed by a
processor,
cause the processor to perform these steps.
In another embodiment, the present invention provides a method of operating a
facility, which comprises: (a) using a computer system that stores a strategy-
based module
comprising multiple different strategies, each comprising a procedure for
determining the
operation of the facility; wherein the strategies use multiple input
parameters; (b) generating
an input case that defines a set of values for the input parameters; (c)
applying each strategy
to the input case using the strategy-based module and calculating a
performance metric for
each strategy; (d) comparing the performance metric results for the different
strategies; (e)
selecting or modifying a strategy based on the comparison; and (f) operating
the facility
according to the results of the selected or modified strategy.
Brief Description of the Drawings
FIG. 1 shows an example of a refinery to which the tool of the present
invention can
be applied.
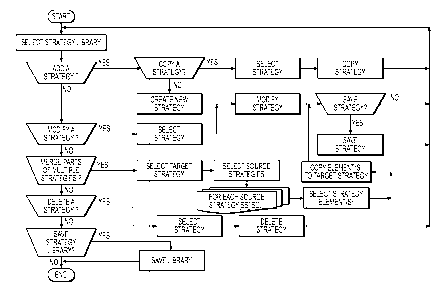
FIG. 2 shows an example of actions that can be applied for working with
strategies.
4
CA 02871303 2014-10-22
WO 2013/188481 PCT/US2013/045301
FIG. 3 shows an example of actions that can be applied for working with
strategy
libraries.
FIG. 4 shows a flowchart illustrating an example of a strategy process that
can be
used in the present invention.
FIG. 5 shows an example of actions that can be applied for entering inputs for
uncertain parameters.
FIG. 6 shows an example of actions that can be applied for working with case
sets.
FIG. 7 shows an example of actions that can be applied for applying strategies
to
cases.
FIG. 8 shows a plot of cumulative distribution curves for three different
strategies.
Detailed Description
The presently disclosed subject matter provides a tool for the operation of a
facility(s). The tool is preferably a decision support tool, but is not
intended to be so
limited; rather, it is contemplated that other tools or means that enable
planning and
scheduling utilizing a strategy are within the scope of the presently
disclosed subject matter.
The presently disclosed subject matter will be described in connection with a
petrochemical
facility for purpose of illustration. It is intended that the presently
disclosed subject matter
may be used in any facility where planning and scheduling operations are a
normal part of
operating the facility. The operation of a petrochemical facility may involve
various
decisions, including the planning of activities, scheduling of activities,
process operations,
blending operations, transportation of materials (e.g. feeds, intermediates,
or products) to
and/or from the facility (e.g. via maritime shipping, rail, truck, pipeline,
etc.), cargo
assignments, vessel assignments, selection of raw or feed materials, and the
timing of these
activities. Examples of petrochemical facilities include, but is not limited
to, refineries,
storage tank farms, chemical plants, lube oil blending plants, pipelines,
distribution
facilities, LNG facilities, basestock production facilities, and blending
facilities. The
presently disclosed subject matter may also be used in connection with
facilities that
produce and transport crude oil. It is also contemplated that the presently
disclosed subject
5
CA 02871303 2014-10-22
WO 2013/188481 PCT/US2013/045301
matter may be used in other operations and facilities that are not associated
with petroleum
and petrochemical processing, but where planning and scheduling issues are
present.
Figure 1 shows an example of a refinery that can be operated utilizing the
presently
disclosed subject matter. The refinery includes storage tanks 20 and
processing equipment
30 (e.g. crude distillation units, catalytic cracking units, hydrocracking
units, blenders,
reactors, separation units, mixers, etc.). Operations in the refinery include
the transfer 12
(discharging and/or loading) of materials between the ships 10 and storage
tanks 20. There
may also be transfers 22 of material between tanks 20. There may also be
transfer 24 of
materials between storage tanks 20 and processing equipment 30. There may also
be transfer
32 of materials between processing equipment 30. Processing equipment 30 may
transform a
feed material or raw material into a different material (e.g. by distillation,
mixing,
separation, or chemical reaction). The operation of the refinery can include
numerous other
activities, such as selection of raw materials, etc. The tool in accordance
with the presently
disclosed subject matter may be utilized to plan and schedule for the
operation of the
facility.
The presently disclosed subject matter enables the planning and scheduling of
a
facility based upon the use of a selected strategy or strategies. The tool
preferably includes a
computer system. The computer system includes a strategy based decision making
module
for planning and scheduling operations (which include but is not limited to
the supply of raw
materials to the facility, the product slate produced by the facility, the
capacity and operating
conditions of the units within the facility). The module preferably contains
at least one
library and each library contains at least one strategy. It is contemplated
that the strategy
based module contains at least one library. Figure 7 illustrates steps that
comprise the
decision making process. The user may first identify a relevant library of
strategies. For
example, a library of strategies utilized for a particular location,
geographic region,
circumstance, or event.
The methodology disclosed in Figure 2 can be used to modify, manipulate,
create,
delete, and perform other related operations on strategies. Each strategy is
unique and
contains certain business drivers or known external factors. Each can be
designed to address
uncertain parameters. The results obtained from the use of strategy may
represent the best
6
CA 02871303 2014-10-22
WO 2013/188481 PCT/US2013/045301
result for scheduling and operating the facility taking into account the
specific objectives of
the strategy (e.g., output of a specific product, supply of raw materials from
a particular
region, shifting resources such that a particular unit within the facility can
be taken offline
without impacting the operation of the entire facility.)
It is contemplated that the strategies can be adapted or refined to create new
strategies taking into account additional known factors or business drivers.
In addition, the
strategies may be modified or adapted to minimize the impact of uncertain
parameters on the
planning and scheduling decisions such that these decisions can be made with
greater
certainty. The strategies may be modified or adapted to improve performance
with respect
to a desired performance metric. The strategies may be location specific
(e.g., country
specific, geographic region specific or facility specific). The strategy is
focused to select or
accomplish the desired business needs, which may vary from day to day. For
example, the
desired product slate produced by the facility may vary based upon, inter
alia, market
conditions, time of year, geopolitical conditions, and other external factors
such as weather.
The optimal planning and scheduling for and the operation of the facility may
vary based
upon each of these factors. The use of the strategy based module in accordance
with the
presently disclosed subject matter permits the decision makers to properly and
optimally
plan for changing conditions such that these conditions are factored into the
planning and
scheduling process.
As mentioned above, the strategy can be developed to address specific
conditions,
business drivers and other external influences. For example, specific
strategies can be
developed and utilized within the module that are based upon certain factors
such as the
supply of raw materials from a specific region of the world, the disruption of
such supply,
the cost of shipping, etc. Furthermore, specific strategies can be utilized to
address certain
unexpected conditions (e.g., weather, or the shutdown or failure of a facility
unit). The
business drivers and goals in advance of, during and after a weather related
event (e.g. a
hurricane) are very different from normal business drivers. The uncertain
parameters
associated with these conditions may impact the generated results. The desire
to have the
facility ready in advance of the weather event will vary the previously
planned and
scheduled operations. The use of the weather based strategy will permit the
users to identify
7
CA 02871303 2014-10-22
WO 2013/188481 PCT/US2013/045301
a plan most suited and most effective for addressing the business drivers for
operating in
advance of the weather event (e.g., unit shutdown, redirecting or delaying the
supply of raw
materials, etc).
In petrochemical and refining operations, unexpected weather conditions are
not the
only weather conditions that impact the operation of the facility and the
planning and
scheduling associated with the same. For example, the product slate produced
in colder
weather may differ from the product slate produced in the same facility during
warmer
seasons. Having specific strategies which address such needs allows the
planners and
operators to more effectively adapt to the changing needs, minimize variances
or the impact
associated with uncertain parameters and provide a strategic basis for why the
plan for
operating the facility has been altered or modified. A specific strategy may
be employed
during a cold winter and a different strategy with different drivers employed
during a mild
winter.
The use of the strategy based module and the library of strategies contained
therein
in accordance with the presently disclosed subject matter allows the user to
utilize a strategy
that is most suited for a particular situation. The strategies focus on
forward planning and
business needs, as such, the use of the such strategies introduces a certain
level of stability in
the decision making process that is not present in the non-strategy
approaches. In response
to changes in uncertain or known parameters, the simulation based approach and
the
optimization approach create a new solution set that completely revamps a
previously
developed schedule. By contrast, the use of the strategy based approach will
permit the
decision maker to identify what impact the changes in the parameters have on
the schedule
and what if any revisions are needed. For example, the change may have minimal
impact on
the results when compared to the performance metric. As such, it may be
preferable to
continue to use the strategy which had been chosen previously. The business
drivers
contained in the strategy can then be used to explain and justify the plan or
result obtained
based upon the strategy. These results may not be the best when compared to
the results
obtained, for example, from a scheduling optimizer, but the results will
likely be the best to
achieve the desired business objectives of the selected strategy.
8
CA 02871303 2014-10-22
WO 2013/188481 PCT/US2013/045301
The presently disclosed subject matter allows the comparison of different
approaches
to decision making for operating a manufacturing facility on the basis of
their relative
performance and robustness. In one embodiment, the present disclosed subject
matter is a
computer-implemented method for determining the operation of a facility. The
method uses
a computer system that is programmed to use a strategy-based module. The user
or a
decision maker may select a set of strategies (i.e. a strategy library) for
consideration. It is
also contemplated that the user could input several parameters or desired
business
objectives. The strategies can be evaluated using one or more input cases, and
the results can
be compared. The user may select one (or multiple) preferred strategy, or the
tool may be
used to determine the preferred strategy. The selected strategy provides the
planning and
scheduling decision making basis for operating the facility.
It is also contemplated that the user can combine, delete and/or modify
strategies to
create new strategies with specific business drivers. It is contemplated that
each of the
strategies associated with the various libraries will receive a common set of
input data. The
weighting of the input data may vary based upon the strategy. It is also
possible to run
different input in different strategies.
Strategy-Based Module
The strategy-based module contains one or more strategies making decisions
that
relate to the operation of the facility. Each strategy is a decision making
method, which may
include business logic for determining the operation of the facility (e.g.
setting decision
variables) for a given set of parameter inputs. Different strategies are
developed to address
different business objectives or needs based upon various known objectives or
drivers and
unknown inputs (such as, for example, the cost of shipping or cost of fuel,
etc). Because
the decision-making process is made explicit in the strategy-based approach,
the intent and
motivation behind the result is more easily understood. Specifically, the
result that is well
suited to meet a known set of business drivers, or a result that preferred on
the basis of a
selected metric. As such, the decision maker will have a better understanding
of the results
even though it might seem counter to the results generated from an optimizer.
Each strategy
may be constructed of any suitable components and may further involve the use
of
9
CA 02871303 2014-10-22
WO 2013/188481 PCT/US2013/045301
mathematical model(s), simulation calculations, rules or logic, optimization,
or other
analytic tools. Furthermore, the results may highlight the impact of a
particular uncertain
parameter (e.g., a particular shipment arriving late). Knowing the parameter,
the user can
take action to influence the outcome of an uncertain parameter to the extent
that they can
(e.g., taking corrective steps to make certain a particular shipment does not
arrive late or as
close to the preferred time as possible). Or, the use can take action to
minimize any negative
impact (or maximize any positive impact) associated with the uncertainty
parameter.
The strategy-based module may use multiple different strategies since there
can be
more than one decision-making process. Different strategies may perform better
under
different conditions. The strategy-based module may also contain interface
tools that allow
the user to create strategies, as well as add, save, delete, modify, edit,
select, copy, merge, or
organize into libraries or groups, or any other administrative task. Figures 2
and 3 show
examples of actions that can be applied for working with strategies and
strategy libraries.
The presently disclosed subject matter permits the user to run input cases
through different
strategies to determine what strategies are more resilient to an uncertain
parameter. If no
strategy is sufficiently resilient, then a strategy may be modified or
combined with another
to improve the resiliency with respect to the uncertain parameter.
Figure 7 illustrates the process for using the strategy-based module in
accordance
with the presently disclosed subject matter. As mentioned above, the user
identifies the
parameters or drivers that are necessary to be considered. The user can select
a desired
strategy or the module can identify the relevant strategy or strategies based
upon the desired
parameters or drivers identified by the user. Figure 2 illustrates how the
strategy or
strategies can be selected, modified and/or combined. Strategies that are
modified may be
saved as new strategies. Similarly, strategies that can be combined may be
saved as a new
strategy. It is contemplated that the strategy library does not contain a
static number of
strategies; rather, the strategies can be modified and combined to create
various new
strategies to address specific business objectives or concerns. An existing
strategy could be
updated to reflect geographic specific factors or facility specific concerns.
CA 02871303 2014-10-22
WO 2013/188481 PCT/US2013/045301
Once the desired strategy or strategies have been selected, the necessary
inputs can
be added. The strategy based module will then identify results based upon the
input and the
specific selected strategies.
As an example in the context of petrochemical transportation, a strategy may
be used
for making decisions in the cargo assignment and/or scheduling of transport
vessels. Such a
strategy could be a basis for making the vessel assignment decisions so as to
determine the
overall vessel program or schedule. To make a feasible vessel program, a
vessel is assigned
to each cargo. The profitability metric is total net margin. FIG. 4 shows an
example of such
an assignment strategy for formulating a vessel program for term and spot
vessels for the
delivery of cargo to two regions, West cargos (which are defined as those
which discharge
in the US or in NorthWest Europe) and East cargos (which are defined as those
which
discharge in the Asia Pacific region). One possible strategy that will be
referred to, for
purposes of illustration, as Strategy-lwill be described in greater detail.
Example: Strategy - 1
The underlying rationale for Strategy -1 is for the vessel program which
maximizes the
utilization and profitability of term vessels.
1. Calculate the profitability of each term vessels to perform a West cargo
and
compare to profitability to perform an East cargo. If West cargos are more
profitable (e.g.
net profit margin for West cargo exceeds new margin for East cargos by a
specified
amount), prefer the use of term vessels on West cargos. Otherwise, prefer the
use of spot
vessels for West cargos.
2. Certain term vessels are well suited to discharge cargo in shallow
ports. Favor
these vessels for cargos which discharge at shallow ports and assign these
vessels
accordingly.
3. After consideration of steps 1 and 2 above, assign the first available
term vessel
to the earliest cargo.
4. Assign a spot vessel to cover a cargo which does not have a term vessel
assigned.
11
CA 02871303 2014-10-22
WO 2013/188481 PCT/US2013/045301
5. Continue until a vessel is assigned to each cargo. Consider
cargos in
chronological sequence based on the laycan (i.e., a specified time period) for
the first load
port.
Example: Strategy - 2
The underlying rationale for Strategy -2 is to consider cargos in
chronological sequence
based on the laycan for the first load port.
1. Assign the first available term vessel to the current cargo.
2. Assign a spot vessel to cover a cargo which does not have a term vessel
assigned.
3. Continue until a vessel is assigned to each cargo.
Example: Strategy - 3
The underlying rationale for Strategy-3 is to consider the largest net margin
for each cargo.
1. Find the available term vessel with the largest net margin for the current
cargo.
Assign this term vessel to this cargo.
2. Assign a spot vessel to cover a cargo which does not have a term vessel
assigned.
3. Continue until a vessel is assigned to each cargo.
The strategy based module can then generate a vessel program (e.g. a set of
vessel-
cargo assignments) based upon each of the three selected strategies. The user
will then see
the results in light of the underlying strategy. The module can run multiple
cases for each of
the strategies to generate multiple programs that are consistent with a
particular strategy.
The user can then compare the results generated with each strategy against one
or more
performance metric(s) and select the preferred strategy. The tool may report
the strategy
element that produced each decision. Such transparency in the decision-making
process can
lead to improved understanding of individual decisions and of the entire
vessel program.
The presently disclosed subject matter is not limited to the transport of
cargo; rather,
the strategy based module may employ strategies that address various aspects
of scheduling
12
CA 02871303 2014-10-22
WO 2013/188481 PCT/US2013/045301
and operating the facility. In connection with the scheduling the operations
associated with
the front-end of a refinery, the operations to be scheduled include: vessel
discharges (i.e., the
amounts transferred from the vessel (cargo) to facility (e.g., refinery)
storage tanks); tank
transfers (i.e., the amounts transferred from the storage tanks to the charge
tanks); and crude
distiller blends (i.e., the amounts transferred from refinery charge tanks to
the crude
distillers). Each of these operations may be made on the basis of a strategy.
Example: Vessel Volume Discharge Strategy
The Vessel Volume Discharge Strategy could be outlined as:
1. Select a vessel based on First In First Out, i.e., among the vessels
waiting to be
discharged of their cargos, select the vessel that arrived first.
2. Discharge the crudes on board the vessel to the refinery storage tanks
based on an
optimization model, with the following considerations:
(i) Each vessel crude cargo must be completely discharged, but can be split
into multiple storage tanks;
(ii) The total amount of crude transferred to a storage tank is less than or
equal to the available ullage of the storage tank (defined as: tank capacity ¨
current
content)
(iii) Maximize an objective function based on a weighted sum of value
functions.
An example of a suitable objective function is
C &PC
Obi ect = f (x
tk-Ef UN:L-7¨)
c=i tkz=
where c is an index of the set of cargos, tks is an index of the set of
storage tanks, x is a
variable denoting the amount assigned of cargo c to tank tks and U (tks)
denotes the ullage
of the storage tank. The function f(x,U) can be linear, piece-wise linear or
non-linear based
on the decision-makers' preferences. Since the value function f is based
solely on
volumetric information (x and U), we will denote this decision-making approach
or strategy
as a "Vessel Volume Discharge Strategy".
13
CA 02871303 2014-10-22
WO 2013/188481 PCT/US2013/045301
Example: Tank Transfer Volume Strategy
The Tank Transfer Volume Strategy could be outlined as:
1. Identify the storage tanks and charge tanks that are available for
operations (i.e.,
they are not in the midst of an ongoing operation).
2. Transfer the contents from the storage tanks to the charge tanks based on
an
optimization model, with the following considerations:
(i) The amount transferred from each storage tank is less than or equal to the
difference of the content of the storage tank and the tank heel
(ii) The total amount of crude transferred to a charge tank is less than or
equal
to the available ullage of the charge tank (defined as: tank capacity ¨
current content)
(iii) Maximize an objective function based on a weighted sum of value
functions.
An example of a suitable objective function is
....KS IN' nyc
1 Objective -
tiOni 1 Mc= 1
where tks is an index of the set of storage tanks, tkc is an index of the set
of charge tanks, z
is a variable denoting the amount assigned from tank tks to tank tkc, and U
(tkc) denotes the
ullage of the charge tank. The volume-centric basis for the tank-transfer
strategy can be
denoted as "Tank Volume Strategy".
Example: Max Crude Distiller Rate Strategy
The Crude Distiller Strategy could be outlined as:
1. Identify the charge tanks that are available for operations (i.e., they are
not in the
midst of an ongoing operation).
2. Set the feed ratios from the charge tanks to the crude distillers based on
running
the latter at maximum capacity and ensuring that the run-length satisfies a
minimum
duration.
14
CA 02871303 2014-10-22
WO 2013/188481 PCT/US2013/045301
In accordance with the presently disclosed subject matter, it is contemplated
that
multiple strategies may be combined or linked to obtain the desired operating
strategy. For
example, the three "front-end" strategies previously discussed could be
combined together
into an overall planning strategy for scheduling the operations of the front-
end of the
refinery over a time horizon 1 ... T is as outlined below:
Step 0: Set t = 1
Step 1: At time t:
a) Are the crude distillers running?
i) If No, schedule them according to "Max Crude Distiller Rate" strategy.
Update status of crude distillers and tanks.
ii) If Yes, go to Step b.
b) Are there vessels waiting to be discharged?
i) If No, go to Step c.
ii) If Yes, discharge them according to "Vessel Volume Strategy". Update
status of vessels and tanks.
c) Are there storage tanks available for transfer?
i) If No, go to Step 2.
ii) If Yes, discharge them according to "Tank Volume Strategy". Update
status of tanks.
Step 2: If t = T, stop, else set t = t+1 and go to Step 1.
The above described combined strategy can be adapted at many different levels
to yield
other strategies with different emphases. New strategies can be obtained by
changing (i) the
order of operations (b) and (c), i.e., discharging the vessels after enough
room has been
created in the storage tanks; (ii) the basis of Vessel selection from FIFO to
one based on
demurrage incurred at the end of the discharge operation; or (iii) the value
function f(x, U)
to g(q, U) where q denotes the qualities of the crude cargo and tank contents,
which would
change the "Volume Strategy" to a "Quality Strategy". An additional variation
would be
h(x,q,U), which would be a way of balancing volumetric and quality
considerations.
CA 02871303 2014-10-22
WO 2013/188481 PCT/US2013/045301
Input Cases
Input data describing the scenarios under which the problem is to be solved is
provided as input cases. The type of parameters being used and their
associated data will
vary depending on the operational problem being solved. For example, for a
vessel
assignment problem, input data may include the following types of information:
freight
rates, bunker fuel costs, demurrage rates, vessel speed, load region ETA
(estimated time of
arrival) for term vessels, etc. Multiple (two or more) cases are generated
with each case
containing input values for the parameters used in the strategy-based module.
These cases
can be generated in any suitable manner, including by user input or
calculation by the
computer system.
Typically, at least one of the parameters used by the strategy-based module is
an
uncertain parameter having multiple possible values. Parameters having
relatively more
certainty may be given a single expected value as input. Parameters with a
significant
amount of associated uncertainty (e.g. the cost of bunker fuel for ships at a
future date) may
be given a range of possible values to account for the uncertainty. For
example, for the
parameter on the cost of bunker fuel, three input values (e.g., a low
estimate, a mid-range
estimate and a high estimate of cost) may be used in developing the program
based upon the
strategy. For example, these input values for bunker fuel may be set as
follows: low estimate
price = 560 ($/ton), midrange estimate price = 600, and high estimate price =
660.
These input values may be received in any suitable manner, including manual
entry,
loading from a spreadsheet or database, or the input values may be selected or
calculated by
the tool (e.g. samples selected from a distribution of input values). FIG. 5
shows an example
of actions that can be applied for entering inputs for uncertain parameters.
Because one or
more of the parameters are considered uncertain, the decision making tool
permits a range of
possible input values to be considered in the analysis. Thus, each input case
is also
associated with the probability of that particular combination of parameter
values occurring.
The weighting of each case can be calculated in any suitable manner. It is
contemplated
that the weighting may be based upon a probability or some other factor. For
example, each
possible input value may be given a weighting factor based on its normalized
relative
16
CA 02871303 2014-10-22
WO 2013/188481
PCT/US2013/045301
weighting within the sample of input values being used and these weighting
factors for
different parameters may be multiplied to obtain the weighting of each case.
The weighting factors may be received in any suitable manner, including input
by
the user, loading of weighting data, or calculation by the tool itself In some
cases, for each
parameter, the tool may receive multiple possible input values and the
probability of that
input value occurring. For example, for a parameter X whose value is subject
to substantial
uncertainty, the user may input values xl, x2, and x3 as possible parameter
values, along
with a weighting factor (for each of xl, x2, and x3) based on the normalized
relative
weighting of that particular value in relation to the other possible values. A
second uncertain
parameter Y may have values yl, y2, and y3 as possible values along with
corresponding
weighting factors. Weighting factors for pairs of values for parameters X and
Y (eg. x 1 and
yl, xl and y2, etc) can be determined by combining the weighting factors for
each
individual parameter. These weighting factors represent the weightings for
various
parameter value pairs.
In some cases, historical data for one or more of the uncertain parameters may
be
received. This data may be modeled (e.g. as a probability distribution) using
regression,
curve fitting, or other suitable technique. The tool can select multiple
values using the model
and assign a weighting factor for each based on the probability of that value
occurring. For
example, the tool may fit a curve or a model to the historical data and select
certain values
from the fitted curve.
Thus, a set of input cases is generated, with each input case containing a
different set
of values for the parameters, and each input case being associated with a
weighting for that
set of values for the parameters. FIG. 6 shows an example of actions that can
be applied for
working with case sets.
Results
Having generated a set of input cases, these cases are processed in the
strategy-based
module. In particular, the set of input cases are processed using the strategy-
based module to
obtain calculations for the performance of each different strategy. That is,
the parameter
values in each case are used as input for each strategy and the resulting
performance metric
for that case is calculated. In the vessel program example given above, an
input case is
17
CA 02871303 2014-10-22
WO 2013/188481
PCT/US2013/045301
applied to the strategy to develop a vessel program. The total net margin for
this vessel
program is calculated and used as the metric to evaluate the vessel program.
Other metrics
can be used to evaluate the performance of a vessel program, such as the
utilization rate for
term vessels, the overall bunker fuel cost, etc. Additional strategies
(similar or different from
the example given above) can be used to develop vessel programs. FIG. 7 shows
an example
of actions that can be used to evaluate strategies using case sets.
Performance Metrics
For comparison, the results of the different strategies can be measured
against a
common performance metric. Examples of performance metrics that can be used
include:
profitability (e.g. total net margin), cost (e.g. overall bunker fuel cost),
utilization rate for
term vessels, plant equipment utilization, production quantity, production
time, etc.
Because each input case being processed has an associated probability of that
particular case scenario occurring, the performance results are also
associated with the same
probability. Thus, the performance results for each different strategy has a
probability
distribution. This probability distribution can be analyzed and represented in
any suitable
manner, including calculating variances (from the mean), standard deviations,
area under the
curve, etc. The probability distribution may be continuous or discrete, non-
cumulative or
cumulative. This information can be provided in any suitable form, including
the use of
tables, graphs, or charts.
In one example, because each strategy approach is considered over a range of
"n"
different case scenarios, a probability curve (e.g. cumulative probability
curve) for each
approach can be generated over those "n" case points. The probability
distribution curve
gives the range of expected outcomes and the likelihood of obtaining each
outcome.
Therefore, the probability distribution curve represents the robustness of
each strategy
approach and provides a way to evaluate the different strategies based on
their robustness.
For example, FIG. 8 shows cumulative probability distribution curves from a
set of
input cases applied to three different strategies. The strategies are
designated as being a
volume strategy (N), a quality strategy (A), and a combined strategy (*). The
x-axis plots
the amount of profit obtained using the selected strategy. The y-axis plots
the cumulative
probability of that amount of profit (i.e. probability that the profit amount
is no larger than
18
CA 02871303 2014-10-22
WO 2013/188481 PCT/US2013/045301
the plotted amount). Each curve represents the outcome of a particular
strategy and
collectively, the curves indicate the relative robustness of the strategies.
These curves demonstrate that the combined strategy (*) produces the greatest
potential profit, but its profitability performance is not as robust as the
quality strategy (A).
One indicator of robustness is the width of the curve, which represents the
range of possible
profit values as a risk profile. In other words, in relation to risk profile,
a strategy that
produces a narrower probability distribution provides a more robust solution.
The volume
strategy (N) is inferior in terms of both profitability and robustness. Thus,
our decision
support tool allows different strategies to be compared against each other so
that the
organization can make better-informed judgments about which strategy to
deploy.
Performance Targets
In some cases, these results from the strategy-based module may be further
compared to a performance target for the performance metric. This performance
target can
be generated from any source or technique that demonstrates other results that
might be
possible if a different approach was used. For example, the performance target
may be
calculated by applying optimization techniques, from historical data (e.g. a
previously
obtained empirical result), or by the use of simulations.
In some cases, the computer system may also be programmed to use a simulation-
based module for determining a performance target. The simulation-based module
contains
at least one model that simulates the operation of the facility. The model may
be a
mathematical model containing a set of equations or formulas relating to the
operation of the
facility and is configured to be analyzed for a specific performance metric of
the facility.
The model may be a programming model upon which optimization techniques can be
applied, such as a linear programming (LP) model, a nonlinear programming
(NLP) model,
mixed-integer linear programming (MILP) model, or mixed integer nonlinear
programming
(MINLP) model. Such programming models may include an objective function,
equality and
inequality constraints, and problem data such as prices, supply and demand
figures,
equipment capacity limits, etc. The model may be used in any suitable way to
analyze the
performance of the manufacturing facility. In some cases, optimization
techniques may be
applied to the model to obtain decision variable results that optimize the
desired
19
CA 02871303 2014-10-22
WO 2013/188481 PCT/US2013/045301
performance metric. For example, the user may apply a solver to the model
using a case (or
multiple cases) to obtain an optimal solution to a specific case (or multiple
cases). Or, the
user can apply a solver using a case (or multiple cases) to obtain one or
several feasible
solutions to a specific case (or multiple cases). The solution may comprise
numerical values
of model variables, a value of the objective function, and other information
such as marginal
values for constraints and variable bounds.
Examples of simulation-based decision support tools that can be used in the
presently disclosed subject matter include those disclosed in commonly
assigned US Patent
Application Publication No. 2009/0187450 entitled "System for optimizing
transportation
scheduling", commonly assigned US Patent Application Publication No. US
2010/0287073
entitled "Method for optimizing a transportation scheme", commonly assigned US
Patent
Application Publication No. 2008/0294484 entitled "System for optimizing
transportation
scheduling and inventory management of bulk product from supply locations to
demand
locations", commonly assigned US Patent Application Publication No.
2010/0332273
entitled "Tools for assisting in petroleum product transportation logistics",
and commonly
assigned US Patent Application Publication No. 2009/0192864 entitled "System
for
optimizing bulk product allocation, transportation and blending." The
disclosures of each are
incorporated herein in their entireties.
The simulation-based module may further use logic and/or rules in the
simulation
analysis. The simulation-based module may also employ a scheduler tool, which
uses the
rules, logic, priorities, or user input to determine values for the decision
variables. One
possible way to use the simulation-based module involves using the scheduler
to provide
values for decision variables and using the simulation to calculate the result
of those
decision variables. The process is: (a) decision variables or degrees of
freedom are set by
scheduler; (b) calculate the result of these decision variables and execute
the simulation; (c)
assesses the simulation results; (d) return to step (a) and adjust until
acceptable results are
obtained. It is also contemplated that the decision variables or degrees of
freedom may be
set by rules/logic built into the simulation-based module, or by solving the
model as an
optimization problem.
CA 02871303 2014-10-22
WO 2013/188481 PCT/US2013/045301
An example of a simulation-based tool is a ship assignment optimization model
that
solves a vessel scheduling problem using linear programming (LP) and mixed-
integer linear
program (MILP) technology. The business decisions are assignment of term and
spot vessels
to a known set of cargos. The scheduling aspect of this problem pertains to
the cargo laycans
(a given time-window, for example, a pair of start and end dates) for the
cargo loading and
discharge activities, and to the projected vessel availability (e.g. estimated
time of arrivals
for vessels).
This particular tool uses a simulation to calculate schedules for vessel
activities, and
optimization calculations to maximize load quantities and to maximize the
profitability of
the overall vessel program. This decision support tool determines an optimal
vessel program
and determines an assignment of a vessel to each of the cargos so as to
maximize overall
profitability. The metric for profitability is the overall (or total) net
margin. The net margin
calculation includes the market value for a vessel to perform a cargo
transport minus the cost
for a vessel to perform the cargo transport plus a revenue contribution based
on the time
when a term vessel is projected to complete the cargo transport.
The set of input cases are also processed using the simulation-based module
and the
resulting performance metric for each case is calculated (e.g. solve the model
as an
optimization problem for the given set of parameter values). The results from
the
simulation-based module can serve as a performance target for assessing the
performance of
a strategy(s). For example, the strategy(s) can be compared against the
optimized
performance metric calculated by the simulation-based module.
Modifying Strategies
After assessing the performance of a strategy (e.g. against other strategies
or against
the optimized result), the user can elect to modify a strategy (this action is
intended to
include the creation of a new strategy) with improved performance. This
modification of a
strategy can be performed in various ways. In some cases, the decision
outcomes produced
by a strategy is compared to the decision outcomes produced by other
strategy(s) or those
produced by the simulation-based module. By analyzing the differences in the
decision
outcomes, the strategy can be modified (e.g. by revising a strategy, creating
a new strategy,
or combining elements of different strategies).
21
CA 02871303 2014-10-22
WO 2013/188481 PCT/US2013/045301
In some cases, a strategy can be modified based on a sensitivity analysis that
determines the relative importance of the uncertain parameters for a given
performance
metric. This sensitivity analysis can be performed by observing how much the
performance
metric output changes relative to the amount of change in the value for the
uncertain
parameter(s). For example, a sensitivity analysis can be performed by using a
common set of
weighted ranges for each of the uncertain parameters. By comparing how much
variation
there is in the outcomes over the weighted ranges, the relative importance of
uncertain
parameters can be determined. Tornado charts are an effective means to display
this
information and enable a user to identify the critical uncertain parameters.
By focusing on specific (for example, the parameters that were identified as
being
more important during the sensitivity analysis) uncertain parameters, a
strategy can be
modified to give improved performance. In particular, the modification may
involve the
changing or adding of steps that involve (directly or indirectly) the selected
uncertain
parameters. This modification of the strategy can be performed iteratively to
improve the
performance of the strategy and improve the resiliency of the strategy with
respect to the
uncertain parameters. The strategy may also be modified to incorporate or
reflect business
drivers that may not have been previously considered. The modified and/or new
strategies
may then be saved in the relevant library for future use.
In some cases, this sensitivity analysis can be performed for multiple
different
strategies and the differences in the sensitivities can be compared to
determine how to
modify a strategy. In some cases, a sensitivity analysis for the uncertain
parameters using
the simulation-based module can be performed in a similar manner. In some
cases, a
sensitivity analysis for determining the relative importance of decision
variables for a given
performance metric can be performed in a similar manner.
Illustrative Example
An application of the presently disclosed subject matter to vessel scheduling
will be
described in greater detail below with reference to Strategy - 1, Strategy ¨ 2
and Strategy ¨
3, discussed above.
The three different decision making strategies (Strategy-1, Strategy-2, and
Strategy-3
have been described above) are defined and stored, for example, using the
methodology
22
CA 02871303 2014-10-22
WO 2013/188481 PCT/US2013/045301
identified in Figure 3. The input data comprises: a set of cargos, a set of
available term and
spot vessels, freight cost information, etc. The uncertain input parameter is
the cost of
bunker fuel (eg. in $/ton) where 3 values are defined with corresponding
weighting factors:
Price [$/ton] Weighting factor
560 0.2
600 0.5
660 0.3
Table 1: Uncertain Input Parameter and Weighting Factors
Based on the uncertain input parameter (as shown above) and the other input
parameters, three cases are generated (Casel, Case2, and Case3). Each case
defines the
relevant problem data. Evaluate the three cases using each of the three
strategies. Each case
may also be evaluated using an optimizer. The total net margin for each case,
is calculated
using each strategy and using the optimizer. Total net margin is the chosen
performance
metric in this instance. The net margin results (values in the table are in
units of millions of
$) are tabulated below in Table 2 and the probability distribution profile for
each strategy is
shown in Table 3 below.
Strategy-1 Strategy-2 Strategy-3 Optimizer Cumulative
Probability
Case 1 100
31.7 31.5 30.7 32.2
Case 2 31 29.8 30.5 31.1 80
Case 3 30.6 28.3 30.3 30.75 30
Table 2: Net Margin Results for Each Strategy
23
CA 02871303 2014-10-22
WO 2013/188481 PCT/US2013/045301
.............................................................. = ..
0.9 ----------------------------------
Ass"'"'
,
0.8 ----------------------------------- = ---
/41
0.7 ---------------------
0.6 ................
/
0.5 .............
¨4¨Optimizer ---, ¨Stntegy-1
0.4 .........
I
0.3 .....
0.2 ---------------------------------------------------------------
¨&¨StratEgy-2
0.1 ---------------------------------------------------------------
0 .................
28 28.5 29 29.5 30 30.5 31 31.5 32 32.5
Table 3: Probability Distribution Profile for Each Strategy
Table 3 is one example of a risk profile for the total net margin performance
metric.
The y-axis represents the cumulative probability and the x-axis represents the
total net
margin. At a given cumulative probability (eg. 0.8 or 80%), the total net
margins for the
three strategies and the optimizer can be compared. For instance, the
Optimizer has the
largest total net margin (31.1) and Strategy-1 has the second largest total
net margin (31.0).
Strategy-3 has the smallest range of total net margin values (30.3 ¨ 30.7)
which can be
interpreted to mean that this strategy is the most robust for the given case
set. Strategy-2 has
the largest range of total net margin values (28.3 ¨ 31.5). Strategy-1 is the
best performing
strategy for the given case set.
(e) Based on the performance of the three strategies for the selected
performance
metric (total net margin), the decision maker may select Strategy-1 as the
preferred strategy.
(f) The decision maker therefore may elect to schedule and operate the vessels
according to Strategy-1. The Optimizer results can be used as a target
estimate for the total
net margin performance metric and the performance of Strategy-1 (and other
strategies) can
be assessed versus this target. This may indicate an opportunity to improve
upon the results
from best known strategy.
24
CA 02871303 2014-10-22
WO 2013/188481 PCT/US2013/045301
One means to improve upon Strategy-1 is consider the differences between the
results from Strategy-1 and the Optimizer. The largest difference in the total
net margin
occurs in Case 1 (32.2 vs 31.7). By comparing the difference in the decisions
(in addition to
the performance metric), Strategy-1 can be improved. Consider Strategy-4 below
which
also considers the vessel capacity (eg. cubic capacity of the vessel in kB)
and the maximum
cargo quantity (eg. based on the upper tolerance for the cargo) and favors the
use of vessels
with large capacity for cargos with larger maximum quantity. Strategy ¨ 4 is a
modification
of the Strategy -1, discussed above.
Example: Strategy - 4
1. Calculate the profitability of each term vessels to perform a West cargo
and
compare to profitability to perform an East cargo. If West cargos are more
profitable (e.g.
net profit margin for West cargo exceeds new margin for East cargos by a
specified
amount), prefer the use of term vessels on West cargos. Otherwise, prefer the
use of spot
vessels for West cargos.
2. Consider term vessel cubic capacity and the maximum cargo quantity for
cargos
which have no vessel assigned. Favor the assignment of vessels with large
cubic capacity to
large cargos.
3. Certain term vessels are well suited to discharge cargo in shallow ports.
Favor
these vessels for cargos which discharge at shallow ports and assign these
vessels
accordingly.
4. After consideration of steps 1, 2, and 3 above, assign the first available
term vessel
to the earliest cargo.
5. Assign a spot vessel to cover a cargo which does not have a term vessel
assigned.
6. Continue until a vessel is assigned to each cargo. Consider cargos in
chronological
sequence based on the laycan for the first load port.
The three input cases, described above, are evaluated utilizing Strategy ¨ 4.
The net
margin results (values in the table are in units of millions of $) which now
include Strategy
¨ 4 are tabulated below in Table 4 and the probability distribution profile
for each strategy,
which now include Strategy - 4 is shown in Table 5 below.
25
CA 02871303 2014-10-22
WO 2013/188481 PCT/US2013/045301
Strategy-1 Strategy-2 Strategy-3 Strategy-4 Optimizer Cumulative
Probability
Case 1 100
31.7 31.5 30.7 32.1 32.2
Case 2 31 29.8 30.5 31 31.1 80
Case 3 30.6 28.3 30.3 30.7 30.75 30
Table 4: Net Margin Results for Each Strategy
0.9 ------------------------------------ = ' ---
0.8 .......................... 2 ............ Ak,P
0.7 ---------------------- =
0.6 -----------------
=
0.5 .............
-------------------------------------------- 4 --
-4-Optimizer - `--Shategy-I
0.4 -----------
0.3 ------------------------------------------- -4,,Str;;tegy-2 -
+¨Strategapa
0.2 .................................................................
-i-Str3tegy-4
0 -------------------------------------------------------------------
28 28.5 29 29.5 30 30.5 31 31.5 32 32.5
Table 5: Probability Distribution Profile for Each Strategy
As can be seen from Table 5, the performance of Strategy-4 is improved over
Strategy-1.
The performance of Strategy-4 is better than the performance of Strategies 1,
2 and 3. The
difference between the performance of Strategy-4 and the target performance
has been
reduced.
Miscellaneous
26
CA 02871303 2014-10-22
WO 2013/188481 PCT/US2013/045301
The presently disclosed subject matter may also be embodied as a computer-
readable
storage medium having executable instructions for performing the various
processes as
described herein. The storage medium may be any type of computer-readable
medium (i.e.,
one capable of being read by a computer), including non-transitory storage
mediums such as
magnetic or optical tape or disks (e.g., hard disk or CD-ROM), solid state
volatile or non-
volatile memory, including random access memory (RAM), read-only memory (ROM),
electronically programmable memory (EPROM or EEPROM), or flash memory. The
term
"non-transitory computer-readable storage medium" encompasses all computer-
readable
storage media, with the sole exception being a transitory, propagating signal.
The coding for
implementing the present invention may be written in any suitable programming
language or
modeling system software, such as AIMMS. Solvers that can be used to solve the
equations
used in the present invention include CPLEX, XPress, KNITRO, CONOPT, GUROI,
and
XA.
The presently disclosed subject matter may also be embodied as a computer
system
that is programmed to perform the various processes described herein. The
computer system
may include various components for performing these processes, including
processors,
memory, input devices, and/or displays. The computer system may be any
suitable
computing device, including general purpose computers, embedded computer
systems,
network devices, or mobile devices, such as handheld computers, laptop
computers,
notebook computers, tablet computers, mobile phones, and the like. The
computer system
may be a standalone computer or may operate in a networked environment.
Although the various systems, modules, functions, or components of the present
invention may be described separately, in implementation, they do not
necessarily exist as
separate elements. The various functions and capabilities disclosed herein may
be performed
by separate units or be combined into a single unit. Further, the division of
work between
the functional units can vary. Furthermore, the functional distinctions that
are described
herein may be integrated in various ways.
The foregoing description and examples have been set forth merely to
illustrate the
invention and are not intended to be limiting. Each of the disclosed aspects
and
embodiments of the present invention may be considered individually or in
combination
27
CA 02871303 2014-10-22
WO 2013/188481 PCT/US2013/045301
with other aspects, embodiments, and variations of the invention.
Modifications of the
disclosed embodiments incorporating the spirit and substance of the invention
may occur to
persons skilled in the art and such modifications are within the scope of the
present
invention.
28