Note: Descriptions are shown in the official language in which they were submitted.
CA 02872347 2014-10-31
WO 2013/165313 PCT/SE2013/050493
ANALYSIS FOR QUANTIFYING MICROSCOPIC DIFFUSION ANISOTROPY
Field of the invention
The present invention relates to a method for quantifying microscopic
diffusion anisotropy in a material with magnetic resonance imaging or nuclear
magnetic resonance spectroscopy.
Technical Background
Molecular self-diffusion measured with NMR (nuclear magnetic
resonance) (Callaghan, 2011 in "Translational Dynamics & Magnetic
Resonance" (Oxford, Oxford University Press); Price, 2009 in "NMR Studies
of Translational Motion" (Cambridge, Cambridge University Press)) is used to
non-invasively study the morphology of the water-filled pore space of a wide
range of materials, e.g., rocks (HOrlimann et al., 1994 "Restricted diffusion
in
sedimentary rocks. Determination of surface-area-to-volume ratio and surface
relaxivity". J Magn Reson A 111, 169-178), emulsions (Topgaard et al., 2002,
"Restricted self-diffusion of water in a highly concentrated W/O emulsion
studied using modulated gradient spin-echo NMR". J Magn Reson 156, 195-
201.), and cheese (Mariette et al., 2002, "1H NMR diffusometry study of water
in casein dispersions and gels". J Agric Food Chem 50, 4295-4302.).
Anisotropy of the pore structure renders the water self-diffusion
anisotropic, a fact that is utilized for three-dimensional mapping of nerve
fiber
orientations in the white matter of the brain where the fibers have a
preferential direction on macroscopic length scales (Basser et al., 1994, "MR
diffusion tensor spectroscopy and imaging". Biophys J 66, 259-267; Beaulieu,
2002, "The basis of anisotropic water diffusion in the nervous system - a
technical review". NMR Biomed 15, 435-455; Moseley et al., 1991,
"Anisotropy in diffusion-weighted MRI". Magn Reson Med 19, 321-326.). The
degree of the macroscopic diffusion anisotropy is often quantified by the non-
dimensional fractional anisotropy index (Basser and Pierpaoli, 1996,
"Microstructural and physiological features of tissues elucidated by
quantitative-diffusion-tensor MRI". J Magn Reson B 111, 209-219.).
Also microscopic anisotropy in a globally isotropic material can be
detected with diffusion NMR, originally through the characteristic curvature
CA 02872347 2014-10-31
WO 2013/165313 PCT/SE2013/050493
2
observed in the echo attenuation of conventional single-PGSE (pulsed
gradient spin-echo) techniques (Callaghan and SOderman, 1983, in
"Examination of the lamellar phase of aerosol OT/water using pulsed field
gradient nuclear magnetic resonance". J Phys Chem 87, 1737-1744;
Topgaard and SOderman, 2002, in "Self-diffusion in two- and three-
dimensional powders of anisotropic domains: An NMR study of the diffusion
of water in cellulose and starch". J Phys Chem B 106, 11887-11892.) and,
more recently, by using double-PGSE approaches in which the NMR signal is
encoded for displacements over two separate time periods (Mitra, 1995, in
"Multiple wave-vector extension of the NMR pulsed-field-gradient spin-echo
diffusion measurement". Phys Rev B 51, 15074-15078.). The presence of
microscopic anisotropy can be inferred by comparing echo attenuation data
obtained with collinear and orthogonal displacement encoding (Callaghan and
Komlosh, 2002, in "Locally anisotropic motion in a macroscopically isotropic
system: displacement correlations measured using double pulsed gradient
spin-echo NMR". Magn Reson Chem 40, S15-S19.; Komlosh et al., 2007, in
"Detection of microscopic anisotropy in gray matter and in novel tissue
phantom using double Pulsed Gradient Spin Echo MR". J Magn Reson 189,
38-45.; Komlosh et al., 2008, in "Observation of microscopic diffusion
anisotropy in the spinal cord using double-pulsed gradient spin echo MRI".
Magn Reson Med 59, 803-809.), by the characteristic signal modulations
observed when varying the angle between the directions of displacement
encoding (Mitra, 1995, in "Multiple wave-vector extension of the NMR pulsed-
field-gradient spin-echo diffusion measurement". Phys Rev B 51, 15074-
15078.; Shemesh et al., 2011, in "Probing Microscopic Architecture of
Opaque Heterogeneous Systems Using Double-Pulsed-Field-Gradient NMR".
J Am Chem Soc 133, 6028-6035, and "Microscopic and Compartment Shape
Anisotropies in Gray and White Matter Revealed by Angular Bipolar Double-
PFG MR". Magn Reson Med 65, 1216-1227.), or by a two-dimensional
correlation approach (Callaghan and Fur6, 2004, in "Diffusion-diffusion
correlation and exchange as a signature for local order and dynamics". J
Chem Phys 120, 4032-4038; Hubbard et al., 2005, 2006, in "A study of
anisotropic water self-diffusion and defects in the lamellar mesophase".
CA 02872347 2014-10-31
WO 2013/165313 PCT/SE2013/050493
3
Langmuir 21, 4340-4346, and "Orientational anisotropy in polydomain
lamellar phase of a lyotropic liquid crystal". Langmuir 22, 3999-4003.).
In typical diffusion magnetic resonance imaging (MRI) experiments,
only a voxel average anisotropy can be detected. Detection of microscopic
anisotropy in a globally isotropic material through the characteristic echo
attenuation curve in conventional single-PGSE techniques demands high
diffusion weighting, often not feasible in clinical applications, and suffers
from
very low sensitivity to microscopic anisotropy. Information about microscopic
anisotropy is further hindered in such experiments by possible isotropic
diffusion contributions to the echo attenuation which are superposed to
anisotropic contributions. The low sensitivity to microscopic anisotropy is
the
main pitfall also in analysis of data from double PGSE experiments.
The present techniques are not adequately sensitive to microscopic
anisotropy and are not best suited for clinical applications. Highly sensitive
techniques to detect microscopic anisotropy, feasible for clinical
applications,
are thus needed. Furthermore, there is a need for a robust and fast data
analysis approach allowing for an unambiguous quantification of microscopic
anisotropy associated with a simple but concise parameter for its
quantification. One aim of the present invention is to provide a new analysis
method along with the novel parameter, microscopic fractional anisotropy
( FA), providing a robust, fast and highly sensitive means for quantifying
microscopic anisotropy, which is suitable in non-clinical and in clinical
applications alike.
Summary of the invention
The stated purpose above is achieved by a method for quantifying
microscopic diffusion anisotropy and/or mean diffusivity in a material by
analysis of echo attenuation curves acquired with two different gradient
modulations schemes, wherein one gradient modulation scheme is based on
isotropic diffusion weighting and the other gradient modulation scheme is
based on non-isotropic diffusion weighting, and wherein the method
comprises analyzing by comparing the signal decays of the two acquired
echo attenuation curves.
CA 02872347 2014-10-31
WO 2013/165313 PCT/SE2013/050493
4
The present analysis is highly sensitive to microscopic anisotropy
independent of the particular choice of the isotropic diffusion weighting
protocol. The analysis allows for a robust and fast quantification of
microscopic anisotropy applicable in non-clinical and in clinical applications
alike.
The analysis could be applied in combination with multi-dimensional
(2D, 3D ...) correlation MR experiments to quantify microscopic anisotropy of
different diffusion components. The analysis could also be applied in
combination with other NMR or MRI methods. Therefore, according to one
specific embodiment of the present invention the method is performed in an
NMR and/or MRI method or experiment, or in a combination with another
NMR or MRI method. For example, with an additional isotropic-weighted
experiment, the analysis could be combined with the diffusion tensor and/or
diffusion kurtosis measurement to provide additional information about
morphology and microscopic anisotropy as well as anisotropic orientation
dispersion. The analysis can be used to facilitate and strengthen the
interpretation of diffusion tensor and diffusion kurtosis measurements in
vivo.
For example, the analysis can provide information on the degree of
anisotropy and on multi-exponential signal decays detected in kurtosis tensor
measurements by attributing kurtosis to different isotropic and/or anisotropic
diffusion contributions. The characterization of any pathology involving the
change in microscopic anisotropy will benefit from the improvements that our
method introduces.
Brief description of the drawings
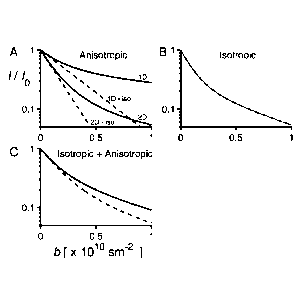
Fig. 1A-C show schematic representations of signal decays vs. b for
isotropic (dashed line) and non-isotropic (solid line) diffusion weighting for
different types of materials. The inset A depicts signal attenuation curves in
case of anisotropic materials with 1D or 2D curvilinear diffusion. The
attenuation curves are multi-exponential for non-isotropic diffusion
weighting,
while they are mono-exponential for isotropic diffusion weighting. The
deviation between the attenuation curves for isotropic and non-isotropic
diffusion weighting provides a measure of anisotropy. The inset B depicts an
example of isotropic material with several apparent diffusion contributions
CA 02872347 2014-10-31
WO 2013/165313 PCT/SE2013/050493
resulting in identical and multi-exponential signal attenuation curves for
isotropic and non-isotropic diffusion weighting. The inset C depicts an
example of material with a mixture of isotropic and anisotropic components
resulting in multi-exponential signal decays for both isotropic and non-
isotropic diffusion weighting, while the deviation between the attenuation
curves for isotropic and non-isotropic diffusion weighting provides a measure
of anisotropy.
Fig.2A-C show experimental results with analysis for different types of
materials. Experimental results for isotropic (circles) and for non-isotropic
(crosses) diffusion weighting are shown in all the insets. Experimental
results
and analysis are shown for a sample with free isotropic diffusion (inset A),
for
a sample with restricted isotropic diffusion (inset B) and for a sample with
high
degree of anisotropy (inset C).
Fig. 3A and 3B show a Monte-Carlo error analysis for the investigation
of systematic deviations and precision as a function of the range of diffusion
weighting b for estimating the degree of micro-anisotropy with the disclosed
analytical method.
Background to the analysis method according to the present invention.
Below there will be disclosed one possible method for isotropic
diffusion weighting as a background to the analysis method according to the
present invention. It is important to understand that this is only given as an
example and as a background for the isotropic diffusion weighting. The
analysis method according to the present invention is of course not limited to
this route or method. Fact is that all possible diffusion weighting methods
involving one part (gradient modulation scheme) for isotropic diffusion
weighting and one other part for the non-isotropic diffusion weighting are
possible starting points, and thus pre-performed methods, for the analysis
method according to the present invention.
Assuming that spin diffusion in a microscopically anisotropic system
can locally be considered a Gaussian process and therefore fully described
by the diffusion tensor D(r), the evolution of the complex transverse
magnetization m(r,t) during a diffusion encoding experiment is given by the
Bloch-Torrey equation. Note that the Bloch-Torrey equation applies for
CA 02872347 2014-10-31
WO 2013/165313 PCT/SE2013/050493
6
arbitrary diffusion encoding schemes, e.g. pulse gradient spin-echo (PGSE),
pulse gradient stimulated echo (PGSTE) and other modulated gradient spin-
echo (MGSE) schemes. Assuming uniform spin density and neglecting
relaxation, the magnetization evolution is given by
am(r't) - -iyg(t)= rm(r,t)+V = [D(r) = Vmfr, 01, (1)
Ot
where y is the gyromagnetic ratio and g(t) is the time dependent effective
magnetic field gradient vector. The NMR signal is proportional to the
macroscopic transverse magnetization
1r
= ¨ t )dr (2)
V v
If during the experiment each spin is confined to a domain
characterized by a unique diffusion tensor D, the macroscopic magnetization
is a superposition of contributions from all the domains with different D.
Evolution of each macroscopic magnetization contribution can thus be
obtained by solving Eqs. (1, 2) with a constant and uniform D. The signal
magnitude contribution at the echo time tE is given by
( tE
AtE )= /0 exp - q (t) = D = q0dt
= 0
(3)
= 0 exp - 2 F T (t) = D = COdt
= 0
where 10 is the signal without diffusion encoding, g=0, and q(t) is the time-
dependent dephasing vector
q(t) = g(t')dt' = qF 04(0 , (4)
0
defined for the interval 0<t<tE. The dephasing vector in Eqs. (3) and (4) is
expressed in terms of its maximum magnitude q, the time-dependent
normalized magnitude IF(t)I1 and a time-dependent unit direction vector
40. Note that in spin-echo experiments, the effective gradient g(t) comprises
the effect of gradient magnitude reversal after each odd 180 radio frequency
(RF) pulse in the sequence. Eq. (3) assumes that the condition for the echo
CA 02872347 2014-10-31
WO 2013/165313 PCT/SE2013/050493
7
formation q(tE) = 0 is fulfilled, which implies F(tE) = 0. In general there
might
be several echoes during an NMR pulse sequence.
The echo magnitude (3) can be rewritten in terms of the diffusion
weighting matrix,
fE
b = q2 F el(t) = T (t)dt , (5)
0
as
(
AtE)= /0 exp(- b : D)= /0 exp - Ibij . (6)
Integral of the time-dependent waveform F(t)2 defines the effective diffusion
time, td, for an arbitrary diffusion encoding scheme in a spin-echo experiment
td = f FO2dt. (7)
In the following we will demonstrate that even for a single echo
sequence, gradient modulations g(t) can be designed to yield isotropic
diffusion weighting, invariant under rotation of D, i.e. the echo attenuation
is
proportional to the isotropic mean diffusivity,
5 = tr(D) /3 = (0 +Dyy D zz) 3 . (8)
In view of what is disclosed above, according to one specific
embodiment of the present invention, the isotropic diffusion weighting is
invariant under rotation of the diffusion tensor D.
According to the present invention, one is looking for such forms of
dephasing vectors F(040 , for which
f F(t)24T(t).13.4(t)dt = tdD (9)
0
is invariant under rotation of D. If diffusion tenor D is expressed as a sum
of
its isotropic contribution, DI , where I is the identity matrix, and the
anisotropic contribution, i.e. the deviatoric tensor DA, so that D = DI +DA ,
the
isotropic diffusion weighing is achieved when the condition
Codt 0 =
f F0247- (t).uo (10)
0
CA 02872347 2014-10-31
WO 2013/165313 PCT/SE2013/050493
8
is fulfilled.
In spherical coordinates, the unit vector 4(t) is expressed by the
inclination and azimuth angle lit as
4T (t) = x(t), qy(t), qz(t)) = {sin C (t)cos 0, sin C (t)sin 0, cos C 01.
(11)
The symmetry of the diffusion tensor, D = DT, gives
CIT = D = 4 = 4x2Dõõ+4y2Dyy+4z2Dzz +24x4ypxy+24AzDxz +24AzDyz (12)
or expressed in spherical coordinates as
CIT =D=Ci = sin2 cos2 i1iD + sin C 2 sinv2Dyy + cos2 cDzz
(13)
+ 2 sin C cosv sin C sinvD,cy + 2 sin C cosv cosCRz + 2 sin C sinv cosCD,
Equation (13) can be rearranged to
______________________ W
4. D = 4= D + 3 cos2 C ¨1 zz D)+ sin 2 C Dxx ¨D cos(20+ D xy sin(2i)10 2
2 (14)
+ sin(2C)(Dxz cosy/ + D yz sin ii')
The first term in Eq. (14) is the mean diffusivity, while the remaining terms
are
time-dependent through the angles at) and iii(t) which define the direction of
the dephasing vector (4). Furthermore, the second term in Eq. (14) is
independent of lit, while the third and the forth terms are harmonic functions
of
lit and 21//, respectively (compare with Eq. (4) in [13]). To obtain isotropic
diffusion weighting, expressed by Eq. (9), the corresponding integrals of the
second, third and fourth terms in Eq. (14) must vanish. The condition for the
second term of Eq. (14) to vanish upon integration leads to one possible
solution for the angle(t), i.e. the time-independent "magic angle"
= acos(1,5). (15)
By taking into account constant Cm, the condition for the third and the
fourth term in Eq. (14) to vanish upon integration is given by
CA 02872347 2014-10-31
WO 2013/165313 PCT/SE2013/050493
9
tE
IF(t)2 coskiii OP/ = 0
tE
IF(t)2 sin [21/f Okit = 0
0
(16)
tE
F 02 CO S[lif O]dt 0
tE
IF(t)2 sin [tit O]cit = 0
0
Conditions (16) can be rewritten in a more compact complex form as
tE
F(t)2 exp[iktif (t)dt -0, (17)
0
which must be satisfied for k=1, 2. By introducing the rate (t) = F , the
integral (17) can be expressed with the new variable T as
td
exp [ik tif (-c )]dr -0. (18)
0
Note that the upper integration boundary moved from tE to td. The condition
(18) is satisfied when the period of the exponential is td, thus a solution
for the
azimuth angle is
(19)
td
for any integer n other than 0. The time dependence of the azimuth angle is
finally given by
15v(t) v(0)+ n f A2 I
td oF dt (20)
The isotropic diffusion weighting scheme is thus determined by the dephasing
vector q(t) with a normalized magnitude F(t) and a continuous orientation
sweep through the angles m (15) and iii(t) (20). Note that since the isotropic
weighting is invariant upon rotation of D, orientation of the vector q(t) and
thus
also orientation of the effective gradient g(t) can be arbitrarily offset
relative to
CA 02872347 2014-10-31
WO 2013/165313 PCT/SE2013/050493
the laboratory frame in order to best suit the particular experimental
conditions.
As understood from above, according to yet another specific
embodiment, the isotropic diffusion weighting is achieved by a continuous
5 sweep of the time-dependent dephasing vector q(t) where the azimuth angle
iii(t) and the magnitude thereof is a continuous function of time so that the
time-dependent dephasing vector q(t) spans an entire range of orientations
parallel to a right circular conical surface and so that the orientation of
the
time-dependent dephasing vector q(t) at time 0 is identical to the orientation
10 at time tE. Furthermore, according to yet another embodiment, the
inclination
is chosen to be a constant, time-independent value, i.e. the so called magic
angle, such that C= cm = acos(1/,5).
The orientation of the dephasing vector, in the Cartesian coordinate
system during the diffusion weighting sequence, spans the entire range of
orientations parallel to the right circular conical surface with the aperture
of
the cone of 2*C, (double magic angle) and the orientation of the dephasing
vector at time 0 is identical to the orientation of the dephasing vector at
time
tE, i.e. w(tE) - w(0) = 2*en, where n is an integer (positive or negative,
however not 0) and the absolute magnitude of the dephasing vector, q*F(t), is
zero at time 0 and at time tE. The isotropic weighting can also be achieved by
q-modulations with discrete steps in azimuth angle 1/1, providing q(t) vector
steps through at least four orientations with unique values of eilv, such that
1/1
modulus 27c are equally spaced values. Choice of the consecutive order and
duration of the time intervals during which 1/1 is constant is arbitrary,
provided
that the magnitude F(t) is adjusted to meet the condition for isotropic
weighing
(10, 16).
Specific implementations
The pulsed gradient spin-echo (PGSE) sequence with short pulses
offers a simplest implementation of the isotropic weighting scheme according
to the present invention. In PGSE, the short gradient pulses at times
approximately 0 and tE cause the magnitude of the dephasing vector to
instantaneously acquire its maximum value approximately at time 0 and
CA 02872347 2014-10-31
WO 2013/165313 PCT/SE2013/050493
11
vanish at time tE. The normalized magnitude is in this case given simply by
F(t) = 1 in the interval 0 < t < tE and 0 otherwise, providing td = tE. A
simplest
choice for the azimuth angle (20) is the one with n = 1 and iii(0) = 0, thus
i \ 27ct
(21)
tE
The dephasing vector is given by
qT (0{
(27Ectj, (-27Ectj,i,
(22)
3 3 3
The corresponding effective gradient, calculated from
gi, 1 d cliT (t)
(23)
µ ' y dt µ
is
Y 3 3
(24)
j3 27c q . ( 27ct ( 27ct
+ ¨ -- ¨ sin ¨ , cos ¨ ,0 =
tE 1L tE) \ tE)
Here 3(0 is the Dirac delta function. Rotation around the y-axis by atan(-q2)
yields
gT(t) = 1 V (0) ¨ 3 (t 01{0 , 0 A
Y
(25)
j 27c q { III . ( 27ct ( 27ct j . ( 27ct
+ ¨ -- ¨ I¨ sin ¨ , cos ¨ ,¨ I¨ sin
3 tE y 3 3
tE ) \ tE ) \ tE )
The effective gradient in Eqs. (24, 25) can conceptually be separated as the
sum of two terms,
g(t) = gPGSE (t) glso (t)' (26)
The first term, gpGsE, represents the effective gradient in a regular PGSE two
pulse sequence, while the second term, giõ, might be called the "iso-pulse"
since it is the effective gradient modulation which can be added to achieve
isotropic weighting.
As may be seen from above, according to one specific embodiment of
the present invention, the method is performed in a single shot, in which the
latter should be understood to imply a single MR excitation.
CA 02872347 2014-10-31
WO 2013/165313 PCT/SE2013/050493
12
The analysis method according to the present invention
Below the analysis method according to the present invention will be
discussed in detail.
Fractional anisotropy (FA) is a well-established measure of anisotropy
in diffusion MRI. FA is expressed as an invariant of the diffusion tensor with
eigenvalues At A2 and A3,
(XI ______________________ A*2 )2 (X1 X3)2 ()2 -X3)2
FA ¨ (27)
2 ( X12 + +
In typical diffusion MRI experiments, only a voxel average anisotropy can be
detected. The sub-voxel microscopic anisotropy is often averaged out by a
random distribution of main diffusion axis. Here we introduce a novel
parameter for quantifying microscopic anisotropy and show how it can be
determined by diffusion NMR.
Information about the degree of microscopic anisotropy can be
obtained from comparison of the echo-attenuation curves, E(b) = 1(b)/10, with
and without the isotropic weighting. Multi-exponential echo attenuation is
commonly observed in diffusion experiments. The multi exponential
attenuation might be due to isotropic diffusion contributions, e.g. restricted
diffusion with non-Gaussian diffusion, as well as due to the presence of
multiple anisotropic domains with varying orientation of main diffusion axis.
The inverse Laplace transform of E(b) provides a distribution of apparent
diffusion coefficients P(D), with possibly overlapping isotropic and
anisotropic
contributions. However, in isotropically weighed diffusion experiments, the
deviation from mono-exponential attenuation is expected to originate mainly
from isotropic contributions.
In practice, the diffusion weighting b is often limited to a low-b regime,
where only an initial deviation from mono-exponential attenuation may be
observed. Such behaviour may be quantified in terms of the kurtosis
coefficient K (Jensen, J.H., and Helpern, J.A. (2010). MRI quantification of
non-Gaussian water diffusion by kurtosis analysis. NMR Biomed 23, 698-
710.),
CA 02872347 2014-10-31
WO 2013/165313 PCT/SE2013/050493
13
2
lnE = ¨Db +T),K b2 ¨ (28)
6
The second term in Eq. (28) can be expressed by the second central moment
of the distribution P(D).
Provided that P(D) is normalized,
f POW =1, (29)
0
the normalized echo signal is given by the Laplace transform
MO= f P(D)e-bDc/D. (30)
0
The distribution P(D) is completely determined by the mean value
f DP(D)dD (31)
0
and by the central moments
Pm = f - T4m POPD (32)
0
The second central moment gives the variance, p2 = o2, while the third
central moment, p3, gives the skewness or asymmetry of the distribution P(D).
On the other hand, the echo intensity can be expressed as a cumulant
expansion (Frisken, B. (2001). Revisiting the method of cumulants for the
analysis of dynamic light-scattering data. Appl Optics 40) by
lnE = -TM + 1" b2 - . (33)
2
The first-order deviation from the mono-exponential decay is thus given by
the variance of P(D).
Assuming diffusion tensors with axial symmetry, i.e. = D11 and
A2 = = D, and an isotropic distribution of orientation of the tensor's
main
diffusion axis, the echo-signal E(b) and the corresponding distribution P(D)
can be written in a simple form. In case of the single PGSE experiment, using
a single diffusion encoding direction, the distribution is given by
CA 02872347 2014-10-31
WO 2013/165313 PCT/SE2013/050493
14
1
P(D)- ________________________
(34)
2.11W - D _LXD1 -DJ'
with the mean and variance,
_ DII + 2D and
3 (35)
4 (n
P2 - 715 V-11 'n 1)2 *
The echo-attenuation for the single PGSE is given by
-bD
MO= ¨ ITc ________
2 Vb(Dil ¨ DI)
lerfQb(Dm _D,)). (36)
For a double PGSE with orthogonal encoding gradients, the distribution
P(D) is given by
P(D)- 1
(37)
IAD1+Di -2/4011- Di)
with the same mean value as for the single PGSE but with a reduced
variance,
1 in
P2 - -45 k-L'i 1-n
1 /2. (38)
As in the single PGSE, also in double PGSE the echo-attenuation exhibits
multi-component decay,
D1+Dm
e ________________________________
2 Di ¨ DII
E(b) = .µ1) ______________________ erf (39)
2 lib D ¨ 2
2
For randomly oriented anisotropic domains, the non-isotropic diffusion
weighting results in a relatively broad distribution of diffusion
coefficients,
although reduced four-fold when measured with a double PGSE compared to
the single PGSE. On the other hand the isotropic weighting results in
, ( DII + 2D
13(D ) = 6 D (40)
3
with P2 = 0 (41)
and a mono-exponential signal decay
MO= e-bp (42)
CA 02872347 2014-10-31
WO 2013/165313 PCT/SE2013/050493
The variance p2 could be estimated by applying a function of the form
(33) to fitting the echo attenuation data. However, in case of randomly
oriented anisotropic domains, the convergence of the cumulant expansion of
(36) is slow, thus several cumulants may be needed to adequately describe
5 the echo attenuation (36). Alternatively, the distribution (34) may be
approximated with the Gamma distribution
13(D)= õ (43)
F(a)13a'
where a is known as the shape parameter and 13 is known as the scale
parameter. For the Gamma distribution, the mean diffusivity is given by
10 T = a = /3, while the variance is given by p2 = a = p2. The Gamma
distribution
is an efficient fitting function. With the two parameters it can capture a
wide
range of diffusion distributions, with both isotropic as well as anisotropic
contributions. Conveniently, the Laplace transform of the Gamma function
takes a simple analytical form,
D2
15 E(b) = (1+ b f3r = 1+b r=2 2 . (44)
D
The variance, p2is , obtained by fitting the function (44) to the isotropic
diffusion weighted echo-decay is related to the isotropic diffusion
contributions, since the variance is expected to vanish with isotropic
weighting
in a pure microscopically anisotropic system (see Eq. 41). The same fitting
procedure on non-isotropically weighted data will yield the variance p2 due to
both isotropic and anisotropic contributions. The difference p2-p2is vanishes
when all diffusion contributions are isotropic and therefore provides a
measure of microscopic anisotropy. The mean diffusivity D, on the other
hand, is expected to be identical for both isotropically and non-isotropically
weighted data. The difference p2-p2is is thus obtained by using the p2is and
p2 as free fit parameters when Eq. (44) is fitted to isotropically and non-
isotropically weighted data sets, respectively, while a common parameter
is used to fit both data sets.
CA 02872347 2014-10-31
WO 2013/165313 PCT/SE2013/050493
16
The difference p2-p2is along with D provide a novel measure for the
microscopic fractional anisotropy (pFA) as
pFA = 112 ¨ P2 (45)
211112 - +2D2/5
The pFA is defined so that the pFA values correspond to the values of the
well-established FA when diffusion is locally purely anisotropic and
determined by randomly oriented axially symmetric diffusion tensors with
identical eigenvalues. Eq. (45) is obtained by setting pFA = FA (27),
assuming p2 - p2" p2 and expressing the eigenvalues D11 andDi in terms of
and p2 (see Eq. 35). In the case of a one-dimensional curvilinear diffusion,
when D11 D1, FA = FA =land in the case of two-dimensional curvilinear
diffusion, when D11 , FA = FA =1/J.
The difference p2-p2is in Eq. (45) ensures that the microscopic
anisotropy can be quantified even when isotropic diffusion components are
present. Isotropic restrictions, e.g. spherical cells, characterised by non-
Gaussian restricted diffusion, are expected to cause a relative increase of
both p2 and p2is by the same amount, thus providing the difference p2-p2is
independent of the amount of isotropic contributions. The amount of non-
Gaussian contributions could be quantified for example as the ratio 1/ 2's
/T)
For anisotropic diffusion with finite orientation dispersion, i.e. when
local diffusion tensors are not completely randomly oriented, the D and p2-
are expected to depend on the gradient orientation in the non-isotropic
diffusion weighting experiment. Furthermore, variation of the apparent
diffusion coefficient (ADC), i.e. volume weighted average diffusivity,
dependent on the gradient orientation and given by the initial echo decay of
the non-isotropic diffusion weighting experiment, may indicate a finite
orientation dispersion. Non-isotropic weighting experiment performed in
several directions, similar to the diffusion tensor and diffusion kurtosis
tensor
measurements, performed with a range of b values to detect possibly multi-
exponential decays, combined with the isotropic weighting experiment, is thus
CA 02872347 2014-10-31
WO 2013/165313 PCT/SE2013/050493
17
expected to yield additional information about microscopic anisotropy as well
as information related to the orientation dispersion of anisotropic domains.
Eq. (44) could be expanded by additional terms in cases where this is
appropriate. For example, the effects of a distinct signal contribution by the
cerebrospinal fluid (CSF) in brain could be described by adding a mono-
exponential term with the isotropic CSF diffusivity D1 to Eq. (44),
D2
õ
E(b) = fe-bDI (1¨ f) 1 + b 2 , (46)
D
where f is the fraction of the additional signal contribution. Eq. (46) could
be
used instead of Eq. (44) to fit the experimental data.
A further explanation directed to inter alia pFA estimation and optimal
range of the diffusion weighting b is given below in the section describing
the
figures in more detail.
In relation to the description above and below it should be mentioned
that also multi-echo variants of course are possible according to the present
invention. Such may in some cases be benefitial for flow/motion
compensation and for compensation of possible assymetry in gradient
generating equipment.
Specific embodiments of the present invention
Below, specific embodiments of the analysis method according to the
present invention will be disclosed. According to one specific embodiment,
the method involves approximating the distribution of apparent diffusion
coefficients by using a Gamma distribution and the signal attenuation by its
inverse Laplace transform. This may increase the speed of the fitting
procedure discussed below. The distribution of diffusion coefficients may
contain isotropic and/or anisotropic contributions, it may arise due to a
distribution of Gaussian diffusion contributions or it may be a consequence of
a non-Gaussian nature of diffusion, e.g. restricted diffusion, or it may be
due
to orientation dispersion of anisotropic diffusion contributions (randomly
oriented diffusion tensors) or it may be due to a combination of the above.
One of the main advantages of the analysis method according to the
present invention is that it can quantify degree of microscopic anisotropy
with
CA 02872347 2014-10-31
WO 2013/165313 PCT/SE2013/050493
18
high precision from low b-range signal intensity data even in the presence of
isotropic contributions, i.e. when they cause deviation from mono-exponential
decay. Typically, isotropic contributions would bias the quantification of
anisotropy from single PGSE attenuation curves, because multi-exponential
signal decays due to isotropic contributions may look similar or
indistinguishable to the ones caused by anisotropic contributions. The
analysis according to the present invention allows to separate the influence
of
anisotropic diffusion contributions from the influence of isotropic diffusion
contributions on the first order deviation from the mono-exponential decays,
where the first order deviation may be referred to as diffusion kurtosis or
the
second central moment of diffusion distribution, and therefore allows for
quantification of the degree of microscopic anisotropy. Therefore, according
to the present invention, the method may involve using a fit function (44)
comprising the parameters: initial value (I0 = lim/(b) ), initial slope
b¨>0
(T. = , i.e. the volume weighted average diffusivity or the mean
b¨>0
diffusivity of a diffsuion tensor ) and curvature, i.e. the second central
moment of diffusion distribution (p2). See Eq. (44). Note that E(b)=1(b)I10.
Therefore, according to one specific embodiment of the present invention, the
two acquired echo attenuation curves (logE vs. b, where E is echo amplitude,
which may be normalized, and b is the diffusion weighting factor) are
compared in terms of initial value, initial slope or curvature, and/or the
ratio
between the two echo attenuation curves is determined, so that the degree of
microscopic anisotropy may be determined.
The method may involve fitting the isotropic and non-isotropic weighted
data with the fit function (44) comprising the parameters: initial values
(I0 = lim/(b) ) for isotropic and non-isotropic data, initial slope
b¨>0
(Ts , i.e. the volume weighted average diffusivity or the mean
b¨>0
diffusivity of a diffsuion tensor ) with constraint that D values are
identical
for both isotropic and non-isotropic diffusion weighted data and the second
CA 02872347 2014-10-31
WO 2013/165313 PCT/SE2013/050493
19
central moments, p2is and p2for isotropic and non-isotropic diffusion
weighted data, respectively. The microscopic fractional anisotropy (pFA) is
then calculated from the mean diffusivity, D, and the second central
moments of diffusion distribution, p2is and p2 according to Eq. (45). As
disclosed above, according to one embodiment a fit function comprising the
parameters initial value, initial slope and curvature (zeroth, first, and
second
central moment of the probability distribution of diffusion coefficients),
fraction
of the additional diffusion contribution (f) and/or diffusivity of the
additional
contribution (D1) (see discussion below) are used. When the extended fitting
model described in Eq. (46) is applied, then the mean diffusivity, D, the
additional diffusion contribution (f) and the diffusivity of the additional
contribution (D1) are constrained to be equal for the isotropic and the non-
isotropic diffusion weighted data.
Moreover, according to another embodiment of the present invention,
the microscopic fractional anisotropy (pFA) is calculated from mean
diffusivity
(D) and difference in second central moments of diffusion distribution (p2is
and p2).
The method may also involve fitting the isotropic and non-isotropic
weighted data, where non-isotropic weighted data is acquired separately for
several directions of the magnetic field gradients with the fit function (44)
comprising the parameters: initial value (I0 = lim/(b) ), initial slope
b->0
(T. , i.e. the volume weighted average diffusivity A
b->0
generally depending on the gradient orientation) and curvature, i.e. the
second central moment of diffusion distribution (p2). Different fit
constraints
may be applied to optimize the accuracy of the estimated fit parameters. For
example, the, initial slope (A), i.e. the volume weighted average diffusivity
A estimated from the non-isotropic diffusion weighted data acquired with
diffusion weighting in different directions, such to yield information
required to
construct the diffusion tensor, D, could be subjected to the constraint where
the trace of the diffusion tensor (determined by non-isotropic diffusion
CA 02872347 2014-10-31
WO 2013/165313 PCT/SE2013/050493
weighting experiments) is identical to three times the mean diffusivity, D,
obtained from the isotropic diffusion weighting data, i.e. tr(D) 3D.= In
such a
case, the microscopic fractional anisotropy (pFA) parameter could still be
calculated according to Eq. (45), however, care need to be taken when
5 interpreting results of such calculations. As an alternative to fitting
the non-
isotropic diffusion weighted data in different gradient directions, e.g. from
diffusion tensor measurement, the signal intensities may be averaged across
the gradient orientations. The resulting curve will approximate a sample
having full orientation dispersion, since averaging under varying gradient
10 orientations is identical to averaging under varying orientations of the
object.
Therefore, according to one specific embodiment of the present invention, the
echo attenuation curves acquired with at least one of the gradient modulation
scheme based on isotropic diffusion weighting and the gradient modulation
scheme based on non-isotropic diffusion weighting are averaged across
15 multiple encoding directions.
The method may involve the use of additional terms in Eq. (44), such
as Eq. (46), applied to the analysis described in the above paragraphs. Eq.
(46) comprises two additional parameters, i.e. fraction of the additional
diffusion contribution (f) and diffusivity of the additional contribution
(D1). One
20 such example may be the analysis of data from the human brain, where the
additional term in Eq. (46) could be assigned to the signal from the
cerebrospinal fluid (CSF). The parameter D in Eq. (46) would in this case be
assigned to the mean diffusivity in tissue while the parameter D1 would be
assigned to the diffusivity of the CSF. The isotropic diffusion weighting
could
thus be used to obtain the mean diffusivity in the brain tissue without the
contribution of the CSF.
In addition, valuable information about anisotropy may be obtained
from the ratio of the non-isotropically and the isotropically weighted signal
or
their logarithms. For example, the ratio of the non-isotropically and the
isotropically weighted signals at intermediate b-values, might be used to
estimate the difference between the radial (D1) and the axial (D11)
diffusivity
in the human brain tissue due to the diffusion restriction effect by the
axons.
CA 02872347 2014-10-31
WO 2013/165313 PCT/SE2013/050493
21
Extracting the information about microscopic anisotropy from the ratio of the
signals might be advantageous, because the isotropic components with high
diffusivity, e.g. due to the CSF, are suppressed at higher b-values. Such a
signal ratio or any parameters derived from it might be used for generating
parameter maps in MRI or for generating MR image contrast.
It is interesting to note that the pFA parameter is complementary to the
FA parameter, in the sense that pFA can be finite in cases when FA = 0,
while, on the other hand, pFA tends to vanish when FA is maximized by
anisotropy on the macroscopic scale. Such approach could be used to
analyse microscopic anisotropy and orientation distribution in a similar way
as
the diffusion tensor and kurtosis tensor analysis is used. Compared to the
kurtosis tensor analysis, here presented microscopic fractional anisotropy
analysis is advantageous in that it can separate the isotropic diffusion
components that may contribute to the values of kurtosis detected with the
present methodology for kurtosis tensor measurements.
The analysis method according to the present invention is applicable in
many different situations. According to one embodiment, the method is
performed so that mean diffusivity is constrained to be identical for both
isotropic and non-isotropic diffusion weighted data. If Eq. (46) is employed,
then parameters f and D1 are also constrained to be equal for isotropic and
non-isotropic diffusion weighted data. Furthermore, according to another
specific embodiment of the present invention, the echo attention curve
acquired with the gradient modulation scheme based on isotropic diffusion is
assumed to be monoexponential. This may be of interest for the sake of
approximating the microscopic anisotropy.
According to another embodiment, the method is performed so that a
mean diffusivity for isotropic diffusion weighted data is allowed to be
different
from the mean diffusivity for non-isotropic diffusion weighted data. This
latter
case would be better in cases when the micro-domains do not have random
orientations, i.e. orientation dispersion is not isotropic. In such cases the
mean diffusivity depends on orientation of the non-isotropic weighting. The
analysis method according to the present invention may involve different
CA 02872347 2014-10-31
WO 2013/165313 PCT/SE2013/050493
22
forms of experiments. In this sense it should be noted that the present
analysis encompasses all diffusion weighting pulse sequences where one
achieves isotropic diffusion weighting and the other with a non-isotropic
diffusion weighting. According to the present invention, there are however
some specific set-up alternatives that may be mentioned additionally.
According to one specific embodiment, the isotropic diffusion weighting and
the non-isotropic diffusion weighting is achieved by two different pulse
gradient spin echos (PGSEs). According to one specific embodiment of the
present invention, the gradient modulation scheme based on isotropic
diffusion weighting comprises at least one harmonically modulated gradient,
which removes curvature of logE vs. b originating from anisotropy. According
to yet another embodiment, the method involves a single-PGSE yielding
maximum curvature of logE vs. b for the non-isotropic diffusion weighting, and
a single-PGSE augmented with sinusoidal isotropic gradients for the isotropic
diffusion weighting.
As discussed above and shown in figs. 1A-C and e.g. 2A-C, the
analysis method according to the present invention may be performed on
many different forms of materials and substances. According to one specific
embodiment of the present invention, the method allows for determining the
degree of anisotropy in systems with anisotropic and/or isotropic diffusion,
such as in liquid crystals. This may be used to infer about the geometry of
micro-domains. For example, the analysis may be used to identify cases of
curvilinear diffusion in 1D with highest microscopic anisotropy (pFA =1) or in
2D when diffusion is restricted to domains with planar geometry (pFA =1/\12),
and other intermediate cases between isotropic and 1D diffusion. As may be
understood, the present invention also encompasses use of an analysis
method as disclosed above. According to one specific embodiment, the
present invention provides use of the analysis method, for yielding an
estimate of the microscopic fractional anisotropy ( FA) with a value for
quantifying anisotropy on the microscopic scale. Furthermore, there is also
provided the use of a method according to the present invention, wherein
anyone of the parameters microscopic fractional anisotropy ( FA), mean
CA 02872347 2014-10-31
WO 2013/165313
PCT/SE2013/050493
23
diffusivity (T), 14121s /T7 fraction of the additional diffusion contribution
(f)
and/or diffusivity of the additional contribution (D1) or any other
parameter(s)
calculated from p2, p2or mean diffusivity is used for generating parameter
maps in MRI or for generating MR image contrast. Information about
microscopic diffusivity may be obtained from the ratio of the non-
isotropically
and isotropically weighted signals or their logarithms and may be used in
parameter maps in MRI or for generating MR image contrast. The difference
between the radial and axial diffusivity may be extracted (see above), which
is
obtained from the ratio of the signals.
Furthermore, intended is also the use of a method according to the
present invention, wherein microscopic fractional anisotropy ( FA) is used for
characterizing tissue and/or diagnosing, such as for diagnosing a tumour
disease or other brain or neurological disorders.
Moreover, also as hinted above, the analysis method according to the
present invention may also be coupled to a pre-performed method involving
isotropic and non-isotropic diffusion weighting.
Detailed description of the drawings
In fig. 1A-C there is shown a schematic representation of signal decays
vs. b for isotropic and non-isotropic diffusion weighting for different types
of
materials. In fig. 1 the following is valid: A) Solid lines represent decays
in a
non-isotropic diffusion weighting experiment for 1D and 2D curvilinear
diffusion (e.g. diffusion in reversed hexagonal phase H2 (tubes) and in
lamellar phase La (planes), respectively). Dashed lines are the corresponding
decays with isotropic diffusion weighting. The initial decay (D) is identical
for
the isotropic diffusion weighting as for the non-isotropic diffusion
weighting. B)
The decay for a system with 70% free isotropic diffusion and 30% restricted
isotropic diffusion. In this case the isotropic and non-isotropic diffusion
weighting result in identical signal decays in the entire b-range. C) Decays
for
a system with 70% anisotropic diffusion (2D) and 30% restricted isotropic
diffusion. Solid line corresponds to the non-isotropic diffusion weighting
while
the dashed line corresponds to the isotropic diffusion weighting. The initial
decays are identical for the isotropic and for the non-isotropic diffusion
CA 02872347 2014-10-31
WO 2013/165313 PCT/SE2013/050493
24
weighting, while the deviation between the decays at higher b values reveals
the degree of anisotropy.
In relation to the analysis performed and the presented results it may
also be mentioned that comparing the signal decays of the two acquired echo
attenuation curves may involve analysis of the ratio and/or difference between
the two acquired echo attenuation curves.
In fig. 2A-C are shown experimental results with analysis of micro-
anisotropy for different types of materials. Shown are normalized signal
decays vs. 10 for isotropic (circles) and non-isotropic (crosses) diffusion
weighting. Solid lines represent optimal fits of Eq. (44) to the experimental
data, with constraint of equal initial decays, D, (shown as dashed lines) for
isotropic and non-isotropic weighted data. All experiments were performed at
25 C. In all experiments, signal intensities were obtained by integration of
the
water peak. A) free water; data from the isotropic and non-isotropic diffusion
weighting overlap and give rise to mono-exponential signal decays. The
analysis gives D = 2.2x10⁻⁹ m2/s and FA = 0. B) Suspension of yeast cells
from baker's yeast (Jastbolaget AB, Sweden) in tap water with restricted
water diffusion; data from the isotropic and non-isotropic diffusion weighting
overlap and give rise to multi-exponential signal decays. The analysis gives
D = 1.4x10⁻⁹ m2/s and FA = 0. C) Diffusion of water in a liquid crystal
material composed by the Pluronic surfactant E5P68E6 with very high
microscopic anisotropy, corresponding to a reverse hexagonal phase; data
from the isotropic and non-isotropic diffusion weighting diverge at higher b-
values and give rise to multi-exponential signal decay in case of the non-
isotropic diffusion weighting and mono-exponential signal decay in case of the
isotropic diffusion weighting. The analysis gives D = 4.8x10⁻¹ m2/s and
FA = 1Ø
In fig. 3A and 3B, the results of the Monte-Carlo error analysis show
systematic deviations and precision of the D (A) and pFA (B) parameters
estimated for the 1D (dots) and 2D (circles) curvilinear diffusion according
to
what has been disclosed above. The ratio of the estimated mean diffusivity to
CA 02872347 2014-10-31
WO 2013/165313 PCT/SE2013/050493
the exact values D, labelled as D/T) (A) with the corresponding standard
deviation values and the estimated pFA values (B) with the corresponding
standard deviations are shown as dots/circles and error bars, respectively, as
a function of the maximum attenuation factor bD for signal to noise level of
5 30.
For pFA estimation, the optimal choice of the b-values is important. To
investigate the optimal range of b-values, a Monte-Carlo error analysis
depicted in figs. 3A and 3B has been performed. The echo-signal was
generated as a function 16 equally spaced b-values between 0 and bmax for
10 the cases of 1D and 2D curvilinear diffusion with randomly oriented
domains.
The upper limit, bmax, was varied and the attenuation factors bDwere chosen
to be identical for the 1D and 2D case. The signal was subjected to the Rician
noise with a constant signal to noise, SNR = 30, determined relative to the
non-weighted signal. Isotropic and non-isotropic weighed attenuation data
15 were analyzed with the protocol described herein to obtain D and pFA
parameters. This analysis was repeated in 1000 iterations by adding different
simulated noise signals with the given SNR. The procedure yields the mean
and the standard deviation of the estimated D and pFA, shown as dots/circles
and error bars respectively in fig 3B.
20 The optimal range of the diffusion weighting b is given by a
compromise between accuracy and precision of the pFA analysis and it
depends on the mean diffusivity. If the maximum b value used is lower than
1/D, the pFA tends to be underestimated, while for maximum b values larger
than 1/T) the pFA tends to be overestimated. On the other hand the accuracy
25 of pFA is compromised particularly at too low values of the maximum b,
due
to increased sensitivity to noise. See fig. 3B.