Note: Descriptions are shown in the official language in which they were submitted.
CA 02880128 2016-04-19
MONITORING, DIAGNOSING AND OPTIMIZING
GAS LIFT OPERATIONS
CROSS-REFERENCE TO RELATED APPLICATIONS
This application claims priority to Non-Provisional U.S. Application Ser. No.
13/711,815, titled "Monitoring, Diagnosing and Optimizing Gas Lift Operations"
and filed
December 12, 2012 by M. M. Querales, M. Villamizar, G. Carvajal, R. K.
Vellanki, G.
Moricca, A. S. Cullick and J. Rodriguez, which claims priority to Provisional
U.S.
io
Application Ser. No. 61/678,069, titled "Monitoring, Diagnosing and Optimizing
Gas Lift
Operations" and filed July 31, 2012 by M. M. Querales, M. Villamizar, G.
Carvajal, R. K.
Vellanki, G. Moricca, A. S. Cullick and J. Rodriguez.
BACKGROUND
Oil field operators dedicate significant resources to improve the recovery of
hydrocarbons from reservoirs while reducing recovery costs. To achieve these
goals,
production engineers both monitor the current state of the reservoir and
attempt to predict
future behavior given a set of current and/or postulated conditions. The
monitoring of wells
by production engineers, sometimes referred to as well surveillance, involves
the regular
collection and monitoring of measured near-wellbore production data from
within and around
the wells. Such data may be collected using sensors embedded behind the well
casing and/or
from measurement devices introduced into the well with the production tubing.
The data may
include, but is not limited to, water and oil cuts, fluid pressure and fluid
flow rates, and is
generally collected at a fixed, regular interval (e.g., once per minute) and
monitored in real-
time by field personnel. As the data is collected, it is generally archived
into a database.
In addition to monitoring conditions within the well, the systems used to lift
produced
fluids to the surface are also monitored. Such monitoring ensures that the
systems are
functioning as close to their optimal operating point as possible or
practical, and that failures
are detected and resolved promptly. One such type of system used is a gas lift
(GL) system.
Mandrels of the GL system are generally mounted along the production tubing
and lowered
into the well's production casing together with the tubing. Gas is introduced
into the annular
region between the casing and the tubing under pressure, and valves positioned
along and/or
1
CA 02880128 2015-01-26
WO 2014/022320 PCT/US2013/052595
within the mandrel allow the gas to be introduced into the fluid flow within
the production
tubing. GL systems help lift the product to the surface by reducing the
density of the fluid
(and thus the downhole pressure), which accelerates the movement of fluids
from the
formation through the perforations in the casing and up the production tubing.
Downhole sensors, if installed, collect and transmit data to the surface
(e.g., via cables
to the surface and/or wirelessly). The data may include, but is not limited
to, injected gas lift
pressure and temperature, and produced fluid pressure and temperature.
Although the data
provided enables monitoring of the performance of a GL system, determining the
underlying
cause of a failure or a variation in the performance of GL system is a more
complicated task.
A given GL system failure or performance variation can have numerous causes
and operators
strive to identify the cause of such issues quickly to reduce any resulting
downtime or
reduced production. While experienced petroleum/well surveillance personnel
may rely on
their personal experience to diagnose and resolve such issues, a more
automated approach
based on a broader information base offers the possibility of diagnosing
issues and providing
more optimal solutions in a shorter period of time.
BRIEF DESCRIPTION OF THE DRAWINGS
A better understanding of the various disclosed embodiments can be obtained
when
the following detailed description is considered in conjunction with the
attached drawings, in
which:
FIG. 1A shows a production well that sources measured well and gas lift (GL)
system
data.
FIG. 1B shows a simplified diagram of an illustrative GL system.
FIGS. 2A-2D show illustrative user interface displays for monitoring,
diagnosing and
optimizing GL operations.
FIG. 3 shows an illustrative data acquisition and processing system suitable
for
implementing software-based embodiments of the systems and methods described
herein.
FIG. 4A shows an illustrative GL system monitoring, diagnosing and optimizing
method.
FIG. 4B shows an illustrative GL operations task ticketing method that works
in
conjunction with the illustrative GL system monitoring, diagnosing and
optimizing method
described.
2
CA 02880128 2015-01-26
WO 2014/022320 PCT/US2013/052595
It should be understood that the drawings and corresponding detailed
description do
not limit the disclosure, but on the contrary, they provide the foundation for
understanding all
modifications, equivalents, and alternatives falling within the scope of the
appended claims.
DETAILED DESCRIPTION
The paragraphs that follow describe various illustrative systems and methods
for
monitoring, diagnosing and optimizing gas lift (GL) system operations. An
illustrative
production well and related data collection and processing system suitable for
collecting and
processing measured well and GL system data are first described. A description
of a series of
user interface displays follows, wherein the displays present data to a user
as part of the
disclosed GL system monitoring, diagnosing and optimizing. These displays arc
generated by
a data acquisition and processing system that performs software-implemented
versions of the
disclosed methods. An illustrative GL system monitoring, diagnosing and
optimizing method
is described concurrently with the data acquisition and processing system.
Finally, a GL
system task ticketing method is described that supplements the disclosed GL
system
monitoring, diagnosing and optimizing.
The systems and methods described herein operate on measured data collected
from
wells, such as those found in oil and gas production fields. Such fields
generally include
multiple producer wells that provide access to the reservoir fluids
underground. Measured
well data is collected regularly from each producer well to track changing
conditions in the
reservoir. FIG. 1A shows an example of such data collection from a producer
well with a
borehole 102 that has been drilled into the earth. Such boreholes are
routinely drilled to ten
thousand feet or more in depth and can be steered horizontally for perhaps
twice that
distance. The producer well also includes a casing header 104 and casing 106,
both secured
into place by cement 103. Blowout preventer (BOP) 108 couples to casing header
106 and
production wellhead 110, which together seal in the well head and enable
fluids to be
extracted from the well in a safe and controlled manner.
The use of measurement devices permanently installed in the well along with
the GL
system facilitates monitoring and control of said GL system. The different
transducers send
signals to the surface that may be stored, evaluated and used to control the
GL system's
operations. Measured well data is periodically sampled and collected from the
producer well
and combined with measurements from other wells within a reservoir, enabling
the overall
state of the reservoir to be monitored and assessed. These measurements, which
may include
3
CA 02880128 2015-01-26
WO 2014/022320 PCT/US2013/052595
bottom hole temperatures, pressures and flow rates, may be taken using a
number of different
downhole and surface instruments. Additional devices coupled in-line with
production tubing
112 include GL mandrel 114 (controlling the injected gas flow into production
tubing 112)
and packer 122 (isolating the production zone below the packer from the rest
of the well).
Additional surface measurement devices may be used to measure, for example,
the tubing
head pressure and temperature and the casing head pressure.
FIG. 1B shows a diagram of the illustrative GL system incorporated into the
producer
well of FIG. 1A, and includes some components not shown in FIG. 1A while
excluding
others for clarity. Gas is injected into the annulus 150 between casing 106
and production
tubing 112 via gas lift choke 152, which regulates the gas injection pressure.
The pressurized
gas within annulus 150, which is separated from the production zone by packer
122, passes
through injection valve 154 (mounted on mandrel 114). In at least some
illustrative
embodiments additional values such as valve 155 are provided to increase the
gas flow during
the process of unloading the well (i.e., when initiating flow within a well by
removing the
column of kill fluid). FIG. 1B shows the well after unloading has completed
and additional
valve 155 has closed. The valves allow pressurized injection gas into
production tubing 112
while preventing the fluid within the tubing from flowing back out into
annulus 150. Fluid
that includes formation oil and injected gas flow through injection tubing 112
to the surface
and out production choke 154, which regulates the flow of produced fluid
exiting the well.
Referring again to FIG. 1A, cable 128 provides power to various surface and
downhole devices to which it couples (e.g., gas and/or fluid pressure, flow
and temperature
monitoring devices), as well as signal paths (electrical, optical, etc.,) for
control signals from
control panel 132 to the devices, and for telemetry signals received by
control panel 132 from
the devices. Alternatively, the devices may be powered by other sources (e.g.,
batteries) with
control and telemetry signals being exchanged between control panel 132 and
the devices
wirelessly (e.g., using acoustic or radio frequency communications) or using a
combination
of wired and wireless communication. The devices may be controlled and
monitored locally
by field personnel using a user interface built into control panel 132, or may
be controlled
and monitored by a computer system 45. Communication between control panel 132
and
computer system 45 may be via a wireless network (e.g., a cellular network),
via a cabled
network (e.g., a cabled connection to the Internet), or a combination of
wireless and cabled
networks.
4
CA 02880128 2015-01-26
WO 2014/022320 PCT/US2013/052595
In at least some illustrative embodiments, data is collected using a
production logging
tool, which may be lowered by cable into production tubing 112. In other
illustrative
embodiments, production tubing 112 is first removed, and the production
logging tool is then
lowered into casing 106. In either case, the tool is subsequently pulled back
up while
measurements are taken as a function of borehole position and azimuth angle.
In other
alternative embodiments, an alternative technique that is sometimes used is
logging with coil
tubing, in which production logging tool couples to the end of coil tubing
pulled from a reel
and pushed downhole by a tubing injector positioned at the top of production
wellhead 110.
As before, the tool may be pushed down either production tubing 112 or casing
106 after
production tubing 112 has been removed. Regardless of the technique used to
introduce and
remove it, the production logging tool provides additional data that can be
used to
supplement data collected from the production tubing and casing measurement
devices. The
production logging tool data may be communicated to computer system 45 during
the
logging process, or alternatively may be downloaded from the production
logging tool after
the tool assembly is retrieved.
Continuing to refer to FIG. IA, control panel 132 includes a remote terminal
unit
(RTU) which collects the data from the downhole measurement devices and
forwards it to a
supervisory control and data acquisition (SCADA) system that is part of
computer system 45.
In the illustrative embodiment shown, computer system 45 includes a set of
blade servers 54
that includes several processor blades, at least some of which provide the
above-described
SCADA functionality. Other processor blades may be used to implement the
disclosed GL
system monitoring, diagnosing and optimizing. Computer system 45 also includes
user
workstation 51, which includes a general processing system 46. Both the
processor blades of
blade server 54 and general processing system 46 are preferably configured by
software,
shown in FIG. lA in the form of removable, non-transitory (i.e., non-volatile)
information
storage media 52, to process collected well and GL system data. The software
may also
include downloadable software accessed through a network (e.g., via the
Internet). General
processing system 46 couples to a display device 48 and a user-input device 50
to enable a
human operator to interact with the system software 52. Alternatively, display
device 48 and
user-input device 50 may couple to a processing blade within blade server 54
that operates as
general processing system 46 of user workstation 51.
The software executing on the processing blades of blade server 54 ancUor on
user
workstation 51 presents to the user a series of displays, shown as the
illustrative displays of
5
CA 02880128 2015-01-26
WO 2014/022320 PCT/US2013/052595
FIGS. 2A-2D, that enable the user to determine the state of the GL system and
to interact
with the software to take action based on the information presented. FIG. 2A
shows a status
display 200 for a reservoir (the "Houston" reservoir) with eight wells of the
reservoir
displayed (wells HO-001 through HO-008). The display includes an advisory
section 202 that
lists current advisories (sorted by severity) for wells within the reservoir
displayed, a
reservoir map 204 that displays the geographic location of the wells within
the reservoir and
provides a visual status of each well (e.g., inactive, in alarm, with
opportunities and
optimized), a summary 206 of the number of wells in each status condition, and
current real-
time values for a selected well (e.g., HO-006 in FIG. 2A).
When a user of the system is notified of an advisory (e.g., an alarm, issue or
a
performance improvement opportunity), the user can select the well identified
by the
advisory to display a summary 210 of the well's current status as shown in
FIG. 2B. The
display enables a user to view current measured values 212 such as, for
example, casing head
pressure (CHP), tubing head pressure (THP) and tubing head temperature (THT),
as well as
real-time production data 214 such as fluid flow rates, oil flow rates, water
cuts and
gas/liquid ratios (GLRs). The display also presents historical data 216 for a
selected time
period.
If after reviewing the data for the selected well a user decides that the
issue raised by
the advisory warrants further analysis, the user can open a diagnostic display
such as
illustrative display 220 shown in FIG. 2C. Display 220 includes current
measured values 222,
inflow/outflow plot 224, gradient plot 226 and analysis results 228. The
display can be used
by the user to review the results of a nodal-analysis-based well model and
compare the results
to the measured data. In at least some illustrative embodiments, the nodal
analysis is applied
wherein an analytic equation set represents and models the flow and pressure
(well model
output values) of multi-phase fluids within the borehole. Well model input
values can include
reservoir permeability, reservoir thickness, reservoir porosity, well tubing
friction, and
completion and perforation characteristics. In the nodal analysis of the
illustrative
embodiment described, the well and surrounding region is divided into a series
of points or
"nodes", each having an inflow section and an outflow section. The inflow
section includes
components upstream of the selected node, while the outflow section includes
components
downstream of the selected node. The analyzed producing system is modeled as a
group of
components that includes reservoir rock, completions (e.g., gravel pack,
open/closed
perforations and open hole), vertical flow strings, restrictions, flow lines
and integrated
6
CA 02880128 2015-01-26
WO 2014/022320 PCT/US2013/052595
gathering networks through which fluid flows in through the inflow section and
out through
the outflow section.
Mismatches between measured values and the well model's calculated values can
be
indicative of issues, including problems with the equipment and/or changes in
downhole
conditions. For example, inflow/outflow plot 224 of FIG. 2C shows a mismatch
between the
actual operating point (the intersection of the Inflow Performance
Relationship curve and the
Vertical Lift Performance curve) and the operating point calculated by the
well model.
Software executing within the system may automatically detect the mismatch or
respond to a
user command, and in response to such detection or command compare the
measured
conditions of the GL system against a database of known GL system states. In
at least some
illustrative embodiments, a rule-based expert system determines the most
likely cause of the
measured conditions and suggests recommended actions to resolve said
conditions. Both the
most likely cause and the recommended actions to resolve the issue are
generated by the
expert system and presented at the bottom of the display as analysis system
results 228. The
user can select one or more recommended actions to resolve the identified
condition(s),
causing the model to be updated to reflect both the condition(s) and the
recommended
action(s) selected. The recommended action(s) may subsequently be implemented
manually
by field personnel (e.g., in response to a task ticket issued using the
ticketing system
described below). Alternatively, in at least some illustrative embodiments the
recommended
action(s) may be implemented automatically via commands issued by the SCADA
system in
response to the user's selection that change the GL system settings in the
field (e.g.,
commanding a new choke setting).
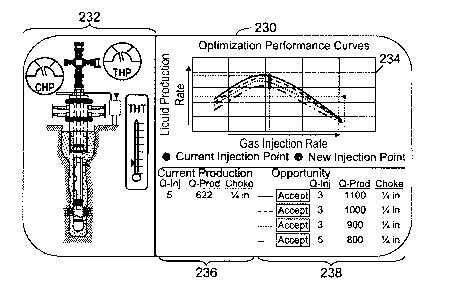
Once a condition has been diagnosed and corrected, the disclosed methods and
system
may also be used to improve the performance of a system. In at least some
illustrative
embodiments, the user causes illustrative display 230 of FIG. 2D to be
presented, which
shows current measured values 232 of the well and GL system, current
production
measurements and control settings 236 and performance graph 234 generated by
the updated
well model. Performance graph 234 shows both the current performance point of
the well/GL
system as well as estimated performance curves calculated by the model. The
corresponding
values and settings 236 for the current operating point are shown below the
graph. When the
user selects a desired operating point, target values and control settings 238
(e.g., gas
injection flow and choke setting) corresponding to the selected operating
point are also
displayed below the graph. The control settings shown are those calculated by
the model to
7
CA 02880128 2015-01-26
WO 2014/022320 PCT/US2013/052595
achieve various target values for the selected operating point (e.g., target
liquid production
rates that result for a given gas injection rate at different choke settings).
A system that performs a software-implemented embodiment of the above-
described
method is shown in FIG. 3, and an illustrative embodiment of the method
described is shown
in FIG. 4A. Software modules are shown within the processing subsystem 330 of
FIG. 3 that
perform the functions described in the various blocks of FIG. 4A. More
specifically, and
referring to both FIGS. 3 and 4A, well and GL system data is collected via
data acquisition
subsystem 310 and stored by data collection/storage module 332 onto a database
within data
storage subsystem 320 (block 402). Data produced by well model 340 of the well
is
3.0 compared to the collected data by comparison module 334 (block 404).
Data mismatches
between the model results and the collected data are used by condition
identifier module 336
to identify and present to the user the likely condition(s) causing mismatches
(block 406).
Model update module 338 updates well model 340 based on the identified
condition and
corresponding correction selected by the user (block 408), and performance
curve update
module 342 generates GL system performance curves based on data produced by
the updated
well model (block 410). Recommended action module 344 identifies and presents
to the user
a list of control values and/or other actions (e.g., a choke setting and a gas
injection rate)
calculated to produce a GL system performance consistent with a selected
operating point
(e.g., at or near the operating point within a determined tolerance value;
block 412) from
which the user selects a setting/action that is accepted by recommended action
module 344
(block 414), ending method 400 (block 416). In at least some illustrative
embodiments,
recommended action module 344 also initiates a change to one or more GL system
settings in
response to accepting the user's selection (e.g., by issuing a task ticket to
field personnel as
described below, or by triggering a SCADA system command that automatically
changes the
relevant GL system settings).
The above-described systems and methods may be augmented by a task ticketing
system (implemented, e.g., by task ticket module 346 of FIG. 3) that notifies
field operator
personnel of well conditions of interest as they occur, and that allows such
conditions to be
monitored and tracked as they progress form detection through diagnosis,
correction and
resolution. Within each phase, an authorization mechanism may be implemented
requiring
that supervisory personnel authorize field and/or engineering personnel before
they are
allowed to implement corrective action. FIG. 4B shows an illustrative method
450 that
implements such a task ticketing system. When an advisory is generated by the
monitoring,
8
CA 02880128 2015-01-26
WO 2014/022320 PCT/US2013/052595
diagnosis and optimizing system during data collection (e.g., because a
measured value has
exceeded a threshold limit or is outside an allowable range of values), a
notification is also
generated (block 452) and a task ticket is created (block 454). The
notification may include,
for example, emails, automated text messages and/or pages, which are sent to
contacts based
on the nature of the underlying condition according to one or more previously
configured
distribution lists. As the process of diagnosing and correcting an alarm or
issue and/or or
improving the performance of a well/GL system progresses, the task ticket is
updated to
reflect any action taken. Such action may include assignment of personnel to
address the
underlying condition (block 456), any required authorizations, equipment
corrections, repairs
and/or replacements, and final resolution/disposition of the condition (block
458), ending the
method (block 460). In at least some illustrative embodiments, additional
notifications are
generated each time the task ticket is updated. At least some of the task
ticket updates may be
performed automatically by the monitoring, diagnosing and optimizing system,
while others
may be manually performed by users of the system. Users may be given access to
task
tickets, whether only for viewing or for updating, according to an access
permission structure
similar to that used in a typical computer file system.
An embodiment of the present invention includes a method for monitoring,
diagnosing and optimizing operation of a GL system that includes collecting
measured data
representative of a state of a GL system within a well, and further storing
the measured data;
comparing the measured data to calculated data generated by a model of the
well; identifying
one or more likely conditions of the GL system based at least in part on
mismatches between
the measured data and the calculated data; updating the well model to reflect
the one or more
likely conditions and one or more selected corrections to the one of the one
or more likely
conditions; generating a plurality of GL system performance curves using the
updated well
model; and presenting to a user one or more actions recommended to achieve a
GL system
performance consistent with a GL system operating point on at least one of the
plurality of
GL system performance curves.
The method can further include accepting a GL system operating point
selection; and
initiating a change to one or more GL system settings in response to the
accepting of the
selection.
The method can further include identifying the one or more likely conditions
by
comparing the measured data to a database of known GL system states.
9
CA 02880128 2015-01-26
WO 2014/022320 PCT/US2013/052595
The method can further include measured data that includes data selected from
the
group consisting of real-time data, recorded data and simulated data.
The method can further include data representative of the state of the GL
system that
includes data selected from the group consisting of bottom hole pressure,
bottom hole
temperature, tube head pressure, tube head temperature, choke size, fluid flow
rates, oil flow
rates and water cuts, gas/liquid ratios, injected gas pressure, injected gas
temperature, injected
gas flow rate and one or more mandrel valve settings.
The method can further include generating an advisory message if a value of
the
measured data is detected outside of an allowable range of values and sending
out a
corresponding notification to one or more contacts of a distribution list;
creating a task
tracking ticket corresponding to the advisory message; updating the task
tracking ticket to
include the action recommended and personnel assigned to implement the
solution; updating
the task tracking ticket to document implementation of the solution and
closing the task
tracking ticket; and generating an additional advisory message and sending out
an additional
corresponding notification to the one or more contacts each time the task
tracking ticket is
updated.
The method can further include presenting to at least one of one or more users
the
current status of the task tracking ticket.
The method can further include determining if at least one of one or more
users may
view or update the task tracking ticket based upon an access permission
structure.
Another embodiment of the present invention includes a GL monitoring,
diagnosing
and optimizing system that includes a memory having GL system monitoring,
diagnosing and
optimizing software, and one or more processors coupled to the memory. The
software
causes the one or more processors to collect measured data representative of a
state of a GL
system within a well, and further store the measured data; compare the
measured data to
calculated data generated by a model of the well; identify one or more likely
conditions of the
GL system based at least in part on mismatches between the measured data and
the calculated
data; update the well model to reflect the one or more likely conditions and
one or more
selected corrections to the one of the one or more likely conditions; generate
a plurality of GL
system performance curves using the updated well model; and present to a user
one or more
actions recommended to achieve a GL system performance consistent with a GL
system
operating point on at least one of the plurality of GL system performance
curves.
CA 02880128 2015-01-26
WO 2014/022320 PCT/US2013/052595
The software included in the system can further cause the one or more
processors to
accept a GL system operating point selection, and initiate a change to one or
more GL system
settings in response to the acceptance of the selection.
The software included in the system can further implement a rule-based expert
system
that identifies the one or more likely conditions at least in part by
comparing the measured
data to a database of known GL system states.
The system can further include measured data that includes data selected from
the
group consisting of real-time data, recorded data and simulated data.
The system can further include data representative of the state of the GL
system that
lo
includes data selected from the group consisting of bottom hole pressure,
bottom hole
temperature, tube head pressure, tube head temperature, choke size, fluid flow
rates, oil flow
rates and water cuts, gas/liquid ratios, injected gas pressure, injected gas
temperature, injected
gas flow rate and one or more mandrel valve settings.
The software included in the system can further cause the one or more
processors to
generate an advisory message if a value of the measured data is detected
outside of an
allowable range of values and send out a corresponding notification to one or
more contacts
of a distribution list; create a task tracking ticket corresponding to the
advisory message;
update the task tracking ticket to include the action recommended and
personnel assigned to
implement the solution; update the task tracking ticket to document
implementation of the
solution and close the task tracking ticket; and generate an additional
advisory message and
send out an additional corresponding notification to the one or more contacts
each time the
task tracking ticket is updated.
Yet another embodiment of the present invention includes a non-transitory
information storage medium having GL system monitoring, diagnosing and
optimizing
software that includes a data collection and storage module that collects
measured data
representative of a state of a GL system within a well, and further stores the
measured data; a
comparison module that compares the measured data to calculated data generated
by a model
of the well; a condition identifier module that identifies one or more likely
conditions of the
GL system based at least in part on mismatches between the measured data and
the calculated
data; a model update module that updates the well model to reflect the one or
more likely
conditions and one or more selected corrections to the one of the one or more
likely
conditions; a performance curve module that generates a plurality of GL system
performance
11
CA 02880128 2015-01-26
WO 2014/022320 PCT/US2013/052595
curves using the updated well model; and a recommended action module that
presents to a
user one or more actions recommended to achieve a GL system performance
consistent with
a GL system operating point on at least one of the plurality of GL system
performance
curves.
The recommended action module included on the storage medium can further
accept a
GL system operating point selection and initiate a change to one or more GL
system settings
in response to the selection.
The condition identifier module included on the storage medium can further
include
rule-based expert system software that identifies the one or more likely
conditions at least in
io part by comparing the measured data to a database of known GL system
states.
The measured data that is collected and stored by the software included on the
storage
medium can further include data selected from the group consisting of real-
time data,
recorded data and simulated data.
The data representative of the state of the GL system that is collected and
stored by
the software included on the storage medium can further include data selected
from the group
consisting of bottom hole pressure, bottom hole temperature, tube head
pressure, tube head
temperature, choke size, fluid flow rates, oil flow rates and water cuts,
gas/liquid ratios,
injected gas pressure, injected gas temperature, injected gas flow rate and
one or more
mandrel valve settings.
The storage medium can further include a task ticket module that generates an
advisory message if a value of the measured data is detected outside of an
allowable range of
values and sends out a corresponding notification to one or more contacts of a
distribution
list; creates a task tracking ticket corresponding to the advisory message;
updates the task
tracking ticket to include the action recommended and personnel assigned to
implement the
solution; updates the task tracking ticket to document implementation of the
solution and
closes the task tracking ticket; and generates an additional advisory message
and sends out an
additional corresponding notification to the one or more contacts each time
the task tracking
ticket is updated.
Numerous other modifications, equivalents, and alternatives, will become
apparent to
those skilled in the art once the above disclosure is fully appreciated. For
example, although
at least some software embodiments have been described as including modules
performing
specific functions, other embodiments may include software modules that
combine the
12
CA 02880128 2015-01-26
WO 2014/022320 PCT/US2013/052595
functions of the modules described herein. Also, it is anticipated that as
computer system
performance increases, it may be possible in the future to implement the above-
described
software-based embodiments using much smaller hardware, making it possible to
perform the
described monitoring, diagnosing and optimizing using on-site systems (e.g.,
systems
operated within a well-logging truck located at the reservoir). Additionally,
although at least
some elements of the embodiments of the present disclosure are described
within the context
of monitoring real-time data, systems that use previously recorded data (e.g.,
"data playback"
systems) and/or simulated data (e.g., training simulators) are also within the
scope of the
disclosure. It is intended that the following claims be interpreted to embrace
all such
modifications, equivalents, and alternatives where applicable.
13