Note: Descriptions are shown in the official language in which they were submitted.
CA 02899102 2015-07-31
FIBRE MONITORING APPARATUS AND METHOD
This patent application is a divisional based on Canadian Patent Application
No.
2,472,865 filed June 29, 2004.
FIELD OF THE INVENTION
This patent application relates to a mechanism for monitoring the production
of multiple-
filament fibre. In particular, this patent application relates to a method and
apparatus for
monitoring the physical characteristics of multi-filament fibre in real-time.
BACKGROUND OF THE INVENTION
In textile production, synthetic fibres are formed from a "spin-draw" process
in which a
molten polymer, such as polyester or nylon, is spun into filaments, and
twisted together
to foLiii a single fibre. The spun fibre is then drawn, altering the fibre's
elasticity, tensile
strength and diameter. During the process, typically a liquid emulsion or
"finish" is
applied to the fibre to lubricate the filaments and thereby reduce static
electricity
generated by the movement of the fibre through processing machinery. Further,
interlacing nodes are typically formed in the fibre by exposing the drawn
fibre to a
pressurized air jet, thereby bonding the individual filaments together at
periodic intervals
along the fibre.
Lack of uniformity in fibre bulk, finish, denier, or interlacing node
distribution can cause
fibre entanglement or breakage, or irregularities in fibre coloration during
the weaving
process, resulting in costly production-line shutdowns for the end-user.
Accordingly,
attempts have been made to monitor the physical characteristics of fibre in
real-time, as it
is being produced, to identify defects in the fibre before it is shipped to
the end-user.
For instance, Fabbri (US 4,706,014) and Meyer (US 5,394,096) use a capacitive
sensor to
respectively measure the diameter and denier of a polymer fibre. However,
capacitive
sensors can only detect large variations in denier. Further, it is not
possible to monitor
1
CA 02899102 2015-07-31
other fibre characteristics of importance to textile users, such as finish,
bulk, node count
and node quality, using a capacitive sensor.
Sakai (US 4,491,831) uses a phototransistor to detect yarn irregularities.
The
phototransistor generates an analog signal in response to yarn unevenness. The
analog
signal is digitized, and then subjected to real-time frequency analysis, to
thereby detect
both cyclic and non-cyclic yarn irregularities. However, it is not possible to
monitor
other fibre characteristics of importance to textile users, such as finish,
bulk, node count
and node quality, using a phototransistor.
Felix (US 4,888,944) monitors a pair of process parameters, such as yarn
tension and
speed, to detect changes in denier, filament breakage, and absence of finish.
However,
using the disclosed monitored parameters, it would not be possible to monitor
other fibre
characteristics of importance to textile users, such as bulk, node count and
node quality.
Instrumar Ltd. (CA 2,254,426) uses an electric field sensor for measuring
physical fibre
characteristics in real-time. Changes in the physical characteristics of a
fibre as it is
drawn past the sensor causes a current to be induced in the electrode.
Comparing the
changes in magnitude and phase of the induced current against known fibre
profiles
allows Instrumar to monitor the denier, finish and interlacing of the drawn
fibre in real-
time. However, the electrode is sensitive to changes in electric field
adjacent to the fibre,
thereby reducing the sensitivity of the sensor to the desired fibre
characteristics. Further,
it is not possible to monitor other fibre characteristics of importance to
textile users, such
as bulk and node quality, using the described sensor measurements.
Therefore, there remains a need for an improved mechanism for monitoring the
physical
characteristics of multiple-filament fibre in real-time.
SUMMARY OF THE INVENTION
According to a first aspect of this disclosure, there is provided a computer-
based fibre
production monitoring system comprising at least one sensor, and a computer
server in
2
CA 02899102 2015-07-31
communication with the at least one sensor. The sensor is configured to
provide an
indication of at least one physical characteristic of a fibre as it is drawn
past the sensor on
a threadline and wound onto a bobbin. The computer server is configured to
provide an
analysis of the at least one physical characteristic on a per-threadline
(and/or per-bobbin)
basis from the indication.
In accordance with one implementation, the fibre production monitoring system
also
includes a measurements database for retaining the indications, and the
computer server
is configured to provide a historical account of the analysis of at least one
physical
characteristic. The computer server is also configured to compare each
indication against
a process limit established for the physical characteristic, and to activate
an alarm in
accordance with a deviation of each indication from the associated process
limit. In one
variation, the computer server is configured to compare each indication
against a
respective process limit established for each physical characteristic, and to
activate an
alarm in accordance with a deviation of at least two of the indications from
the associated
process limits.
Preferably, the indications comprise periodic measurements of the physical
characteristic,
and the sensor is configured to locally buffer the measurements taken, and to
transmit the
buffered measurements to the computer server upon receipt of a data request
from the
computer server. Further, preferably the sensor comprises an electric field
sensor, and a
sensor processing unit coupled to the electric field sensor, and the sensor
processing unit
is configured to provide the at least one measurement by monitoring an
amplitude of a
current signal induced in the electric field sensor as the fibre is drawn past
the electric
field sensor.
According to a second aspect of this disclosure, there is provided an electric
field sensor
that comprises an insulating substrate, a plurality of non-contacting
electrodes disposed
on the substrate, and a plurality of conductors coupled to the electrodes and
extending
transversely through the substrate. The electrodes include a plurality of
first non-
contacting electrodes, and a plurality of second non-contacting electrodes
that are
3
CA 02899102 2015-07-31
interlaced and non-contacting with the plurality of first electrodes. The
conductors
include a first conductor portion and a second conductor portion. The first
portion of the
conductors are coupled to the plurality of first electrodes, and the second
portion of the
conductors are coupled to the plurality of second electrodes.
Preferably, the electric field sensor also includes an insulator disposed over
the
electrodes. The insulator may comprise ceramic or glass, with alumina being
the
preferred ceramic. Further, preferably the electrodes are disposed parallel to
each other
on the substrate, and the conductors comprise vias that extend at a right
angle to the
electrodes.
According to a third aspect of this disclosure, there is provided a computer-
based method
of monitoring the production of fibre involving the steps of: (1) receiving
data at a
computer server, each said datum being associated with a threadline and
including an
indication of at least one physical characteristic of a fibre as it is drawn
past a sensor on
the threadline and wound onto a bobbin; and (2) providing an analysis of the
at least one
physical characteristic on a per-threadline basis (and/or per bobbin-basis)
from the
indication.
In accordance with one implementation, the computer server includes an archive
for
retaining the indication, and the analysis providing step comprises providing
a historical
account of the analysis of the at least one physical characteristic. The
computer server
compares each indication against a process limit established for the physical
characteristic; and activates an alai in in accordance with a deviation of
each indication
from the associated process limit. In one variation, each data packet includes
a plurality
of the indications, each indication being associated with a respective one of
the physical
characteristics, and the receiving step comprises the steps of (i) at the
computer server,
comparing each indication against a respective process limit established for
each physical
characteristic; and (ii) activating an alarm in accordance with a deviation of
at least two
of the indications from the associated process limits.
4
CA 02899102 2015-07-31
According to a fourth aspect of this disclosure, there is provided a computer-
based
method of monitoring the production of fibre on a threadline, the method
comprising the
steps of: (1) monitoring an amplitude of a current signal induced in an
electric field
sensor by a fibre drawn past the sensor; (2) detecting peaks and troughs in
the current
signal from measurements of the amplitude; and (3) determining a physical
property of
the fibre from the detected peaks and troughs.
In accordance with one implementation, the detecting step comprises the steps
of (i)
identifying local amplitude minimums and maximums from the amplitude
measurements;
(ii) calculating heights of the local maximums relative to the local minimums;
and (iii)
excluding those of the local maximums having an associated calculated height
less than a
predetermined threshold.
Typically, each of the non-excluded local maximums precedes one of the local
minimums by a respective time period, and the method also comprises the steps:
(iv)
excluding those of the non-excluded local maximums having an associated time
period
greater than a threshold maximum time; (v) excluding those of the non-excluded
local
maximums having an associated time period less than a threshold minimum time;
and
(vi) retaining remaining ones of the non-excluded local maximums.
In one variation, the physical property to be determined is node count, and
the physical
property determining step comprises the steps of: (a) segmenting the amplitude
measurements into time spans; and (b) for each said time span, calculating a
respective
node count from the associated retained local maximums. In another variation,
the
physical property is node quality, and the physical property determining step
comprises
for each said time span calculating an average of the associated heights over
the
associated node count.
According to a fifth aspect of this disclosure, there is provided a computer-
based method
of monitoring the production of fibre on a threadline, the method comprising
the steps of:
(1) monitoring an output of an electric field sensor disposed on a threadline;
(2) detecting
5
CA 02899102 2015-07-31
the presence of a fibre being drawn past the sensor from an increase in one of
an average
current, a steady state noise and a node count measured by the electric field
sensor; and
(3) detecting a break in the fibre from a decrease in the average current, the
node count,
and a transient noise measured by the electric field sensor, the decreases and
the transient
noise overlapping in time.
In accordance with one implementation, the average current is determined by
detecting
peaks in amplitude of a current induced in the electric field sensor, and
calculating an
average of the amplitude. The average amplitude is calculated by segmenting
the peaks
into time spans, and calculating a mean value for an average of the magnitude
of the
peaks over each said time span. The noise is deteimined by detecting peaks in
amplitude
of a current induced in the electric field sensor, segmenting the peaks into
time spans, and
summing the magnitude of the peaks over each said time span. The node count is
determined by detecting peaks in amplitude of a current induced in the
electric field
sensor, and calculating a node count from the detected peaks. The node count
is
calculated by segmenting the peaks into time spans, and counting the peaks for
each said
time span.
According to a sixth aspect of this disclosure, there is provided a computer-
based method
of monitoring the production of fibre on a threadline, the method comprising
the steps of:
(1) monitoring an output of a plurality of electric field sensors each
disposed on a
respective one of a plurality of threadlines, each said threadline carrying a
multi-filament
fibre; and (2) from a change in amplitude of a current signal induced in the
electric field
sensors as each said fibre is drawn past the respective electric field sensor,
detecting the
presence of a filament from one of the threadlines in the fibre of another one
of the
threadlines.
In accordance with one implementation, the presence of a filament is detected
by
monitoring for a positive change in the amplitude on the one threadline, and
monitoring
for a negative change in the amplitude on the other threadline.
6
CA 02899102 2015-07-31
BRIEF DESCRIPTION OF THE DRAWINGS
The foregoing aspects will now be described in detail, by way of example only,
with
reference to the accompanying drawings, in which:
Fig. 1 is a schematic view of the computer-based fibre production monitoring
system,
depicting the sensors, the sensor monitor, the computer server and the
measurements
database;
Fig. 2a is a schematic view of one of the sensors (an electric field sensor)
depicted in Fig.
1;
Fig. 2b is a top plan view of the electric field sensor depicted in Fig. 2a;
Figs. 2c and 2d are transverse cross-sectional views of the electric field
sensor;
Fig. 3a is a schematic view of the structure of the data packet created by the
sensor
processing unit;
Fig. 3b is a schematic view of the structure of the data record created by the
sensor
monitor;
Fig. 4 is a schematic view of the structure of the computer server, depicting
the software
executed thereon;
Fig. 5 is a flow-chart depicting generally the method of operation of the
fibre production
monitoring system;
Fig. 6 is a flow-chart depicting the method of operation of the fibre
production
monitoring system in detail, with Fig. 6a depicting the steps performed by the
sensor
processing unit and the sensor monitor, and with Fig. 6b depicting the steps
performed
concurrently by the computer server;
7
CA 02899102 2015-07-31
Fig. 7a is a waveform depicting the variation in the magnitude of the induced
current with
respect to interlacing node location;
Figs. 7b and 7c together comprise a flow-chart depicting the method of
determining node
count and node quality with the fibre production monitoring system;
Fig. 8 (comprising Figs. 8a to 8e) is a flow-chart depicting the method of
determining
thread presence with the fibre production monitoring system; and
Fig. 9 (comprising Figs. 9a and 9b) is a flow-chart depicting the method of
determining
cross-over events with the fibre production monitoring system.
DETAILED DESCRIPTION OF THE PREFERRED EMBODIMENT
1. Fibre Production Monitoring System: Overview
Turning now to Fig. 1, there is shown a computer-based fibre production
monitoring
system, denoted generally as 100, comprising a plurality of sensors 200, a
sensor monitor
300, a computer server 400, a local area network 102 interconnecting the
sensors 200 and
the sensor monitor 300, and a communications network 104 interconnecting the
sensor
monitor 300 and the computer server 400. Optionally, the fibre production
monitoring
system 100 includes a measurements database 450 resident on the computer
server 400; a
personal computer 480; and a communications network 110 interconnecting the
computer
server 400 and the personal computer 480.
Preferably, the local area network 102 comprises a DeviceNet bus, although
other
network protocols may be used. Preferably the communications network 104
comprises
a wired local area Ethernet network. However, the communications network 104
can
also utilize other network protocols, and can comprise a wide area network, or
a wireless
network. Further, although the fibre production monitoring system 100 is shown
including a number of sensors 200, the fibre production monitoring system 100
need only
include a single sensor 200.
8
CA 02899102 2015-07-31
Preferably, the communications 110 is a local area Ethernet network, although
the
invention is not so limited.
2. Sensor
Each sensor 200 is typically disposed on a threadline of multi-bobbin fibre
production
line. The multi-bobbin fibre production line has a number of spinnerettes,
each
producing several filaments from a molten polymer. The filaments are then
stretched,
and combined into a number of multi-filament fibres. The filaments are also
exposed to a
continuous air jet, which form interlacing nodes in the fibre, thereby bonding
the
filaments together in a single fibre. Each fibre is then wound on a respective
bobbin.
Each sensor 200 is configured to monitor the physical characteristics of a
number of the
multi-filament fibres, as the fibres are drawn past the sensor 200, prior to
being wound on
the bobbin. As shown in Fig. 2a, preferably the sensor 200 comprises a
plurality of
electric field sensors 202 (depicted as 202a, 202b, 202c, 202d), and a sensor
processing
unit (SPU) 204 coupled to the electric field sensors 202. Each electric field
sensor 202
monitors the physical characteristics of one of the multi-filament fibres.
However, as
will be appreciated, the sensor 200 need not include several electric field
sensors 202, but
instead could include only a single electric field sensor 202. Further,
although each
sensor 202 is preferably an electric field sensor, other forms of sensors that
are capable of
monitoring the physical characteristics of the fibres can be used.
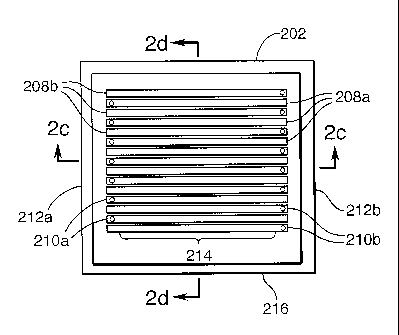
As shown in Figs. 2b, 2c and 2d, each electric field sensor 202 comprises an
insulating
substrate 206, a plurality of electrodes 208 disposed on the substrate 206,
and a plurality
of vias 210 extending downwardly through the substrate 206. Preferably, the
substrate
206 comprises a non-conductive material, such as ceramic, although other non-
conductive materials may be used. Also, preferably the electrodes 208 are
substantially
planar and are formed on the substrate 206 using conventional printed circuit
board or
integrated circuit manufacturing techniques. The electrodes 208 extend across
the top
9
CA 02899102 2015-07-31
surface of the substrate 206 in a substantially parallel fashion, such that
the electrodes
208 do not contact one another on the top surface of the substrate 206.
The electrodes 208 are segregated into a first electrode portion 208a, and a
second
electrode portion 208b. The electrodes 208 of the first electrode portion 208a
extend
from one end 212a of the substrate 206, and the electrodes 208 of the second
electrode
portion 208b extend from the opposite end 212b of the substrate 206. The
electrodes 208
of the first electrode portion 208a are interlaced with the electrodes 208 of
the second
electrode portion 208b in the centre region 214 of the top surface of the
substrate 206.
Typically, each via 210 comprises a plated through-hole extending from one end
of a
respective electrode 208, through the substrate 206, to the bottom 218 of the
sensor 202.
Alternately, the vias 210 may be provided as conductive traces or wires
extending in a
similar manner. The vias 210 are segregated into a first via portion 210a, and
a second
via portion 210b. The vias 210 of the first via portion 210a are coupled to
the first
electrode portion 208a, and the vias 210 of the second via portion 210b are
coupled to the
second electrode portion 208b. Each via 210 is connected to a respective
electrode 208
adjacent the respective end 212, and extends at a right angle from the
electrode 208
through the substrate 206, from the top surface thereof to the bottom surface
218 thereof.
With this configuration, the sensitivity of the electric field sensor 202 to
electric fields
outside the centre region 214 is less than prior art electric field sensors.
The electric field sensor 202 preferably also includes an insulator layer 216
disposed over
the electrodes 208. Typically, the insulator layer 216 comprises ceramic or
glass,
although the ceramic alumina is preferred due to its hardness. Preferably, the
electric
field sensor 202 includes guides (not shown) extending upwards from the
insulator layer
216, within the centre region 214, which guide the drawn fibre in a direction
transverse to
the orientation to the electrodes 208.
The sensor processing unit (SPU) 204 includes a number of data buses, each
connected to
the vias 210 of a respective one of the electric field sensors 202. Each via
210 connects
CA 02899102 2015-07-31
=
to a respective conductor of the data buses at the bottom 216 of the sensor
202. The SPU
204 applies a respective sinusoidal voltage signal to the electrode portions
208, with the
voltage signal applied to the first electrode portion 208a being complementary
(ie 180
degrees out of phase) to the voltage signal applied to the second electrode
portion 208b.
The SPU 204 also monitors the current induced in each electric field sensor
202, as the
associated fibres are drawn past the electric field sensors 202. The SPU 204
includes an
internal AID converter that periodically digitizes the current measurements
from the
associated electric field sensors 202. Based on the current measurements, the
SPU 204
creates a data packet 250 (see Fig. 3a) that includes a series of measurements
of physical
characteristics of the fibre as it is drawn past the electric field sensor
202.
As shown in Fig. 3a, each data packet 250 includes a series of magnitude
measurements
and a series of phase measurements, measured over a predetermined measurement
time
span. The SPU 204 derives the magnitude and phase measurements by referencing
the
magnitude and phase of the current induced in the sensor 202 respectively to
the
magnitude and phase of the applied sensor voltage. In effect, then, the
magnitude
measurements included with each data packet 250 are admittance measurements.
However, for ease of reference, the magnitude (admittance) measurements
included with
each data packet 250 will be referred to hereinafter as current magnitude
measurements;
and the phase measurements included with each data packet 250 will be referred
to
hereinafter as current phase measurements.
In addition to the magnitude measurements and the phase measurements, each
data
packet 250 includes a node count of the number interlacing nodes encountered
by the
associated electric field sensor 202 within the measurement time span, and a
measurement of the node quality of those nodes. The data packet 250 also
includes a
Built-In-Test (BIT) datum that identifies the status of the SPU 204. Further,
as discussed
above, preferably the insulator layer 216 of the electric field sensor 202
comprises
alumina. However, since alumina increases the sensitivity of the electric
field sensor 202
to temperature, preferably the data packet 250 also includes a measure of the
temperature
11
CA 02899102 2015-07-31
of the electric field sensor 202. In addition, the data packet 250 includes a
sequence
number that is generated by the SPU 204.
3. Sensor Monitor
The sensor monitor 300 is coupled to the sensor processing units 204 of the
sensors 200
via the DeviceNet bus 102. Preferably, the sensor monitor 300 comprises
a
programmable logic controller (PLC), such as the Allan Bradley Control Logix
PLC.
Further, preferably the sensor monitor 300 includes a DeviceNet scanner that
periodically
sends out commands to the sensor processing units 204, requesting data packets
250 from
the sensors 200. As will be explained, the sensors 200 provide the sensor
monitor 300
with the data packets 250 for the associated threadlines, which the sensor
monitor 300
converts into data records 350 (see Fig. 3b) and transmits to the computer
server 400 over
the communications network 104. The DeviceNet scanner includes a response
buffer 302
(Fig. 1) that is used to store the data packets 250 prior to being converted
into the data
records 350.
Each sensor processing unit 204 is assigned a respective DeviceNet address, so
that each
electric field sensor 202 has a unique logical sensor address which the sensor
monitor 300
uses to identify the threadline for the data packets 250 received from the
sensors 200.
Preferably, the sensor processing unit 204 low pass filters the induced
current at a cut-off
frequency of 15 kHz, and provides the sensor monitor 300 with the resulting
data packets
250 every 200 ms. Other data rates could be used. Further, preferably the
DeviceNet
scanner sends out data request commands to the sensors 200 at rate slightly
faster than
once every 200 ms to ensure that data from the sensors 200 is not overwritten
(and lost)
at the sensor processing unit 204 prior to being transmitted to the sensor
monitor 300.
To avoid loss of data at the sensor monitor 300, preferably the sensor monitor
300
includes a circular buffer 304 (Fig. 1) for retaining the data records 350
until transmitted
to the computer server 400. Further, the sensor monitor 300 includes a copy
buffer 306
(Fig. 1) which the computer server 400 uses to copy data from the sensor
monitor 300,
12
CA 02899102 2015-07-31
and a Ready flag 308 (Fig. 1) which the computer server 400 uses to signify
that it is
ready to receive data records 350 from the copy buffer 306.
In addition, the sensor monitor 300 includes a first sliding window 310, a
second sliding
window 312, and a noise monitor 314 (Fig. 1). The first and second sliding
windows 310
each comprise a 25-slot queue that the thread presence algorithm uses to
detect the
presence of a fibre on a threadline, and line breaks in the fibre. The noise
monitor 314
comprises a 50-element queue that the thread presence algorithm also uses to
detect the
presence of a fibre on a threadline, and line breaks in the fibre.
4. Data Record
As shown in Fig. 3b, the data record 350 includes an initial header 352, a
magnitude field
354, a phase field 356, a node count field 358, a node quality field 360, a
BIT field 362, a
thread presence flag 364, a winder status field 366, a sensor address field
368, a cross-
over event field 370 and a checksum field 372. The initial header 352
identifies the type
of data contained in the data record 350. For instance, the data header 352
might indicate
that the data record 350 includes normal sensor data. Alternately, the data
header 352
might indicate that the data record 350 includes data specifically requested
by the sensor
monitor 300, such as the temperature of the electric field sensor 202.
The magnitude field 354 provides a measure of the amplitude of the current
induced in
the electric field sensor 202. The phase field 356 provides a measure of the
phase of the
current induced in the electric field sensor 202, relative to a reference
signal (such as the
voltage applied to the electric field sensor 202). The node count field 358
provides a
measure of the number of interlacing nodes detected within a predetermined
length of
fibre. The node quality field 360 provides a measure of the average amplitude.
The BIT
(Built-in-Test) field 362 provides an indication of the status of the electric
field sensor
202. For instance, typically the BIT field 362 is a two-byte datum that
indicates whether
the temperature of the electric field sensor 202 is out of range, and whether
the data
measured by the internal A/D converter of the sensor processing unit 204 is
out of range.
13
CA 02899102 2015-07-31
The thread presence flag 364 provides an indication of the presence or absence
of a fibre
at the electric field sensor 202. The thread presence flag 364 may be set
using a suitable
sensor disposed on the threadline, that is monitored by the sensor monitor
300.
Alternately, the thread presence flag 364 may be set using the threadline
presence
algorithm, described herein.
The winder status field 366 provides an indication of the status of the bobbin
winder,
such as whether fiber is going to package or not. Each winder includes test
circuitry that
monitors the status of the respective winder. The sensor monitor 300 monitors
the test
circuitry in each winder, and sets the winder status field 366 accordingly.
The sensor address field 368 identifies the logical address of the electric
field sensor 202
from which the associated data in the data record 350 originated. The cross-
over event
field 370 provides an indication that one or more filaments from the fibre on
one
threadline has/have jumped or crossed over to the fibre on another threadline.
The
checksum field 372 includes a checksum, which is generated by the sensor
monitor 300,
and used by the computer server 400 to verify the integrity of the data record
350.
5. Computer Server
As shown in Fig. 4, the computer server 400 comprises a non-volatile memory
(ROM)
402, a volatile memory (RAM) 404, a network interface 406, and a central
processing
unit (CPU) 408 coupled to the ROM 402, the RAM 404, and the network interface
406.
The computer server 400 also includes a display device 410 (such as a CRT or
LCD
panel), and a data input device 412 (such as a keyboard) coupled to the CPU
408.
The network interface 406 interfaces the computer server 400 with the
communications
network 104, and allows the computer server 400 to communicate with the sensor
monitor 300. The ROM 402 may be provided as an electronic memory, a magnetic
disc
and/or an optical disc. The ROM 402 includes processing instructions for the
computer
server 400 which, when loaded into the RAM 404, define a TCP/IP layer 414, a
RS Linx
layer 416, an OPC layer 418, and an application software layer 420.
Alternately, the
14
CA 02899102 2015-07-31
processing instructions may be provided via the network interface 104 or a
removable
computer-readable medium, which, when accessed by the CPU 408 define in the
RAM
404 one or more of the TCP/IP layer 414, the RS Linx layer 416, the OPC layer
418, and
the application software layer 420.
The TCP/IP layer 414 establishes a communications channel between the sensor
monitor
300 and the computer server 400 over the communications network 104. The RS
Linx
layer 416 is in communication with the TCP/IP layer 414, and implements the
OPC
groups required to communicate with the sensor monitor 300.
The OPC layer 418 is in communication with the RS Linx layer 416, and defines
the
OPC groups that allow the computer server 400 to retrieve the data records 350
from the
sensor monitor 300. The application software layer 420 is in communication
with the
OPC layer 418, and stores the retrieved data records 350 in the measurements
database
450. In addition, the application software layer 420 also provides users with
an analysis
of the physical characteristics of the fibre(s) from the retained data records
350. For
instance, the application software layer 420 provides an analysis of the
denier (mass flow
of fibre, expressed in grams per 9000 metres of fibre), spin finish (residual
solvent or
coating on the fibre), bulk (the degree of texturing due to crimp and
shrinkage) and
evenness (variation in denier) of the fibre(s).
Since slow variations (typically less than 5 Hz) in the peak magnitude of the
sensor
current are due primarily to changes in denier or bulk, the application
software layer 420
provides an analysis of the denier or bulk by reporting low frequency changes
in the peak
magnitude of the sensor current. Since slow variations (typically less than 5
Hz) in the
phase of the sensor current are due primarily to changes in spin finish, the
application
software layer 420 provides an analysis of the finish applied to the fibres by
reporting
low frequency changes in the phase of the sensor current.
As will be explained, the waveform of the current induced in the electric
field sensors
202a consists of a series of peaks and troughs. Since the size of the
variations in the
CA 02899102 2015-07-31
peaks of the sensor current measurements is a good indicator of evenness, the
application
software layer 420 provides an analysis of evenness by calculating the
coefficient of
variation of the current magnitudes at the peaks.
In addition to denier, finish, bulk and evenness, preferably the application
software layer
420 also provides an analysis of the node count (number of interlacing nodes
detected per
sample period) and node quality (measure of the compactness of the interlacing
nodes) of
the fibre(s). Further, the application software layer 420 may provide an
analysis of the
number of line breaks and cross-over events for the fibre(s). The mechanism by
which
these latter characteristics are determined will be discussed below with
reference to Figs.
5 to 9.
As described above, the sensor monitor 300 preferably comprises a programmable
logic
controller, that receives the data packets 250 from the sensors 200, and
converts into data
records 350. However, in one variation, the sensor monitor 300 comprises an
Ethernet-
DeviceNet Adaptor that serves a data conduit between the computer server 400
and the
sensor processing units 204. In this variation, the Ethernet-DeviceNet Adaptor
does not
perform any data manipulation, but instead transmits the data packets 250
received from
the sensors 200 to the computer server 400. Further, the RS Linx layer 416 and
the OPC
layer 418 are eliminated from the computer server 400; and the first and
second sliding
windows 310, 312 and the noise monitor 314 are implemented by the computer
server
400 instead of the sensor monitor 300.
6. Measurements Database
As shown, preferably the measurements database 450 is provided on the computer
server
400. However, the measurements database 450 may also be maintained on a
separate
SQL or ORACLE server that is in communication with the computer server 400.
Typically, each bobbin has a bobbin identifier, such as a bar code, marked
thereon, that is
uniquely associated with the bobbin. When an operator of the fibre production
monitoring system 100 loads an empty bobbin onto one of the bobbin winders,
the
16
CA 02899102 2015-07-31
operator inputs the bobbin identifier into the application software layer 420
of the
computer server 400, either through a keyboard or code reader device. The
application
software layer 420 maintains a record associating the bobbin identifier with
the sensor
address(es) 368 of the sensor(s) 200 of the threadline upon which the bobbin
will be
wound.
The application software layer 420 is configured to save the bobbin identifier
in the
measurements database 450, together with the associated data records 350. As
such, the
application software layer 420 is able to provide an analysis of each of the
foregoing
parameters (denier, finish, bulk, evenness, node count, node quality, cross-
over events)
on a per-bobbin basis, thereby allowing the operator to verify the quality of
each bobbin
produced. The application software layer 420 is also able to provide an
analysis of each
of the foregoing parameters on a per-threadline basis. The application
software layer 420
can also generate a hardcopy of the analysis, which can accompany the
respective
bobbin, thereby allowing the purchaser to verify the quality of the bobbin.
Further, since
the data records 350 and the associated bobbin identifiers are stored in the
measurements
database 450, the application software layer 420 is able to provide a
historical analysis of
each of the foregoing characteristics, on a per-threadline basis to thereby
identify
possibly failing hardware, and/or on a per-bobbin basis to accompany a
shipment of
bobbins.
7. Personal Computer
The personal computer 480 may be implemented as a portable computer or a
desktop
computer, or even as a handheld communications device, such as a wireless
portable data
assistant. As discussed above, the personal computer 480 communicates with the
computer server 400 over the communications network 110 Typically, the
personal
computer 480 is used to render the results of the foregoing forms of analysis.
Further, the
personal computer 480 may be used to control the operation of the fibre
production
monitoring system 100 via the computer server 400.
17
CA 02899102 2015-07-31
8. Fibre Production Monitoring System: Method of Operation
The method of operation of the fibre production monitoring system 100 will now
be
described generally with reference to Fig. 5, followed by a more detailed
discussion with
reference to Fig. 6. Thereafter, the node count and node quality algorithms
will be
described with reference to Figs. 7a and 7b. The thread presence algorithm;
and the
cross-over events detection algorithm will then be described with reference to
Figs. 8 and
9, respectively.
At step 500, the computer server 400 receives from the sensor(s) 200, the data
records
350 over the communications network 104. The data records 350 include at least
one
measurement of a physical characteristic of a fibre as it is drawn past one of
the sensors
200. The data records 350 include the sensor addresses 368, thereby
identifying the
threadline to which the data record 350 pertains. At step 502, the computer
server 400
associates the sensor addresses 368 with the corresponding bobbin identifiers.
Preferably, the computer server 400 also saves the received data records 350
(and the
associated bobbin identifiers) in the measurements database 450.
Thereafter, at step 504, in response to a request issued by an operator of the
personal
computer 480, the computer server 400 generates an analysis of the data
records 350
(either stored in the RAM 404 of the computer server 400, or in the
measurements
database 450). Typically, the computer server 400 generates an analysis of the
denier,
finish, bulk and/or evenness of the fibre(s). The computer server 400 may also
provide
an analysis of the node count and/or node quality of the fibre(s). Further,
the computer
server 400 may provide an analysis of the number of line breaks and/or cross-
over events
for the fibre(s). Preferably, the analysis is rendered on the personal
computer 480, on a
per-threadline and/or a per-bobbin basis. In other words, the computer server
400
provides an analysis of one or more of the foregoing characteristics for one
or more
specified threadlines, and/or one or more specified bobbins. The computer
server 400
may provide a historical analysis of one or more of the foregoing
characteristics, for
example over a specified period of time on one or more specified threadlines.
18
CA 02899102 2015-07-31
Further details of the foregoing method will now be described with reference
to Fig. 6. In
the foregoing discussion, it should be understood that steps 600 to 616 are
performed by
the sensor processing unit 204 and the sensor monitor 300, and steps 618 to
628 are
performed by the computer server 400. Also, steps 600 to 616 are performed
concurrently with steps 618 to 628. Further, steps 600 to 616 and steps 618 to
628 are
perfoi __ Hied repeatedly.
At step 600, the sensor processing units 204 apply the aforementioned
complementary
sinusoidal voltage signals to the associated electric field sensor(s) 202, and
continuously
measure the current induced in the associated electric field sensor(s) 202 as
the fibre is
drawn past the electric field sensor(s) 202. Each sensor processing unit 204
measures the
induced current over a predetermined measurement time span, which is typically
200 ms.
At the end of each time span, each sensor processing unit 204 assembles a data
packet
250 from the measured currents, at step 602. The data packet 250 includes the
series of
current magnitude measurements and the series of current phase measurements,
measured
over the measurement time span. As discussed above, the magnitude and phase
measurements included with the data packet 250 are referenced respectively to
the
magnitude and phase of the applied sensor voltage. Thus, the magnitude
measurements
included with the data packet 250 are admittance measurements.
In addition to the current magnitude measurements and the current phase
measurements,
each data packet 250 includes a count of the number interlacing nodes
encountered by the
associated electric field sensor 202 within the measurement time span, and a
measurement of the quality of those nodes. The node count and node quality
algorithms
will be described in detail with reference to Fig. 7.
Each data packet 250 also includes a sequence number, and a BIT datum that
identifies
the status of the sensor processing unit 204. Preferably, each data packet 250
also
includes a measure of the temperature of the associated electric field sensor
202. As
discussed above, preferably each sensor processing unit 204 low pass filters
the current(s)
19
CA 02899102 2015-07-31
at each electric field sensor 202 a cut-off frequency of 15 kHz, and assembles
the sensed
data stream into data packets every 200 ms. Each sensor processing unit 204
continuously performs steps 600 and 602.
At step 604, the DeviceNet scanner of the sensor monitor 300 transmits read
commands
to the sensor processing units 204, requesting the data packets 250 from the
sensor
processing units 204. As discussed above, the DeviceNet scanner sends out the
read
commands to the sensor processing unit 204 at rate slightly faster than once
every 200 ms
to ensure that data from the sensors 200 is not overwritten (and lost) at the
sensor
processing unit 204 prior to being transmitted to the sensor monitor 300. At
step 606, the
DeviceNet scanner receives a data packet 250 from the sensor processing unit
204, and
stores the received data packet 250 into the memory of the response buffer 302
based on
the logical sensor address of the sensor 200 from which the data packet 250
was
generated.
As discussed above, the data packet 250 includes a series of current magnitude
and phase
measurements, a node count, and a measurement of the node quality of those
nodes.
Further, the data packet 250 also includes a BIT datum that identifies the
status of the
sensor processing unit 204, a measure of the temperature of the electric field
sensor 202,
and a sequence number generated by the sensor processing unit 204.
The sensor monitor 300 monitors the status of the response buffer 302, and
detects the
presence of new data from changes in the sequence number. When the sensor
monitor
300 detects the presence of a new data packet 250 in the response buffer 302,
the sensor
monitor 300 removes the data packet 250 from the response buffer 302, and
creates a data
record 350 from the removed data packet 250, at step 608. As discussed above,
the data
record 350 includes an initial header 352, a magnitude field 354, a phase
field 356, a
node count field 358, a node quality field 360, a BIT field 362, a thread
presence flag
364, a winder status field 366, a sensor address field 368, a cross-over event
field 370 and
a checksum field 372.
CA 02899102 2015-07-31
At step 610, the sensor monitor 300 stores the data record 350 into the next
available
entry in the circular buffer 304. Further, the sensor monitor 300 inserts the
sequence
number (from the corresponding data packet 250) at the beginning and end of
the data
record 350 to allow the sensor monitor 300 to subsequently identify the
beginning and
end of the data record 350.
The OPC layer 418 signals the sensor monitor 300 that the computer server 400
is ready
to receive data records 350 by setting the Ready flag 308 in the sensor
monitor 300 (at
step 618), via the RS Linx layer 416. Consequently, at step 612, the sensor
monitor 300
monitors the status of the Ready flag 308. If the Ready flag 308 is clear, the
sensor
monitor 300 performs steps 604 to 610 again. However, if the Ready flag 308 is
set, at
step 614 the sensor monitor 300 copies the contents of the circular buffer 304
into the
copy buffer 306. The sensor monitor 300 then clears the Ready flag 308, at
step 616.
As discussed above, the OPC layer 418 signals the sensor monitor 300 that the
computer
server 400 is ready to receive data records 350 by setting the Ready flag 308
in the sensor
monitor 300, at step 618. Consequently, the OPC layer 418 monitors the status
of the
Ready flag 308, at step 620 (to determine if the Ready flag 308 has been
cleared by the
sensor monitor 300 at step 616). If the OPC layer 418 detects that the Ready
flag 308 has
now been cleared, the RS Linx layer 416 copies the data records 350 in the
copy buffer
306 to a buffer in the computer server 400, at step 622.
Typically, the operator of the fibre production monitoring system 100 will
input into the
application software layer 420 one or more parameter limits for any of the
foregoing
physical parameters (denier, finish, bulk, evenness, node count, node quality,
line breaks,
cross-over events) using the data input device 412. For instance, the operator
may
establish an upper process limit (UP), and a lower process limit (LP) for one
or more of
these parameters. The operator may establish may also establish an upper
control limit
(UC), and a lower control limit (LC) for one or more of these parameters. The
UP and
LP limits respectively define absolute upper and lower limits for the
associated
21
CA 02899102 2015-07-31
parameters. The UC and LC limits respectively define desired upper and lower
limits for
the associated parameters.
Accordingly, upon receipt of the data records 350, the application software
layer 420
compares the measurements contained therein against the defined parameter
limits, at
step 624. If one of the measurements deviates from the range established by
the defined
parameter limits, at step 626 the application software layer 420 activates an
audible
and/or visual alarm on the computer server 400. Typically, the application
software layer
420 renders a yellow warning light on the display device 410 if one of the
measurements
deviates outside the range bound by UC and LC, and renders a red warning light
on the
display device 410 if one of the measurements deviates outside the range bound
by UP
and LP.
In one variation, instead of activating an alarm when one of the measurements
deviates
from the range established by the defined parameter limits, the application
software layer
420 activates an alarm at step 626 when two or more different characteristics
of
measurements deviate from the respective ranges established by the defined
parameter
limits. This variation is advantageous if one of the characteristic
measurements alone is
an insufficient indicator of the desired physical parameter. For instance,
typically the
magnitude of the induced current is a good indicator of denier, and the phase
of the
induced current is a good indicator of finish. However, with some fibres,
current
magnitude may not correlate well with denier, and current phase may not
correlate well
with finish. Accordingly, to provide a reliable indictor of denier, for
example, it may be
preferable to monitor both magnitude and phase; or magnitude, phase and node
quality;
or magnitude, phase and node quality, for example, and activate an alarm when
the
specified parameters exceed or fall below the associated parameter limits.
Furthermore, in another variation, the application software layer 420
activates an alarm at
step 626 based on the number of characteristic measurements deviating from the
respective ranges defined by the parameter limits, and the direction of the
deviation. For
instance, it may be advantageous to trigger an alarm at step 626 when one of
the
CA 02899102 2015-07-31
characteristic measurements exceeds an upper process limit (UP or UC), and
another one
of the characteristic measurements falls below a lower process limit (LP or
LC). Other
variations on the foregoing will be apparent.
As discussed above, each data record 350 includes the sensor address 368 of
the sensor
200 from which the data originated. Further, the application software layer
420
maintains a record associating each bobbin identifier with the sensor
address(es) 368 of
the sensor(s) 200 of the threadline upon which each bobbin will be wound.
Accordingly,
at step 628, the application software layer 420 saves the data records 350
(and the
associated bobbin identifiers) in the measurements database 450.
Before the data records 350 are being stored in the measurements database 450
(or at
some time after they are stored), the application software layer 420 generates
an analysis
of the denier of the fibre being wound on one or more of the bobbins.
Typically, the
average value of the magnitude of the current induced in the electric field
sensor 202 is a
good indicator of denier, and the average value of the phase of the current
induced in the
electric field sensor 202 is a good indicator of finish. However, as will be
explained with
reference to Fig. 7a, the wavefofin of the current induced in the electric
field sensors
202a consists of a series of local maxima (peaks) and local minima (troughs).
Accordingly, preferably the computer server 400 provides an analysis of the
denier by
calculating the average value of the current magnitude at the peaks.
Similarly, preferably
the computer server 400 provides an analysis of the finish by calculating the
average
value of the current phase at the peaks.
Typically, the variation of the magnitude of the current magnitudes at the
peaks is also a
good indicator of evenness. Accordingly, preferably the computer server 400
provides an
analysis of evenness by calculating the coefficient of variation of the
current magnitudes
at the peaks.
23
CA 02899102 2015-07-31
9. Node Count and Node Quality Algorithms
The node count and node quality algorithms will now be described with
reference to Figs.
7a and 7b. As shown in Fig. 7a, the magnitude of the current induced in the
electric field
sensor 202 varies periodically with time as the fibre is drawn past the
electric field sensor
202. The resulting current waveform consists of a series of cyclic current
variations
comprising a series of local maxima (peaks) and a series of local minima
(troughs). Each
cyclic current variation is caused by the movement of an interlacing node past
the electric
field sensor 202.
The sensor processing unit 204 monitors the current magnitude, and detects the
peaks and
the troughs in the induced current. From the peaks and the troughs, the sensor
processing
unit 204 determines a physical property of the fibre based on the timing and
magnitude of
the peaks and troughs.
Further details of this process will be apparent from Fig. 7b. The following
discussion
assumes that a fibre has been detected at the sensor 200, either via a
suitable sensor
disposed on the threadline (that is monitored by the sensor monitor 300), or
via the
threadline presence algorithm (described below).
At step 700, the sensor processing unit 204 compares the current magnitude
level against
the average current induced in the electric field sensor 202. The sensor
processing unit
204 calculates the average current from the peaks and troughs of the induced
current,
measured over a predetermined period of time.
If the current magnitude level falls with a range of the average current bound
by an upper
threshold limit and a lower threshold limit, the sensor processing unit 204
ignores the
instant current measurement for the purposes of node count and node quality
calculation.
However, if the current magnitude level is greater than the average current by
an upper
threshold amount, at step 702 the sensor processing unit 204 classifies the
current level as
a possible peak. Conversely, if the current magnitude level is less than the
average
24
CA 02899102 2015-07-31
current by a lower threshold amount, at step 702 the sensor processing unit
204 classifies
the current level as a possible trough.
Thereafter, at step 704, the sensor processing unit 204 compares the current
level against
the magnitude of the subsequent current level. If the sensor processing unit
204
classified the current level as a possible peak, and this magnitude level is
greater than the
subsequent current magnitude level, the sensor processing unit 204 continues
to classify
the previous magnitude level as a possible peak. Conversely, if the sensor
processing
unit 204 classified the instant current level as a possible trough, and the
magnitude of the
instant current level is less than the magnitude of the subsequent current
level, the sensor
processing unit 204 continues to classify the instant current level as a
possible trough.
Otherwise, the sensor processing unit 204 ignores the instant current level
for the
purposes of node count and node quality calculation, at step 706.
At step 708, the sensor processing unit 204 measures the magnitude or height
of the
instant current level relative to the magnitude of the last level identified
as an actual peak
or trough. Specifically, if the sensor processing unit 204 classified the
instant current
level as a possible peak, the sensor processing unit 204 compares the
magnitude of the
instant current level against the magnitude of the preceding trough.
Conversely, if the
sensor processing unit 204 classified the instant current level as a possible
trough, the
sensor processing unit 204 compares the magnitude of the instant current level
against the
magnitude of the preceding peak. If the magnitude of the instant current level
exceeds
the magnitude of the preceding peak/trough by a threshold amount, the sensor
processing
unit 204 continues to classify the instant current level as a possible
peak/trough.
Otherwise, the sensor processing unit 204 ignores the instant current level
for the
purposes of node count and node quality calculation, at step 710.
At step 712, the sensor processing unit 204 calculates the time period between
the instant
current level and the last measurement identified as an actual peak or trough.
Subsequently, at step 714, the sensor processing unit 204 compares the
calculated time
period against an average time period. If the calculated time period falls
with a range of
CA 02899102 2015-07-31
the average time period bound by an upper threshold limit and a lower
threshold limit, at
step 715 the sensor processing unit 204 classifies the instant current level
as an actual
peak/trough. Conversely, if the calculated time period is greater than the
average period
by the upper threshold amount, or is less than the average period by the lower
threshold
amount, the sensor processing unit 204 ignores the instant current level for
the purposes
of node count and node quality calculation, at step 716.
If the sensor processing unit 204 classified the instant current level as an
actual peak, at
step 718 the sensor processing unit 204 increments a counter indicating that a
node was
detected. At step 720, the sensor processing unit 204 determines whether the
predetermined measurement time span has elapsed. As discussed above, typically
the
predetermined measurement time span is 200 ms. If the predetermined
measurement
time span has not yet elapsed, the sensor processing unit 204 performs steps
700 to 718
again.
At step 722, the sensor processing unit 204 sets a node count variable equal
to the value
of the counter. The value of the node count variable is included in the data
packet 250 as
the node count. As will be apparent, although the sensor processing unit 204
increments
the counter at step 718 only if a peak is detected, the sensor processing unit
204 may
instead increment the counter only if a trough is detected.
By step 722, the sensor processing unit 204 has monitored the induced current
over the
complete measurement time span. Accordingly, at step 724, the sensor
processing unit
204 determines the average of the heights of the peaks over the measurement
time span
by calculating the sum of those heights, and dividing the sum by the node
count
(determined at step 722). The calculated average is included in the data
packet 250 as the
node quality.
10. Thread Presence Algorithm
The thread presence algorithm monitors the output of the electric field sensor
202. Based
upon the output of the electric field sensor 202, the algorithm is able to
detect the
26
CA 02899102 2015-07-31
presence of a fibre being drawn past the sensor 200, and is able to detect a
break in the
fibre. Specifically, the algorithm checks for the presence of a fibre by
monitoring for an
increase in one of the magnitude of the average fibre current and the
transient fibre noise,
the steady state fibre noise; and the fibre node count, as measured by the
electric field
sensor 202. The algorithm also checks for the absence of a fibre by monitoring
for a
decrease in one of the magnitude of the average fibre current and the
transient noise, the
steady state fibre noise and the fibre node count, as measured by the electric
field sensor
202. Further details of this process will be described with reference to Fig.
8. Although,
in the following example, the sensor monitor 300 monitors the magnitude of the
average
fibre current, the sensor monitor 300 may instead monitor the phase of the
average fibre
current.
As discussed above, the waveform of the current induced in the electric field
sensor 202
as the fibre is drawn past the electric field sensor 202 consists of a series
of peaks and a
series of troughs. The sensor processing unit 204 monitors the current
magnitude, and
detects the peaks and the troughs in the induced current from the current
measurements.
At step 800, the sensor monitor 300 receives a data packet 250 from one of the
sensors
200. As discussed above, the data packet 250 includes a series of current
magnitude and
phase measurements, measured over a predetermined measurement time span. In
addition, each data packet 250 includes a node count of the number of
interlacing nodes
encountered by the associated electric field sensor 202 within the measurement
time
span, and a measurement of the node quality of those nodes.
At step 802, the sensor monitor 300 identifies the local peak currents from
the magnitude
measurements contained in the data packet 250 (in accordance with steps 700 to
716),
and then calculates the average amplitude for the current over the measurement
time
span. The sensor monitor 300 then stores the calculated average amplitude for
the
current measurement time span in the uppermost slot of the first sliding
window 310, at
step 804. The sensor monitor 300 also stores the calculated average amplitude
value in
the uppermost slot of the noise monitor 314. At step 806, the sensor monitor
300 copies
CA 02899102 2015-07-31
the node count value from the data packet 250, and stores the node count value
in the
uppermost slot of the second sliding window 312. As will be apparent, since
the sliding
windows 310, 312 and the noise monitor 314 are forms of queues, the insertion
of each
new element therein will cause the existing elements to be shifted down one
slot, and the
element contained in slot 0 to be lost.
At step 808, the sensor monitor 300 calculates the mean value of the average
current
amplitude over the last three measurement time spans (as contained in slots
22, 23 and 24
of the first sliding window 310), and assigns this value to the variable
CURRENT. The
sensor monitor 300 also calculates the mean value of the average current
amplitude over
the first three measurement time spans (as contained in slots 0, 1 and 2 of
the first sliding
window 310), and assigns this value to the variable BASE. As will be apparent,
the
number of slots involved in these calculations need not be three, but can be
varied as the
volatility of the data requires. Also, the time separation between the CURRENT
and
BASE samples can be varied to take into account the mechanical noise in the
threadlines,
such as by altering the size of the first sliding window 310.
At step 810, the sensor monitor 300 calculates the difference between the
value of the
CURRENT variable and the BASE variable. The sensor monitor 300 then compares
the
difference (CURRENT ¨ BASE) against a threshold minimum difference (eg. +300),
at
step 812. If the difference (CURRENT ¨ BASE) is greater than the threshold
minimum
difference, at step 814 the sensor monitor 300 calculates the sum of the
absolute values of
the changes in the average current amplitude values over the last five
measurement time
spans (from the values contained in slots 19, 20, 21, 22, 23 and 24 of the
noise monitor
314), and assigns this value to the variable NOISEhan. Since this calculation
only
involves an assessment of the last five measurement time spans, the variable
NOISE tran
represents the transient noise measured by the electric field sensor 202 as
the fibre moves
past the sensor 200. As will be apparent, the number of slots involved in this
calculation
can be varied as the volatility of the data requires.
28
CA 02899102 2015-07-31
At step 815, the sensor monitor 300 compares the value of the NOISEõ-an
variable against
a threshold minimum transient noise. If the NOISEtran variable exceeds the
threshold
minimum transient noise, at step 816 the algorithm considers a fibre to be
present at the
sensor 200, and sets the thread presence flag 364 accordingly. The sensor
monitor 300
then begins to check for a break in the fibre, at step 826.
In parallel with steps 808 to 816, the sensor monitor 300 uses a measurement
of the
steady state fibre noise to detect the presence of a fibre at the sensor 200.
According to
this parallel process, the sensor monitor 300 calculates the sum of the
absolute values of
the changes in the average current amplitude values over the entire fifty
measurement
time spans of the noise monitor 314, and assigns this value to the variable
NOISEstõdy at
step 817. Since this calculation involves an assessment of the entire noise
monitor 314,
the variable NOISEsteady represents the steady state noise measured by the
electric field
sensor 202 as the fibre moves past the sensor 200.
At step 818, the sensor monitor 300 compares the value of the NOISEsteady
variable
against a threshold minimum steady state noise. If the NOISEsteady variable
exceeds the
threshold minimum steady state noise, at step 819 the algorithm considers a
fibre to be
present at the sensor 200, and sets the thread presence flag 364 accordingly.
The sensor
monitor 300 then begins to check for a break in the fibre, at step 826.
If the NOISE tran variable does not exceed the threshold minimum transient
noise (eg. 20),
or if the difference (CURRENT ¨ BASE) is not greater than the threshold
minimum
difference, or if the NOISEsteady variable does not exceed the threshold
minimum steady
state noise, at step 820 the sensor monitor 300 calculates the sum of the node
counts over
the last three measurement time spans (as contained in slots 22, 23 and 24 of
the second
sliding window 312), and assigns this value to the variable NODE. As discussed
above,
the number of slots involved in this calculation need not be three, but can be
varied as the
volatility of the data requires.
29
CA 02899102 2015-07-31
At step 822, the sensor monitor 300 compares the value of the NODE variable
against a
threshold minimum count. If the NODE variable does not exceed the threshold
minimum
count (eg. 100), the algorithm considers a fibre to not be present at the
sensor 200, and
returns to step 800.
However, if the NODE variable exceeds the threshold minimum count, at step 824
the
algorithm considers a fibre to be present at the sensor 200, and sets the
thread presence
flag 364 accordingly. The sensor monitor 300 then begins to check for a break
in the
fibre, at step 826.
11. Thread Break Algorithm
To check for a break in the fibre, at step 826 the sensor monitor 300
calculates the mean
value of the average current amplitude over the last three measurement time
spans (as
contained in slots 22, 23 and 24 of the first sliding window 310), and assigns
this value to
the variable CURRENT. The sensor monitor 300 also calculates the mean value of
the
average current amplitude over the first three measurement time spans (as
contained in
slots 0, 1 and 2 of the first sliding window 310), and assigns this value to
the variable
BASE. As discussed above, the number of slots involved in these calculations
need not
be three, but can be varied as the volatility of the data requires. Also, the
time separation
between the CURRENT and BASE samples can be varied to take into account the
mechanical noise in the threadlines, such as by altering the size of the first
sliding
window 310.
At step 828, the sensor monitor 300 calculates the difference between the
value of the
CURRENT variable and the BASE variable, at step 828. If the difference
(CURRENT ¨
BASE) is less than a threshold minimum difference (eg. ¨300), at step 830 the
sensor
monitor 300 sets a MAG FLAG (thereby warning of a possible line break), and
increments a MAG counter; the algorithm then advances to step 834. Otherwise,
the
sensor monitor 300 clears the MAG FLAG, at step 832.
30
CA 02899102 2015-07-31
At step 834, the sensor monitor 300 calculates the sum of the node counts over
the last
three measurement time spans (as contained in slots 22, 23 and 24 of the
second sliding
window 312), and assigns this value to the variable NODE. As discussed above,
the
number of slots involved in this calculation need not be three, but can be
varied as the
volatility of the data requires.
At step 836, the sensor monitor 300 compares the value of the NODE variable
against a
threshold minimum count. If the NODE variable is less than the threshold
minimum
count (eg. 100), at step 838 the sensor monitor 300 sets a NODE FLAG (thereby
warning
of a possible line break), and increments a NODE counter; the algorithm then
advances to
step 842. Otherwise, at step 840, the sensor monitor 300 clears the NODE FLAG.
At step 842, the sensor monitor 300 determines whether the MAG FLAG is set. If
the
MAG FLAG is clear (ie there has been no significant drop in sensor current
magnitude),
at step 844 the sensor monitor 300 determines whether the MAG counter is
greater than
zero. If the MAG counter is greater than zero (ie the MAG FLAG was previously
triggered), the algorithm assumes there was only a temporary failure.
Accordingly, at
step 846 the sensor monitor 300 resets the MAG counter and the NODE counter,
and
clears the NODE FLAG and the NOISE FLAG. The algorithm then returns to step
826,
to continue monitoring for a break in the fibre.
Alternately, if the sensor monitor 300 determines at step 844 that the MAG
counter is not
greater than zero (ie the MAG FLAG was not previously triggered), at step 848
the
sensor monitor 300 determines whether the NODE FLAG is set. If the NODE FLAG
is
clear (ie there was no significant absence of interlacing nodes), at step 850
the sensor
monitor 300 determines whether the NODE counter is greater than zero. If the
NODE
counter is greater than zero (ie. the NODE FLAG was previously triggered), the
algorithm assumes that there was a temporary failure, such as a temporary
interlace jet
failure. Accordingly, at step 852 the sensor monitor 300 resets the NODE
counter and
clears the NOISE FLAG. The algorithm then returns to step 826, to continue
monitoring
for a break in the fibre. However, if the NODE counter is not greater than
zero (ie. the
31
CA 02899102 2015-07-31
NODE FLAG was not previously triggered), the algorithm returns to step 826
without
clearing the NOISE FLAG or resetting the NODE counter.
If, at step 848, the sensor monitor 300 determines that the NODE FLAG is set
(ie a
possible line break due to insufficient node count), at step 854 the sensor
monitor 300
determines whether the NODE counter is greater than a predetermined minimum
node
count value (eg. 35). If the NODE counter is greater than the minimum node
count
value, the algorithm assumes that the fibre is still present, since the MAG
FLAG has not
been set for the predetermined minimum node count value. Accordingly, at step
856 the
sensor monitor 300 clears the NODE FLAG and the NOISE FLAG, and resets the
NODE
counter. The algorithm then returns to step 826 to continue monitoring for a
break in the
fibre. However, if the NODE counter is not greater than the predeteimined
minimum
node count value, the algorithm returns to step 826 without clearing the NODE
FLAG or
the NOISE FLAG, or resetting the NODE counter.
On the other hand, if, at step 842, the sensor monitor 300 determines that the
MAG
FLAG is set (ie there has been a significant drop in sensor current
magnitude), at step 858
the sensor monitor 300 determines whether the NODE FLAG is set. If the NODE
FLAG
is clear (ie there was no significant absence of interlacing nodes), at step
860 the sensor
monitor 300 deteimines whether the MAG counter is greater than a predetermined
minimum current amplitude count value (eg. 35). If the MAG counter is greater
than the
minimum current amplitude count value, the algorithm assumes that the fibre is
still
present, since the NODE FLAG has not been set for the predetermined minimum
current
amplitude count value. Accordingly, at step 862 the sensor monitor 300 clears
the MAG
FLAG, the NODE FLAG and the NOISE FLAG, and resets the MAG counter and the
NODE counter. The algorithm then returns to step 826 to continue monitoring
for a
break in the fibre. However, if the MAG counter is not greater than the
minimum current
amplitude count value, the algorithm returns to step 826 without clearing the
MAG
FLAG, the NODE FLAG and the NOISE FLAG, or resetting the MAG counter and the
NODE counter.
32
CA 02899102 2015-07-31
Alternately, if the sensor monitor 300 determines at step 858 that the NODE
FLAG is set,
(ie there was a significant absence of interlacing nodes), at step 864 the
sensor monitor
300 calculates the sum of the absolute values of the changes in the average
current
amplitude values over the last five measurement time spans (from the values
contained in
slots 19, 20, 21, 22, 23 and 24 of the noise monitor 314), and assigns this
value to the
variable NOISEtran. As will be apparent, the number of slots involved in this
calculation
can be varied as the volatility of the data requires.
The sensor monitor 300 then compares the value of the NOISEtran variable
against a
threshold minimum noise, at step 866. If the NOISEtran variable is not less
than the
threshold minimum noise (eg. 20), the algorithm considers a fibre to still be
present at the
sensor 200 (but may be slowly breaking), and returns to step 826 to continue
monitoring
for a complete break in the fibre.
However, if the NOISEtran variable is less than the threshold minimum noise,
the
algorithm determines whether the NOISEtran variable was less than the
threshold
minimum noise in a previous iteration. Accordingly, at step 870, the sensor
monitor 300
determines whether the NOISE FLAG is set. If the NOISE FLAG is clear (ie there
was
no significant absence of transient noise in the preceding loop iteration), at
step 872 the
sensor monitor 300 sets the NOISE FLAG. The algorithm then returns to step 826
to
continue monitoring for a break in the fibre.
If the sensor monitor 300 determined at step 870 that the NOISE FLAG is set
(ie there
was a significant absence of transient noise in the preceding loop iteration),
the algorithm
assumes that the fibre has broken. Accordingly, at step 874, the sensor
monitor 300
clears the thread presence flag 364 to record the break in the fibre at the
sensor 200. The
sensor monitor 300 also clears the MAG FLAG, the NODE FLAG and the NOISE
FLAG, and resets the MAG counter and the NODE counter. The algorithm then
returns
to step 800.
33
CA 02899102 2015-07-31
In parallel with steps 826 to 872, the sensor monitor 300 uses a measurement
of the
steady state fibre noise to detect a break in the fibre at the sensor 200.
According to this
parallel process, the sensor monitor 300 calculates the sum of the absolute
values of the
changes in the average current amplitude values over the entire fifty
measurement time
spans of the noise monitor 314, and assigns this value to the variable
NOISEsteady at step
876.
At step 878, the sensor monitor 300 compares the value of the NOISEsteady
variable
against a threshold minimum steady state noise. If the NOISEsteady variable
does not
exceed the threshold minimum steady state noise, the algorithm considers the
fibre to
have broken. Accordingly, as above, at step 874 the sensor monitor 300 clears
the thread
presence flag 364 to record the break in the fibre at the sensor 200. The
algorithm then
returns to step 800.
12. Cross-Over Event Detection Algorithm
The cross-over event detection algorithm monitors the output of the electric
field sensors
202 on a number of different threadlines, each threadline carrying a multi-
filament fibre.
From a change in the amplitude of a current signal induced in the electric
field sensors as
each fibre is drawn past the respective electric field sensor, the algorithm
is able to detect
the presence of a filament from one of the threadlines in the fibre of another
one of the
threadlines, ie that one of more filaments from the fibre on one of the
threadlines has
jumped or crossed-over to the fibre on another one of the threadlines. The
cross-over
event detection algorithm will now be discussed in general terms, followed by
a more
detailed discussion with reference to Fig. 9. Although, in the following
example, the
sensor monitor 300 monitors the magnitude of the average fibre current for
each
threadline, the sensor monitor 300 may instead monitor the phase of the
average fibre
current, node count or node quality for each threadline.
The sensor monitor 300 maintains a sliding window for each threadline. Each
sliding
window comprises a series of measurements of the amplitude of the current for
the
associated threadline. The sliding window is a form of queue that provides a
snapshot of
34
CA 02899102 2015-07-31
the activity at each threadline over a predetermined period of time. Thus, the
insertion of
each new amplitude value into each sliding window causes the existing elements
in the
sliding window to be shifted down one slot, and the element contained in the
lowermost
slot to be lost. Alternately, a block of new amplitude values can be inserted
into the
sliding window, in which case the existing elements in the sliding window
would be
block shifted downwards.
The sensor monitor 300 calculates for each threadline the average magnitude of
the
current at the lagging part of the respective sliding window. The sensor
monitor 300 then
assigns each calculated average amplitude value to a respective variable BASE
(not the
same variable as described above with reference to the thread presence
algorithm) for
each threadline Thus, in a two threadline fibre production system (having
threadlines A
and B), the sensor monitor 300 assigns the calculated average current
amplitude for
threadline A to the variable BASEA, and the calculated average current
amplitude for
threadline B to the variable BASEB.
The sensor monitor 300 also calculates for each threadline the average
magnitude of the
current at the leading part of the respective sliding window. The sensor
monitor 300 then
assigns each of these latter calculated average amplitude values to a
respective variable
CURRENT (not the same variable as described above with reference to the thread
presence algorithm) for each threadline Thus, in a two threadline fibre
production system
(having threadlines A and B), the sensor monitor 300 assigns the average
current
amplitude for threadline A to the variable CURRENTA, and the average current
amplitude for threadline B to the variable CURRENTB.
A fibre is said to have crossed over from one threadline to the other
threadline (a cross-
over event) if, for example, the value of CURRENTA exceeds the value of BASEA,
and
the value of BASEB exceeds the value of CURRENTB. The cross-over event has
been
corrected (either self-corrected or manually corrected) if, subsequent to the
occurrence of
a cross-over event, the value of CURRENTA substantially returns to the value
of BASEA,
and the value of CURRENTB substantially returns to the value of BASEB. The
sensor
CA 02899102 2015-07-31
monitor 300 is configured to continuously update the value of the BASE
variables until a
cross-over event is detected. However, in order to identify when the cross-
over event has
been corrected, the sensor monitor 300 maintains the value of the BASE
variables (once a
cross-over event has been detected) until the value of the CURRENT variables
substantially returns to that of the BASE variables prior to the cross-over
event.
The sensor monitor 300 uses the HOLD BASE REFERENCE flag to maintain an
historical record of the BASE values that existed prior to the detection of a
cross-over
event of a line break event. This allows representation of the fiber
production process
under desired operating conditions to persist across these two events
scenarios. If the
HOLD BASE REFERENCE flag is clear (no cross-over event or line break has
occurred), the sensor monitor 300 updates the value of the BASE variables. If
the HOLD
BASE REFERENCE flag is set (a cross-over event or line break has occurred),
the sensor
monitor 300 retains a copy of the BASE variable values, until the cross-over
event or line
break has been corrected and/or until the String up of the process fiber is
successful.
Monitoring for cross-over events persists even while the HOLD BASE REFERENCE
flag is set.
Further details of this process will be described with reference to Fig. 9. As
discussed
above, the waveform of the current induced in the electric field sensor 202 as
the fibre is
drawn past the electric field sensor 202 consists of a series of peaks and a
series of
troughs. The sensor processing unit 204 monitors the current magnitude, and
detects the
peaks and the troughs in the induced current from the current measurements.
The sensor
monitor 300 receives data packets 250 from a number of the sensors 200. Each
data
packet 250 includes a series of current magnitude and phase measurements,
measured
over a predetermined measurement time span. In addition, each data packet 250
includes
a node count of the number of interlacing nodes encountered by the associated
electric
field sensor 202 within the measurement time span, and a measurement of the
node
quality of those nodes.
36
CA 02899102 2015-07-31
Accordingly, at step 900 the sensor monitor 300 identifies the local peak
current values
for each threadline from the magnitude measurements contained in each data
packet 250
(in accordance with steps 700 to 716), and then calculates for each threadline
the average
amplitude for the current over each measurement time span. The sensor monitor
300
then saves each amplitude value in the respective sliding window. Preferably,
each
sliding window has 2100 slots (slots 0 to 2099) for saving 2100 such amplitude
values.
However, the number of slots need not be 2100, but can be varied as the
volatility of the
data requires.
At step 902, the sensor monitor 300 calculates for each threadline the average
magnitude
of the current at the leading part of the respective sliding window.
Preferably, the sensor
monitor 300 considers the last 100 current amplitude values in each sliding
window.
Thus, the sensor monitor 300 adds the current amplitudes in slots 2000 to 2099
for each
threadline, and then divides each sum by the number of measurements (100). The
sensor
monitor 300 then assigns each of these latter calculated average amplitude
values to the
respective variable CURRENT for each threadline Thus, in a two threadline
fibre
production system (having threadlines A and B), the sensor monitor 300 assigns
the
average current amplitude for threadline A (calculated from slots 2000 to
2099) to the
variable CURRENTA, and the average current amplitude for threadline B
(calculated
from slots 2000 to 2099) to the variable CURRENTB.
At step 904, the sensor monitor 300 calculates the change in amplitude of the
average
current amplitude values for each threadline, at step 908, and assigns each
calculated
change value to a respective variable A. Thus, in a two threadline fibre
production
system (having threadlines A and B), the sensor monitor 300 calculates the
difference
between CURRENTA and BASEA, and assigns that value to the variable AA; and
calculates the difference between CURRENTB and BASEB, and assigns that value
to the
variable AB.
At step 906, the sensor monitor 300 inserts in the cross-over event field 370
of the data
record 350 the calculated change values (eg. AA, AB) for each threadline,
together with the
37
CA 02899102 2015-07-31
sensor address of the sensor associated with each change value. The computer
server 400
uses the change values included with the data record 350 to indicate to the
operator of the
computer server 400 the presence of a cross-over event, and the threadlines
involved in
the cross-over event.
At step 908, the sensor monitor 300 calculates for each threadline the average
magnitude
of the current at the leading part of the respective sliding window.
Preferably, the sensor
monitor 300 considers the first 200 current amplitude values in each sliding
window.
Thus, the sensor monitor 300 adds the current amplitudes in slots 0 to 199 for
each
threadline, and then divides each sum by the number of measurements (200). The
sensor
monitor 300 then assigns each new calculated average amplitude value to a new
respective variable NEWBASE for each threadline Thus, in a two threadline
fibre
production system (having threadlines A and B), the sensor monitor 300 assigns
the new
calculated average current amplitude for threadline A (calculated from slots 0
to 199) to
the variable NEWBASEA, and the new calculated average current amplitude for
threadline B (calculated from slots 0 to 199) to the variable NEWBASEB.
At step 910, the sensor monitor 300 focuses on the direction of the calculated
change
values (eg. AA, AB) for each threadline. This step is referred to as a "self-
term or in-line
check". If the calculated change value for one of the threadlines is positive
and the
calculated change value for another one of the threadlines is negative, the
algorithm
assumes that a filament from the fibre on the threadline having the negative
change value
has jumped or crossed over to the fibre on the threadline having the positive
change
value. Accordingly, at step 912, the sensor monitor 300 sets the HOLD BASE
REFERENCE flag, thereby indicating that the BASE variables should be saved
until the
cross-over event has been corrected.
At step 914, the sensor monitor 300 determines whether the HOLD BASE REFERENCE
flag was set. If the HOLD BASE REFERENCE flag was not set, for each threadline
the
sensor monitor 300 assigns the value of the variable NEWBASE to the
corresponding
variable BASE, at step 916. The algorithm then returns to step 900.
38
CA 02899102 2015-07-31
However, if the HOLD BASE REFERENCE flag was set, the algorithm determines
whether the cross-over event or line break has been corrected. Thus, for each
threadline,
the sensor monitor 300 compares the value of each NEWBASE variable against the
value
of the corresponding BASE variable, at step 918. If the absolute value of the
difference
between each variable pair is not greater than a predetermined threshold
amount, the
algorithm assumes the cross-over event or line break has been corrected.
Accordingly, at
step 920 the sensor monitor 300 clears the HOLD BASE REFERENCE flag, and for
each
threadline assigns the value of the variable NEWBASE to the corresponding
variable
BASE. The algorithm then returns to step 900.
If the sensor monitor 300 determines at step 918 that the absolute value of
the difference
between the value of any NEWBASE variable and the value of the corresponding
BASE
variable is greater than the threshold amount, the cross-over event or line
break may have
been manually corrected. However, the difference in temperature of the sensors
200 on
the threadlines where the cross-over event or line break occurred between the
instant the
cross-over event or line break occurred and the instant the cross-over event
or line break
was corrected may have prevented the value of the NEWBASE variable from being
within tolerance of the BASE variable (at step 918). Alternately, the electric
field sensors
202 on the threadlines where the cross-over event or line break occurred may
have been
cleaned between the instant the cross-over event or line break occurred and
the instant the
cross-over event or line break was corrected, thereby preventing the value of
the
NEWBASE variable from being within tolerance of the BASE variable (at step
918).
Accordingly, to determine whether the cross-over event or line break has been
manually
corrected, at step 922 for each pair of threadlines the sensor monitor 300
calculates the
difference in values of the BASE variables, and the difference in values of
the
CURRENT variables, and assigns each calculated difference to a respective
variable E.
Thus, in a two threadline fibre production system (having threadlines A and
B), the
sensor monitor 300 calculates the difference between BASEA and BASEB, and
assigns
39
CA 02899102 2015-07-31
that value to the variable El; and calculates the difference between CURRENTA
and
CURRENTB, and assigns that value to the variable c2.
Then, at step 924, the sensor monitor 300 compares, for each threadline pair,
the value of
each BASE difference (eg. El) against the value of each CURRENT difference
(E,). This
step is referred to as a "cross-term check". If the difference between the two
differences
(eg. El ¨ E2) is greater than a predetermined threshold amount, the algorithm
assumes the
cross-over event or line break has not been manually corrected. Accordingly,
the
algorithm returns to step 900. However, if the difference calculated at step
924 is not
greater than a predetermined threshold amount, the algorithm assumes the cross-
over
event or line break has been manually corrected. Accordingly, at step 926 the
sensor
monitor 300 clears the HOLD BASE REFERENCE flag, and for each threadline
assigns
the value of the variable NEWBASE to the corresponding variable BASE. The
algorithm
then returns to step 900.
The present invention is defined by the claims appended hereto, with the
foregoing
description providing a preferred embodiment of the invention. Those of
ordinary skill
may envisage certain modifications to the preferred embodiment which, although
not
explicitly suggested herein, do not depart from the scope of the invention, as
defined by
the appended claims.