Note: Descriptions are shown in the official language in which they were submitted.
CA 02906362 2015-09-14
WO 2014/164354 PCT/US2014/022062
ANISOTROPY ANALYSIS USING DIRECT AND REFLECTED
ARRIVALS IN SEISMIC SURVEY DATA
CROSS-REFERENCE TO RELATED APPLICATIONS
This application claims priority to U.S. Provisional Application No.
61/807,567,
entitled "Optimizing VSP Anisotropy Surveys With Reflection Data," filed April
2, 2013,
and incorporated herein by reference as is in its entirety.
BACKGROUND
Subsurface explorationists often employ seismic surveys to analyze subsurface
structures. One particular type of seismic survey, Vertical Seismic Profiling
(VSP), combines
the use of downhole seismic sensors with seismic sources on the surface.
Often, the downhole
seismic sensors are multi-component sensors spaced along a borehole to form a
subsurface
sensing array. The array may, in some cases, extend the entire length of the
borehole, though
it is more common to have the array limited to the region of interest and the
vicinity thereof.
(The sensors in this region generally exhibit the highest sensitivity to the
desired formation
parameters.)
The structure of the subsurface is commonly characterized as a series of
substantially
horizontal layers. This characterization is not a requirement, but it is a
useful starting point
for an initial velocity model. The initial velocity model, often derived from
independent
sources (e.g., experience, borehole logs, educated guesswork) or extracted
from the data
using classical methods, is iteratively refined until it converges on a useful
representation of
the actual subsurface structure. This refining is often done by comparing the
measured
seismic wave arrival
times with those predicted using the velocity model, and adapting the model in
ways that
gradually reduce any mismatches. It is common to consider not only the
mismatches in first
arrival times of seismic waves (so-called "direct arrivals" because they have
taken the most
direct path), but also the mismatches in later arrivals which result from
seismic waves taking
more indirect routes, e.g., by reflecting from acoustic impedance mismatches
between strata
(formation layers).
To reduce the complexity of the solution process, the velocity model can, in
some
cases, be constrained. For example, the horizontal strata model assumption may
be enforced,
- 1 -
CA 02906362 2015-09-14
WO 2014/164354 PCT/US2014/022062
or the model may only be permitted to vary in the two-dimensional plane of the
(inclined or
deviated) borehole. Further, the velocity model may in some cases be limited
to a fully
isotropic velocity within each layer, though in the present disclosure the
velocity of each
layer is permitted to be anisotropic (transverse isotropy with a vertical
symmetry axis).
With the foregoing context, traditional VSP surveys may fail to fully exploit
the
anisotropy information that can be derived from reflected arrivals. Efforts to
improve the
accuracy and efficiency of VSP surveys are ongoing.
BRIEF DESCRIPTION OF THE DRAWINGS
Accordingly, there are disclosed herein techniques that invert direct and
reflected
arrivals in seismic survey data simultaneously to determine anisotropy
parameters for at least
one layer a vertical transversely isotropic (VTI) model. In the drawings:
FIG. 1 shows an illustrative seismic survey environment.
FIG. 2 shows a chart with illustrative direct arrival data using different
offsets.
FIG. 3 shows a chart with illustrative reflected arrival data using different
offsets.
FIG. 4 shows a chart with illustrative direct and reflected arrival angles as
a function
of shot offset.
FIG. 5 shows a chart with illustrative traveltime sensitivity data as a
function of shot
offset.
FIG. 6 shows an illustrative flowchart of a seismic data analysis process.
FIG. 7 shows an illustrative seismic survey recording system.
FIG. 8 shows illustrative seismic signals.
FIG. 9 shows an illustrative data volume.
FIG. 10 shows an illustrative computer system for performing seismic data
processing.
FIG. 11 shows an illustrative seismic data analysis method.
It should be understood, however, that the specific embodiments given in the
drawings and detailed description below do not limit the disclosure. On the
contrary, they
provide the foundation for one of ordinary skill to discern the alternative
forms, equivalents,
and other modifications that are encompassed in the scope of the appended
claims.
DETAILED DESCRIPTION
Disclosed embodiments are directed to seismic data analysis systems and
methods,
where seismic receivers collect seismic survey data, including direct and
reflected arrival data
- 2 -
CA 02906362 2015-09-14
WO 2014/164354
PCT/US2014/022062
corresponding to shots from at least one source at different offsets. In at
least some
embodiments, an inversion is performed using the collected direct and
reflected arrival data
simultaneously to determine anisotropy parameters, including Thomsen
parameters epsilon
(g) and delta (6), for at least one layer of a vertical transversely isotropic
(VTI) model.
As described herein, reflected arrivals substantially increase traveltime
sensitivity and
provide supplemental data to the incidence angle range offered by the direct
arrivals from a
seismic source at a given shot location to a receiver. When reflected arrivals
are taken into
account, it becomes possible to improve survey efficiency by choosing a
geometry with fewer
= shot locations that nevertheless offers data acquisition with the desired
resolution and
accuracy. Further, reflected arrivals have higher sensitivity to one or more
anisotropy
parameters of interest. Accordingly, the disclosed technique processes both
direct arrival and
reflected arrival data to determine a depth profile of anisotropic parameters.
Simultaneous
inversion of direct arrival data and reflected arrival data can provide better
resolution for one
or more of the anisotropy parameters than the direct arrivals alone.
More specifically, the traveltime sensitivity of Thomsen parameters 6 and 6
varies as a
function of incidence (or phase) angles. In the mid-angle range, traveltime is
more sensitive
to parameter 6, whereas in the near-horizontal incidence angle region,
traveltime is more
sensitive to parameter g. If the two parameters are similar in magnitude, can
be much more
influential than 5 and thus can be better resolved. Because the two Thomsen
parameters have
different influence ranges, surveying the key angle (or offset) range ensures
better resolution
of the parameters. If a full range of data is collected, proper weighting in
the disclosed
anisotropy analysis may reduce uncertainty in the estimation. Alternatively,
the disclosed
anisotropy analysis can be divided into two steps using long offsets for c
estimation and mid
offsets for 6 while & retains the estimated value.
Layer thickness tests indicate that the uncertainty of anisotropy parameters
increases
as layers become thinner and that the traveltime change resulting from
anisotropy becomes
comparable to other errors. Accordingly, adding reflected arrival data to the
anisotropy
analysis as described herein can help constrain the anisotropy estimation
because reflected
arrival data has increased traveltime sensitivity. The reflected arrival data
can extend or fill in
gaps in the vertical angle range covered by the direct arrivals.
In accordance with at least some embodiments, pre-survey modeling identifies
the
maximum shot offset and key angle (or shot offset) range for the anisotropic
parameters.
Resolution and uncertainty of the anisotropy estimation depends on the
selection of shot
offset range, layer thickness, magnitude of anisotropy, and wave mode. Using
reflected
- 3 -
CA 02906362 2015-09-14
WO 2014/164354 PCMJS2014/022062
arrival data in conjunction with direct arrival traveltimes can reduce the
uncertainty in
anisotropy estimation, particularly for interval parameters in a layered
medium.
The disclosed systems and methods are best understood when described in an
illustrative usage context. Accordingly, FIG. 1 shows one illustrative seismic
survey
environment, in which seismic receivers 102 are in a spaced-apart arrangement
within a
borehole 103 to detect seismic waves. As shown, the receivers 102 may be fixed
in place by
anchors 104 to facilitate sensing seismic waves. The environment of Fig. 1 is
just one
illustrative example. In different embodiments, the receivers 102 may be part
of a logging-
while-drilling (LWD) tool string or wireline logging tool string. Further, the
receivers 102
1.0 communicate wirelessly or via cable to a data acquisition unit 106 at
the surface 105, where
the data acquisition unit 106 receives, processes, and stores seismic signal
data collected by
the receivers 102. Surveyors trigger a seismic energy source 108 (e.g., a
vibrator truck) at one
or more positions to generate seismic energy waves that propagate through the
earth 110.
Such waves refract through and reflect from acoustic impedance discontinuities
to reach the
receivers 102, which digitize and record the received seismic signals. The
receivers 102
concurrently or in turn communicate their respective seismic signal data to
the data
acquisition unit 106, which stores the collected seismic signal data for later
analysis to
identify. Illustrative discontinuities include faults, boundaries between
formation beds, and
boundaries between formation fluids. The discontinuities may appear as bright
spots in the
subsurface structure representation that is derived from the seismic signal
data.
The illustrative subsurface model of FIG. 1 includes three relatively flat
formation
layers and two dipping formation layers of varying composition and hence
varying speeds of
seismic waves. Within each formation, the speed of seismic waves can be
isotropic (i.e., the
same in every direction) or anisotropic. Due to the layered structure of
sedimentary rocks
transverse isotropy is common in anisotropic formations. In other words the
speed of seismic
waves in anisotropic formations is the same in every "horizontal" direction,
but is different
for seismic waves traveling in the "vertical" direction. Note, however, that
geologic activity
can change formation orientations, turning a VTI formation into a tilted
transversely isotropic
(TTI) formation. In FIG. 1, the third flat layer is VTI, while the first
dipping formation layer
is TTI. In at least some embodiments, the disclosed anisotropy analysis
technique determines
anisotropy parameters for a VTI model.
The survey configuration of FIG. 1 corresponds to a vertical seismic profiling
(VSP)
survey configuration, where positions for surface source(s) and downhole
receivers (e.g., as
shown in example environment of FIG. 1) are used to interpret the collected
seismic survey
- 4 -
CA 02906362 2015-09-14
WO 2014/164354 PCIMS2014/022062
data. In alternative embodiments, a reverse VSP (RVSP) survey configuration
may be
employed, where positions for downhole source(s) and surface receivers are
used to interpret
the collected seismic survey data. Additionally or alternatively, VSP survey
configurations,
RVSP survey configurations, and/or cross-well survey configurations may be
employed,
where positions for downhole source(s) and downhole receivers are used to
interpret
collected seismic survey data. It should be appreciated that downhole
source(s) may be above
downhole receivers and/or below downhole receivers. Further, downhole
source(s) and
downhole receivers may be positioned in one borehole and/or in different
boreholes.
FIG. 2 shows a chart 120 with illustrative ray paths representing direct
arrival data
from different shot offsets. In chart 120, five horizontal layers (labeled 1-
5) arc represented as
well as direct arrival signals from 18 different shot offsets (e.g., a set of
walkaway shots).
FIG. 3 shows a chart 130 with illustrative ray paths representing reflected
arrival data using
the same offsets. In chart 130 of FIG. 3, the same five horizontal layers
(labeled 1-5) shown
in FIG. 2 are again represented as well as reflected arrival signals from 18
different shot
offsets. Three of the direct arrival signals in chart 120 and three of the
reflected arrival
signals in chart 130 are bolded and are associated with a zero shot offset, a
mid shot offset,
and a far shot offset. In at least some embodiments, the zero shot offset, the
mid shot offset,
and the far shot offset correspond to a predetermined reduced shot
configuration that provides
arrival signals with sensitivity to the anisotropy parameters. Such
sensitivity to the anisotropy
parameters can be obtained with relatively few shots (e.g., 2 to 4 shots) if
the arrival angles
corresponding to the shots are sufficiently varied and include at least one
wide arrival angle
(e.g., 60 degrees or more). While the predetermined reduced shot configuration
of charts 120
and 130 correspond to three shots at particular shot positions, it should be
understood that the
number of shots in a reduced shot configuration and/or their positions may
vary. Further,
charts 120 and 130 only illustrate direct arrival data and reflected arrival
data for layer 5.
Similar direct arrival data and reflected arrival data may be collected and/or
plotted for each
of the other illustrated layers in charts 120, 130 and/or other layers of a
formation. It should
be noted that while charts 120 and 130 correspond to a seismic survey
configuration with
surface source(s) and downhole receivers, other survey configurations are
possible.
FIG. 4 shows a chart 140 with illustrative direct and reflected arrival angle
data
(direct arrival angle data is represented as circles while the reflected
arrival angle data is
represented as triangles) as a function of shot offset. The arrival angles are
measured from the
vertical axis, though direct arrivals are measured relative to the upward
direction and
reflected arrivals are measured relative to the downward direction. The direct
and reflected
- 5 -
CA 02906362 2015-09-14
WO 2014/164354 PCT/US2014/022062
arrival angles shown in chart 140 correspond to signal arrivals for layer 5 in
response to the
shot offsets represented in charts 120 and 130. As shown, both the direct and
reflected arrival
angles for layer 5 increase as the shot offset increases. Similar direct and
reflected arrival
angle data may be collected and/or plotted for each of the layers 1-5
illustrated in charts 120,
130 and/or other layers of a formation.
FIG. 5 shows a chart 150 with illustrative traveltime sensitivity data as a
function of
shot offset. The direct and reflected arrival traveltimes shown in chart 150
correspond to
signal arrivals for layer 5 in response to the shot offsets represented in
charts 120 and 130. In
FIG. 5, traveltime sensitivities related to Thomsen parameters 6 and c are
represented. More
1.0 specifically, direct arrival traveltime sensitivities related to 8 are
represented as diamonds,
reflected arrival traveltime sensitivities related to 6 are represented as
triangles, direct arrival
traveltime sensitivities related to c are represented as circles, and
reflected arrival traveltime
sensitivities related to 6 are represented as squares. As shown, c is more
influential to far shot
offsets than 6. Also, c is more influential to reflected arrivals than direct
arrivals. Similar
traveltime sensitivity data may be collected and/or plotted for each of the
layers 1-5
illustrated in charts 120, 130 and/or other layers of a formation. The
traveltime sensitivity for
each anisotropic parameter is calculated numerically from a partial derivative
of an
anisotropic traveltime equation with respect to the anisotropic parameter at
every phase angle
or offset.
FIG. 6 shows an illustrative flowchart of a seismic data analysis process 200.
In
process 200, data processing step 202 includes known seismic survey geometry
operations,
trace editing and stacking operations, direct and vertical rotation
operations, arrival time re-
pick operations, and quality control (QC) time pick and vertical angle
operations. At least
some of the results of the data processing step 202 are provided to anisotropy
analysis block
206. The anisotropy analysis block 206 also receives as input a layered
vertical velocity
model 204. At block 206, various operations are performed to determine
anisotropy
parameters for each of a plurality of layers. In at least some embodiments,
layer-based
average anisotropy parameters are determined using a layer-stripping scheme.
For each layer,
an anisotropic effect is checked. For example, in at least some embodiments,
the anisotropy
effect may be checked by analyzing the traveltime contribution of each layer
for evidence of
anisotropy (e.g., by determining velocities associated with the contributions
and searching for
a dependence on incidence angle). If a layer is determined to be isotropic,
the later steps to
determine the anisotropy parameters may be omitted. Meanwhile, if evidence of
anisotropy
exists, angle coverage and traveltime sensitivity data is plotted for direct
arrivals and
- 6 -
CA 02906362 2015-09-14
WO 2014/164354 PCT/US2014/022062
reflected arrivals. For example, in at least some embodiments, traveltime
sensitivity is plotted
as a function of incidence angle and a weighting function is derived for the
covered incidence
angles. For example, in at least some embodiments, the weighting function is a
series of
positive scalers for individual data points, which are proportional to the
sensitivity function
and applied to the traveltime misfit function, to increase the influence of
data with higher
sensitivity in the inversion. Further, an inversion is performed to calculate
best-fit anisotropy
parameters using direct arrival traveltimes and reflected arrival traveltimes.
In at least some embodiments, the layer-stripping scheme of block 206 assumes
that
the anisotropy throughout each layer is constant. For a VSP survey
configuration, layer-
stripping may involve working downward from the top layer and treating the
velocity
information for the layers above the given layer as fixed, such that the
contribution of the
given layer to the traveltimes for direct arrivals to receivers in the given
layer are determined.
Further, reflections from the bottom of the given layer to the receivers in
and above the given
layer are determined. For RVSP or cross-well survey configurations, the order
of layer-
stripping operations would vary depending on the position of the source(s)
relative to the
receivers.
With the weighting function and angular dependence of the traveltimes, an
inversion
is performed to calculate the best-fit anisotropy parameters for the given
layer. This inversion
simultaneously accounts for the traveltime dependence of both direct arrivals
and reflected
arrivals on anisotropy. The inversion can employ any suitable inversion
technique, including
generalized inverse, and a grid search scheme. Once the inversion yields the
parameters for
the current layer, the offset and traveltime information for the next layer
are adjusted
accordingly. The process is repeated until the velocity model has been refined
for all layers
above and including the lowermost layer of interest. The velocity model
resulting from the
layer stripping-scheme may then be treated as an initial velocity model for a
global inversion
that constrains the anisotropy parameter values. In at least some embodiments,
a tomographic
ray-tracing inversion technique is then used to determine a globally optimal
velocity model.
The anisotropy parameters determined at block 206 are used to determine an
anisotropy depth
profile at block 208.
FIG. 7 shows an illustrative seismic survey recording system having receivers
102
(see e.g., FIG. 1) coupled to a bus 402 to communicate digital signals to data
recording
circuitry 406. Position information sensors 404 (and optionally sensors for
other parameters)
are also coupled to the data recording circuitry 406 to enable the data
recording circuitry to
store additional information useful for interpreting the recorded data. For
example, such
- 7 -
CA 02906362 2015-09-14
WO 2014/164354 PCT/US2014/022062
additional information can include source waveform characteristics,
digitization settings,
detected faults in the system, etc.
Recording circuitry 406 stores the high speed data stream(s) from receivers
102 to a
nonvolatile storage medium such as a storage array of optical or magnetic
disks. The data is
stored in the form of (possibly compressed) seismic traces, each trace being
the signal
detected and sampled by a given receiver in response to a given shot. The
associated shot and
receiver positions are also stored. Illustrative seismic signals are shown in
FIG. 8. The signals
indicate some measure of seismic wave energy as a function of time (e.g.,
displacement,
velocity, acceleration, pressure), and they are digitized at high resolution
(e.g., 16 to 32 bits)
at a programmable sampling rate (e.g., 400 to 1000 Hz) for a fixed duration
after each shot
(e.g., 30 seconds). Such signals can be grouped in different ways, and when so
grouped, they
are called a "gather". For example, a "receiver gather" is the group of traces
that are acquired
by a given receiver. A "shot gather" is the group of traces recorded for a
single firing of the
seismic source.
A general purpose data processing system 408 receives the acquired seismic
survey
data from the data recording circuitry 406. In some cases the general purpose
data processing
system 408 is physically coupled to the data recording circuitry and provides
a way to
configure the recording circuitry and perform preliminary processing in the
field. More
typically, however, the general purpose data processing system is located at a
central
computing facility with adequate computing resources for intensive processing.
The survey
data can be transported to the central facility on physical media or
communicated via a
computer network. In at least some embodiments, the processing system 408
includes a user
interface having a graphical display and a keyboard or other method of
accepting user input
and/or enabling users to view and analyze the subsurface structure images
derived from
collected seismic survey data.
The recorded seismic survey data is of little use when maintained in the
format of Fig.
7. Although it is possible to plot the various recorded waveforms side by side
in a plot that
reveals large scale subsurface structures, such structures are distorted and
finer structures
cannot even be seen. Hence the data is processed to create a data volume 502,
i.e., a three
dimensional array of data values such as that shown in FIG. 9. The data volume
502
represents some seismic attribute throughout the survey region. In some
embodiments, the
data volume 502 comprises uniformly-sized cells, each cell having a data value
representing
the seismic attribute for that cell. Various seismic attributes may be
represented, and in some
embodiments, each cell has multiple data values to represent multiple seismic
attributes.
- 8 -
CA 02906362 2015-09-14
WO 2014/164354 PCT/US2014/022062
Examples of suitable seismic attributes include reflectivity, acoustic
impedance, acoustic
velocity, anisotropy parameters, and density. The volumetric data format
readily lends itself
to computational analysis and visual rendering, and for this reason, the data
volume of FIG. 9
may be termed a "three-dimensional image" of the survey region.
Fig. 10 shows an illustrative computer system 600 for performing an inversion
using
collected direct and reflected arrival data to simultaneously determine
anisotropy parameters
for at least one layer a vertical transversely isotropic (VTI) model as
described herein. In
computer system 600, a personal workstation 602 is coupled via a local area
network (LAN)
604 to one or more multi-processor computers 606, which are in turn coupled
via the LAN to
one or more shared storage units 608. Personal workstation 602 serves as a
user interface to
the processing system, enabling a user to load survey data into the system, to
retrieve and
view image data from the system, and to configure and monitor the operation of
the
processing system. Personal workstation 602 may take the form of a desktop
computer with a
graphical display that graphically shows survey data and images of the survey
region, and
with a keyboard that enables the user to move files and execute processing
software.
LAN 604 provides high-speed communication between multi-processor computers
606 and with personal workstation 602. The LAN 604 may take the form of an
Ethernet
network. Meanwhile, multi-processor computer(s) 606 provide parallel
processing capability
to enable suitably prompt conversion of seismic trace signals into a survey
region image.
Each computer 606 includes multiple processors 612, distributed memory 614, an
internal
bus 616, and a LAN interface 620. Each processor 612 operates on an allocated
portion of the
input data to produce a partial image of the seismic survey region. Associated
with each
processor 612 is a distributed memory module 614 that stores conversion
software and a
working data set for the processor's usc. Internal bus 616 provides inter-
processor
communication and communication to the LAN networks via interface 620.
Communication
between processors in different computers 606 can be provided by LAN 604.
Shared storage units 608 may be large, stand-alone information storage units
that
employ magnetic disk media for nonvolatile data storage. To improve data
access speed and
reliability, the shared storage units 608 may be configured as a redundant
disk array. Shared
storage units 608 initially store a velocity data volume and shot gathers from
a seismic
survey. The illumination matrix values and/or reflectivity image volumes can
be stored on
shared storage units 608 for later processing. In response to a request from
the workstation
602, the image volume data can be retrieved by computers 606 and supplied to
workstation
for conversion to a graphical image to be displayed to a user.
- 9 -
CA 02906362 2015-09-14
WO 2014/164354 PCT/US2014/022062
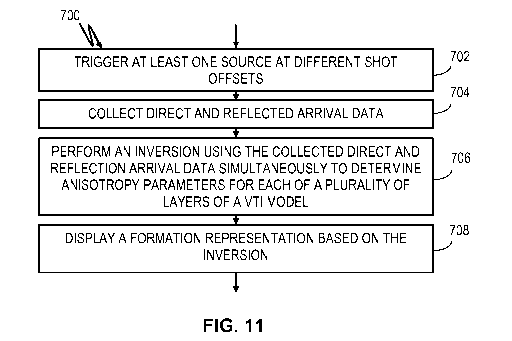
FIG. 11 shows an illustrative seismic analysis method 700. The method 700 may
be
performed at least in part by a computer system such as systems 408, and/or
600 described
herein. In method 700, at least one source is triggered at different offsets
(block 702). At
block 704, direct and reflected arrival data for a seismic survey
configuration is collected in
response to the shots performed at block 702. As an example the direct and
reflected arrival
data may be collected by a plurality of downhole seismic receivers in response
to shots from
one or more seismic sources at earth's surface. Alternatively, the direct and
reflected arrival
data may be collected by a plurality of seismic receivers positioned at
earth's surface in
response to shots from one or more downhole seismic sources. Alternatively,
the direct and
reflected arrival data may be collected by a plurality of downhole seismic
receivers in
response to shots from one or more downhole seismic sources. At block 706, an
inversion is
performed using the collected direct and reflected arrival data simultaneously
to determine
anisotropy parameters for each of a plurality of layers of a VTI model.
The inversion process of claim 706 may include various operations as described
herein. In at least some embodiments, the inversion process includes
determining average
anisotropy parameters for each of a plurality of layers of the VTI model from
top to bottom in
a layer-stripping fashion. For each layer, the collected direct and reflected
arrival data may be
compared with modeled direct and reflected arrival data to determine an
anisotropic effect
before performing the inversion. Further, for each layer, angle coverage and
traveltime
sensitivities for the collected direct and reflected arrival data may be
plotted, and a weighting
function may be selected based on the plotted angle coverage and traveltime
sensitivities. In
at least some embodiments, the inversion process of step 706 includes
performing a
generalized inverse or a grid search scheme based on the weighting function
and angular
dependence of traveltimes. Further, a global optimization or generalized
inversion may be
employed to simultaneously constrain the anisotropy parameters for each of the
plurality of
layers of a VTI model.
At block 708, a representation of a formation is displayed based on the
inversion. For
example, in at least some embodiments, the inversion process of block 706
outputs a layer-
based anisotropy profile as a function of depth. Table 1 shows an example
anisotropy profile
as a function of depth.
- 10 -
CA 02906362 2015-09-14
WO 2014/164354 PCT/US2014/022062
Table 1
Layer (#) 6 (%) c (%) Vp (ft/s)
1 0 0 10,000
2 5 10 12,000
3 5 15 12,500
4 0 0 13,500
5 18 12,500
Additionally or alternatively, the anisotropy profile output from the
inversion process may
provide uncertainty or error estimates; a number of iterations used; a
comparison of
5 anisotropy parameters resulting from inversion of direct arrival data,
reflected arrival data,
and/or both; a comparison of simulated versus measured anisotropy parameters;
shot offset
information; traveltime data; direct arrival angle data; reflected arrival
angle data and/or
related plots or charts.
In at least some embodiments, the method 700 may include additional or
alternative
steps. For example, the method 700 may additionally include limiting the
different shot
offsets to a zero shot offset, a mid shot offset, and a far shot offset
corresponding to
predetermined key angles with traveltime sensitivity related to at least one
of the anisotropy
parameters. Further, the method 700 may additionally include selecting
walkaway shot
offsets including the different shot offsets based on a predetermined set of
key angles with
traveltime sensitivity related to at least one of the anisotropy parameters.
Embodiments disclosed herein include:
A: A seismic data analysis system that comprises seismic receivers to collect
seismic
survey data, wherein the seismic survey data includes direct and reflected
arrival data in
response to at least one seismic source fired at different shot offsets,
memory that stores the
collected seismic survey data, and a processing unit that extracts traveltimes
for direct and
reflected arrivals from the seismic survey data and performs an inversion
using the direct and
reflected arrival traveltimes simultaneously to determine anisotropy
parameters, including
Thomsen parameters, epsilon (c) and delta (6), for at least one layer of a
vertical transversely
isotropic (VTI) model.
B: A method for seismic data analysis that comprises triggering at least one
seismic
source at different shot offsets, collecting direct and reflected arrival data
in response to said
triggering by a plurality of seismic receivers, performing an inversion using
the collected
- 11 -
CA 02906362 2015-09-14
WO 2014/164354 PCT/US2014/022062
direct and reflected arrival data simultaneously to determine anisotropy
parameters, including
Thomsen parameters, epsilon (z) and delta (6), for each of a plurality of
layers of a vertical
transversely isotropic (VTI) model, and displaying an anisotropy profile as a
function of
depth based on the inversion.
Each of the embodiments, A and B may have one or more of the following
additional
elements in any combination. Element 1: further comprising a user interface
that displays an
anisotropy profile as a function of depth based on the inversion. Element 2:
the different shot
offsets are limited to a zero shot offset, a mid shot offset, and a far shot
offset corresponding
to a predetermined set of key angles with traveltime sensitivity related to at
least one of the
anisotropy parameters. Element 3: the different shot offsets corresponds to
walkaway shot
offsets that include a predetermined set of key angles with traveltime
sensitivity related to at
least one of the anisotropy parameters. Element 4: the processing unit
performs the inversion
to determine average anisotropy parameters for each of a plurality of layers
of the VTI model.
Element 5: the processing unit performs the inversion for each of the
plurality of layers in a
layer-stripping fashion using direct arrival times and reflected arrival times
for each layer.
Element 6: the processing unit compares the collected direct and reflected
arrival data with
modeled direct and reflected arrival data to determine an anisotropic effect
before the
inversion is performed for each of said at least one layer. Element 7: the
processing unit plots
angle coverage and traveltime sensitivities for the collected direct and
reflected arrival data,
and selects a weighting function based on the plotted angle coverage and
traveltime
sensitivities. Element 8: the processing unit performs the inversion for each
of said at least
one layer based on the weighting function and angular dependence of
traveltimes. Element 9:
the inversion corresponds to a generalized inverse or a grid search scheme.
Element 10: the
processing unit simultaneously constrains the anisotropy parameters for each
of a plurality of
layers of the VTI model using a global optimization or generalized inversion.
Element 11: the
at least one seismic source is positioned at earth's surface and the seismic
receivers are
positioned downhole. Element 12: the at least one seismic source is positioned
downhole and
the seismic receivers are positioned at earth's surface. Element 13: the at
least one seismic
source and the seismic received are positioned downhole.
Element 14: further comprising limiting the different shot offsets to a zero
shot offset,
a mid shot offset, and a far shot offset corresponding to predetermined key
angles with
traveltime sensitivity related to at least one of the anisotropy parameters.
Element 15: further
comprising selecting walkaway shot offsets including the different shot
offsets based on a
predetermined set of key angles with traveltime sensitivity related to at
least one of the
- 12 -
CA 02906362 2015-09-14
WO 2014/164354 PCT/U52014/022062
anisotropy parameters. Element 16: performing the inversion comprises
determining average
anisotropy parameters for each of a plurality of layers of the VTI model from
in a layer-
stripping fashion. Element 17: further comprising positioning the at least one
seismic source
at earth's surface and positioning the plurality of seismic receivers
downhole. Element 18:
further comprising positioning the at least one seismic source downhole and
positioning the
plurality of seismic receivers at earth's surface. Element 19: further
comprising positioning
the at least one seismic source downhole and positioning the plurality of
seismic receivers
downhole. Element 20: the inversion corresponds to a generalized inverse or a
grid search
scheme based on a weighting function and angular dependence of traveltimes,
and wherein
1.0 the inversion outputs a layer-based anisotropy profile listed as a
function of depth. Element
21: further comprising simultaneously constraining the anisotropy parameters
for each of the
plurality of layers of the VTI model using a global optimization or
generalized inversion.
Numerous other variations and modifications will become apparent to those
skilled in
the art once the above disclosure is fully appreciated. It is intended that
the following claims
be interpreted to embrace all such variations and modifications where
applicable.
- 13 -