Note: Descriptions are shown in the official language in which they were submitted.
CA 02915066 2015-12-10
WO 2014/201348
PCT/US2014/042300
NON-TECHNICAL LOSSES IN A POWER DISTRIBUTION GRID
CROSS. .REFERENCE TO RELATED .A.PPLICATIONS
WO" This application claims the 'benefit of US. provisional patent
application No. 61./834567, filed, June 13, 2013, the .disclosure of which. is
incorporated herein. by reference in it entirety..
SUBSTITUTE SHEET (RULE 26)
CA 02915066 2015-12-10
WO 2014/201348 PCT/US2014/042300
FIELD OF THE INVENTION
(0001 The present invention is directed toward applications of on-grid
communications
for optimizing electrical diribution, and specifically for real-time
identification and
location of non-technical losses occurring in a service transformer area
network.
BACKGROUND OF THE INVENTION
100021 Electrical Distribution Substations contain one or more Substation
Transformers,
which step down the voltage from high transmission lint levels (typically 30kV
to
700kV) to the medium voltage levels (typically from 4141, to about 35kV) at
which power
is distributed to consumers within a distribution service area At the edge of
the
Distribution Grid are a number of Service Transformers õ which transform the
medium
voltage of the distribution grid to the low voltages On the US, typically 120,
208, 240,
277, or 480) required for commercial, industrial, and residential consumers.
Other
voltages.: in addition to some of these can be used elsewhere in the world.
Each Service
Transformer powers OM or more metered loads. A load can be a dwelling, a
commercial
or industrial building, an element of municipal infrastructure. such as a
series of street
lamps, or agricultural apparatus such as irrigation systems
(000310ther than the wires connecting a consumer load and the associated meter
to a
service transformer, the service transformer is the outermost element of the
distribution
grid before the power is actually delivered to a consumer. A meter is
typically attached
at the point where the power from the service .transformer is delivered to the
consumer.
Service transformers can be three-phaseõ dual-phase, or single phase, as can
meters.
Herein the collection of electrical apparatus inclusive from a service
transformer to the
collection of at least two communicating electrical meters is referred to as a
Transformer
Area Network (TAN). A TAN can have a radial topology, such as is common in the
US,
or it can have a linear or '-'bus" topology, as is more common in Europe and
elsewhere in
the world.
2
SUBSTITUTE SHEET (RULE 26)
CA 02915066 2015-12-10
WO 2014/201348 PCT/US2014/042300
[0004] Traditionally, reading meters was one of the largest operational costs
incurred by
electrical utilities. Original electric meters were analog devices with an
optical read-out
that had to be manually examined monthly to drive the utility billing process.
Beginning
in the 1970s, mechanisms tbr digitizing meter data and automating its
collection began to
be deployed. These. mechanisms evolved from walk-by or drive-by systems where
the
meter would broadcast its current reading using a s.hort-range radio signal,
which was
received by a device carried by the meter reader. These early systems were
known as
Automated Meter Reading systems or AMRs.. Latcr, a variety of purpose-built
data
collection networks, commonly employing a combination of short-range RI'
repeaters in
a mesh configuration with collection points equip* with broadband backhaul
means for
transporting aggregated readings began to be deployed,
(0006)These networks were capable of two-way communication between the
"metering
head-end" at a utility service center and the meters at the edge of this data
collection
network, which is generally called an Advanced Metering Infrastructure or NMI.
.AMIs
can collect and store readings frequently, typically as often as every 15
minutes, and can
report them nearly that often. They can read any meter on demand provided that
this
feature is used sparingly:, and can connect or disconnect any meter on demand
as well,
AM1 meters can pass signals to consumer device,s for the purpose of energy
conservation,
demand. management, and variable-rate bill ing Because the AM1 network is
separate
from the power distribution grid except for the intersection at the meters,
AMI meters are
neither aware of nor sensitive to changes in 'the grid topology or certain
conditions on the
grid. Nonetheless, the introduction of AM1 is generally considered to be the
beginning of
the distribution Smart GridõAdditionally, because of the mesh architecture
typically used
in the AMIs in the United States, the available bandwidth for an individual
electrical
meter to send its own data is quite limited.
[0006]The total billable kilowatt-hours produced by a typical electrical
distribution grid
anywhere in the world is substantially less than the actual power distributed,
as measured
at a distribution substation, over the billing period. The loss of power can
be classified
into MD groups. Technical losses result from the overall impedance of the
distribution
infrastructure, from power-factor mismatch between what the population of
loads
3
SUBSTITUTE SHEET (RULE 26)
CA 02915066 2015-12-10
WO 2014/201348 PCT/US2014/042300
requires and what the grid produces at each load point, and from the fact that
utilities
oversupply voltage to ensure that power sags will not occur during
unpredictable peak
loads,. Utilities can work to minimize these technical losses, but some
technical losses are
unavoidable.
[0007]Non-technical losses of actual power-hours (as opposed to revenue)
result from
power theft by consumers who avoid or subvert the metering process by
tampering with
meters or by tapping power lines above the metered load points. Norwechnical
revenue
losses also include non-payment of bills by customers, and accounting eITOM by
milities.
However, these types of revenue losses are addressed by Meter Data Management
systems integrated with the Advanced Metering Infrastructure. These automated
systems
have the capability to prevent clerical =ors, to immediately cut off service
to non-paying
customers and to require customers with poor payment histories to be on a pay-
in-
advance billing plan. Because AMIs provide little or no information about the
grid-
schematic relationship of one electrical meter to another and the relationship
between the
electrical meter and the service transformer supplying it with powers AMIs are
of little
value in pinpointing the source of power theft: Some Smart Meters can detect
and report
tampering, On the other hand, the absence of meter readers from neighborhoods
reduces
the chance that illegal taps will be seen and reported.
[00081The social and financial costs of power theft are highly variable. In
the
developing world, these costs are quite high sometimes exceeding 50% of power
delivered from substations, In India, for example, the major private utilities
(Reliance
and Tata) report non-technical !ones around 10%, but the state-owned utilities
have
losses exceeding 30% in most cases, according to the India's Maharashtra
Electricity
Regulation Commission (MERC).
[0009) In the developed world, losses from theft represent a relatively small
percentage
of the total generation cost. In the United States, losses from theft have
traditionally been
estimated at one to three percent or revenue, though this figate increases
during difficult
economic times.
E0010)Power theft represents a safety and quality-of-service issue as well as
an.
economic issue. Jury-rigging power taps is dangerous and often results in
injury and
even death. Additionally, the jury-rigged taps represent a fire hazard. Most
significantly,
4
SUBSTITUTE SHEET (RULE 26)
CA 02915066 2015-12-10
WO 2014/201348 PCT/US2014/042300
the resultant =predictable loading of the distribution grid can cause
transformer fires and
explosions that can result not only in dangerous situations but in major power
outages.
[00111:Prior art methods for detecting power theft can be divided into three
categories.
One category involves comparing voltage and current at a meter with voltage
and current
at a point of origin for delivery, such as the service distribution
transformer for a
neighborhood. The technical losses due to the resistance of the low voltage
line between
the point of origin and each meter are presumed to be less than a
predetermined amount,
so that any difference in power loss above the predetermined amount can be
presumed to
be due either to theft or to line defects. United States Patent Application
Publication No,
201210265355, titled fievsternirlst Metheed kr. $jpgleandlyhtitimr,w.
Optimizatfon of
Utiliw Services Delivery and Utilization
(incorporated herein by rekrence) describes a
system of this sort, wherein intelligent software agents at the service
transformer collect
measurements both at the transformer and from other instruments located at or
incorporated in the electric meters. Theft detection is cited as one of the
applications of
this systems However, systems involving placing agents and instruments at the
transfbrmer are less desirable than would be a system that did not require any
devices at
the transformer, because transformers are far less physically accessible than
meter
sockets, and modifying them by adding instrumentation inside the transformer
housing or
on the high-voltage side of the transformer can be costly and even dangerous.
00121A second category involves measuring current and voltage outside the
meter of a
metered load, and inside the premises of the metered load. if more power is
being used
on the premises than is being delivered via the meter, then either power is
being locally
generated on the premises, or the meter is being bypassed. Methods of this
sort are
problematic for utilities because a service utility typically does not have
access to data
from inside the metered load. The consumer would have, to agree to the
placement of
devices inside the premises.
100131A third category involves detecting the. instantaneous changes in power
usage or
minor outages caused by tampering with the distribution lines in order to
install an
=metered tap. This category of mechanism falls short because tampering can be
masked
by larger events such as a legitimate outage or interruption in service, and
because it
would create many false positives.
SUBSTITUTE SHEET (RULE 26)
CA 02915066 2015-12-10
WO 2014/201348 PCT/US2014/042300
SUMMARY OF THE INVENTION
(00141The present invention is an appatatus and methods for leakirtle or
nearareat-time
detecting and reporting of power theft in such a way that the tamper point may
be
determined to have occurred on the low-voltage side of a specific service
transformer, In
cases of meter tampering the specific meter or meters involved may be
identified, The
present invention does not requite instrumentation of the transfermer at the
service
delivery point (service transformer. All instruments and the intelligent
agents which
perform and collect the measurements and proem- the collected data to find
evidence of
power theft are located where instruments and intelligence would reside
anyway: at the
electrical meter. This :is beneficial in that the meter socket is typically
easily at ceesible,
and because a smart meter already contains memory and pmessots for hosting
software
agents, already has the capability of making many of the measurements used by
the
methods of the present invention, and because most smart meters are designed
to
accommodate an. additional circuit hoard where the native instruments,
communication
capabilitiesõ and/or memory and processing capabilities are insufficient to
support the
methods described herein.
O0151United States Patent Application NO. 13/871,944, titled A System and
Method_ for
inferring Schematic and Topoloeical Preeenies of an Electrical Distribution
Gridõ
incorporated herein by reference, describes augmenting Smart Meters with long-
range
(Edge-to-Substation) on-grid transmitters, and also short-range (low voltage,
local to the
service transformer) on grid transceivers. A Smart Meter having both short-
range and
long-range on-grid transmission capability is called a Remote Hub. A Smart
Meter
having only short-range on-grid capability is called a Subordinate Remote. The
term
Remotes is used to refer collectively to both Subordinate Remotes and Remote
Hutaa. A
service transformer having a Remote Hub and zero or more Subordinate Remotes
is
defined as a Transformer Area Network, or TAN, Further, that application
discloses a
method for determining the feeder and phase supplying a Remote Hub with power
based
on characteristics of a long-range message transmitted from the Remote Hub.
100161 US Patent Application No. 1.3/888,10Z titled Methods for Discoveringa
Emtifiguirig,Qigitaim: gõ and Administering Communication Devices in a
Transibrmer
Area Networlµ also incorporated herein by reference, teaches a method of
ensuring that
6
SUBSTITUTE SHEET (RULE 26)
CA 02915066 2015-12-10
WO 2014/201348 PCT/US2014/042300
all Remote Hubs and Subordinate Remotes in a TAN are, in factõ supplied with
power by
the same service transformer, and, in the case of a multi-phase transtbrmer,
determining
which Remotes are on the same phase as a Remote Hub and which Remotes are on a
different phase. Additionally, US Patent Appiication No. 13/911,849, titled A
System
and Method for infenin,, Schematic Relationshils between Load Points and
Service
Transarmers and incorporated herein by reference, describes a method for
identifying
the specific service transformer and its geospatiat coordinates .which supply
a given meter
socket, and incorporating the association and coordinates into a map of the
distribution
grid. The utility already knows at least the street address, if not the
precise geospatial
coordinates, of every meter. Using, the information obtained from the systems
and
methods in the above-refeienced applications, the physical and schematic
origin of a
report from a Remote Hub, and the physical and schematic -extent of the
Transformer
Area Network the Remote Huh represents, may he very priutisely defined. These
inventions teach a Transformer Area Network Architect= which is master-slave
in
nature, wherein one Remote, typically the Remote Hub, contains most of the
intelligence,
and poits simpler agents On the Subordinate Remotes both to organize the IAN,
and to
implement applications on the TAN. The system and methods of the present
invention
are primarily described in terms of such a TAN organization. However, a master-
slave
network organization is only one of the possible network organizations
suitable fOr
hosting the present invention. For example, a peer-to-peer transformer area
network is
also suitable. A wider peer-to=peer network, such as an AMI mesh network,
might also
be suitable given that a) the nodes in the network have sufficient information
to partition
themselves logically by transformer area, and b) that there is sufficient
bandwidth for
sharing the measurements taken by the measurement agents of the present
invention, as
described herein below.
[00171, The present invention provides a method for a Remote Hub in
communication
with at least one Subordinate Remote, each Remote operable to measure and
store
voltage at the meter and current passing from the meter to the metered load,
to identify
indications that power then is occurring in the TAN, without placing apparatus
either at
the service transformer of the TAN or inside the premises of the loads powered
by the
TAN. For this purpose, the TAN comprises at least two nodes, such as one
Remote Hub
7
SUBSTITUTE SHEET (RULE 26)
CA 02915066 2015-12-10
WO 2014/201348 PCT/US2014/042300
and one or more Subordinate Remotes, on each phase of the TAN. Further, every
load
(metered service point) on the TAN has a Remote (or another type of
communicating
meter) if complete theft pannection is to be achieved, The method can he
employed with
some meters not having a Remote, but some thefts may go undetected in that
case,
depending on the topology of the TAN and the location of the unauthorized tap
with
respect to the communicating meters. Methods for inferring the existence and
location of
illegal taps that do not require taking measurements at the service
transformer of the TAN
are taught. Avoiding the need to take measurements at the service transformer
is
desirable because the cost of only adding instrumentation at the meters is
significantly
lower than the cost of adding instrumentation at both the meter and the
transformer, as is
the cost of maintaining the network when all instruments and intelligence
reside at the
meter only. Avoiding the need to place apparatus inside the pietniSeS of the
metered
service point is desirable -because the consent of the consumer is required to
place
apparatus inside the premises, and because maintenance of equipment inside the
premises
is typically outside the charter of the utility.
BRIEF DESCRIPTION OF THE DRAWINGS
POIBiThe accompanying drawings, which are incorporated in and form a part of
the
specification, illustrate the embodiments of the present invention and,
together with the
description, serve to explain the principles of the invention. In the
drawings:
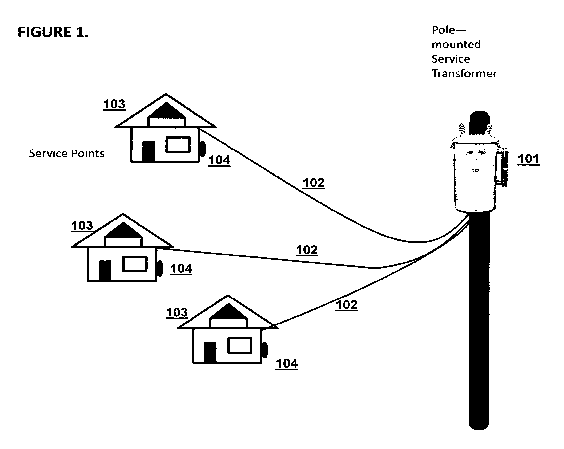
100191Figure 1 illustrates a radial-topology transformer area, with an above-
ground
transformer and power lines and three metered premises,
[0020] Figure 2. illustrates a bus-topology transformer area with a pad-
mounted
transformer, underground power lines, and three metered premises along a
single tap,
(0021] Figure 3 illustrates a radial...topology transformer area with a pad-
mounted
transformer, underground power lines, and three metered premises each with its
own tap
[0022] Figure 4 illustrates the area of Figure 1 enhanced to form a
Transformer Area.
Network by the addition of a Remote Huh and to Subordinate Remotes.
[0023] Figure 5 shows the Transformer Area Network of Figure 4 with the
addition of an
ifle unmetered tap used to power a greenhouse.
(00241Ftgure 6 shows the electrical detail of a radial Transformer Area
Network like that
of Figures 4 and 5, with an arbitrary number of metered premises (Nodes) N,
8
SUBSTITUTE SHEET (RULE 26)
CA 02915066 2015-12-10
WO 2014/201348 PCT/US2014/042300
DETAILED DESCRIPTION OF THE INVENTION
10025] Refer to Figure I, which illustrates a typical single-phase pole-
mounted
transtbmier 101 connected via aerial power lines 1.02 to residences 1.03. In
the United
States and many other locales, this is a typical configuration, especially in
older areas.
Power lines to residences are typically attached to the eaves of the roof,
with the power
lines traveling downward to the meters 104 in conduit on the exterior of the
residences
103. Figure 2, by contrast, illustrates a bus topology for the transformer
area, which is
more typical in other parts of the world than in the United States., In Figure
2, a pad-
mounted transformer 201 connects via a linear buried. line 202 connected to
residences
203, 204, and 2043 at meters 206, 207, and 208 respectively. This topology is
common in
Europe and elsewhere in the world. A typical installation might serve many
more meters
than shown: the average number of meters per single-phase transformer in the
US is
approximately six(6), but the European average is dozens, Figure 3 shows a
typical US
huried-cable installation, Wherein pad-mounted transformer 301 is connected
radially via
buried cable 302 to residences 303 at. meters 304. These three basic
configurations, with
minor local variations and multi-phase variations for industrial and
commercial
applications, represent most electrical distribution networks worldwide, The
present
invention works with minor variations on all three of these common topologies,
as is
taught herein below. For the purpose of this teaching, each phase of a three-
phase
transformer can be considered as a separate TAN, even though, as described in
13/888,102, a three-phase transformer area may actually be organized as a
single TAN,
but wherein the phase of each node (e.g. Remote) in. the TAN is known, and
Edge-to-
Substation transmissions from the TAN are sent on the phase to which they
pertain.
(0026)Refer now to Figure 4, where the transformer area of Figure 1 has been
converted
to a Transformer Area Network by substituting for the ordinary meters in
Figure 1 two
Subordinate Remotes 402 and 404, and one Remote Hub 403, The clocks of the
communicating meters of the Transformer Area Network have been synchronized to
within a known tolerance, as described in 13/871,944, Service Transformer 401
does not
contain any added communication equipment or instruments, and is identical
with the
9
SUBSTITUTE SHEET (RULE 26)
CA 02915066 2015-12-10
WO 2014/201348 PCT/US2014/042300
Service Transformer of Figure' Note that service point/residence 405 has
nearby an
unpowered outbuilding 406 such as a barn.
10021]1n one embodiment of the invention, a measurement agent resides on each
of
Remotes 402, 404, and 403. Each agent periodically measures the delivered
voltage V
and flowing current fat its service point. A monitoring agent. which may
reside on
Remote Hub 403 periodically collects the time-stamped current and voltage
measurements from Subordinate 'Remotes 402 and 404 and from its own
measurement
agent. The period of the monitoring agent is not required to be the same as
the period of.
the measurement agents, but the time at which the measurements are taken is
synchronized to the closest tolerance .possible given the capabilities of the
TAN. Both
periods are. very small with respect to the time scale of events in a typical
Alvfl network,
wherein, for example, meter readings may be transmitted only every fifteen
minutes or
even less frequently. The monitoring agent executes a software algorithm that
compares
current and voltage measurements taken at the different meters at the same
time and uses
them to infer when an .unmetered flow of current is occurring between the
transformer
and one or more of the metered service points,
(002811n Figure 5, an unmetered tap 507 has been added at premise 505,
electrically
between transformer $01 and meter 504. The tap has been used to electrify
outbuilding
506. No only do such taps cause monetary losses for the utility, at peak load
times they
may create a danger of transformer fires and explosions because the TAN as a
whole may
be drawing more power than the rated maximum of the transformer.
(00291Figure 6 provides electrical detail of a radial 'Transformer Area
Network. such as
that of Figures 4 and S. 'The TAN of Figure 6 contains at least two metered
service
points, or Nodes, herein labeled I .X Power source 601 supplies transformer
607 with
power at a medium voltage, which is stepped down by transformer 607 to the low
voltage
range accepted by the meters in the transformer area, here represented by
meter 627 in
Node 1(605) and meter 629 in Node N(610). Current 604 represents current
flowing
from the power source due to all the loads on the grid served by power source
601.
impedance 603 represents the impedance of the medium-voltage grid. The voltage
606 on
the low side of transformer 607 fluctuates with chances in voltage 602,
impedance 603,
and current 60$. None. of these quantities are constant, measurable, or known
to the
to
SUBSTITUTE SHEET (RULE 26)
CA 02915066 2015-12-10
WO 2014/201348 PCT/US2014/042300
software agents at the meters (such as 627 and 629), but 'voltage 602 may be
expeeted to
vary around a nominal value within a known range of acceptable -values, For
example, a
typical nominal value for voltage 602 might be 13.4KV in the United States
(thoegh
others are possible), and a typical nominal value for voltage 606 might be
240V5 though
again others are possible. These nominal values may be known to the software
agents.
(0030)Consider now the components in the meanie 605 representing Node I Node I
comprises the apparatus delivering power from service transformer 607 to meter
627.
Interesting measurable quantities are marked on the diagram. Impedance 616
represents
the legitimate metered load of the premise of Node 1, which may vary over
time.
according to what appliances and devices are in use on the premise,. Point 626
is not. an
actual piece of equipment, but represents an arbitrary place on the power line
from
transfOrmer 607 to meter 627 where an illegal tap might be installed.
Impedance 612,
which is normally extremely large. when no theft is occurring, represents a
potential
unauthorized, =metered load. Impedances 609 and 6.13 represent the normal
impedance
of the power line from transformer 607 to meter 627. Voltage 611 represents
the voltage
at hypothetical tap point 626. None of these quantities are known to or
measureable by
the software agents residing at meter 627. Current 614 and voltage 615 are
measured
periodically by the measurement agent residing at meter 627 and sluired on the
TAN by
the communication equipment at meter 627õ Regardless of the network
architecture of
the TAN, the sharing is always conducted in such a way that the identity of
the meter
from which the measurements originate and the time the measurements were taken
is
known to any receiver of the messages in which the measurements are
transmitted. Note
that element 622 of Figure 6 is not a -feature of the TAN, hut is an ellipsis
indicating that
an arbitrary number of additional Nodes could exist between Node 1 605 and
Node N
610.
[00311 Similarly, consider the components in the rectangle 620 representing
Node N.
This is the apparatus delivering power from service transformer 607 to meter
429.
Impedance 625 represents the legitimate metered load of the premise of Node N,
which
may vary over time according to what appliances and devices are in use on the
premise.
Point 628 is not an actual feature of the TAN, but represents an arbitrary
place on the
power line from transibrmer 607 to meter 629 where an illegal tap might be
installed.
SUBSTITUTE SHEET (RULE 26)
CA 02915066 2015-12-10
WO 2014/201348 PCT/US2014/042300
impedance 623, which is normally extremely large when no theft is occurring,
represents
a possible unauthorized, onmetered load. Impedances 618 and 620 represent the
normal
impedance of the power line from transformer 607 to meter 629. Voltage 619
represents
the voltage at hypothetical tap point 628. None of these quantities are known
to or
measureahle by the software agents residing at meter 629. Current 621 and
voltage 624
are measured periodically by the measurement agent residing at meter 629 and
shared on
the TAN by the communication equipment at meter 629.
10032I For the purposes of the algorithm of the monitoring agent, it does not
matter
whether meter 629, meter 627, or the meter of another Node between I and N has
the
Remote Hub and which meters have Subordinate Remotes.. Indeed, as is noted
herein
above, another type of TAN communication entirely may be employed, as long as
it
provides sufficient bandwidth. for all the meters or the TAN to sitate their
measurements.
within a sufficiently small period; The TAN may host at least one monitoring
agent
somewhere on the TAN and a measuring agent at each communicating meter. With
some
network architectures, it may be more effective to host a monitoring agent in
every node..
Alternatively, the work of the monitoring agent may be distributed among
multiple
communicating meters. If the monitoring agent does not. reside on a meter
having the
capability to send a wide.area message such as an Edge-to-Substation message,
then the
monitoring agent must transmit a command to a wide-area enabled device to
transmit the
anomaly report.
1:0033)Suppose that an unauthorized load represented by impedance 612 is now
attached
at point 626. Voltage 611 will drop because more current (the current drawn by
the
unauthorized load at 612) is flowing through impedance 609. This will also
cause a drop
in voltage 615. However, the current 614 flowing through impedance 613 does
not drop
correspondingly. A measurement agent at meter 627, able to measure only
current 614
and voltage 613, will not be able to infer whether the drop in voltage 615 is
due simply to
a drop in voltage 606, or whether it is caused by a theft represented by a
drop in voltage
611 and a decrease in impedance 612 (which ought to always be very large).
However,
consider the observations made by a measurement agent at meter 629. For
simplicity,
assume that impedance 623 in Node N (610) is properly large ¨ no power is
being stolen
in Node N. A measurement agent at meter 629 will observe a drop in voltage 624
due to
12
SUBSTITUTE SHEET (RULE 26)
CA 02915066 2015-12-10
WO 2014/201348 PCT/US2014/042300
the drop in voltage 606. A monitoring agent can use the measured currents 614
and 621
at the meters 627 and 629 respectively (and others, if there are more
commtmicating
nodes in the TAN) to estimate the proper voltage drop due to each metered
load. Once
the effects of the metered loads (616, 624) have been removed, the adjusted
magnitudes
of the voltages measured at each meter can be compared. Even though there will
be small
differences in the line impedance between the transformer 607 and each meter,
these are
expected to be negligible. (in this example, compare impedances 609e613 to
meter 627
with impedances 618+620 to meter 629.) If one meter, in this example 627. F4Cs
a greater
adjusted voltage drop than the other meters, within a tolerance representing
normal
differences in the line impedance, then it is to be expected that an unmetered
load exists
between that meter and transformer 607.
[0034]Further, this method of comparing current and voltage from each
available
viewpoint" detects theft in the TAN even if there are multiple theft points.
Even if there
were an unmetered load attached between every meter and the transformer,
unless the
impedances 612, 62.3, etc., due to unauthorized loads were identical at all
times, then the
theft points could still be inferred by a monitoring agent with access to the
current and
voltage measurements of each measurement agent, because the voltage drops at
some
measurement points would not be proportional to the current at the same point
(00361 When the monitoring agent residing at the Remote Hub of the TAN detects
a
probable theft, then the Remote Hub may send an Edge-to-Substation message to
alert the
utility about the anomaly. Edge-to-Substation messages, as described in United
States
Patent Application Nov 131871,944 referenced above, travel from a Remote Hub
to an
electrical distribution substation supplying power to the substation
transformer, here,
transformer 607. From the substation, the message is transferred by a
conventional
network to a data center provided by the utility Or an energy management
services
provider. A theft alert may also be propagated via another available network
connected
to the Remote Hub or other communicating meter, such as an Alt41 network. Such
a
message may include at least a unique identifier of the service transformer or
a meter at
which the anomalous current.voltage relationship was detected which may be
used to
match the origin of the message with the data in a grid map database,
SUBSTITUTE SHEET (RULE 26)
CA 02915066 2015-12-10
WO 2014/201348 PCT/US2014/042300
[0036] The method described herein above with minor computational adjustments
can be
equally applied to a transformer area which has a bus topology such as is
shown in Figure
2 rather than a radial topology like Figures and 3> In a bus topology, the
voltage drop
from transformer to meter is additive as each node is further from the
transformer, as the
metered loads are connected in series rather than in parallel. Nevertheless,
each metered
load's contribution to the voltage drop ought to be proportional to the
current being
drawn at each meter. If the voltage drop at a given meter is greater than
proportional to
the measured currents between the transformer and that meter, based on the
time stamped
current and voltage measurements 'Awed on the TAN by the other meters ¨itt
this case,
specifically the meters earlier in the series with respect to the transfonricr
than the given
measurement point.
(003711n order to apply this method in a TAN with a bus topology, it is
necessary fk)r the
order of the nodes in the TAN with respect to the transformer to be known to
the
monitoring agent (at least). This can be inferred by the monitoring agent. The
ordering
of the series will correspond to the measured voltage at each metered point,
with the
lowest voltage being schematically Authest from the transformer. Referring
again to
Figure 2, the schematically nearest meter to transformer 201 is 206, and the
furthest in
series is 208. This would remain true even if premise 20S were geospatially
closer to
transformer 201 than premise 203, which is certainly possible. This condition
is also
illustrated in Figure 2, Additionally, this schematic inference remains comet
even if
power theft is occurring, because the resulting voltage drops are still
cumulative.
[0038111S, Patent Application Nos. 13/871)944, 13/888,102, and 13/911,8492 all
referenced above, teach methods for recording an accurate grid map of an
electrical
distribution network. The grid mapping method taught by these inventions,
includes the
feeder and phase of each substation operable to power each metered load
supplied by the
network and a correct and current partitioning attic meters of the network
into
Transformer Area Networks.. In order to perform theft detection, the grid map
of a TAN
with a bus topology may be augmented with the series order of the meters of
the TAN,
and this order can be kept up-to-date as meters and loads are added and
removed from the
TAN. For theft detection, this information may only need to be maintained by a
monitoring agent in each TAN, and indeed it may be recomputed periodically by
each
14
SUBSTITUTE SHEET (RULE 26)
CA 02915066 2015-12-10
WO 2014/201348 PCT/US2014/042300
monitoring agent. However, it may be beneficial to record this additional
information in a
centralized grid map database, said centralized grid map database being taught
by
13/871,944> To do this, the Edge-to-Substation message sent when a new node -
is
discovered in the TAN may Inc hide the schematic order of the meter on the
power line
bus from the transformer. Similarly, if the order of nodes were observed to
change, for
example after a power outage or extension of the TAN due to construction, then
the new
ordering might be reported in an Edge-to-Substation message to be recorded in
a grid
map database.
[00391Another method of power theft is sometimes used that does not involve
creating
an illegal tap. This method involves creating misdirection by switching meters
with a
neighbor prior to making an increase in consumption. A communicating meter
tarty
kind can already be enabled to report being disconnected from the meter socket
if it is
plugged into a meter socket again (whether the same socket or a different one)
while
power is available. However, an enterprising power thief can wait for a
natural power
outage in which to swap metets with another premise, or can vandalize the
network to
create an outage in which to effect the swap.. An intelligent meter, however,
that
participates in a Transformer Area Network with real-time grid mapping as is
described
herein and in the referenced related inventions, can detect an illegal move in
a variety a
ways:
= if two meters are swapped between two distinct TANs, then both TANs may
report discovering a new meter and losing communications with a meter that was
formed y part of the TAN.
= if two meters are swapped in such a way that the phase of the meters is
reversed,
then this change may be reported by the grid mapping agents:.
= If two meters are switched within the same INN and the same phase, then
if the
TAN has a bus architecture, both meters will be detected as having changed
positions with respect to their service transfonner, and this may be reported
by the
monitoring agent.
O If a meter has access to a geospatial location signal, then a grid
mapping agent on
the meter may report the change. in location,
SUBSTITUTE SHEET (RULE 26)
CA 02915066 2015-12-10
WO 2014/201348 PCT/US2014/042300
(0040] This leaves only one case ¨ swapping two meters not enabled to receive
a
geospatial location signal, between two premises on the same phase of the same
radial
TAN ¨ which is not easily detected. This case may be undesirable from the
viewpoint of
the thief because of the proximity of the premises: better to tamper with a
meter socket
several blocks away than with that of the next-door neighbor.
10041]T manage the detection process, an agent such as the monitoring agent on
at
least one communicating meta (such as a Remote Hub) on each TAN may report
each of
the detected anomalous conditions using an Edge-to-Substation message or
another
available wide-area network capable of fierwanling the message to a software
program
reeiding in a data center with access to the consolidated grid map. The
software program
also receives reports of planned grid changes from other applicatiorte used to
manage the
grid An example of such reports could be the work orders used to dispatch
field
engineers to make required changes and repairs to the distribution grid. The
software
program avoids reporting false theft indieations by matching the anomaly
reports from
the communicating meters against the work orders or similar reports. Anomalies
which
are explained by the work orders are not reported as potential indicators of
theft The
anomalies which cannot be matched with a work order create alerts that a
potential theft
may be occurring, regardless of whether the anomaly is a change in the grid
map or a
voltage anomaly reported by a monitoring agent. The theft alert may contain
the account
numbers and addresses of the affected premises, the identity and geoepatial
coordinates
of the affected transformers and meters, and any other relevant inibmiation
that may be
used to locate the theft, whether the theft is perpetrated by means of moving
meters or by
means of creating an unauthorized, =metered tap
(0042r the foregoing description of the invention has been presented fOr
purposes of
illustration and description and is not intended to be exhaustive or to limit
the invention
to the precise. forms disclosed. Many modifications and variations are
possible in light of
the above teaching. The embodiments were chosen and described in order to best
explain
the principles of the invention and its practical application to thereby
enable others.
skilled in the art to beet utilize the invention in various erntexiiments and
with various
modifications as are suited to the particular use contemplated.. it is
intended that the
scope of the invention be defined by the claims appended hereto.
16
SUBSTITUTE SHEET (RULE 26)