Note: Descriptions are shown in the official language in which they were submitted.
CA 02924040 2016-03-18
= 12361
(INVN 12361.US)
Asset Management in a Process Control System
BACKGROUND
[0001] A maintenance team is often responsible for keeping assets in an
industrial
process operational while an operations team is responsible for operating the
assets. The
maintenance and operations teams work on common assets and these two
organizational
functions need to work in very close collaboration to maximize the performance
of the industrial
assets. Unfortunately, this is not always the case. In many industrial
organizations, the two teams
do not collaborate and appear to compete with each other. This leads to
suboptimal performance
of industrial operations.
[0002] A primary reason behind the conflict between operations and maintenance
is that
the primary performance measures for each team tend to oppose one another. The
primary
performance measure for the maintenance team is typically asset availability,
while the primary
performance measure of operations is typically asset utilization. Asset
availability means keeping
the assets available to the operation by maximizing their "up time". Asset
utilization means
maximizing the throughput of the assets. One of the key drivers in maximizing
asset availability
of industrial asset is to not operate them aggressively. However, the
operations team is often
required to operate the assets as aggressively as possible to meet production
requirements. This
implies that asset availability and asset utilization have an inverse
relationship and that the
conflict between operations and maintenance is a direct consequence of this
inverse relationship.
[0003] A system that automatically generates a perfoimance measure of an
industrial
process in real time that takes into account the goals of both the maintenance
and operations
teams in the factory and automatically initiates process activities such as
maintenance based on
the performance measure would ensure that the close cooperation between the
teams, improved
productivity during up time, and minimized interruption from down time.
SUMMARY
[0004] Briefly, aspects of the present invention permit management or control
of assets
in a process control system. The system described herein calculates asset
performance measures
for a plurality of assets within a process control system and initiates
process activities such as
asset maintenance or operations throughput rates based on the calculated asset
performance
1
measures. The asset performance measures comprise data about the cost to run
the assets, the
cost of the raw materials being used by the assets, and the value of the
products produced by the
assets.
[0005] In one form, a system for improving production of a process control
system is
described. The system comprises a processor, sensors connected to one or more
assets in the
process control system, human-machine interfaces, and a storage memory storing
both asset
information and instructions for execution on the processor. The system
receives process data
via the sensors and determines an input cost of the one or more assets and an
output value of the
one or more assets. The system provides a net production value of the one or
more assets based
on the determined input cost and output value. The system stores the input
cost, output value,
and net production value on a storage memory and provides the input cost,
output value, and net
production value to a user via the human-machine interfaces. The system
enables a user to
change the behavior of the one or more assets in such a way that the net
production value
increases via the human-machine interfaces.
10005a1 In one aspect, there is provided a system for improving production of
a process
control system comprising: a processor executing a process control system
configured to control
a process, the process operating one or more assets thereof to produce
products; one or more
sensors coupled to the one or more assets of the process, said sensors
configured for measuring
real-time process data representative of at least one of: an amount of
material input into the
process, an amount of energy input into the process, an amount of an asset
material consumed by
the process, an amount of asset flow in the process, and an asset temperature
of the process; a
controller of the process control system configured to modify at least one of
the amount of
material input, the amount of energy input, the amount of asset material
consumed, the amount
of asset flow, and the asset temperature; a storage memory coupled to the
processor, said storage
memory storing the process data measured by the one or more sensors and
processor-executable
instructions, said processor-executable instructions, when executed by the
processor, configuring
the processor for: retrieving, from the storage memory, the process data from
the one or more
sensors; determining an input cost of the one or more assets based on the
retrieved process data
from the one or more sensors, said input cost comprising an energy cost and a
material cost;
determining an output value of the one or more assets based on the retrieved
process data from
the one or more sensors, based on the energy cost, and based on the material
cost; providing a net
2
Date Recue/Date Received 2021-02-23
production value of the one or more assets based on comparing the determined
input cost and
determined output value; and storing the determined input cost, determined
output value, and net
production value in the storage memory; said processor-executable
instructions, when executed
by processor, further configuring the processor for: executing asset
performance models in real-
time, the asset performance models modeling the one or more assets based on
the retrieved
process data from the one or more sensors and one or more of the determined
input cost,
determined output value, and net production value; sending command data, based
on the
executed asset performance models, to the controller; and automatically
modifying, via the
controller in response to the command data, at least one of the amount of
material input, the
amount of energy input, the amount of asset material consumed, the amount of
asset flow, and
the asset temperature in such a way that the net production value increases;
and one or more
human-machine interface (HMI) systems coupled to the processor and responsive
to the executed
asset performance models, the HMI systems comprising a visual display based on
the executed
asset performance models of at least one of: a maintenance station presenting
on its visual
display information about a maintenance schedule or prior issues, an operator
station presenting
on its visual display real-time information as to current operation of an
asset, and an engineering
station presenting on its visual display trend information.
[0005b] In another aspect, there is provided a method for improving production
of a
process control system comprising: executing, by a processor, a process
control system
configured to control a process, the process operating one or more assets
thereof to produce
products; measuring, by one or more sensors coupled to the one or more assets
of the process,
real-time process data representative of at least one of: an amount of
material input into the
process, an amount of energy input into the process, an amount of an asset
material consumed by
the process, an amount of asset flow in the process, and an asset temperature
of the process;
storing, in a storage memory coupled to the processor, the process data
measured by the one or
more sensors; executing the processor-executable instructions to configure the
processor for:
retrieving, from the storage memory, the process data from the one or more
sensors; determining
an input cost of the one or more assets based on the gathered process data
from the one or more
sensors, said input cost comprising an energy cost and a material cost;
determining an output
value of the one or more assets based on the retrieved process data from the
one or more sensors,
based on the energy cost, and based on the material cost; providing a net
production value of the
2a
Date Recue/Date Received 2021-02-23
one or more assets based on comparing the determined input cost and determined
output value;
storing the determined input cost, determined output value, and net production
value in the
storage memory; executing asset performance models in real-time, the asset
performance models
modeling the one or more assets based on the retrieved process data from the
one or more
sensors and one or more of the determined input cost, determined output value,
and net
production value; sending command data, based on the executed asset
performance models, to a
controller of the process control system; and automatically modifying, via the
controller in
response to the command data, at least one of the amount of material input,
the amount of energy
input, the amount of asset material consumed, the amount of asset flow, and
the asset
temperature in such a way that the net production value increases; and
displaying, by one or
more human-machine interface (HMI) systems coupled to the processor and
responsive to the
executed asset performance models, a visual display of at least one of the
following based on the
executed asset performance models: a maintenance station presenting on the
visual display
information about a maintenance schedule or prior issues, an operator station
presenting on the
visual display real-time information as to current operation of an asset, and
an engineering
station presenting on the visual display trend information.
[0006] In another form, software instructions are stored on one or more
tangible, non-
transitory computer-readable media and are executable by a processor. In
another form, a
processor executable method is provided.
[0007] Other features will be in part apparent and in part pointed out
hereinafter.
BRIEF DESCRIPTION OF THE DRAWINGS
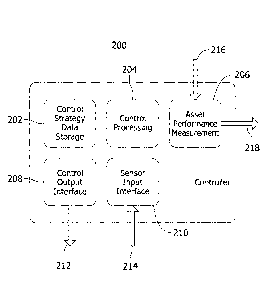
[0008] FIG. 1 is a block diagram illustrating a process control system
embodying aspects
of the invention.
[0009] FIG. 2 is a block diagram of various modules that are present in an
exemplary
controller of the process control system of FIG. 1.
[0010] FIG. 3 is an exemplary flowchart illustrating a process of gathering
data,
calculating asset performance, and altering the system of FIG. 1 based on the
calculated
performance according to an embodiment of the invention.
[0011] FIG. 4 is a block diagram illustrating various modules that make up an
asset
performance measurement system according to an embodiment of the invention.
2b
Date Recue/Date Received 2021-02-23
[0012] FIG. 5 is an exemplary graph of the relationship between asset
availability and
asset utilization according to an embodiment of the invention.
2C
Date Recue/Date Received 2021-02-23
CA 02924040 2016-03-18
12361
(INVN 12361.US)
[0013] FIG. 6 is an exemplary diagram of a basic industrial asset according to
an
embodiment of the invention.
[0014] FIG. 7 is an exemplary diagram of a set of industrial assets according
to an
embodiment of the invention.
[0015] FIG. 8 is an exemplary diagram of a system for calculating input costs
and output
value according to an embodiment of the invention.
[0016] FIG. 9 is an exemplary diagram of a system for calculating opportunity
cost and
asset performance according to an embodiment of the invention.
[0017] FIG. 10 is an exemplary diagram of the system of FIG. 9 including
storage of the
calculated values in a Historian database.
[0018] FIG. 11 is a diagram of the asset performance measurement system of
FIG. 4
connected to a Crude Unit.
[0019] Corresponding reference characters indicate corresponding parts
throughout the
drawings.
DETAILED DESCRIPTION
[0020] FIG. 1 displays the basic structure of an exemplary process control
system 100.
In an embodiment, the process 102 is communicatively connected to the
controller 104 and the
sensors 106. The process has inputs 108 and 110 that comprise the necessary
inputs for the
process to create the output 112. In an embodiment, the input 108 includes
energy for powering
the process 102 and the input 110 includes physical or chemical raw materials
for use in the
process 102. The output 112 comprises physical or chemical products from the
process or
produced energy in the form of electricity or the like.
[0021] The controller 104 sends data to the process 102 in order to direct the
operations
of the process 102 according to the goals of the controller 104. The data sent
comprises
commands which operate various types of control elements in the process, such
as valves,
actuators, or the like. The sensors 106 monitor the process at various points
and gather data from
those points. The sensors 106 send the data gathered to the controller 104.
Based on the
gathered data, the controller 104 can then send additional commands to the
process 102. In this
way, the system forms a control feedback loop, where the controller 104 reacts
to changes in the
process 102 as observed by the sensors 106. Different actions carried out by
the process 102
3
CA 02924040 2016-03-18
12361
(INVN 12361.US)
according to the commands of the controller 104 may result in the data being
gathered by the
sensors 106 changing, causing further adjustments by the controller 104 in
response to those
changes. By implementing this control feedback loop, the process 102 can be
controlled by the
controller 104 in an efficient manner.
[0022] The diagram in FIG. 2 is an exemplary controller 200 comprising various
modules for use in addition to (or as part of) or instead of controller 104.
In operation, aspects of
the invention relate to improving the productivity and efficiency of a process
control system by
monitoring costs and value produced and making changes to the process via the
controller 200
that maximize the value produced in relation to the costs. The controller 200
comprises a control
strategy data storage module 202, a control processing module 204, an asset
performance
measurement module 206, a control output interface module 208, and a sensor
input interface
210. The control output interface 208 sends data 212 to a process such as
process 102 in FIG. 1
and the sensor input interface 210 receives gathered sensor data 214 from
sensors such as sensors
106 in FIG. 1.
[0023] The control strategy data storage module 202 stores the data gathered
from the
sensors as well as data comprising a control strategy for guiding a connected
process. In an
embodiment, the control strategy comprises goals such as set points and levels
of elements of the
connected process. The controller 200 sends command data 212 to the connected
process which
causes the connected process to change operations in such a way as to move
toward the control
strategy goals.
[0024] The control processing module 204 processes data received from the
sensor input
interface 210 into data that can be used to issue the correct commands 212 to
the connected
process. In an embodiment, sensor data 214 is in a raw form and the goals, set
points, or levels
of the control strategy do not comprise the same data as the sensor data 214.
The control
processing module 204 processes the sensor data 214 to render it useful for
determining how to
direct the connected process in order to achieve the control strategy goals.
[0025] In an embodiment, the controller 200 comprises an asset performance
measurement module 206. The asset perfointance measurement module 206 measures
the
performance of an element, or asset, of the process as described further
below. The asset
performance measurement module 206 uses sensor data 214 as well as data 216
from outside
sources, such as business data from business systems. Using the combination of
data 214 and
4
CA 02924040 2016-03-18
= 12361
(INVN 12361.US)
216, the performance 218 of an asset of the process is determined and is sent
from the controller
to be stored and displayed in other portions of the process control system.
The functionality of
the asset performance measurement module 206 will be further described below.
[0026] FIG. 3 is a flowchart describing an exemplary of process controller of
a process
control system using asset performance measurement to improve the performance
of the assets in
which the process operates. The controller sends messages to the process to
control the process
(step 302). The controller also receives data from the process as collected by
sensors coupled to
the process (step 304). The controller includes an asset performance
measurement module as in
FIG. 2, and the controller uses the asset performance measurement module to
analyze the
performance of the process based on the received data (step 306). Upon
completion of the
analysis, the analysis is provided to users (step 308) via some form of user
interface, such as a
visual display. The performance analysis is also stored in a database for use
in long term
evaluation (step 310). The performance analysis may also be used by the
process control system
to alter the control of the process to improve the performance of the process
(step 312). The
changes made to the process may include actions such as altering the
maintenance schedule for
the asset automatically, or changing the operational set points, or the like.
[0027] FIG. 4 is an exemplary diagram of a way in which the described system
may be
structured. An Asset Performance Measurement System 400 comprises several
different
hardware and software modules working in concert to provide users with asset
performance
infolination and to respond to that asset performance information in order to
improve the asset
performance. The system 400 is connected to an "asset" of a process control
system via sensor
inputs 402. An asset may be any mechanical, chemical, electrical, biological
or combined
mechanism or set of mechanisms that is used to convert energy and materials
into value added
products or production. The sensor inputs 402 provide the system 400 with data
gathered from
the asset that can be used to determine asset performance. This data could
include any data that
can be gathered directly from the sensors or it could be information that is
inferred from the
directly gathered sensor data. The sensor data may be provided to the system
400 in real-time as
it is gathered. In addition to the sensor inputs 402, business inputs 404 are
also received by the
system 400. The business inputs 404 include data from a business system 406,
also known as an
enterprise resource planning (ERP) system, indicating the costs per unit of
consumption
associated with the asset being monitored as well as the value of the output
of the asset. The
CA 02924040 2016-03-18
= 12361
(INVN 12361.US)
costs may include energy costs for operating the asset and materials costs for
providing the asset
with necessary raw materials to function. The business inputs 404 may be
provided in real-time,
or as close to real-time as is feasible, depending on the type of data being
provided.
[0028] The sensor inputs 402 and the business inputs 404 are received by an
asset
performance algorithm executor module 408 which is a software module which may
reside in a
distributed control system (DCS). The asset performance algorithm executor
module 408 is a
software module that may be stored on a storage memory device and may be
executed by the
processors of the DCS. The executor module 408 executes asset performance
models in real-
time according to the received sensor inputs 402 and business inputs 404. The
models may
include algorithms for calculating costs of operation of the asset, actual
values of the output of
the asset, potential values of the output of the asset, real-time performance
of the asset, and
opportunity costs associated with operating the asset. The function of these
algorithms is
described in detail below.
[0029] The real-time results calculated by the asset performance algorithm
executor
module 408 are transferred to an asset performance history module 410, which
will store those
results in a history database 412 for later access and analysis. Storing the
results over time
enables the system to do historical analysis on past data and provides a user
with the ability to
find patterns in the operation of the asset. These patterns may be exploited
to improve the
efficiency and maintained state of the asset. In addition to being stored by
the asset performance
history module 410, the results from the executor module 408 may also be
transferred to an asset
perfoimance display engine 414, which may be connected to a variety of
different human-
machine interfaces, such as a maintenance station 416, an operator station
418, and an
engineering station 420. The stations 416, 418, and 420 may each be a separate
hardware
interface or they may each be a software interface that may be accessed on a
single device. The
display engine 414 may provide different information and a different
appearance to each of the
stations 416, 418, and 420 based on what the users of the stations may need.
The maintenance
station 416 may provide information about the maintenance schedule of the
asset or prior issues
that have been fixed on the asset recently. The operator station 418 may
provide real-time
information as to the current operation of the asset. The engineering station
420 may provide
long-term trend information based on the gathered and stored data in the
history database 412
that enables an engineer to view patterns that indicate inefficiencies in the
operation of the asset
6
CA 02924040 2016-03-18
= 12361
(1NVN 12361.US)
over time. The stations 416, 418, and 420 may be directly connected to the DCS
through the
display engine 414, or they may be located elsewhere and receive information
via a network
connection. The stations 416, 418, and 420 may provide the users an
opportunity to more
closely collaborate in an effort to improve productivity of the asset.
[0030] The key to collaboration is relegating asset availability and asset
utilization to
secondary measures and defining a common primary performance measure between
operations
and maintenance that will drive both collaboration and the performance plant
management
requires. The ultimate objective for most industrial operations is to maximize
the business
performance of the operation so the common performance measure should be based
on the
contribution to business performance from each asset or asset set. This common
business
performance-based performance measure is referred to as asset performance.
[0031] FIG. 5 displays a simple graph 500 describing the relationship between
asset
availability on the vertical axis and asset utilization on the horizontal
axis. In many cases,
extended or high level use of an asset causes wear and tear on parts of the
asset that may harm
productivity and may require maintenance. Maintenance requires the asset to
sit idle for a
certain amount of time, rendering it unavailable to the operation. The graph
depicts a curve 502
representing that, as an asset is used more and more, the effective
availability of the asset slowly
falls at first. Eventually, the curve turns downward steeply, representing a
large loss in
productivity of the asset. An asset performance vector 504 represents a point
along the curve
that is the optimal point for operating the asset from a business performance
perspective. The
system in FIG. 4 is capable of monitoring the performance of an asset in order
to predict how to
set up the asset performance vector 504 to result in maximized productivity
and minimized but
efficiently spaced maintenance down time.
[0032] The mechanism presented herein is designed to provide a common
definition and
approach for developing the asset performance vector for complex industrial
assets and asset
sets. With this asset perfottnance measure as the guiding performance measure
for both the
operations and maintenance teams, the level of collaboration between the teams
is expected to
increase, leading to more effective problem solving and cooperation which
should result in
improved performance across industrial operations.
[0033] The following terms are defined and used in this application. Asset
Performance
is the business performance of the asset relative to its potential business
performance. Asset
7
CA 02924040 2016-03-18
= 12361
(INVN 12361.US)
Value is the business contribution of an asset or asset set. Energy
Consumption Input Vector is
the vector of energy quantity inputs into an asset or asset set. An industrial
asset is a mechanical,
chemical, electrical, biological or combined mechanism or set of mechanisms
that is used to
convert energy and materials into value added products or production.
Production value is the
current market value of the products or production produced from an asset or
asset set. A value
point is any output from an asset or asset set that has inherent market value.
[0034] FIG. 6 represents a general industrial asset module 600. The asset 602
may be
any sort of device or mechanism used in an industrial process setting that
converts raw materials
and energy into products or production. The asset 602 may receive one or more
input materials
604 and one or more input energy sources 606. Using the materials 604 and
energy 606, the
asset 602 executes the operation for which it was built, resulting in one or
more products 608.
[0035] In FIG. 7, an industrial asset set 700 is an integrated collection of
industrial assets
702 that together exhibit the same operating characteristics as a single asset
and can be
considered as a single value-adding asset. The industrial assets 702 may
receive one or more
input materials 704 and one or more input energy sources 706. The industrial
assets 702 in the
asset set 700 work together to produce one or more products 708.
[0036] In FIG. 8, a combined system 800 comprises an asset or asset set 802
which
receives material input 804 and energy input 806 and produces products 808. An
asset
performance measurement system 810 receives real-time sensor-based data from
the asset 802.
The system 810 calculates a current cost of energy using an energy algorithm
module 812, the
current cost of materials using a materials algorithm module 814, and the
current value of the
products using a product algorithm module 816. The primary objective is to
provide a consistent
business value approach to measuring the asset perfoimance of every value
generating asset or
asset set in an industrial operation. The asset performance (AP) of an asset
should be a function
of the energy consumed over any time period multiplied by the cost of that
energy, the material
consumed over the time period multiplied by the cost of the materials and the
production value
produced over the time period. Since there may be multiple energy sources and
materials into the
asset or asset set and since the asset or asset set may produce multiple
products, all of these
variables must be considered. Therefore:
[0037] The energy value (E) determined by the energy algorithm module 812 is
determined by the equation:
8
CA 02924040 2016-03-18
12361
(INVN 12361.US)
a
E (t) = ec,(t)*ep,(t)
i=1
wherein: ec, is energy consumed over the time period, ep, is the price of the
energy over the time
frame, and a is the number of energy sources to the asset or asset set. E(t)
can be directly
modeled in a real-time automation system by connecting to sensor based
measurements that
enable the amount of energy consumed in the asset or asset set to be either
directly measured or
inferred, and retrieving the cost of each energy source from either the
business system or energy
supplier.
[0038] The material value (M) over the period of time (t) determined by the
material
algorithm module 814 is determined by the equation:
M (t) =IMC = (0* mp (t)
i=1
wherein: mc, is amount of material consumed over the time period, mp, is the
price of the
material consumed over the time period, and b is the number of materials to
the asset or asset set.
M(t) can be directly modeled in a real-time automation system by connecting to
sensor based
measurements that enable the amount of material consumed in the asset or asset
set to be either
directly measured or inferred, and retrieving the cost of each material from
either the business
system or energy supplier.
[0039] The production value (I') over the time period (t) determined by the
product
algorithm module 816 is determined by the equation:
P (t) =pi(t)* pvi(t)
i=1
9
CA 02924040 2016-03-18
12361
(INVN 12361.US)
wherein: p, is amount of product produced over the time period, pv, is the
market value of the
product produced, and c is the number of products produced by the asset or
asset set. P(t) can be
directly modeled in a real-time automation system by connecting to sensor
based measurements
that enable the amount of each type of production produced through the asset
or asset set, and
retrieving the market price of each product produced from either the business
system or market
pricing source.
[0040] In FIG. 9, the performance measurement system 910 calculates further
performance metrics using the results of the equations from modules 812, 814,
and 816 in FIG.
8. The combined system 900 comprises an asset or asset set 902 which receives
material input
904 and energy input 906 and produces products 908. A real-time asset model
912 receives
sensor data from the asset 902 and uses the sensor data to model the business
performance of the
asset. Monitoring the ongoing business performance of the asset can help
determine best
potential behavior based on the gathered sensor data. The asset model 912 is
used to calculate
the potential asset value 914 of the asset. Additionally, the sensor data is
received by an actual
asset value module, which calculates the actual asset value 916 in real-time.
The real-time asset
value (A V) produced by the asset or asset set is the real time business value
created over any time
period (t) from the asset set. It is important to note that AV is not the
overall profitability from the
asset or asset set. Rather is represents the components of profitability that
vary with high
frequency. The equation for AV is:
AV (t) = P(t)- (E(t)+ A 1(0
[0041] The production value P(t), energy value E(t) and material value M(t)
should be
relatively constant over the time period (t). This required that t be set to
reflect the dynamics of
the business. Since the dynamics of each value metric are a function of both
the process
dynamics (consumption or production rates), and the financial dynamics (cost
or market value),
and since both process dynamics are real time by definition, and financial
dynamics are getting
faster, t must be set to a short timeframe for accuracy.
[0042] Implicit in the asset performance measurement structure presented
herein is that
the output of the asset or asset set under consideration has actual market
value. This is not always
CA 02924040 2016-03-18
12361
(INVN 12361.US)
the case since some intermediates in manufacturing and production processes
cannot really be
sold in the open market. For decades engineers have been working to assign
pseudo value to
these intermediates using sophisticated mathematical analyses. From a pure
business perspective
this approach to establishing pseudo values in invalid. Therefore, the basis
of this asset
performance measurement system is to only consider asset outputs that have
actual market value.
It may be necessary to group base assets into asset sets to utilize this
performance measurement
system correctly. The grouping into asset sets should be done to analyze the
assets to the value
point level, but it also can be done to get a broader picture of the value
produced by assets, and
may actually be done to the plant level or even the multiple plant level.
[0043] The Asset Value (AV(t)) metric provides a basis for understanding the
current
business performance of each asset or asset set. The key is to compare the
current asset value
with what the asset value would be if the asset were operating to its
potential. This can be
accomplished through the use of real-time process and asset models 912 of the
operation and its
assets. Therefore, using a model 912 of the ideal operation of the process and
its assets tied into
the automation system to get the current settings (set points etc.) for the
operation and the real-
time process sensor data of the live process, the potential asset value 914 (A
(t)) over the time
period t can be calculated using equipment ratings or best performance
operations levels.
[0044] With both the actual asset value and the potential asset value, the
asset
performance 918 (AP(t)) of the asset or asset set can be determine by
calculating:
AP(t)=(AVa(t) I AV (t))*100
[0045] This statistic provides a percentage that represents how the asset is
operating
from a business perspective. This statistic still does not convey the true
business "pain"
associated with underperformance of the asset in business potential terms.
This "pain" represents
the opportunity cost 920 (OC) to the operation from underperforming assets or
asset sets. This
can be accomplished by the equation:
11
CA 02924040 2016-03-18
= 12361
(INVN 12361.US)
OC(T)= I AV (t)- AV (t)
a
t=1
wherein T is the overall time period for the analysis and t represents the
individual time segments
at which the AV(t) calculation is done across T.
[0046] The overall structure of this asset performance measurement mechanism
is shown
in FIG. 10. This diagram shows a structure for the mechanism for the assets
and asset sets within
the domain of the automation system. This is the performance measurement
system 1000 for the
assets 1002 and does not indicate how the OC(t) or AV(t) metrics may be used
in decision
making. The asset or asset set 1002 receives material input 1004 and energy
input 1006 and
produces products 1008. The asset 1002 is connected by sensors to an
automation system 1010
of the performance measurement system 1000. A real-time asset model 1012
receives sensor data
from the asset 1002 and uses the sensor data to model the asset and determine
best potential
behavior based on the gathered sensor data. The asset model 1012 is used to
calculate the
potential asset value 1014 of the asset. Additionally, the sensor data is
received by an actual
asset value module, which calculates the actual asset value 1016 in real-time.
The actual asset
value 1016 and the potential asset value 1014 may be used by the automation
system 1010 to
calculate the asset performance 1018 and the opportunity cost value 1020. All
of these values
can be stored in a process historian 1022 and then accessed later on an
interface 1024 for
analysis and decision making with respect to actions taken for the asset 1002.
[0047] With the ability to measure asset value (AV(t)), asset performance
(AP(0) and
opportunity cost (OC(t)) for each value generating asset or asset set in an
operation, both
operations, maintenance and engineering will have new tools for evaluation and
decision making
associated with the operational assets of the organization. They will be able
to view the assets
from a business value perspective in order to make good business decisions for
the operation
based on asset impact.
[0048] One example of how these metric may be employed for intelligent
decision
making is to project the current OC(t) across different time frames to get an
economic measure
of the lost opportunity due to underperforming assets to determine maintenance
timing. If, for
example, the mean time to perform the required maintenance on an asset set is
ti, and the cost of
12
CA 02924040 2016-03-18
= 12361
(INVN 12361.US)
the required maintenance is cl, then maintenance can be automatically
triggered when the
projected OC(t/) exceeds cl. This may be automatically imposed through the
utilization of a
real-time workflow engine operating in the automation system. Other
relationships may be
identified that are better suited to both the operational and business
characteristics of the plant.
[0049] The premise that led to the development of a more business oriented
asset
performance measurement system was that such a system would encourage both
better business-
based decision-making in industrial operations while simultaneously
encouraging operations and
maintenance to collaborate to gain superior results. FIG. 5 shows vector 504
AP(t) as the
convergence metric for operations and maintenance. The vector 504 may also
work from a more
balanced set of metrics, AP(t), OC(t) and AV(7) as the convergence
information.
[0050] These asset performance measures may be utilized by maintenance,
operations
and engineering in order to have positive business impact on industrial
operations. Industrial
assets tend to degrade with time and utilization and since operational
parameters also tend to
change, it is critically important to analyze both the instantaneous values
and the historical
performance. With usage and experience with each asset and asset set it can be
expected that
asset performance dynamics and relationships will be discovered. These
relationships may be
used to develop automatic control responses to asset performance over time.
[0051] As an example, a crude unit in an oil refinery has crude oil as its
primary material
input. The crude is heated in a furnace to the point of evaporation then is
moved into a
distillation column where the vaporized crude ascends though the column. As
the vaporized
crude cools to the point at which it reaches temperature limits that cause
certain components of
the crude to liquefy, the liquefied components are captured in the column and
flow out as
purified components such as in as gasoline, kerosene, diesel oil and fuel oil.
Gas flows through
the top of the column and heavier residuals flow out the bottom for later
processing (see diagram
below). Each of the streams out of the crude unit has fundamental market
value. This unit
provides an interesting if complex unit to understand the concepts associated
with the
mechanism for measuring the business impact of industrial assets.
[0052] In FIG. 11, a distributed control system 1100 is installed in the
refinery and part
of the system responsibility is the control of the Crude Unit 822. An
enterprise resource planning
(ERP) system 1106 is installed and the relevant business metrics for the asset
performance
calculations are in the ERP database and accessible by the asset performance
measurement
13
CA 02924040 2016-03-18
12361
(INVN 12361.US)
system via business inputs 1104. Process instrumentation is installed in the
plant and connected
to the DCS by sensor inputs 1102 in order to enable the real-time models or
asset performance.
[0053] The basic Asset Performance Measurement system 1100 for the Crude Unit
822
contains instrumentation for measuring all of the key process measures around
the Crude Unit
(flows, temperatures etc.) connected via sensor inputs 1102 in real-time into
the distributed
control system (DCS) as shown in the diagram. Also connected into the DCS is
the enterprise
resource planning (ERP) system 1106 which will provide all relevant business
values via
business inputs 1104 (for instance, fuel cost, material cost, gas pricing,
gasoline pricing,
kerosene pricing, diesel oil, fuel oil pricing, and residual value) as often
as those values change
in the marketplace or at the level of transfer pricing established by the
company. These values
will be available to the Asset Performance Measurement Algorithm Executor 1108
in the
controllers of the DCS. The Asset Performance Measurement Algorithm Executor
1108 is
configured to execute the asset performance models in real-time that are
sourced by the sensor-
based data and the business information from the ERP system. The real-time
values calculated in
the Asset Performance Algorithm Executor 1108 are transferred to the Asset
Performance
History module 1110 in real-time and the Asset Performance History Module 1110
stores the
measures in a historical database 1112. The Asset Performance Display Engine
1114, again
typically within the DCS is preconfigured with dashboard displays for
Maintenance
professionals that are displayed on the Maintenance Station 1116, displays for
operators that are
displayed on the Operator Stations 1118, and displays for engineers that are
displayed on the
Engineering Stations 1120. This real-time decision support information will
enable all three
groups (Maintenance, Operators and Engineers) to perform their actions and
activities in a more
effective manner by providing real-time feedback of the impact of their
actions, but it will also
encourage collaboration and cooperation because these three teams will be
working to common
asset performance measures.
[0054] An exemplary snapshot of the asset performance of the Crude Unit over
an hour
is provided below. In actual operation, these measures may be continually
calculated and the
asset performance dashboard displays continually updated so the Maintenance,
Operations, and
Engineering personnel may continually monitor the performance and make ongoing
decisions on
how the asset performance might be improved. For the purposes of this example,
a simplified
14
CA 02924040 2016-03-18
= 12361
(INVN 12361.US)
model will be utilized to demonstrate the concept of the system. An actual
implementation may
be more rigorous, complex, and incorporate many more energy and material
sources.
[0055] The material input to the exemplary process is crude oil for which it
is assumed a
molecular model has previously been developed to provide an understanding of
the optimal
product mix that could be generated. The primary energy source is the fuel
used in the furnace to
heat the crude to vaporization. The product outputs are gas, gasoline,
kerosene, diesel oil, fuel oil
and residuals. The time period used for this example will be one hour of run
time. The costs and
production values are not necessarily representative of any actual refinery or
for any particular
time period.
[0056] Over the hour it is assumed that the price paid for the fuel used to
heat the crude
oil in the furnace changes every 15 minutes. The energy value is:
4
E (t) --=leci(t)*epi(t)
i=1
[0057] For each 15 minute period in the hour assume the following costs and
consumptions:
Table 1: Energy Consumption Cost
Cost/m3 Consumption (m3) Cost/Period
$15 60,000 $90,000
$18 75,000 $135,000
$13 62,000 $80,600
$16 80,000 $128,000
Total Cost $433,600
[0058] Assuming the material cost varies at most frequently every 10 minutes
across the
hour, the material cost profile is based on the following model.
CA 02924040 2016-03-18
= 12361
(1NVN 12361.US)
6
M(t) = MCi (t) * mpi (t)
i=1
[0059] For each 10 minute period in the hour assume the following costs and
consumptions:
Table 2: Oil Consumption Cost
Cost/Barrel Consumption (barrels) Cost/Period
$100 950 $95,000
$100 1000 $100,000
$110 960 $105,600
$110 900 $99,000
$105 1020 $107,100
$105 1000 $105,000
Total Cost $611,700
[0060] This would mean that the total cost of production for the hour under
consideration was $1,045,300.
[0061] The production value would need to be calculated for each product
produced
utilizing the following model:
P (t) = p (t) * pvi(t)
i=1
[0062] It is assumed that the price variability for each product made can
change every 15
minutes providing the following values:
16
CA 02924040 2016-03-18
12361
(INVN 12361.US)
Table 3: Production Value of Gas
Price Production Value/Period
$15 3000 $45,000
$18 3200 $57,600
$13 2800 $36,400
$16 3500 $56.000
Total Production Value $195,000
Table 4: Production Value of Gasoline
Price Production Value/Period
$2.50 80,000 $200,000
$2.50 85,000 $212,500
$2.50 72,000 $180,000
$2.50 75,000 $187,500
Total Production Value $780,000
Table 5: Production Value of Kerosene
Price Production Value/Period
$1.80 40,000 $72,000
$1.80 35,000 $63,500
$1.60 35,000 $56,000
$1.60 39,000 $62,400
Total Production Value $253,400
17
CA 02924040 2016-03-18
12361
(INVN 12361.US)
Table 6: Production Value of Diesel
Price Production Value/Period
$3.00 10,000 $30,000
$3.00 9,000 $27,000
$3.10 11,000 $34,100
$3.10 12,000 $37,200
Total Production Value $128,300
Table 7: Production Value of Fuel Oil
Price Production Value/Period
$2.00 4,000 $8,000
$2.20 3,800 $8,360
$2.20 4,200 $9,240
$2.30 3,900 $8,970
Total Production Value $34,570
Table 8: Production Value of Residuals
Price Production Value/Period
$1.00 3,000 $3,000
$1.00 3,200 $3,200
$1.00 2,800 $2,800
$1.00 2,900 $2,900
Total Production Value $11,000
[0063] Taken together this would provide a total production value for the
crude unit
during the hour of $1,403,170.
[0064] The Asset Value for the Crude Unit over the hour is the total
production value
less the total cost, or $1,403,107 - $1,045,300, resulting in an asset value
of $357,870.
18
CA 02924040 2016-03-18
=
12361
(INVN 12361.US)
[0065] The next step is to determine the potential asset value for the Crude
Unit using
the same crude composition and same energy and material cost as input to the
process. The
assumption is that energy and material input are not constraints on the
production. Since the
same energy and material costs will be used for the potential asset value,
only the potential
production values need be calculated. This is done for each component of
production (gas,
gasoline, kerosene, diesel, fuel oil and residuals) using the same market
prices but with
maximum potential production as follows.
Table 9: Potential Production Value of Gas
Price Production Value/Period
$15 3500 $52,500
$18 3500 $63,000
$13 3500 $45,500
$16 3500 $56,000
Total Production Value $217,000
Table 10: Potential Production Value of Gasoline
Price Production Value/Period
$2.50 85,000 $212,500
$2.50 85,000 $212,500
$2.50 85,000 $212,500
$2.50 85,000 $212,500
Total Production Value $850,000
19
CA 02924040 2016-03-18
= 12361
(INVN 12361.US)
Table 11: Potential Production Value of Kerosene
Price Production Value/Period
$1.80 40,000 $72,000
$1.80 40,000 $72,000
$1.60 40,000 $64,000
$1.60 40,000 $64,000
Total Production Value $272,000
Table 12: Potential Production Value of Diesel
Price Production Value/Period
$3.00 12,000 $36,000
$3.00 12,000 $36,000
$3.10 12,000 $37,200
$3.10 12,000 $37,200
Total Production Value $146,000
Table 13: Potential Production Value of Fuel Oil
Price Production Value/Period
$2.00 4,200 $8,400
$2.20 4,200 $9,240
$2.20 4,200 $9,240
$2.30 4,200 $9,660
Total Production Value $36,540
CA 02924040 2016-03-18
= 12361
(INVN 12361.US)
Table 14: Potential Production Value of Residuals
Price Production Value/Period
$1.00 3,200 $3,200
$1.00 3,200 $3,200
$1.00 3,200 $3,200
$1.00 3,200 $3,200
Total Production Value $12,800
[0066] Taken together this would provide a total potential production value
for the crude
unit during the hour of $1,534,340.
[0067] The potential Asset Value for the Crude Unit over the hour is the total
potential
production value less the total cost or $1,534,340 - $1,045,300, which is
$489,040. The
Opportunity Cost for the Crude Unit over the hour is given by the potential
Asset Value less the
actual Asset Value, or $489,040 - $357,870, which is $131,170. This represents
the incremental
value that the operation may have generated had it been operating to maximum
potential.
[0068] The Asset Performance of the Crude Unit over the hour is the ratio of
the actual
Asset Value over the potential Asset value, or 357,870/489,040, which is .74
or 74% in this case.
This represents the percentage to potential for the Crude Unit.
[0069] Finally, the Asset Performance vector for the hour can be characterized
by
AP(T), OC(T), and AV(T) which is (74%, $131,170, $489,040). The operations
personnel may
make changes to the process to increase the 74%, decrease the $131,170, and
increase the
489.040 going forward. This will be accomplished by providing real-time
feedback to
maintenance, operations and engineering on these three statistics and the
history of each. This
will allow each of these groups to perform their duties in a manner that will
maximize the asset
performance of the Crude Unit.
[0070] Maintenance teams may monitor the asset performance and determine when
the
opportunity cost increases to the point at which normal maintenance needs to
be carried out on
the unit. This can be done according to the economic value provided by the
maintenance as
compared with the lost opportunity created by delaying the maintenance. This
enables preventive
maintenance schedules to be developed by economic value rather than the
traditional periodic
schedule used in most industrial operations.
21
CA 02924040 2016-03-18
12361
(INVN 12361.US)
[0071] Operations may utilize the asset performance percentage to determine
the impact
of their actions on performance of the Crude Unit. If they can normally
operate at an 85% level
and are now having difficulty going over 74% they will know that there is a
critical root cause or
root causes that are reducing value in the operation. After adjusting the
operation of the process,
if they cannot get to the normal operating asset performance, they may
consider other actions,
like calling a meeting with maintenance and engineering personnel to try to
identify and fix the
root cause. Since operations, maintenance and engineering are measured using
the same asset
performance measures a more collaborative and cooperative environment may
result.
[0072] Engineering may use this information to evaluate both immediate and
long term
initiatives to increase the asset performance of the Crude Unit. The merits of
any initiative they
evaluate may be judged economically and not just technically since the asset
value and
opportunity cost may directly translate into a financials that will enable the
calculation of both
the ROI and cash flow improvements from any initiatives. If the engineers
conclude that some
advanced control strategics are required to increase the asset performance,
they may estimate the
expected asset performance improvement. Asset performance is directly tied to
opportunity cost
and asset value so the engineers can estimate the improvement value expected
from the
implementation of advanced controls and once the solution is implemented they
can directly
determine if the ROT and cash flow targets were achieved. This enables
industrial companies to
invest where they know they can get value.
[0073] The Abstract and summary are provided to help the reader quickly
ascertain the
nature of the technical disclosure. They are submitted with the understanding
that they will not
be used to interpret or limit the scope or meaning of the claims. The summary
is provided to
introduce a selection of concepts in simplified form that are further
described in the Detailed
Description. The summary is not intended to identify key features or essential
features of the
claimed subject matter, nor is it intended to be used as an aid in determining
the claimed subject
matter.
[0074] For purposes of illustration, programs and other executable program
components,
such as the operating system, are illustrated herein as discrete blocks. It is
recognized, however,
that such programs and components reside at various times in different storage
components of a
computing device, and are executed by a data processor(s) of the device.
22
CA 02924040 2016-03-18
= 12361
(INVN 12361.US)
[0075] Although described in connection with an exemplary computing system
environment, embodiments of the aspects of the invention are operational with
numerous other
general purpose or special purpose computing system environments or
configurations. The
computing system environment is not intended to suggest any limitation as to
the scope of use or
functionality of any aspect of the invention. The computing system environment
must have real-
time access to the sensor-based data associated with the asset or asset set.
Moreover, the
computing system environment should not be interpreted as having any
dependency or
requirement relating to any one or combination of components illustrated in
the exemplary
operating environment. Examples of well-known computing systems, environments,
and/or
configurations that may be suitable for use with aspects of the invention
include, but are not
limited to, personal computers, server computers, hand-held or laptop devices,
multiprocessor
systems, microprocessor-based systems, set top boxes, programmable consumer
electronics,
mobile telephones, network PCs, minicomputers, mainframe computers,
distributed computing
environments that include any of the above systems or devices, and the like.
[0076] Embodiments of the aspects of the invention may be described in the
general
context of data and/or processor-executable instructions, such as program
modules, stored one or
more tangible, non-transitory storage media and executed by one or more
processors or other
devices. Generally, program modules include, but are not limited to, routines,
programs, objects,
components, and data structures that perfoim particular tasks or implement
particular abstract
data types. Aspects of the invention may also be practiced in distributed
computing
environments where tasks are performed by remote processing devices that are
linked through a
communications network. In a distributed computing environment, program
modules may be
located in both local and remote storage media including memory storage
devices.
[0077] In operation, processors, computers and/or servers may execute the
processor-
executable instructions (e.g., software, firmware, and/or hardware) such as
those illustrated
herein to implement aspects of the invention.
[0078] Embodiments of the aspects of the invention may be implemented with
processor-executable instructions. The processor-executable instructions may
be organized into
one or more processor-executable components or modules on a tangible processor
readable
storage medium. Aspects of the invention may be implemented with any number
and
23
CA 02924040 2016-03-18
12361
(INVN 12361.US)
organization of such components or modules. For example, aspects of the
invention are not
limited to the specific processor-executable instructions or the specific
components or modules
illustrated in the figures and described herein. Other embodiments of the
aspects of the invention
may include different processor-executable instructions or components having
more or less
functionality than illustrated and described herein.
[0079] The order of execution or performance of the operations in embodiments
of the
aspects of the invention illustrated and described herein is not essential,
unless otherwise
specified. That is, the operations may be performed in any order, unless
otherwise specified, and
embodiments of the aspects of the invention may include additional or fewer
operations than
those disclosed herein. For example, it is contemplated that executing or
performing a particular
operation before, contemporaneously with, or after another operation is within
the scope of
aspects of the invention.
[0080] When introducing elements of aspects of the invention or the
embodiments
thereof, the articles "a," "an," "the," and "said" are intended to mean that
there are one or more
of the elements. The terms "comprising," "including," and "having" are
intended to be inclusive
and mean that there may be additional elements other than the listed elements.
[0081] In view of the above, it will be seen that several advantages of the
aspects of the
invention are achieved and other advantageous results attained.
[0082] Not all of the depicted components illustrated or described may be
required. In
addition, some implementations and embodiments may include additional
components.
Variations in the arrangement and type of the components may be made without
departing from
the spirit or scope of the claims as set forth herein. Additional, different
or fewer components
may be provided and components may be combined. Alternatively or in addition,
a component
may be implemented by several components.
[0083] The above description illustrates the aspects of the invention by way
of example
and not by way of limitation. This description enables one skilled in the art
to make and use the
aspects of the invention, and describes several embodiments, adaptations,
variations, alternatives
and uses of the aspects of the invention, including what is presently believed
to be the best mode
of carrying out the aspects of the invention. Additionally, it is to be
understood that the aspects
of the invention is not limited in its application to the details of
construction and the arrangement
of components set forth in the following description or illustrated in the
drawings. The aspects of
24
CA 02924040 2016-03-18
12361
(INVN 12361.US)
the invention are capable of other embodiments and of being practiced or
carried out in various
ways. Also, it will be understood that the phraseology and terminology used
herein is for the
purpose of description and should not be regarded as limiting.
[0084] Having described aspects of the invention in detail, it will be
apparent that
modifications and variations are possible without departing from the scope of
aspects of the
invention as defined in the appended claims. It is contemplated that various
changes could be
made in the above constructions, products, and process without departing from
the scope of
aspects of the invention. In the preceding specification, various preferred
embodiments have
been described with reference to the accompanying drawings. It will, however,
be evident that
various modifications and changes may be made thereto, and additional
embodiments may be
implemented, without departing from the broader scope of the aspects of the
invention as set
forth in the claims that follow. The specification and drawings are
accordingly to be regarded in
an illustrative rather than restrictive sense.
=