Note: Descriptions are shown in the official language in which they were submitted.
CA 02938854 2016-08-04
WO 2015/175032
PCT/US2015/014782
- 1 -
HIGH-STRENGTH ALPHA-BETA TITANIUM ALLOY
TECHNICAL FIELD
[0001] The present disclosure is related generally to titanium alloys and
more
particularly to alpha-beta titanium alloys having high specific strength.
BACKGROUND
[0002] The statements in this section merely provide background information
related to the present disclosure and may not constitute prior art.
[0003] Titanium alloys have been used for aerospace and non-aerospace
applications for years due to their high strength, light weight and excellent
corrosion resistance. In aerospace applications, the achievement of high
specific
strength (strength/density) is critically important, and thus weight reduction
is a
primary consideration in component design and material selection. The
application of titanium alloys in jet engine applications ranges from
compressor
discs and blades, fan discs and blades and casings. Common requirements in
these applications include excellent specific strength, superior fatigue
properties
and elevated temperature capabilities. In addition to properties,
producibility in
melting and mill processing and consistent properties throughout parts are
also
important.
[0004] Titanium alloys may be classified according to their phase structure
as
alpha (a) alloys, alpha-beta (a/) alloys or beta (13) alloys. The alpha phase
is a
close-packed hexagonal phase and the beta phase is a body-centered cubic
phase. In pure titanium, the phase transformation from the alpha phase to the
beta phase occurs at 882 C; however, alloying additions to titanium can alter
the
transformation temperature and generate a two-phase field in which both alpha
and beta phases are present. Alloying elements that raise the transformation
temperature and have extensive solubility in the alpha phase are referred to
as
alpha stabilizers, and alloying elements that depress the transformation
temperature, readily dissolve in and strengthen the beta phase and exhibit low
alpha phase solubility are known as beta stabilizers.
CA 02938854 2016-08-04
WO 2015/175032
PCT/US2015/014782
- 2 -
[0005] Alpha alloys contain neutral alloying elements (such as tin) and/or
alpha stabilizers (such as aluminum and/or oxygen). Alpha-beta alloys
typically
include a combination of alpha and beta stabilizers (such as aluminum and
vanadium in Ti-6A1-4V) and can be heat-treated to increase their strength to
various degrees. Metastable beta alloys contain sufficient beta stabilizers
(such
as molybdenum and/or vanadium) to completely retain the beta phase upon
quenching, and can be solution treated and aged to achieve significant
increases
in strength in thick sections.
[0006] Alpha-beta titanium alloys are often the alloys of choice for
aerospace
applications due to their excellent combination of strength, ductility and
fatigue
properties. Ti-6A1-4V, also known as Ti-64, is an alpha-beta titanium alloy
and is
also the most commonly used titanium alloy for airframe and jet engine
applications. Higher strength alloys such as Ti-550 (Ti-4A1-2Sn-4Mo-0.5Si), Ti-
6246 (Ti-6A1-2Sn-4Zr-6Mo) and Ti-17 (Ti-5A1-2Sn-2Zr-4Mo-4Cr) have also been
developed and are used when higher strength than achievable with Ti-64 is
required.
[0007] Table 1 summarizes the high strength titanium alloys currently used
in
aerospace applications, including jet engines and airframes, at low to
intermediate temperatures, where the densities of the alloys are compared. Ti-
64
is used as the baseline material due to its wide usage for aerospace
components.
As can be seen from the data in Table 1, most of the high strength alloys,
including alpha-beta and beta alloys, attain increased strength due to the
incorporation of larger concentrations of Mo, Zr and/or Sn, which in turn
leads to
cost and weight increases in comparison with Ti-64. The high strength
commercial alloys Ti-550 (Ti-4A1-2Sn-4Mo-0.5Si), Ti-6246 (Ti-6A1-2Sn-4Zr-6Mo)
and Ti-17 (Ti-5A1-2Sn-2Zr-4Mo-4Cr), which are used for jet engine discs,
contain
heavy alloying elements such as Mo, Sn and Zr, except for Ti-550 that does not
contain Zr. A typical density of high strength commercial alloys is 4-5%
higher
than the baseline Ti-64 alloy. A weight increase tends to have a more negative
impact on rotating components than on static components.
CA 02938854 2016-08-04
WO 2015/175032 PCT/US2015/014782
- 3 -
Table 1. Characteristics of various titanium alloys
Density
Category Alloy Composition Density Remarks
Woe lb/in3 increase %
Ti-64 Ti-6A1-4V 4.43 1.60 0.0% Comparison-Baseline
Ti-575 Ti-5.3A1-7.5V-0.5Si 4.50 1.63 1.6% Inventive
Example
Ti-6246 Ti-6A1-2Sn-4Zr-6Mo 4.65 1.68 5.0% Comparison
Ti-17 Ti-5A1-2Sn-2Zr-4Mo-
a/13 Alloy 4Cr 4.65 1.68 5.0% Comparison
Ti-550 Ti-4A1-2Sn-4Mo-0.5Si 4.60 1.66 3.8% Comparison
Ti-662 Ti-6A1-6V-2Sn 4.54 1.64 2.5% Comparison
Ti-62222 Ti-6A1-2Sn-2Zr-2Mo-
2Cr-0.2Si 4.65 1.68 5.0% Comparison
Beta C Ti-3AI-8V-6Cr-4Mo-
4Zr 4.82 1.74 8.8% Comparison
Ii Alloy Ti-10-23 Ti-10V-2Fe-3A1 4.65 1.68 5.0% Comparison
Ti-18 Ti-5V-5Mo-5.5A1-
2.3Cr-0.8Fe 4.65 1.68 5.0% Comparison
BRIEF SUMMARY
[0008] A novel alpha-beta titanium alloy (which may be referred to as
Timetal 575 or Ti-575 in the present disclosure) that may exhibit a yield
strength
at least 15% higher than that of Ti-6A1-4V under equivalent solution treatment
and aging conditions is described herein. The alpha-beta titanium alloy may
also
exhibit a maximum stress that is at least 10% higher than that of Ti-6A1-4V
for a
given number of cycles in low cycle fatigue and notch low cycle fatigue tests.
Furthermore, this novel titanium alloy, when appropriately processed, may
exhibit
simultaneously both higher strength and a similar ductility and fracture
toughness
in comparison to a reference Ti-6A1-4V alloy. This may ensure adequate damage
tolerance to enable the additional strength to be exploited in component
design.
[0009] According to one embodiment, the high-strength alpha-beta titanium
alloy may include Al at a concentration of from about 4.7 wt.% to about 6.0
wt.%;
V at a concentration of from about 6.5 wt.% to about 8.0 wt.%; Si at a
concentration of from about 0.15 wt.% to about 0.6 wt.%; Fe at a concentration
of
up to about 0.3 wt.%; Oat a concentration of from about 0.15 wt.% to about
0.23
wt.%; and Ti and incidental impurities as a balance. The alpha-beta titanium
- 4 -
alloy has an Al/V ratio of from about 0.65 to about 0.8, where the Al/V ratio
is
defined as the ratio of the concentration of Al to the concentration of V in
the alloy,
with each concentration being in weight percent (wt.%).
[0010] According to another embodiment, the high-strength alpha-beta
titanium
alloy may comprise Al at a concentration of from about 4.7 wt.% to about 6.0
wt.%;
V at a concentration of from about 6.5 wt.% to about 8.0 wt.%; Si and 0, each
at a
concentration of less than 1 wt.%; and Ti and incidental impurities as a
balance.
The alpha-beta titanium alloy has an Al/V ratio of from about 0.65 to about
0.8. The
alloy further comprises a yield strength of at least about 970 MPa and a
fracture
toughness of at least about 40 MPa= M112 at room temperature.
[0011] A method of making the high-strength alpha-beta titanium alloy
comprises forming a melt comprising: Al at a concentration of from about 4.7
wt.%
to about 6.0 wt.%; V at a concentration of from about 6.5 wt.% to about 8.0
wt.%; Si
at a concentration of from about 0.15 wt.% to about 0.6 wt.%; Fe at a
concentration
of up to about 0.3 wt.%; Oat a concentration of from about 0.15 wt.% to about
0.23
wt.%; and Ti and incidental impurities as a balance. An Al/V ratio is from
about 0.65
to about 0.8, the Al/V ratio being equal to the concentration of the Al
divided by the
concentration of the V in weight percent. The method further comprises
solidifying
the melt to form an ingot.
[0011a] An alpha-beta titanium alloy comprises Al at a concentration of
from
4.7 wt.% to 6.0 wt.%; V at a concentration of from 6.5 wt.% to 8.0 wt.%; Si at
a
concentration of from 0.15 wt. `)/0 to 0.6 wt.%; Fe at a concentration of up
to 0.3
wt.%; 0 at a concentration of from 0.15 wt.% to 0.23 wt.%; and Ti and
incidental
impurities as a balance, wherein an Al/V ratio is from 0.65 to 0.8, the Al/V
ratio
being equal to the concentration of the Al divided by the concentration of the
V in
weight percent, and wherein the Al/V ratio results in a specific yield
strength of at
least 220 kN =m/kg at room temperature and a fracture toughness of at least 40
MPa=m1/2 at room temperature.
[0011b] An alpha-beta titanium alloy comprises Al at a concentration of from
4.7
wt.% to 6.0 wt.%; V at a concentration of from 6.5 wt.% to 8.0 wt.%; Si and 0,
each
at a concentration of less than 1 wt.%; Ti and incidental impurities as a
balance,
wherein an Al/V ratio is from 0.65 to 0.8, the Al/V ratio being equal to the
concentration of the Al divided by the concentration
CA 2938854 2017-12-06
- 4a -
of the V in weight percent, and wherein the alloy comprises a specific yield
strength
of at least 220 kN=m/kg and a fracture toughness of at least 40 MPa= M112 at
room
temperature.
[0011c] A method of making an alpha-beta titanium alloy comprises forming
a melt comprises Al at a concentration of from 4.7 wt.% to 6.0 wt.%; V at a
concentration of from 6.5 wt.% to 8.0 wt.%; Si at a concentration of from 0.15
wt.%
to 0.6 wt.%; Fe at a concentration of up to 0.3 wt.%; 0 at a concentration of
from
0.15 wt.% to 0.23 wt.%; and Ti and incidental impurities as a balance, wherein
an
AIN ratio is from 0.65 to 0.8, the Al/V ratio being equal to the concentration
of the Al
divided by the concentration of the V in weight percent, wherein the Al/V
ratio
results in a specific yield strength of at least 220 kN =m/kg at room
temperature and
a fracture toughness of at least 40 MPa=m1/2 at room temperature; and
solidifying
the melt to form an ingot.
[0012] The terms "comprising," "including," and "having" are used
interchangeably throughout this disclosure as open-ended terms to refer to the
recited elements (or steps) without excluding unrecited elements (or steps).
BRIEF DESCRIPTION OF THE DRAWINGS
[0013] FIG. 1A shows phase diagrams of Ti-64 and Ti-575.
[0014] FIG. 1B shows the effect of heat treatments on the strength versus
elongation relationship for exemplary inventive alloys and Ti-64, the
comparative
baseline alloy.
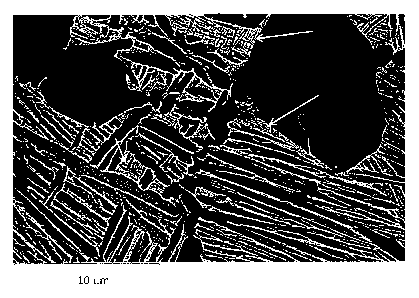
[0015] FIG. 2A shows a scanning electron microscope (SEM) image of a Ti-
575
alloy after solution treatment at 910 C for two hours followed by fan air
cooling, and
then aging at 500 C for eight hours, followed by air cooling.
CA 2938854 2017-12-06
CA 02938854 2016-08-04
WO 2015/175032
PCT/US2015/014782
- 5 -
[0016] FIG. 2B shows a scanning electron microscope (SEM) image of a Ti-
575 alloy after solution treatment at 910 C for two hours followed by air
cooling,
and then annealing at 700 C for two hours, followed by air cooling.
[0017] FIGs. 3A and 3B graphically show the results of tensile tests using
data
provided in Table 5 for the longitudinal and transverse directions,
respectively.
[0018] FIG. 3C graphically shows the results of tensile tests using data
provided in Table 6.
[0019] FIG. 4 graphically shows the results of low cycle fatigue tests
using
data provided in Table 9.
[0020] FIG. 5A graphically shows the results of tensile tests using data
provided in Tables 11 and 12.
[0021] FIG. 5B graphically shows the results of tensile tests using data
provided in Table 13.
[0022] FIG. 6A graphically shows the results of elevated temperature
tensile
tests using data provided in Table 14.
[0023] FIG. 6B graphically shows the results of standard (smooth surface)
low
cycle fatigue and dwell time low cycle fatigue tests.
[0024] FIG. 6C graphically shows the results of notch low cycle fatigue
tests.
[0025] FIG. 6D graphically shows the results of fatigue crack growth rate
tests.
DETAILED DESCRIPTION
[0026] A high-strength alpha-beta titanium alloy has been developed and is
described herein. The alpha-beta titanium alloy includes Al at a concentration
of
from about 4.7 wt.% to about 6.0 wt.%; V at a concentration of from about 6.5
wt.% to about 8.0 wt.%; Si at a concentration of from about 0.15 wt. % to
about
0.6 wt.%; Fe at a concentration of up to about 0.3 wt.%; 0 at a concentration
of
from about 0.15 wt.% to about 0.23 wt.%; and Ti and incidental impurities as a
balance. The alpha-beta titanium alloy, which may be referred to as Timetal
e575
or Ti-575 in the present disclosure, has an Al/V ratio of from about 0.65 to
about
0.8, where the Al/V ratio is defined as the ratio of the concentration of Al
to the
CA 02938854 2016-08-04
WO 2015/175032
PCT/US2015/014782
- 6 -
concentration of V in the alloy (each concentration being in weight percent
(wt%)).
[0027] The alpha-beta titanium alloy may optionally include one or more
additional alloying elements selected from among Sn and Zr, where each
additional alloying element is present at a concentration of less than about
1.5
wt.%, and the alloy may also or alternatively include Mo at a concentration of
less
than 0.6 wt.%. Carbon (C) may be present at a concentration of less than about
0.06 wt.%.
[0028] In some embodiments, the alpha-beta titanium alloy may include Al at
a
concentration of from about 5.0 to about 5.6 wt.%; V at a concentration of
from
about 7.2 wt.% to about 8.0 wt.%; Si at a concentration of from about 0.20
wt.%
to about 0.50 wt.%; C at a concentration of from about 0.02 wt.% to about 0.08
wt.%; 0 at a concentration of from about 0.17 wt.% to about 0.22 wt.%, and Ti
and incidental impurities as a balance. For example, the alloy may have the
formula: Ti-5.3 Al-7.7V-0.2Fe-0.45Si-0.03C-0.200, where the concentrations are
in wt.%.
[0029] Individually, each of the incidental impurities may have a
concentration
of 0.1 wt.% or less. Together, the incidental impurities may have a total
concentration of 0.5 wt.% or less. Examples of incidental impurities may
include
N, Y, B, Mg, Cl, Cu, H and/or C.
[0030] Since Ti accounts for the balance of the titanium alloy composition,
the
concentration of Ti in the alpha-beta Ti alloy depends on the amounts of the
alloying elements and incidental impurities that are present. Typically,
however,
the alpha-beta titanium alloy includes Ti at a concentration of from about 79
wt.%
to about 90 wt.%, or from about 81 wt.% to about 88 wt.%.
[0031] An explanation for the selection of the alloying elements for the
alpha-
beta titanium alloy is set forth below. As would be recognized by one of
ordinary
skill in the art, Al functions as an alpha phase stabilizer and V functions as
a beta
phase stabilizer.
[0032] Al may strengthen the alpha phase in alpha/beta titanium alloys by a
solid solution hardening mechanism, and by the formation of ordered Ti3A1
CA 02938854 2016-08-04
WO 2015/175032
PCT/US2015/014782
- 7 -
precipitates (shown in FIG. 1 as "0019 TI3AL"). Al is a lightweight and
inexpensive alloying element for titanium alloys. If the Al concentration is
less
than about 4.7 wt.%, sufficient strengthening may not be obtained after a heat
treatment (e.g., a STA treatment). If the Al concentration exceeds 6.0 wt.%,
an
excessive volume fraction of ordered Ti3A1 precipitates, which may reduce the
ductility of the alloy, may form under certain heat treatment conditions.
Also, an
excessively high Al concentration may deteriorate the hot workability of the
titanium alloy, leading to a yield loss due to surface cracks. Therefore, a
suitable
concentration range of Al is from about 4.7 wt.% to about 6.0 wt.%.
[0033] V is a beta stabilizing element that may have a similar
strengthening
effect as Mo and Nb. These elements may be referred to as beta-isomorphous
elements that exhibit complete mutual solubility with beta titanium. V can be
added to titanium in amounts up to about 15 wt.%; however, at such titanium
concentrations, the beta phase may be excessively stabilized. If the V content
is
too high, the ductility is reduced due to a combination of solid solution
strengthening, and refinement of the secondary alpha formed on cooling from
solution treatment. Accordingly, a suitable V concentration may range from
about
6.5 wt.% to about 8.0 wt.%. The reason for selecting V as a major beta
stabilizer
for the high strength alpha-beta titanium alloys disclosed herein is that V is
a
lighter element among various beta stabilizing elements, and master alloys are
readily available for melting (e.g., vacuum arc remelting (VAR) or cold hearth
melting). In addition, V has fewer issues with segregation in titanium alloys.
A Ti-
Al-V alloy system has an additional benefit of utilizing production experience
with
Ti-6A1-4V throughout the titanium production process ¨ from melting to
conversion. Also, Ti-64 scrap can be utilized for melting, which could reduce
the
cost of the alloy ingot.
[0034] By controlling the Al/V ratio to between 0.65 and 0.80, it may be
possible obtain a titanium alloy having good strength and ductility. If the
Al/V
ratio is smaller than 0.65, the beta phase may become too stable to maintain
the
alpha/beta structure during thermo-mechanical processing of the material. If
the
CA 02938854 2016-08-04
WO 2015/175032
PCT/US2015/014782
- 8 -
Al/V ratio is larger than 0.80, hardenability of the alloy may be deteriorated
due to
an insufficient amount of the beta stabilizer.
[0035] Si can increase the strength of the titanium alloy by a solid
solution
mechanism and also a precipitation hardening effect through the formation of
titanium silicides (see Fig. 5B). Si may be effective at providing strength
and
creep resistance at elevated temperatures. In addition, Si may help to improve
the oxidation resistance of the titanium alloy. The concentration of Si in the
alloy
may be limited to about 0.6% since an excessive amount of Si may reduce
ductility and deteriorate producibility of titanium billets raising crack
sensitivity. If
the content of Si is less than about 0.15%, however, the strengthening effect
may
be limited. Therefore, the Si concentration may range from about 0.15 wt.% to
about 0.60 wt.%.
[0036] Fe is a beta stabilizing element that may be considered to be a beta-
eutectoid element, like Si. These elements have restricted solubility in alpha
titanium and may form intermetallic compounds by eutectoid decomposition of
the beta phase. However, Fe is known to be prone to segregation during
solidification of ingots. Therefore, the addition of Fe may be less than 0.3%,
which is considered to be within a range that does not create segregation
issues,
such as "beta fleck" in the microstructure of forged products.
[0037] Oxygen (0) is one of the strongest alpha stabilizers in titanium
alloys.
Even a small concentration of 0 may strengthen the alpha phase very
effectively;
however, an excessive amount of oxygen may result in reduced ductility and
fracture toughness of the titanium alloy. In Ti-Al-V alloy system, the maximum
concentration of 0 may be considered to be about 0.23%. If the 0 concentration
is less than 0.15%, however, a sufficient strengthening effect may not be
obtained. The addition of other beta stabilizing elements or neutral elements
selected from among Sn, Zr and Mo typically does not significantly deteriorate
strength and ductility, as long as the addition is limited to about 1.5 wt.%
for each
of Sn and Zr, and 0.6 wt.% for Mo.
[0038] Although any of a variety of heat treatment methods may be applied to
the titanium alloy, solution treatment and age (STA) may be particularly
effective
CA 02938854 2016-08-04
WO 2015/175032
PCT/US2015/014782
- 9 -
at maximizing strength and fatigue properties while maintaining sufficient
ductility,
as discussed further below. A strength higher than that of Ti-64 by at least
by
15% may be obtained using STA even after air cooling from the solution
treatment temperature. This is beneficial, as the center of large billets or
forgings
tend to be cooled slower than the exterior even when a water quench is
applied.
[0039] The Si and 0 contents may be controlled to obtain sufficient
strength at
room and elevated temperatures after STA heat treatment without deteriorating
other properties, such as elongation and low cycle fatigue life. The present
disclosure also demonstrates that the Si content can be reduced when fracture
toughness is critical for certain applications.
[0040] Figure lA shows phase diagrams of Ti-64 and Ti-575, the new high
strength alpha/beta titanium alloy. The calculation was performed using
PANDATTm (CompuTherm LLC, Madison, WI). There are several notable
differences between the two phase diagrams. Firstly, an amount of the Ti3A1
phase in Ti-575 is less than in Ti-64. This may indicate that Ti-575 has less
risk
of ductility loss due to heat cycles at intermediate temperatures. Secondly,
Ti-575
has a lower beta transus temperature, more beta phase at given heat treatment
temperatures in the alpha/beta range, and a higher proportion of residual beta
phase stable at low temperatures.
[0041] Following solution treatment and aging (STA), the alpha-beta
titanium
alloy may exhibit a yield strength at least 15% higher than that of Ti-6A1-4V
processed using the same STA treatment. Figure 1B shows the effect of heat
treatment on the strength of Ti-575, and on a reference sample of Ti-64. The
graph shows multiple data points for Ti-575 in the mill annealed and STA
condition, arising from samples of varying experimental composition. In the
mill
annealed (700 C) condition, Ti-575 exhibits the expected trend in which higher
strength is accompanied by reduced ductility. In the STA condition (solution
treated at 910 C for 2 hours and then fan air cooled, followed by aging at 500
C
for 8 hours and air cooling) the strength of the Ti-575 samples is higher. The
ductility would conventionally be expected to be correspondingly reduced so as
to
lie on the same trend line as the results from the mill annealed samples. In
CA 02938854 2016-08-04
WO 2015/175032
PCT/US2015/014782
- 10 -
practice, however, the results for the STA condition are shifted to an
approximately parallel trend line. This unexpected result is the basis for the
improved combination of mechanical properties offered by Ti-575 relative to Ti
6-
4. In addition to improved strength, the alpha-beta titanium alloy may also
show
a fatigue stress at least 10% higher than that of Ti-6A1-4V for a given number
of
cycles in low cycle fatigue and notch low cycle fatigue tests.
[0042] Figure 2A shows a scanning electron microscope (SEM) images of an
exemplary Ti-575 alloy that has been solution treated at 910 C for 2 hours and
then fan air cooled, followed by aging at 500 C for 8 hours and then air
cooling.
In Figure 2A, the microstructure of the alloy includes globular primary alpha
phase particles; laths of secondary alpha in a beta phase matrix, formed
during
cooling from solution treatment; and tertiary alpha precipitates within the
beta
phase in the transformed structure, as indicated by the arrows. During
solution
treatment, the alloying elements in Ti-575 partition into the alpha and beta
phases according to their affinities. During cooling from solution treatment,
the
secondary laths grow at a rate limited by the need to redistribute the solute
elements. Since Ti-575 contains a higher proportion of beta stabilizing
elements
than Ti 64, the equilibrium proportion of beta phase at a given temperature is
higher, and the kinetic barrier to converting beta to alpha is higher, so that
for a
given cooling curve, a higher proportion of beta phase may be retained in Ti-
575.
On subsequent aging at lower temperatures, the retained beta phase
decomposes giving fine precipitates/tertiary laths of alpha phase and residual
beta phase ¨ PAN DAT predicts about 9% in Ti-575, compared to about 3% in Ti
64. This combination of finer grain size and networks of residual ductile beta
phase is believed to enable the improved ductility and fracture toughness for
the
STA condition shown in Figure 1B and various examples below. Also during
aging, on a scale too fine to resolve in Figure 2A, the formation of silicide
and
carbide precipitates, and ordering of the alpha phase by aluminium and oxygen,
are believed to occur and may augment the strength of the alloy. FIG. 2B shows
a scanning electron microscope (SEM) image of a Ti-575 alloy after solution
treatment at 910 C for two hours followed by air cooling, and then annealing
at
CA 02938854 2016-08-04
WO 2015/175032
PCT/US2015/014782
- 1 1 -
700 C for two hours, followed by air cooling. This microstructure is coarser,
lacking the tertiary alpha precipitates, and is consistent with the lower
strength
and ductility of the alloy in the annealed condition.
[0043] In other circumstances where it is preferable for the
thermomechanical
work or primary heat treatment of the alloy to be made above the beta transus,
the primary alpha morphology may be coarse/acicular laths, but the principles
of
beta phase retention and subsequent decomposition with simultaneous
precipitation of strengthening phases can still be applied to optimize the
mechanical properties of the alloy.
[0044] As supported by the examples below, the high-strength alpha-beta
titanium alloy may have a yield strength (0.2% offset yield stress or proof
stress)
at room temperature of at least about 965 MPa. The yield strength may also be
least about 1000 MPa, at least about 1050 MPa, or at least about 11 00 MPa.
The yield strength may be at least about 15% higher than the yield strength of
a
Ti-6A1-4V alloy processed under substantially identical solution treatment and
aging conditions. Depending on the composition and processing of the alpha-
beta titanium alloy, the yield strength may be as high as about 1200 MPa, or
as
high as about 1250 MPa. For example, the yield strength may range from about
965 MPa to about 1000 MPa, from about 1 000 MPa to about 1050 MPa, or from
about 1050 MPa to about 1100 MPa, or from about 1100 MPa to about 1200
MPa. The modulus of the alpha-beta titanium alloy may be from about 105 GPa
to about 120 GPa, and in some cases the modulus may be from about 111 GPa
to about 115 GPa.
[0045] With proper design of the alloy composition, the high-strength alpha-
beta titanium alloy may also exhibit a good strength-to-weight ratio, or
specific
strength, where the specific strength of a given alloy composition may be
defined
as 0.2% proof stress (or 0.2% offset yield stress) (MPa) divided by density
(g/cm3). For example, the high-strength alpha-beta titanium alloy may have a
specific strength at room temperature of at least about 216 kN=m/kg, at least
about 220 kN=m/kg, at least about 230 kN=m/kg, at least about 240 kl\I=m/kg,
or at
least about 250 kN=m/kg, where, depending on the composition and processing
CA 02938854 2016-08-04
WO 2015/175032
PCT/US2015/014782
- 12 -
of the alloy, the specific strength may be as high as about 265 kN=m/kg.
Typically, the density of the high-strength alpha-beta titanium alloy falls in
the
range of from about 4.52 g/cm3 to about 4.57 g/cm3, and may in some cases be
in the range of from about 4.52 g/cm3 and 4.55 g/cm3.
[0046] As discussed above, the high-strength alpha-beta titanium alloy may
exhibit a good combination of strength and ductility. Accordingly, the alloy
may
have an elongation of at least about 10%, at least about 12%, or at least
about
14% at room temperature, as supported by the examples below. Depending on
the composition and processing of the alloy, the elongation may be as high as
about 16% or about 17%. Ideally, the high strength alpha-beta titanium alloy
exhibits a yield strength as set forth above in addition to an elongation in
the
range of about 10 to about 17%. The ductility of the alloy may also or
alternatively
be quantified in terms of fracture toughness. As set forth in Table 11 below,
the
fracture toughness of the high-strength alpha-beta titanium alloy at room
temperature may be at least about 40 MPa=m1/2, at least about 50 MPa=m1t2, at
least about 65 MPa=m1/2, or at least about 70 MPa=m1/2. Depending on the
composition and processing of the alloy, the fracture toughness may be as high
as about 80 MPa-m1/2.
[0047] The high-strength alpha-beta titanium alloy may also have excellent
fatigue properties. Referring to Table 9 in the examples below, which
summarizes
the low cycle fatigue data, the maximum stress may be, for example, at least
about 950 M Pa at about 68000 cycles. Generally speaking, the alpha-beta
titanium alloy may exhibit a maximum stress at least about 10% higher than the
maximum stress achieved by a Ti-6A1-4V alloy processed under substantially
identical solution treatment and aging conditions for a given number of cycles
in
low cycle fatigue tests.
[0048] A method of making a high-strength alpha-beta titanium alloy
includes
forming a melt comprising: Al at a concentration of from about 4.7 wt.% to
about
6.0 wt.%; V at a concentration of from about 6.5 wt.% to about 8.0 wt.%; Si at
a
concentration of from about 0.15 wt. A to about 0.6 wt.%; Fe at a
concentration
of up to about 0.3 wt.%; Oat a concentration of from about 0.15 wt.% to about
CA 02938854 2016-08-04
WO 2015/175032
PCT/US2015/014782
-13-
0.23 wt.%; and Ti and incidental impurities as a balance. An Al/V ratio is
from
about 0.65 to about 0.8, where the Al/V ratio is equal to the concentration of
the
Al divided by the concentration of the V in weight percent. The method further
comprises solidifying the melt to form an ingot.
[0049] Vacuum arc remelting (VAR), electron beam cold hearth melting, and/or
plasma cold hearth melting may be used to form the melt. For example, the
inventive alloy may be melted in a VAR furnace with a multiple melt process,
or a
combination of one of the cold hearth melting methods and VAR melting may be
employed.
[0050] The method may further comprise thermomechanically processing the
ingot to form a workpiece. The thermomechanical processing may entail open
die forging, closed die forging, rotary forging, hot rolling, and/or hot
extrusion. In
some embodiments, break down forging and a series of subsequent forging
procedures may be similar to those applied to commercial alpha/beta titanium
alloys, such as Ti-64.
[0051] The workpiece may then undergo a heat treatment to optimize the
mechanical properties (e.g., strength, fracture toughness, ductility) of the
alloy.
The heat treating may entail solution treating and aging or beta annealing.
The
heat treatment temperature may be controlled relative to the beta transus of
the
titanium alloy. In a solution treatment and age process, the workpiece may be
solution treated at a first temperature from about 150 C to about 25 C below
beta
transus, followed by cooling to ambient temperature by quenching; air cooling;
or
fan air cooling, according to the section of the workpiece and required
mechanical properties. The workpiece may then be aged at a second
temperature in the range of from about 400 C to about 625 C.
[0052] The strengthening effect of the STA heat treatment may be evident
when alpha-beta Ti alloys processed by STA are compared to alpha-beta Ti
alloys processed by mill annealing. The strengthening may be due at least in
part
to stabilization of the beta phase by vanadium to avoid decomposition to
coarse
alpha laths plus thin beta laths, even after air cool. Fine alpha particles,
silicides,
and carbides can be precipitated during the aging step, which can be a source
of
CA 02938854 2016-08-04
WO 2015/175032
PCT/US2015/014782
- 14 -
higher strength. In beta annealing, the workpiece may be heated to a
temperature slightly above the beta transus of the titanium alloy for a
suitable
time duration, followed by cooling (e.g., fan cooling or water quenching).
Subsequently, the workpiece may be stress relieved; aged; or solution treated
and aged.
[0053] As would be recognized by one of ordinary skill in the art, the beta
transus for a given titanium alloy can be determined by metallographic
examination or differential thermal analysis.
Example A
[0054] 10 button ingots weighing about 200 grams were made. Chemical
compositions of the ingots are given in Table 2. In the table, Alloys 32 and
42 are
exemplary Ti-575 alloys. Alloy 42 contains less than 0.6 wt.% Mo. Alloy Ti-64-
2
has a similar composition to the commercial alloy Ti-64, which is a
comparative
alloy. Alloy 22 is a comparative alloy containing a lower concentration of
vanadium. As a result, the Al/V ratio of the alloy 22 is higher than 0.80.
Alloy 52 is
Ti-64 alloy with a silicon addition; it is a comparative alloy as Al is too
high and V
is too low to satisfy the desired Al/V ratio.
[0055] The ingots were hot rolled to 0.5" (13 mm) square bars, and a
solution
treatment and age (STA) was applied to all of the bars. Tensile tests were
performed on the bars after the STA at room temperature. Table 3 shows the
results of the tensile tests.
Table 2. Chemical composition (in wt.%) and calculated density of experimental
alloys
ID Al V Si Fe 0 Mo Density Remarks
dcm3
Ti-64-2 6.60 4.11 0.01 0.17 0.202 0.001 1.61 4.45 Comparative
Alloy
5.39 6.42 0.48 0.25 0.200 0.002 0.84 4.50
22 Comparative
Alloy Inventive
5.42 7.41 0.50 0.22 0.198 0.002 0.73 4.52
32 Example
Alloy Inventive
5.41 6.90 0.52 0.20 0.201 0.57 0.78 4.54
42 Example
Alloy
6.66 4.18 0.46 0.17 0.202 0.001 1.59 4.44
52 Comparative
CA 02938854 2016-08-04
WO 2015/175032 PCT/US2015/014782
- 15 -
[0056] Table 3 shows the tensile properties of the alloys after STA. Alloy
32
and 42 show noticeably higher proof strength or stress (PS) and ultimate
tensile
strength or stress (UTS) (0.2% PS>160 ksi (1107 MPa) and UTS>180 ksi (1245
MPa) than the comparative alloys. They also exhibit a higher specific
strength,
with values of 251 kN=m/kg and 263 kN=m/kg for alloys 32 and 42. Solution
treatment and aging at a lower temperature for a longer time (500 C/8hrs/AC)
give rise to increased strength with sufficiently high ductility in the
titanium alloys
of the present disclosure.
Table 3. Tensile properties at room temperature after STA heat treatment
Specific Specific
Strength Strength
ID Heat Treatment Remarks
0.2%PS UTS Elong. RA (0.2%PS) (UTS)
MPa ksi MPa ksi % kN=m/kg kN=m/kg
Ti- 950 C/1hr/AC +
64-2 500 C/8hrs/AC 921 133.6 1035 150.1 19.0 40.5 206.9 232.5 Comparative
Alloy 930 C/1hr/AC +
22 500 C/8hrs/AC 1082 156.9 1211 175.6 15.0 38.0 240.3 268.9 Comparative
Alloy 900 C/1hr/AC + Inventive
32 500 C/8hrs/AC 1134 164.5 1248 181.0 17.5 46.5 251.1 276.3 Example
Alloy 900 C/1hr/AC + Inventive
42 500 C/8hrs/AC 1193 173.0 1304 189.1 14.5 36.0 262.8 287.2 Example
Alloy 950 C/1hr/AC +
52 500 C/8hrs/AC 1071 155.3 1167 169.3 17.5 35.0 241.1 262.7 Comparative
Example B
[0057] Eleven titanium alloy ingots were melted in a laboratory VAR
furnace.
The size of each of the ingots was 8" (203 mm) diameter with a weight of about
70 lbs (32 kg). Chemical compositions of the alloys are listed in Table 4. In
the
table, the Al/V ratio is given for each alloy. Alloys 69, 70, 72, 75, 76 and
85 are
inventive alloys. Alloy 71 is a comparative alloy as the Si content is lower
than
0.15%. Alloy 74 is a comparative Ti-64 alloy. Alloy 86 is a variation of Ti-64
with
higher Al, higher V and higher 0 as compared with Alloy 74. Alloys 87 and 88
are
comparative alloys containing lower concentrations of Al and higher
concentrations of V. Alloy 75 and 88 contain approximately 1 wt.% of Zr and 1
wt.% each of Sn and Zr, respectively.
CA 02938854 2016-08-04
WO 2015/175032
PCT/US2015/014782
- 16 -
Table 4. Chemical composition (wt.%) and calculated density of experimental
alloys
ID Al V Fe Sn Zr Si C 0 N Al/V Density
g/cm3 Remarks
Alloy Inventive
69 4.93 7.36 0.22 0.01 0.00 0.45 0.030 0.190 0.006 0.67 4.53 Example
Alloy Inventive
70 5.04 7.40 0.21 0.01 0.00 0.29 0.028 0.163 0.005 0.68 4.53 Example
Alloy
71 5.13 7.56 0.21 0.01 0.00 0.09 0.030 0.159 0.006 0.68 4.53 Comparison
Alloy Inventive
72 5.01 7.20 0.21 0.96 0.00 0.31 0.030 0.160 0.007 0.70 4.55 Example
Alloy Inventive
75 5.31 7.69 0.22 0.01 1.14 0.29 0.032 0.166 0.004 0.69 4.55 Example
Alloy Inventive
76 5.10 7.42 0.20 0.98 0.92 0.30 0.032 0.163 0.007 0.69 4.57 Example
Alloy
74 6.16 4.03 0.19 0.01 0.00 0.02 0.027 0.176 0.004 1.53 4.46 Comparison
Alloy Inventive
85 4.96 7.46 0.21 0.02 0.00 0.45 0.056 0.188 0.006 0.67 4.53 Example
Alloy
86 6.79 4.37 0.20 0.02 0.00 0.02 0.036 0.185 0.008 1.55 4.45 Comparison
Alloy
87 5.52 9.29 0.33 0.02 0.00 0.52 0.055 0.212 0.011 0.59 4.55 Comparison
Alloy
88 6.06 9.01 0.21 1.06 1.13 0.37 0.031 0.187 0.007 0.67 4.58 Comparison
[0058] These ingots were soaked at 2100 F (1149 C) followed by forging to
produce 5" (127 mm) square billets from 8" (203 mm) round ingots. Then, a
first
portion of the billet was heated at about 75 F (42 C) below the beta transus
and
then forged to a 2" (51 mm) square bar. A second portion of the 5" (127 mm)
square billet was heated at about 75 F below the beta transus and then forged
to
a 1.5" (38 mm) thick plate. The plate was cut into two parts. One part was
heated
at 50 F (28 C) below the beta transus and hot rolled to form a 0.75" (19 mm)
plate. The other part of Alloys 85-88 were heated at 108 F (60 C) below the
beta
transus and hot-rolled to 0.75" (19 mm) plates.
[0059] Tensile coupons were cut along both the longitudinal (L) and
transverse
(T) directions from the 0.75" (019 mm) plates. These coupons were solution
treated at 90 F (50 C) below the beta transus for 1.5 hours, and then air
cooled
to ambient temperature followed by aging at 940 F (504 C) for 8 hours,
followed
by air cooling. Tensile tests were performed at room temperature in accordance
CA 02938854 2016-08-04
WO 2015/175032
PCT/US2015/014782
- 17 -
with ASTM E8. Two tensile tests were performed for each condition; therefore,
each of the values in Tables 5-6 represent the average of two tests.
[0060] Table 5 shows the results of room temperature tensile tests of 0.75"
(19
mm) plates after STA heat treatment. Figures 3A and 3B display the
relationship
between 0.2% PS and elongation using the values in Table 5 for the
longitudinal
and transverse directions, respectively. In the figures, a top-right square
surrounded by two dotted lines is a target area for a good balance of strength
and
ductility. As a general trend, a trade-off between strength and elongation can
be
observed in most of the titanium alloys. The inventive alloys exhibit a good
balance of strength and ductility, exhibiting a 0.2% PS higher than about 140
ksi
(965 M Pa) (typically higher than 150 ksi (1034 MPa)) and elongation higher
than
10%. The specific strengths for the exemplary inventive titanium alloys lie
between about 225 kN=m/kg and 240 kN=m/kg (based on 0.2% PS). It should be
noted that the elongation for Alloy 85 was 9.4%, which is the average of the
elongation of two tests, 10.6% and 8.2%, respectively. The result indicates
that
Alloy 85 is at a borderline of the range of preferred titanium alloy
compositions,
which may be due to the higher C and higher Si contents of the alloy.
C
t..,
=
Table 5. Results of tensile tests at room temperature after STA heat treatment
u.
-.1
u,
=
w
Specific
Specific n.)
Direction 0.2%PS UTS El RA Modulus
Strength Strength Remarks
ID Alloy
(0.2%PS) (UTS)
MPa ksi M Pa ksi % %
GPa msi kN=m/kg kN=mtkg
Alloy 69 Ti-5.3A1-7.5V-0.5Si Long 1047 151.8 1145 166.1
12.3 33.8 114 16.6 231.2 253.0 Inventive Example
Alloy 70 Ti-5.3A1-7.5V-0.35Si Long 1025 148.7 1115
161.7 13.9 47.5 114 16.6 226.4 246.2 Inventive Example
R
Alloy 71 Ti-5.3A1-7.5V-0.1Si Long 972
141.0 1053 152.7 15.1 42.9 118 17.1 214.4 232.2
Comparison o
N,
w
u,
Alloy 72 Ti-5.3A1-7.5V-1Sn-0.35Si Long 1041 151.0
1132 164.2 14.0 42.5 114 16.6 228.7 248.7 Inventive
Example . t
Alloy 75 Ti-5.3A1-7.5V-1Zr-0.35Si Long 1067 154.7
1198 173.8 10.4 27.8 113 16.4 234.3 263.3
Inventive Example ' .,
.
,
Alloy 76 Ti-5.3A1-7.5V-1Sn-1Zr-0.355i Long 1075 155.9
1211 175.6 11.8 36.0 111 16.1 235.0 264.8
Inventive Example o
..
Alloy 74 Ti-6.15AI-4.15V Long 889 128.9 989
143.4 12.6 30.4 117 17.0 199.3 221.7 Comparison
Ti-5.3AI-7.5V-0.5Si-0.05C-
Alloy 85 Long 1050 152.3 1163 168.7 11.5 28.9 113 16.4
232.0 256.9 Inventive Example
0.190
Alloy 86 Ti- 6.5A1-4.15V-0.025C-0.20 Long 893 129.5
973 141.1 14.9 47.9 117 17.0 200.5 218.4 Comparison
Alloy 87 Ti-5.8A1-9V-0.5Si-0.05C-0.210 Long 1159 168.1 1275
184.9 9.0 24.3 114 16.6 254.9 280.4 Comparison
Ti-5.8A1-8.5V-1Sn-1Zr-0.35Si-
Alloy 88 Long 1121 162.6 1258
182.4 11.0 33.1 111 16.1 244.5 274.3 Comparison
0.025C-0.190
od
el
Alloy 69 Ti-5.3A1-7.5V-0.5Si Trans 1025 148.7 1128
163.6 12.4 37.8 112 16.3 226.5 249.2 Inventive Example
cr
1..)
Alloy 70 Ti-5.3A1-7.5V-0.35Si Trans 1027 149.0 1111
161.2 12.3 42.0 115 16.7 226.8 245.4 Inventive Example
1--L
un
Alloy 71 Ti-5.3A1-7.5V-0.1Si Trans 945
137.1 1018 147.6 13.1 43.4 105 15.3 208.5 224.4
Comparison
1-L
--4
00
LV
1-L
JI
Specific
Specific
Direction 0.2`)/oPS UTS
El RA Modulus Strength Strength Remarks
ID Alloy
(0.2 /0PS)
(UTS)
MPa ksi MPa ksi % GPa
msi kl\1=m/kg kN = mtkg
Alloy 72 Ti-5.3A1-7.5V-1Sn-0.35Si Trans 1054 152.8
1133 164.3 14.0 46.2 115 16.7 231.4 248.8 Inventive Example
Alloy 75 Ti-5.3A1-7.5V-1Zr-0.35Si Trans 1051 152.5
1184 171.7 11.8 41.4 111 16.1 231.0 260.1 Inventive Example
Alloy 76 Ti-5.3A1-7.5V-1Sn-1Zr-0.35Si Trans 1083 157.1
1202 174.3 12.6 43.6 112 16.2 236.9 262.8 Inventive Example
Alloy 74 Ti-6.15AI-4.15V Trans 936 135.8 1031 149.5
15.1 34.9 123 17.8 209.9 231.1 Comparison
Ti-5.3AI-7.5V-0.5Si-0.05C-
Alloy 85 Trans 1084 157.2 1179 171.0 9.4 28.1 119
17.2 239.4 260.4 Inventive Example
0.190
Alloy 86 Ti- 6.5A1-4.15V-0.025C-0.20 Trans 949 137.7
1029 149.3 15.8 40.4 128 18.6 213.1 231.1 Comparison (-F;"
Alloy 87 Ti-5.8A1-9V-0.5Si-0.05C-0.210 Trans 1159 168.1 1281
185.8 8.8 17.6 115 16.7 254.9 281.7 Comparison
Ti-5.8A1-8.5V-1Sn-1Zr-0.35Si-
0=
Alloy 88 Trans 1151 166.9 1296 187.9 10.7 29.7 113 16.4
251.0 282.6 Comparison
0.025C-0.190
JI
1.)
00
CA 02938854 2016-08-04
WO 2015/175032
PCT/US2015/014782
- 20 -
[0061] Two different conditions were used for solution treatment and aging
of
the 2" square bar: solution treat at 50 F (28 C) below beta transus for 1.5
hours
then air cool, followed by aging at 940 F (504 C) for 8 hours, then air
cooling
(STA-AC); and solution treat at 50 F (28 C) below beta transus for 1.5 hours
then
fan air cool, followed by aging at 940 F (504 C) for 8 hours, then air cooling
(STA-FAC).
[0062] Air cooling from the solution treatment temperature results in a
material
bearing greater similarity to the center of thick section forged parts, while
fan air
cooling from the solution treatment temperature results in a material bearing
closer similarity to the surface of a thick section forged part after water
quenching. The results of tensile tests at room temperature are given in Table
6.
The results are also displayed in Figure 3C graphically.
C
JI
Table 6. Results of tensile tests at room temperature of experimental alloys
after STA
Specific
Specific
ST 0.2%PS UTS
El RA Modulus Strength Strength
ID Alloy
(0.2%PS) (UTS) Remarks
Cooling MPa ksi MPa ksi % % G Pa
msi kN=m/kg kl\l=m/kg
Alloy 69 Ti-5.3A1-7.5V-0.5Si AC 987 143.1 1094 158.7 15.7
50.2 108 15.7 218.0 241.8 Inventive Example
Alloy 70 Ti-5.3A1-7.5V-0.35Si AC 961 139.4 1048 152.0 16.4
59.3 109 15.8 212.2 231.4 Inventive Example
Alloy 71 Ti-5.3A1-7.5V-0.1Si AC 914 132.5 1000
145.1 18.0 60.6 108 15.7 201.5 220.6 Comparison
Alloy 72 Ti-5.3A1-7.5V-1Sn-0.35Si AC 1015 147.2 1121 162.6
15.7 54.0 108 15.6 222.9 246.3 Inventive Example
Alloy 75 Ti-5.3A1-7.5V-1Zr-0.35Si AC 1007 146.1 1138 165.0
15.1 51.1 106 15.4 221.3 249.9 Inventive Example
r)
Alloy 76 Ti-5.3A1-7.5V-1Sn-1Zr-0.35Si AC 987 143.2 1121 162.6
15.7 54.8 105 15.3 215.9 245.2 Inventive
Example o
Alloy 74 Ti-6.15AI-4.15V AC 870 126.2 967 140.3 16.0
48.5 114 16.5 195.1 216.9 Comparison
Alloy 85 Ti-5.3AI- 7. 5V-0.5S i-0.05C-0.190 AC 1055 153.0 1180
171.1 10.9 32.2 109 15.8 233.0 260.6 Inventive Example
Alloy 86 Ti- 6.5A1-4.15V-0.025C-0.20 AC 903 130.9 992 143.9
16.5 50.0 114 16.5 202.6 222.7 Comparison
Ti-5.8A1-8.5V-1Sn-1Zr-0.35Si-
Alloy 88 0.025C-0.190 AC 1143 165.8
1257 182.3 12.2 37.9 108 15.7 249.3 274.1 Comparison
Alloy 69 Ti-5.3A1-7.5V-0.5Si FAC 985 142.9 1109 160.8 15.8
53.0 109 15.8 217.7 245.0 Inventive Example
Alloy 70 Ti-5.3A1-7.5V-0.35Si FAC 981 142.3 1091 158.3 17.0
55.7 110 16.0 216.6 241.0 Inventive Example
Alloy 71 Ti-5.3A1-7.5V-0.1Si FAC 933 135.3 1037 150.4 17.2
58.9 110 16.0 205.7 228.7 Comparison
Alloy 72 Ti-5.3A1-7.5V-1Sn-0.35Si FAC 1049 152.1 1158 167.9
16.1 56.3 110 15.9 230.4 254.3 Inventive Example
1-L
00
1-L
Specific
Specific
ST 0.2`)/0PS UTS
El RA Modulus Strength Strength
ID Alloy
(0.2%PS) (UTS) Remarks
Cooling MPa ksi MPa ksi % % GPa msi kN=m/kg kN=m/kg
Alloy 75 Ti-5.3A1-7.5V-1Zr-0.35Si FAC 1011 146.6 1158 167.9
15.4 54.6 108 15.7 222.1 254.3 Inventive Example
Alloy 76 Ti-5.3A1-7.5V-1Sn-1Zr-0.35Si FAC 1021 148.1 1174
170.3 15.4 53.2 108 15.6 223.3 256.8 Inventive Example
Alloy 74 Ti-6.15AI-4.15V FAC 893 129.5 987 143.1 15.3
49.3 115 16.7 200.2 221.2 Comparison
Alloy 85 Ti-5.3A1-7.5V-0.5S1-0.05C-0.190 FAC 1090 158.1
1226 177.8 11.1 31.8 109 15.8 240.8 270.8 Inventive
Example
Alloy 86 Ti- 6.5A1-4.15V-0.0250-0.20 FAC 929 134.7 1027
149.0 14.9 46.8 116 16.8 208.5 230.6 Comparison
Ti-5.8A1-8.5V-1Sn-1Zr-0.355i-
Alloy 88 0.025C-0.190 FAC 1243 180.3 1354 196.4
7.9 20.3 109 15.8 271.1 295.3 Comparison
AC: Air cool after solution treatment
FAC: Fan air cool after solution treatment
NJ
1.)
JI
00
CA 02938854 2016-08-04
WO 2015/175032
PCT/US2015/014782
- 23 -
[0063] Figure 30 shows a similar trend where elongation decreases with
increasing strength. Alloys processed with the STA-FAC (fan air cool after
solution treatment) condition exhibit a slightly higher strength than alloys
processed with the STA-AC. It should be noted that Alloy 88 exhibited very
high
strength but low ductility after STA-FAC due to excessive hardening; in
contrast,
after air cooling (STA-AC), the properties of Alloy 88 were satisfactory. The
inventive alloys display a fairly consistent strength/ductility balance
regardless of
the cooling method after solution treatment.
[0064] Figure 1B shows a strength versus elongation relationship of the
inventive alloys and Ti-64 (Comparative baseline alloy) following STA and mill
anneal (MA) conditions. The cooling after solution treatment was air cooling.
It is
evident from Figure 1B that Ti-64 shows little change between STA and MA
conditions; however, in the inventive alloys a significant strengthening is
observed after STA without deterioration of elongation. This is due to
excellent
hardenability of the inventive alloys as compared with Ti-64.
Example C
[0065] A laboratory ingot with a diameter of 11" (279 mm) and weight of 196
lb
(89 kg) was made. The chemical composition of the ingot (Alloy 95) was Al:
5.42
wt.%, V: 7.76 wt.%, Fe; 0.24 wt.%, 51:0.46 wt.%, C: 0.06 wt.%, 0: 0.205 wt.%,
with a
balance of titanium and inevitable impurities. The ingot was soaked at 2100 F
(1149 C) for 6 hours, then breakdown forged to an 8" (203 mm) square billet.
The
billet was heated at 1685 F (918 C) for 4 hours followed by forging to a 6.5"
(165
mm) square billet. Then, a part of the billet was heated to 1850 F (1010 C)
followed
by forging to a 5.5" (140 mm) square billet. A part of the 5.5" square billet
was then
heated at 1670 F (910 C) for 2 hours followed by forging to a 2" (51 mm)
square
bar. Square tensile coupons were cut from the 2" square bar, then a solution
treatment and age was performed. The temperature and time of the solution
treatment were changed. After the solution treatment, the coupons were fan air
cooled to ambient temperature, followed by aging at 940 F (504 C) for 8 hours,
then
air cooling. Tensile tests were performed at room temperature. Table 7 shows
for
each condition the average of two tests. As can be in the table, the values
for
CA 02938854 2016-08-04
WO 2015/175032 PCT/US2015/014782
- 24 -0.2 /0PS are substantially higher than the minimum requirement of 140
ksi (965 MPa)
with a satisfactory elongation (e.g., higher than 10%).
Table 7. Results of RT tensile tests of 2" (51 mm) square billet of Alloy 95
after
various STA heat treatments
Heat Treatment 0.2%PS UTS El RA Modulus
Condition MPa ksi MPa ksi % % G P a m s i
752 C/1hr/FAC -
1156 167.7 1199 173.9 11.7 36.7 114 16.6
504 C/8hr/AC
752 C/5hr/FAC -
1174 170.3 1224 177.6 11.9 37.3 115 16.7
504 C/8hr/AC
802 C/1hr/FAC -
1204 174.6 1272 184.5 11.3 35.6 114 16.5
504 C/8hr/AC
802 C/5hr/FAC -
1206 174.9 1287 186.7 11.6 37.1 114 16.5
504 C/8hr/AC
852 C/1hr/FAC -
1193 173.1 1263 183.2 11.9 41.9 112 16.3
504 C/8hr/AC
852 C/5hr/FAC -
1229 178.3 1318 191.2 10.7 37.7 111 16.1
504 C/8hr/AC
[0066] A part of the material at 5.5" (140 mm) square was hot-rolled to
0.75"
(19 mm) plate after heating at 1670 F (910 C) for 2 hours. Then test coupons
were cut along both longitudinal and transverse directions. A STA heat
treatment
(1670 F (910 C)/ lhr /air cool then 940 F(504 C)/ 8hrs/ air cool) was
performed
on the coupons. Table 8 shows the results of tensile tests at room temperature
and 500 F (260 C). The results clearly indicate that higher strengths (>140
ksi)
(965MPa)) and satisfactory elongation values (>10%) are obtained.
Table 8. Tensile properties of plate of Alloy 95 after STA heat treatment
Heat treatment Test Di.recti.on 0.2% PS UTS El -- RA
ID
Condition Temp. MPa ksi MPa ksi
1083 157.1 1178 170.8 13 37.7
910 C/1hr/AC RT
Alloy 1069 155.1
1159 168.1 14 39.0
504 C/8hr/AC 260 C 786 114.0 929
134.8 16 50.0
774 112.3 926 134.3 18 52.5
[0067] Low cycle fatigue (LCF) test specimens were machined from STA heat
treated coupons. The fatigue testing was carried out at the condition of Kt=1
and
R=0.01 using stress control, and the frequency was 0.5 Hz. The testing was
CA 02938854 2016-08-04
WO 2015/175032
PCT/US2015/014782
- 25 -
discontinued at 105 cycles. Table 9 and Figure 4 show the results of the LCF
test, where the LCF curve is compared with fatigue data from Ti-64. It is
evident
from Figure 4 that the inventive alloy exhibits superior LCF properties
compared
to the commercial alloy Ti-64.
Table 9. LCF test result of Alloy 95 plate
Max Stress
ksi MPa Cycles
137.8 950 67711
134.9 930 64803
140.7 970 46736
143.6 990 54867
146.5 1010 45829
Example D
[0068] Seven titanium alloys ingots were melted in a laboratory VAR
furnace.
The size of the ingots was 8" (203 mm) diameter with a weight of about 70 lbs
(32
kg). Chemical compositions of the alloys are listed in Table 10. In the table,
the
Al/V ratio is given for each alloy. Alloy 163 is Ti-64 containing a slightly
higher
oxygen concentration. Alloy 164 through Alloy 167 are within the inventive
composition range. Alloys 168 and 169 are comparative alloys, as the silicon
content is lower than 0.15%.
Table 10. Chemical composition (wt.%) and calculated densities of experimental
alloys
Al V Fe Si Density 0 N Al/V Note
g/cm
Alloy Ti-64,
163= 6.54 4.11 0.17 0.02 0.034 0.219 0.005 1.59 4.45
Comparison
Alloy Inventive
= 5.43 7.80 0.21 0.52 0.036 0.209 0.007 0.70 4.52
164 Example
Alloy Inventive
165= 5.56 7.51 0.21 0.51 0.035 0.185 0.004 0.74 4.52
Example
Alloy Inventive
166= 5.42 7.69 0.21 0.27 0.038 0.207 0.003 0.70 4.52
Example
Alloy Inventive
= 5.30 7.54 0.20 0.28 0.036 0.178 0.004 0.70 4.53
167 Example
Alloy
168' 5.33 7.60 0.22 0.13 0.035 0.205 0.005 0.70 4.53 Comparison
Alloy
169' 5.31 7.55 0.20 0.13 0.036 0.166 0.004 0.70 4.53 Comparison
CA 02938854 2016-08-04
WO 2015/175032
PCT/US2015/014782
- 26 -
[0069] These ingots were soaked at 2100 F (1149 C) for 5 hours, followed by
forging to a 6.5" (165 mm) square billet. The billet was heated at 45 F (25 C)
below the beta transus for 4 hours, followed by forging to a 5" (127 mm)
square
billet. Then the billet was heated approximately 120 F (67 C) above the beta
transus, followed by forging to a 4" (102 mm) square billet. The billets were
water
quenched after the forging. The billets were further forged down to 2" (51 mm)
square bars after being heated at approximately 145 F (81 C) below the beta
transus. Solution treatment was performed on the 2" (51 mm) square bar, then
tensile test coupons for the longitudinal direction and compact tension
coupons
for L-T testing were cut. Solution treatment was performed at 90 F (50 C)
below
beta transus, designated as TB-90F. Aging was performed on the coupons at two
different conditions, 930 F (499 C) for 8 hours or 1112 F (600 C) for 2 hours.
Tables 11 and 12 show the results of tensile tests and fracture toughness
tests.
Figure 5A shows the tensile test results graphically.
C
t..,
=
u.
Table 11. Results of room temperature tensile tests and fracture toughness
tests after STA heat treatment
u,
0.2%PS UTS Specific
Specific
Ku
a'
El RA Strength Strength
n.)
ID Alloy ST Aging
Remarks
MPa ksi MPa ksi % A, (0.2%PS) (UTS)
MPa=m1/2 ksi=in1/2
kN=m/kg
kN=m/kg
Alloy Ti-6.5A1-
Ti-64,
955 138.5 1027 149.0 19.0 43.5 214.5
230.8 73.7 67.7
163 4.15V-0.210
Comparison
Ti-5.3A1-
Alloy
Inventive
7.7V-0.5Si- 1072 155.5 1162 168.5 14.1 36.5 237.2
257.0 40.1 36.8
164 Example
0.200
Ti-5.3A1-
Inventive
R
7.7V-0.5Si- 1065 154.5 1151 167.0 14.0 36.0 235.9
255.0 39.7 36.5
165
Example o
0.160
N
Ti-5.3A1-
u,
Alloy TB-50 482 deg
Inventive
7.7V-0.3Si- 1055 153.0 1131 164.0 16.6 46.5 233.1
249.9 67.4 61.9 m .
166
0.200 deg C C/8 hrs
Example -74
Ti-5.3A1-
.
Alloy
Inventive .
= 7.7V-0.3Si- 993 144.0
1065 154.5 16.3 43.5 219.4 235.4 71.3 65.5 0=
167
Example ,I,
0.160
.
Ti-5.3A1-
Alloy
7.7V-0.1Si- 979 142.0 1062 154.0 18.4 44.0 216.2
234.5 70.6 64.8 Comparison
168
0.200
Ti-5.3A1-
Alloy
7.7V-0.1Si- 972 141.0 1055 153.0 17.3 53.0 214.6
232.9 78.4 72.0 Comparison
169
0.160
od
el
,-i
cA
,..,
=
u,
--=-
,-
--4
00
LV
C
Table 12. Results of room temperature tensile tests after STA heat treatment
0.2%PS UTS
Specific Specific
El RA Strength Strength
Remarks
ID Alloy ST Aging
M Pa ksi MPa ksi % %
(0.2%PS) (UTS)
kN.111/kg
kftrrilkg
Alloy
Ti-64,
Ti-6.5A1-4.15V-0.210 958 139.0 1020 148.0 17.7 43.0 215.3
229.2
163
Comparison
Alloy
Inventive
Ti-5.3A1-7.7V-0.5Si-0.200 1020 148.0 1107 160.5 14.5 31.0 225.7
244.8
164
Example
Alloy
Inventive
Ti-5.3A1-7.7V-0.5Si-0.160 1007 146.0 1086 157.5 14.1 34.5 222.9
240.5
165
Example
u,
r)
Alloy 600 C/
Inventive 9')
Ti-5.3A1-7.7V-0.3Si-0.200 TB-50 C 1007 146.0 1082 157.0 16.4 42.0 222.5
239.2
166 2hrs
Example
Alloy
Inventive
Ti-5.3A1-7.7V-0.3Si-0.160 1038 150.5 1114 161.5 16.0 48.0 229.3
246.1 o 0,
167
Example
Alloy
Ti-5.3AI-7.7V-0.1Si-0.200 1017 147.5 1103 160.0 17.2 48.5 224.6
243.6 Comparison
168
Alloy
Ti-5.3A1-7.7V-0.1Si-0.160 948 137.5 1017 147.5 18.8 51.0 209.3
224.5 Comparison
169
1.)
JI
00
CA 02938854 2016-08-04
WO 2015/175032 PCT/US2015/014782
- 29 -
[0070] As shown in the tables and the figure, the new alpha-beta titanium
alloys exhibit higher than a target strength and elongation in all conditions
demonstrating robustness in heat treatment variations. Fracture toughness Kic
is
given in the Table 11. There is a trade-off between strength and fracture
toughness in general. Within the inventive alloys, the fracture toughness can
be
controlled by an adjustment of chemical compositions, such as silicon and
oxygen contents, depending on fracture toughness requirements.
[0071] For titanium alloys used as components of jet engine compressors,
maintaining strength during use at moderately elevated temperatures (up to
about 300 C/572 F) is important. Elevated temperature tensile tests were
performed on the coupons after aging at 930 F (499 C) for 8 hours. The results
of the tests are given in Table 13 and Figure 5B. The results show that all
alloys
exhibit significantly higher strengths than Ti-64 (Alloy 163). It is also
apparent that
strength increases with Si content in the Ti-5.3A1-7.7V-Si-0 alloy system.
Strength can be raised by about 15% from the level of Ti-64 (Alloy 163),
showing
dotted line in the figure, if the silicon content of Ti-5.3A1-7.7V-Si-0 alloy
is higher
than about 0.15%.
Table 13. Results of elevated temperature tensile tests (Test temperature:
300 C1572 F)
0.2%PS UTS El RA
ID Alloy
MPa ksi M Pa ksi
Alloy 1 Ti-6.5AI-4.15V-0.210 562 81.5 712 103.3 25 62.0
63
Alloy Ti-5.3AI-7.7V-0.5Si-0.200 761 110.4 923 133.9 19
51.5
164
Alloy
Ti-5.3A1-7.7V-0.5Si-0.160 736 106.7 893 129.5 18 50.5
165
Alloy
Ti-5.3A1-7.7V-0.3Si-0.200 703 101.9 858 124.5 21 61.0
166
Alloy
167 Ti-5.3A1-7.7V-0.3Si-0.160 654 94.8 825 119.6 20
57.5
Alloy Ti-5.3AI-7.7V-0.1Si-0.200 649 94.1 801 116.2 22
61.5
168
CA 02938854 2016-08-04
WO 2015/175032 PCT/US2015/014782
- 30 -
0.2%PS UTS El RA
ID Alloy
MPa ksi MPa ksi
Alloy Ti-5.3A1-7.7V-0.1Si-0.160 641 92.9 799 115.9 18 61.5
169
Example E
[0072] A 30 inch diameter ingot weighing 3.35 tons was produced (Heat
number FR88735). A chemical composition of the ingot was Ti-5.4A1-7.6V-
0.46Si-0.21Fe-0.06C-0.200 in wt.%. The ingot was subjected to breakdown-
forge followed by a series of forgings in the alpha-beta temperature range. A
6"
(152 mm) diameter billet was used for the evaluation of properties after upset
forging. 6" (152 mm) diameter x 2" (51 mm) high billet sample was heated at
1670 F (910 C), upset forged to 0.83" (21 mm) thick, followed by STA heat
treatment 1670 F (910 C) for 1 hour then fan air cool, followed by 932 F (500
C)
for 8 hours, then air cool. Room temperature tensile tests, elevated
temperature
tensile tests and low cycle fatigue tests were conducted.
Table 14. RT tensile test results of Ti-575 alloy pancake as compared with Ti-
64
plate
Test Temp. 0.2% PS UTS Elongn
Alloy Direction 565'A Remarks
Remarks
MPa ksi MPa ksi (%) ("A)
Ti 6-4 20 68 L 928 134.6 1021 148.1 16 27.5
Comparison
FR88735 20 68 Pancake 1050 152.3
1176 170.6 15 42 Inventive
Example
FR88735 200 392 Pancake 815 118.2 958 138.9 15
59 Inventive
Example
Ti 6-4 300 572 T 563 81.7 698 101.2 17.5 48
Comparison
Ti 6-4 300 572 L 589 85.4 726 105.3 16 48.5
Comparison
FR88735 300 572 Pancake 720 104.4 897 130.1 16
61 Inventive
Example
FR88735 400 752 Pancake 696 100.9
846 122.7 14.5 64.5 Inventive
Example
FR88735 500 932 Pancake 603 87.5 777 112.7 23 78
Inventive
Example
CA 02938854 2016-08-04
WO 2015/175032
PCT/US2015/014782
-31 -
[0073] Table 14 summarizes the test results and the results are given in
Figure
6A graphically as well. The new alpha-beta Ti alloy (Ti-575, Heat FR88735)
shows higher strength than Ti-64 consistently at elevated temperatures.
[0074] Low cycle fatigue (LCF) tests were conducted after taking specimens
from the upset pancake forged material. The pancakes were STA heat treated
with the condition of 1670 F (910 C) for 1 hour then fan air cool, followed by
932 F (500 C) for 8 hours then air cool. Smooth surface LCF (Kt=1) and Notch
LCF test (Kt=2.26) were performed. In addition to standard LCF tests, dwell
time
LCF was also conducted at selected stress levels to examine dwell sensitivity
of
the inventive alloy. The results of smooth surface LCF and dwell time LCF
tests
are displayed in Figure 6B, and the results of the notch LCF tests are given
in
Figure 60. In each test, results for Ti-64 plate are also given for
comparison. The
fatigue testing was discontinued at 105 cycles.
[0075] The results in Figure 6B show that the maximum stress of the inventive
alloys are 15-20% higher than that of Ti-64 plate for equivalent LCF cycles.
It
also appears that Ti-575 does not have any dwell sensitivity, judging from the
cycles of both the LCF and dwell LCF tests at a given maximum stress. Notch
LCF tests shown in Figure 6C indicate that Ti-575 shows 12-20% higher
maximum stress than that of Ti-64 plate for equivalent LCF cycles.
[0076] Fatigue crack growth rate tests were performed on the compact tension
specimens taken from the same pancake. Figure 6D shows the results of the
tests, where the data are compared with the data for Ti-64. As can be seen in
the figure, the fatigue crack growth rate of the inventive alloy (Ti-575) is
equivalent to that of Ti-64.
[0077] Although the present invention has been described in considerable
detail with reference to certain embodiments thereof, other embodiments are
possible without departing from the present invention. The spirit and scope of
the
appended claims should not be limited, therefore, to the description of the
preferred embodiments contained herein. All embodiments that come within the
CA 02938854 2016-08-04
WO 2015/175032
PCT/US2015/014782
- 32 -
meaning of the claims, either literally or by equivalence, are intended to be
embraced therein.
[0078] Furthermore, the advantages described above are not necessarily the
only advantages of the invention, and it is not necessarily expected that all
of the
described advantages will be achieved with every embodiment of the invention.