Note: Descriptions are shown in the official language in which they were submitted.
CA 02948185 2016-11-04
WO 2015/175508
PCT/US2015/030335
METHODS FOR OPERATING WELLBORE DRILLING EQUIPMENT
BASED ON WELLBORE CONDITIONS
BACKGROUND
[0001] Down-hole annular pressure is a well-known measurement in the
technology area of
wellbore drilling. Down-hole annular pressure data may be used to identify
undesirable
drilling conditions, suggest remedial procedures, and prevent serious problems
from
developing. For example, with accurate annular pressure data in real-time,
drillers can apply
conventional drilling practices more effectively to potentially reduce both
rig time and the
number of casing strings. In particular, SPE publication No. 49114 discusses
how, with real-
time down-hole annular pressure while drilling ("APWD") measurements, drillers
can more
effectively maintain the equivalent circulating density ("ECD") and equivalent
static density
("ESD") within a desired range in order to prevent lost circulation and
maintain wellbore
integrity by managing swab, surge and gel breakdown effects.
[0002] However, it may not be always possible to provide real-time down-hole
APWD
measurements to drillers, in particular during pipe connections when the
drilling fluid
circulation pumps are turned off (a "pumps-off' condition). Instead, Canadian
patent No.
2,298,859 discloses a method that provides near real-time advantage of APWD
measurements taken during pipe connections. APWD data are measured, stored and
even
processed in the bottom-hole assembly during a pumps-off condition for
subsequent
communication of a reduced amount of data to drillers at the surface. More
recently, wired
drill pipe ("WDP") technology has been offering along-string APWD measurements
in real-
time. For example, the industry report published on the September 2011 issue
of World Oil
describes a well drilling operation where battery-powered tools were connected
down-hole to
a WDP network to continuously transmit down-hole APWD data even when no
circulation
1
CA 02948185 2016-11-04
WO 2015/175508
PCT/US2015/030335
was present. In this example, an integrated managed pressure system allowed
drillers to
instantaneously and continuously control circulating pressure within a 30-psi
window while
drilling, and to control pressure changes within a 100-psi window during drill
pipe
connections.
[0003] The full benefits of APWD data availability in real-time may not have
been achieved
yet because drillers still rely on approximative rules for operating drilling
equipment and
control the variations of APWD. These rules, while having possibly wide
application, may
not be intended to be strictly accurate or reliable in every situation.
Typically, these rules
yield to operations of wellbore drilling equipment that are too conservative
and less
economical. However, in some cases, these rules may be too aggressive, and
excessive
drilling rate of penetration ("ROP") may compromise wellbore stability or
excessive speed of
the drill string may generate flow of formation fluid into the wellbore during
tripping
operations such as when tripping out of the hole.
SUMMARY
[0004] Those skilled in the art will readily recognize that the present
disclosure and its
accompanying figures introduce methods of operating wellbore drilling
equipment. Annular
pressure data are measured at a location along a wellbore during a time
interval including a
pumps-off period around a drill pipe connection. The annular pressure data may
comprise
equivalent densities or normalized equivalent densities. While additional
values may be
identified from the annular pressure data measured during pumps-on periods, at
least first and
second values are identified from the annular pressure data measured during
the pumps-off
period, wherein the first value is identified prior to making the drill pipe
connection and the
second value is identified after making the drill pipe connection. The
variation between first
and second values is compared to a threshold. A drilling fluid circulation
pump is operated
2
CA 02948185 2016-11-04
WO 2015/175508
PCT/US2015/030335
based on the comparison with the threshold for maintaining subsequent
variations of annular
pressure in a desired range. For example, a pumping rate or a pumping duration
may be
determined based on the comparison; and the drilling fluid circulation pump
may be operated
at the determined pumping rate or for the determined pumping duration during a
pump ramp-
up or slow-down period subsequent the drill pipe connection. The threshold may
be
determined using a statistical analysis of values of the variation between
annular pressure
data before and after drill pipe connections. The analysis may comprise
extrapolating a trend
with time or wellbore length. Or the threshold may be determined using a fluid
circulation
model of the wellbore.
[0005] A method, comprising acquiring annular pressure data from a wellbore
where the
annular pressure data is acquired over a time interval and at least a portion
of the annular
pressure data is acquired during a pumps-off period. At least first and second
values are
identified from the annular pressure data and the variation between the first
and second
values are compared to a first threshold. Drilling equipment is operated based
on the
comparison with the first threshold.
[0006] In some embodiments, a method comprises acquiring annular pressure data
from a
wellbore, wherein the annular pressure data is acquired over a time interval
and at least a
portion of the annular pressure data is acquired during a pumps-off period.
Equivalent
densities are then computed based upon the acquired annular pressure data. A
first threshold
is determined by correlating the equivalent densities to drilling efficiency,
wherein the first
threshold is indicative of uneconomical performance. A second threshold is
determined by
correlating the equivalent densities to drilling efficiency, wherein the
second threshold is
indicative of high performance. Annular pressure data is measured within the
wellbore and at
least first and second values are identified from the measured annular
pressure data. The
variation between the first and second values are compared to the first
threshold and the
3
CA 02948185 2016-11-04
WO 2015/175508
PCT/US2015/030335
second threshold and drilling equipment is operated based on the comparison
with the first
threshold and the second threshold.
[0007] In some embodiments, a method comprises determining an equivalent
density of a
drilling fluid at a plurality of locations within a wellbore and correlating
the equivalent
densities to drilling efficiency so as to determine a first threshold. Annular
pressure data is
acquired from a location within the wellbore, wherein the annular pressure
data is acquired
over a time interval and at least a portion of the annular pressure data is
acquired during a
pumps-off period. At least first and second values are identified from the
annular pressure
data and the variation between first and second values is compared to the
first threshold.
Drilling equipment is operated based on the comparison with the first
threshold.
[0008] The annular pressure data may be measured at a first location, and the
method may
further comprise measuring annular pressure data at other locations along the
wellbore
different from the first location. In these cases, the drilling fluid
circulation pump may
further be operated based on the annular pressure data measured at the other
locations.
[0009] The method may further comprise transmitting the measured annular
pressure data via
wired drill pipe telemetry, and displaying the variation between first and
second values and
the threshold on a visualization dial. Alternatively, or additionally, the
method may further
comprise displaying the variation between first and second values on a log
including
indications of drilling conditions. The indications of drilling conditions may
comprise at
least one of mud type, formation type, wellbore inclination and rig crew
tours.
[0010] In some embodiments, operating the drilling fluid circulation pump
based on the
comparison may comprise cleaning-up the wellbore prior to the subsequent drill
pipe
connection for a duration that is shorter than the duration used prior to the
current drill pipe
connection when the variation between first and second values is greater than
the threshold,
4
CA 02948185 2016-11-04
WO 2015/175508
PCT/US2015/030335
or at least as long as the duration used prior to the current drill pipe
connection when the
variation between first and second values is not smaller than the threshold.
[0011] In some embodiments, operating the drilling fluid circulation pump
based on the
comparison may comprise cleaning-up the wellbore prior to the subsequent drill
pipe
connection for a duration that is longer than the duration used prior to the
current drill pipe
connection when the variation between first and second values is less than the
threshold, or at
most as short as the duration used prior to the current drill pipe connection
when the variation
between first and second values is not larger than the threshold.
[0012] In some embodiments, the time interval during which annular pressure
data are
measured may also comprise a clean-up period and a pump ramp-up or slow-down
period,
and the method may further comprise identifying a third value from the annular
pressure data
measured during the clean-up period, and a fourth value from the annular
pressure data
measured during the pump ramp-up or slow-down period. The rate or the duration
of
operation of the drilling fluid circulation pump during a pump ramp-up or slow-
down period
subsequent to the drill pipe connection may be changed based on the variation
between third
and fourth values, and/or the variation between second and fourth values.
[0013] In some embodiments, the time interval during which annular pressure
data are
measured may also comprise a drilling period and a clean-up period, and the
method may
further comprise identifying a third value from the annular pressure data
measured during the
drilling period and a fourth value from the annular pressure data measured
during the clean-
up period. One of a circulation flow rate, weight on bit and string rotation
speed during a
drilling period subsequent the connection may be changed based on the
variation between
third and fourth values, and/or the variation between second and fourth
values.
[0014] Alternatively or additionally, a pressure data value is identified
while setting drill
string in slips, or while picking up drill string off slips. At least one of a
relative pressure
CA 02948185 2016-11-04
WO 2015/175508
PCT/US2015/030335
change and a pressure change rate is determined from the identified value, and
is compared to
a threshold. At least one of speed and acceleration of a traveling block or
other hoisting
equipment is controlled based on the comparison.
DRAWINGS
[0015] The present disclosure is best understood from the following detailed
description
when read with the accompanying figures.
[0016] FIG. 1 is a schematic of a drilling rig and data transmission system
suitable for
acquiring annular pressure data;
[0017] FIG. 2 is a graph of annular pressure data acquired around a drill pipe
connection;
[0018] FIG. 3 is a flow chart of a method of measuring performance and
quantifying risk;
[0019] FIG. 4 is a flow chart of a method of operating wellbore drilling
equipment;
[0020] FIG. 5 is a display that may be used in accordance with the method of
FIG. 4;
[0021] FIG. 6 is another display that may be used in accordance with the
method of FIG. 4;
[0022] FIG. 7 is a flow chart of a method of operating a fluid circulation
pump based on
pressure data value acquired during a pumps-off period around a drill pipe
connection;
[0023] FIG. 8 is a flow chart of a method of changing the duration of
operation of a fluid
circulation pump during a fluid clean-up period;
[0024] FIG. 9 is a flow chart of a method of changing the duration of
operation of a fluid
circulation pump during a pump ramp-up or slow-down period; and
[0025] FIG. 10 is a flow chart of a method of changing the operation of
wellbore drilling
equipment during a drilling period.
[0026] FIG. 11 is a flow chart of a method of changing the operation of a draw-
work during
setting a drill string in slips or picking a drill string off slips.
6
CA 02948185 2016-11-04
WO 2015/175508
PCT/US2015/030335
DESCRIPTION
[0027] It is to be understood that the following disclosure provides many
different examples
for implementing different features of various embodiments. Specific examples
of
components and arrangements are described below to simplify the present
disclosure. These
are, of course, merely examples and are not intended to be limiting. In
addition, the example
methods and flow charts described in the embodiments presented in the
description that
follows may include embodiments in which certain steps may be performed in a
different
order, in parallel with one another, omitted entirely, regrouped and renamed,
and/or
combined between different example methods, and/or certain additional steps
can be
performed, without departing from the scope of the disclosure.
[0028] This disclosure describes methods to determine indices of
aggressiveness and/or
conservativeness based on equivalent drilling fluid densities (e.g., down-hole
ESD or ECD)
measured around drill pipe connections. On the one hand, these indices may
provide insight
and quantify risks otherwise not known. On the other hand, these indices may
measure
drilling performance, where low performance is uneconomical or suboptimal.
Thus, these
values may help balancing operation performance with risks. The indices of
aggressiveness
and/or conservativeness may be used for comparing drilling operations between
different
drillers, between different sections of a single wellbore or between different
wellbores
located in a geographical area of interest.
[0029] The indices of aggressiveness and/or conservativeness may be computed
from
wellbore pressure data indicative of 1) drilling periods to take into account
increased cutting
content in the drilling fluid, 2) clean-up periods to take into account
decreased cutting content
in the drilling fluid during sweeps or during circulation without drilling, 3)
pump ramp-up or
slow-down periods to take into account the impact of flow rate increase on
wellbore pressure,
as well as 4) pumps-off periods to take into account the settling of cuttings.
In addition,
7
CA 02948185 2016-11-04
WO 2015/175508
PCT/US2015/030335
pressures caused by acceleration of the drill string while setting the drill
string in slips or
picking up the drill string off slips, or caused by swab and surge effects
during tripping may
also be used.
[0030] The indices of aggressiveness and/or conservativeness may be determined
down-hole
and be transmitted to surface via mud pulse telemetry when the flow rate of
drilling fluid is
sufficient for mud pulsers to operate. The transmission of indices
corresponding to
operations performed when the flow rate of drilling fluid is insufficient for
mud pulsers to
operate may be delayed until the flow rate of drilling fluid becomes
sufficient, and is not
considered to be in real-time. Thus, wired drill pipe ("WDP") technology is
well suited to
implement certain aspects of this disclosure. The values may be displayed to
aid well site
operations, and/or may be used for automated optimization of drilling and
tripping. Also,
wellbore drilling equipment may be controlled and drilling be optimized by
using estimates
of the aggressiveness and/or conservativeness of the drilling operations that
are computed in
real-time from down-hole measurements.
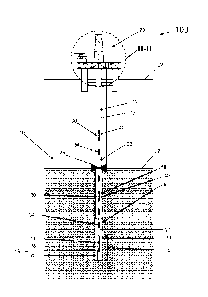
[0031] FIG. 1 illustrates a schematic view of a drilling operation 100 in
which a wellbore 36
is being drilled through a subsurface formation beneath the ocean or sea floor
26. The
drilling operation 100 includes a drilling rig 20 on the ocean surface 27 and
a drill string 12
which extends from the rig 20, through a riser 13 in the ocean water, through
a BOP 29, and
into the wellbore 36 which is further reinforced with a casing pipe 18 for at
least some
distance below the sea floor 26. An annulus 22 is formed between the outer
surface of the
drill string 12 and the inner surface of the riser 13, casing 18, and wellbore
36. BOP 29 is
configured to controllably seal the wellbore 36. A bottom hole assembly 15
("BHA") is
provided at the lower end of the drill string 12. As shown in FIG. 1, BHA 15
includes a drill
bit or other cutting device 16, a sensor package 38 located near the bit 16, a
formation
evaluation package and/or a drilling mechanics evaluation package 19, a
directional drilling
8
CA 02948185 2016-11-04
WO 2015/175508
PCT/US2015/030335
motor or rotary steerable device 14, and a network ready interface sub 17.
However, it
should be noted that BHA 15 may include different components while still
complying with
the principles of the current disclosure.
[0032] The drilling rig 20 includes equipment for drilling the wellbore 36.
This equipment
may include, but is not limited to, drilling fluid circulation pumps for
pumping drilling fluid
into the bore of the drill string 12, a top drive or rotary table for rotating
the drill string 12,
and a draw-works and traveling block or other hoisting equipment for
suspending the drill
string. Further, some equipment for drilling the wellbore 36 may also be
provided in
conjunction with the BOP 29, and may include, but is not limited to, choke
valves, and
sealing packers. Still further, some equipment for drilling the wellbore 36
may also be
provided in the BHA 15, and may include, but is not limited to, the drilling
motor or rotary
steerable 14, and circulation subs along the drill string 12. All or part of
this equipment may
be operated (e.g., controlled, actuated, etc...) based on indices of
aggressiveness and/or
conservativeness in accordance with one or more aspects of the present
disclosure.
[0033] Drill string 12 generally comprises a plurality of tubulars coupled end
to end.
Connectors or threaded couplings 34 are located at the ends of each tubular
thereby
facilitating the coupling of each tubular to form drill string 12. In some
embodiments,
connectors 34 represent wired drill pipe joint connectors. The drill string 12
also preferably
includes a plurality of network nodes 30. The nodes 30 are provided at desired
intervals
along the drill string 12. Network nodes 30 essentially function as signal
repeaters to
regenerate and/or boost data signals and mitigate signal attenuation as data
is transmitted up
and down the drill string. The nodes 30 may be integrated into an existing
section of drill
pipe or a down-hole tool along the drill string 12. Interface sub 17 in BHA 15
may also
include a network node (not shown separately). The nodes 30 are a portion of a
networked
drill string data transmission system 46 that provides an electromagnetic
signal path that is
9
CA 02948185 2016-11-04
WO 2015/175508
PCT/US2015/030335
used to transmit information along the drill string 12. The data transmission
system 46 may
also be referred to as a down-hole electromagnetic network, broadband network
telemetry, or
WDP telemetry and it is understood that the drill string 12 primarily referred
to below may be
replaced with other conveyance means. Communication links (not shown) may be
used to
connect the nodes 30 to one another, and may comprise cables or other
transmission media
integrated directly into sections of the drill string 12. The cable may be
routed through the
central wellbore of the drill string 12, routed externally to the drill string
12, or mounted
within a groove, slot, or passageway in the drill string 12. Induction coils
may be placed at
each connection 34 to transfer the signal being carried by the cable from one
drill pipe section
to another. Signals from the plurality of sensors in the BHA 15 (e.g., in
sensor packages 38,
or 19) and elsewhere along the drill string 12 are transmitted to a well site
computer located
on or near rig 20 through the data transmission system 46. A plurality of data
packets (not
shown) may be used to transmit information along the nodes 30. As previously
described,
nodes 30 may include booster assemblies. In some embodiments, the booster
assemblies are
spaced at 1,500 ft. (500 m) intervals to boost the data signal as it travels
the length of the drill
string 12 to prevent signal degradation. Communication links between the nodes
30 may also
use wireless connections.
[0034] Additionally, sensors 40 disposed on or within network nodes 30, allow
measurements to be taken along the length of the drill string 12. For purposes
of this
disclosure, the term "sensors" is understood to comprise sources (to
emit/transmit
energy/signals), receivers (to receive/detect energy/signals), and transducers
(to operate as
either source/receiver). Various types of sensors 40 may be employed along the
drill string
12 in various embodiments, including without limitation, axially spaced
pressure sensors,
temperature sensors, and others. While sensors 40 are herein described and
shown disposed
on the drill string 12, it should also be noted that sensors 40 may be
disposed on any down-
CA 02948185 2016-11-04
WO 2015/175508
PCT/US2015/030335
hole tubular that has an inner diameter that allows for the passage of flow
therethrough while
still complying with the principles of the current disclosure. For example,
sensors 40 may be
disposed on equipment such as, but not limited to, heavy weight drill pipe,
drill pipe, drill
collars, stabilizers, float subs, reamers, jars, or flow bypass valves. The
sensors 40 may also
be disposed on the nodes 30 positioned along the drill string 12, disposed on
tools
incorporated into the string of drill pipe, or a combination thereof In some
embodiments, the
sensors 40 measure the conditions (e.g., down-hole annular pressure,
temperature) around the
bore of the drill string 12 and in the annulus 22. Additionally, in some
embodiments, sensors
40 measure the conditions (e.g., pressure, temperature) within the bore of the
drill string 12.
Although only a few sensors 40 and nodes 30 are shown in the figures
referenced herein,
those skilled in the art will understand that a larger number of sensors may
be disposed along
a drill string when drilling a fairly deep well, and that all sensors
associated with any
particular node may be housed within or annexed to the node 30, so that a
variety of sensors
rather than a single sensor will be associated with that particular node.
[0035] The data transmission system 46 shown in FIG. 1 transmits down-hole
annular
pressure data measured by sensors in the BHA 15 (e.g., in sensor packages 38,
or 19), or by
each of a plurality of sensors 40 to the well site computer located on or near
rig 20. The
pressure data may be similar to the ones shown in the graph of FIG. 2 for
example. From the
well site computer, the pressure data may be displayed to drillers on a well
site screen. The
pressure data may also be transmitted from the well site computer to a remote
computer (not
shown), which is located at a site that is remote from the well site or rig
20. The remote
computer allows an individual in a location that is remote from the well site
or rig 20 to
review the data output by the sensors 40. Thus, the distributed network nodes
30 provide
measurements that give drillers or another individual additional insight into
what is
happening along the potentially miles-long length of the drill string 12.
Besides the absolute
11
CA 02948185 2016-11-04
WO 2015/175508
PCT/US2015/030335
value of pressure at each node 30, the gradients of the intervals between the
various nodes 30
can also be calculated based on the change in the measured absolute values at
each node 30.
These absolute values and gradient values may then be tracked as time
advances. Observed
variations over time in absolute measurements and the associated gradients may
then be
compared by preprogramed software, such that the specific conditions occurring
in the down-
hole environment may be monitored. As a result of this analysis, drillers may
be able to
make more informed decisions as more fully explained below.
[0036] Equivalent density is computed as the ratio of the down-hole pressure,
usually
expressed in pounds-force per square inch or in bars, to the true vertical
depth, usually
expressed in feet or meters. With appropriate conversion factors, the
equivalent density may
be expressed in pounds per gallon or in grams per cubic centimeters. The
equivalent density
represents the density required for a fluid column of a height equal to the
true vertical depth
of the measurement point to generate the measured pressure. FIG. 2 illustrates
annular
pressure data in the form of equivalent densities that may be acquired around
a drill pipe
connection time 205. Graph 200 shows curves of equivalent density 220 as a
function of
time 210. Curve 230 represents an essentially unprocessed or unfiltered
measurement, and
curve 240 represents a processed or filtered measurement. The processing may
include
removal of outliers, and low pass filtering, among other signal processing
techniques. In
some embodiments, the processing may be used for identification of the
equivalent density
during the connection in cases heave causes fluctuation on the equivalent
density. For
example, heave may cause fluctuations or periodic variations of the equivalent
density as the
drill string is held in slips, and signal processing may be used to remove
these periodic
variations from the computed equivalent density in order to identify a
"static" equivalent
density. The processing may include averaging the equivalent density data over
a period,
12
CA 02948185 2016-11-04
WO 2015/175508
PCT/US2015/030335
applying a median filter on the equivalent density data over a period, or
other type of filter
such as a frequency band stop filter.
[0037] Any of the two curves may be analyzed in periods, including drilling
periods 280a
and 280b, a clean-up period 285, a pumps-off period 290, and a pump ramp-up
period 295.
For example, when drilling has progressed during drilling period 280a as far
as the drill string
can extend without an additional joint of drill pipe, the drilling fluid may
be circulated
without drilling the formation, or sometime while reaming the formation,
during clean-up
period 285. While clean-up is sometimes associated with a transition between
drilling fluid
and completion fluid, clean-up refers herein to circulation periods wherein
drilling fluid is
pumped into the wellbore to move the cuttings above a distance above the BHA
and to
prevent cutting settlement on top of the BHA components. Clean-up is not
necessarily a
complete evacuation of all cuttings from the wellbore, and may achieve only a
relative
cutting density reduction around the bottom of the drill string or around the
BHA. The mud
circulating pumps are deactivated during pumps-off period 290, and the end of
the drill string
is set in holding slips (at 260) that support the weight of the drill string,
the BHA and the drill
bit. The kelly or top drive is then disconnected from the end of the drill
string; an additional
joint of drill pipe is threaded and torqued onto the exposed, surface end of
the drill string.
The kelly or top drive is then reconnected to the top end of the newly
connected joint of drill
pipe. Once the connection is made, the mud pumps are reactivated to power the
drill motor
during pump ramp-up period 295, and drilling resumes during drilling period
280b.
Preprogrammed software may be used to identify values that are indicative of
the pressure
data in the different periods. For example, ECD value 250 may be indicative of
the drilling
period occurring prior to making the connection. It may be obtained from a
time average of
data prior to the clean-up period 285. Similarly, ECD value 255 may be
indicative of the
clean-up period occurring prior to making the connection, and ECD value 275 of
the pump
13
CA 02948185 2016-11-04
WO 2015/175508
PCT/US2015/030335
ramp-up period occurring after making the connection. During the pumps-off
period 290,
two values may be identified: ESD value 265 may be indicative of the pumps-off
period prior
to making the connection, and ESD value 270 may be indicative of the pumps-off
period
prior to making the connection.
[0008] In the example shown in FIG. 2, the equivalent static density changes
during the
pumps-off period around the drill pipe connection 205. The equivalent density
is initially at
value 265 after transient effect (at 260) caused by the drill string being set
in slips, and then
increases to value 270 after the drill pipe connection 205. The equivalent
density may
decrease during the pumps-off period depending on the amount of cuttings that
settles, or
similarly, depending on the distance between cuttings and the bottom of the
wellbore, well
orientation and drilling fluid properties. And the equivalent density may
increase depending
on thermal expansion of the drill string and drilling fluid. A large downward
variation of
equivalent density suggests that cuttings may pack-off at the bottom of the
wellbore and that
the clean-up duration is too short; in other words, the clean-up is performed
too aggressively.
Conversely, a large upward variation of equivalent density suggests that the
wellbore may
have been excessively cooled and cleaned prior to the pumps-off and the clean-
up duration is
too long; in other words, the clean-up is performed too conservatively. Or the
large upward
variation suggests that the duration of pipe connection lasted a long time.
[0039] Further, the equivalent circulating density changes during the clean-up
and ramp-up
periods around the connection 205. The equivalent density is at the maximum
(value 250)
just before the clean-up period 285, and then reduces during the clean-up
period to value 255.
The equivalent density during the drilling and clean-up periods increases with
the rate at
which cuttings are generated, that is, according to the rate of penetration of
the drill bit in the
formation rock, and decreases with the rate at which cuttings are evacuated by
circulation of
the drilling fluid. A large upward variation of equivalent density suggests
that drilling may
14
CA 02948185 2016-11-04
WO 2015/175508
PCT/US2015/030335
be performed too aggressively. Conversely, a large downward variation of
equivalent density
suggests that cuttings may be evacuated very efficiently from the wellbore and
drilling is
perhaps advancing at a too conservative rate, or that clean-up periods may be
longer than
needed.
[0040] Thus, the example shown in FIG. 2 shows that variations of ECD or ESD
values
before and after the connection may be used as indicators of the risk
generated by the
ongoing drilling operations and of the performance of these operations. These
variations may
be compared with threshold values to determine the aggressiveness and/or the
conservativeness of wellbore drilling operations. Further, the aggressiveness
and/or the
conservativeness of wellbore drilling operations may be used to improve or
optimize drilling
operations as described herein. The interpretation of the evolution of annular
pressure
described in relation with the example graph of FIG. 2 may be generalized
using a method of
measuring performance and quantifying risk as described by the flow chart 300
of FIG. 3.
The method may be used to quantify the levels of equivalent density variations
associated
with 1) uneconomical or suboptimal performance or low risks, and 2) high
performance and
high risks.
[0041] At block 310, values of annular pressure are acquired. These values may
be actual
annular pressure measurements performed in a wellbore being drilled, in
wellbores having
been drilled in an area of interest near the wellbore being drilled, or in
other wellbores
identified for their similarity with the wellbore being drilled, such as
wellbores drilled
through similar rock formations. Alternatively or additionally, these values
may be computed
using a fluid circulation model of the wellbore being drilled. These values
may represent the
evolution of annular pressure around a plurality of drill pipe connections.
For example, the
evolution of annular pressure around fifty, or any other number of different
drill pipe
connections may be acquired.
CA 02948185 2016-11-04
WO 2015/175508
PCT/US2015/030335
[0042] At block 320, equivalent densities are optionally computed from the
annular pressure
values as described herein. Equivalent densities may sometimes be easier to
interpret
because equivalent density combines the effect that true vertical depth has on
annular
pressure. However, annular pressures may also be used instead on equivalent
densities
without departing from the scope of the present disclosure. Further, the
equivalent densities
may optionally be normalized over a drilling interval, such as between zero
and one.
Normalization may facilitate a meaningful comparison between different
drilling intervals,
different wellbores, or different drilling conditions. Still further, the
equivalent densities may
optionally be processed and/or filtered using signal processing methods known
in the art or
developed in the future. Thus, annular pressure data include, but are not
limited to,
unprocessed and unfiltered annular pressure values, processed or filtered
annular pressure
values, unprocessed and unfiltered equivalent density values, and processed
(e.g.,
normalized) and filtered equivalent density values.
[0043] At block 330, the evolution of the equivalent density values around
each connection is
analyzed. For example as shown in FIG. 2 for a single connection, the
equivalent density
values may be parsed based on the acquisition time of the values into a first
drilling period, a
clean-up period, a pumps-off period, a pump ramp-up or slow-down period, and a
second
drilling period. However the equivalent density values may be parsed into
fewer periods, for
example the clean-up period may be omitted. The equivalent density values may
also be
parsed into additional periods, such as a setting-in-slips period, a picking-
off-slips periods,
tripping periods, etc... At least one equivalent density value may then be
identified in each
of the period for each connection. For example, an average of a few latest
values, such as the
last five values, or the values acquired in the last five seconds, before the
end of each period
may be identified. As shown in FIG. 2, value 250 may be identified just before
the end of
first drilling period 280a, value 255 may be identified just before the end of
clean-up period
16
CA 02948185 2016-11-04
WO 2015/175508
PCT/US2015/030335
285, and value 270 may be identified just before the end of pumps-off period
290.
Alternatively or additionally, an average of a few earliest values, such as
the first five values
or the values acquired in the first five seconds, after the beginning of each
period may be
identified. For example as shown in FIG. 2, value 265 may be identified just
after the
beginning of pumps-off period 290, and value 275 may be identified just after
the beginning
of pump ramp-up or slow-down period 295. Average over a larger or lower number
of
values, or over a longer or shorter time interval, and other identifying
methods, such as
identifying a median value, a maximum value, or a minimum value on a sub-
interval of each
period may also be used.
[0044] Thus, in cases where fifty different drill pipe connections are
analyzed at block 330,
fifty equivalent density values may be identified in the different drilling
periods preceding the
fifty drill pipe connections, fifty more equivalent density values may be
identified in the
different clean-up periods, and fifty more equivalent density values may be
identified in the
different pump ramp-up or slow-down periods, etc . . . Variations of
equivalent density may be
computed by difference of the identified values in the different periods
around a single drill
pipe connection, or by difference of identified values in one single period,
or even by
computing standard deviation or other indices of variation of the equivalent
density in a
single period.
[0045] At block 340, the variations of equivalent density may be analyzed as a
function of
drilling conditions. For example, the equivalent density variations between
the beginning and
the end of the pumps-off period may be parsed into the variations that
correspond to data
acquired in water based mud ("WBM") and the variations that correspond to data
acquired in
oil based mud ("OBM"). Similarly, the equivalent density variations between
the clean-up
period and the pump ramp-up or slow-down period may be parsed into the
variations that
correspond to data acquired in WBM and the variations that correspond to data
acquisition in
17
CA 02948185 2016-11-04
WO 2015/175508
PCT/US2015/030335
OBM. In this example, the variations are analyzed as a function of mud type,
wherein the
mud type is either WBM or OBM. Additionally or alternatively, other drilling
conditions
may be analyzed in a way similar to mud types. These drilling conditions may
also include,
but are not limited to, formation type, wellbore inclination, etc... Formation
type may
include, but is not limited to, soft rock, hard rock, sticky rock, etc...
[0046] At block 350, the trend of equivalent density variations as a function
of time, wellbore
length, or driller depth is determined, such as by using regression analysis
or other methods.
For example, the equivalent density variations between the beginning and the
end of the
pumps-off period acquired in drilling muds of a given type, in rocks of a
given type, and in
wellbores with similar trajectory or directional profiles may increase with
the length of
uncased wellbore that has been drilled, for example regardless of the rig crew
tour that has
operated the drilling equipment. And this increasing trend may be determined
at step 350.
Conversely, the equivalent density variations between the clean-up period and
the pump
ramp-up or slow-down period acquired in drilling muds of the same type, in
rocks of the
same type, and in vertical wells may decrease with the length of uncased
wellbore that has
been drilled, for example regardless of the rig crew tour that has operated
the drilling
equipment. And this decreasing trend may also be determined at step 350.
Further, the
trends determined at block 350 may be extrapolated to lengths of uncased
wellbore for which
no annular pressure data has been acquired. Still further, annular pressure
and/or equivalent
density variations may be corrected for the difference of length of uncased
wellbore that has
been drilled, and be expressed as variations at a given nominal length, such
as at one
thousand feet of uncased wellbore, or any other length.
[0047] At block 360, the equivalent density variations may be correlated to
drilling
efficiency. For example, drilling efficiency may comprise the total duration
of the clean-up,
the pumps-off, and the pump ramp-up or slow-down periods. The equivalent
density
18
CA 02948185 2016-11-04
WO 2015/175508
PCT/US2015/030335
variations may also be correlated to drilling risk. For example, drilling risk
may comprise a
simulated value of the amount of cuttings suspended in the wellbore at the end
of the clean-
up period, or a simulated value of the amount of cuttings that has settled at
the end of the
pumps-off period.
[0048] The correlation performed in some embodiments of block 360 may indicate
that a
large negative variation of the equivalent density between the beginning and
the end of the
pumps-off period (i.e., ESD after ¨ ESD before) is associated with efficient
but risky drilling
operations. Also, the correlation may indicate that a large positive variation
of the equivalent
density between the beginning and the end of the pumps-off period is
associated with low
risk but uneconomical or suboptimal drilling operations.
[0049] The correlation performed in other embodiments of block 360 may
indicate that a
large variation, either positive or negative, of the equivalent density
between the clean-up
period and the pump ramp-up period (i.e., ECD after ¨ ECD before) is
associated with
efficient but risky drilling operations. Also, the correlation may indicate
that a small
variation, either positive or negative, of the equivalent density between the
clean-up period
and the pump ramp-up or slow-down period is associated with low risk but
uneconomical or
suboptimal drilling operations.
[0050] The correlation performed in yet other embodiments of block 360 may
indicate that a
small positive or negative variation of the equivalent density between the
clean-up period and
the first drilling period (i.e., ECD kelly down ¨ ECD before) is associated
with efficient but
risky drilling operations. Also, the correlation may indicate that a large
positive variation of
the equivalent density between the clean-up period and the first drilling
period is associated
with low risk but uneconomical or suboptimal drilling operations.
[0051] The correlation performed in yet other embodiments of block 360 may
indicate that a
large positive variation of the equivalent density between the beginning of
the pumps-off
19
CA 02948185 2016-11-04
WO 2015/175508
PCT/US2015/030335
period and the clean-up period (ECD before ¨ ESD before) is associated with
efficient but
risky drilling operations. Also, the correlation may indicate that a small
positive variation of
the equivalent density between the clean-up period and the beginning of the
pumps-off period
is associated with low risk but uneconomical or suboptimal drilling
operations.
[0052] At block 370, a statistical analysis on the variations of equivalent
density correlated
with low risk but uneconomical or suboptimal drilling operations may be used
to quantify the
threshold beyond which variations may be indicative of uneconomical or
suboptimal
performance and low risk. If the data used are equivalent densities for
example, a variation
of equivalent density of a magnitude less than the threshold of one half
pounds per gallon
(0.5 ppg), or any other value determined from the statistical analysis, may be
uneconomical
or suboptimal. If the data used are equivalent densities normalized between
zero and one for
example, a variation of equivalent density of a magnitude less than the
threshold of forty
percent (40%), or any other value determined from the statistical analysis,
may be
uneconomical or suboptimal.
[0053] At block 380, a statistical analysis on the variations of equivalent
density correlated
with efficient but risky drilling operations may be used to quantify the
threshold beyond
which variations may be indicative of high risk and high performance. If the
data used are
equivalent densities for example, a variation of equivalent density of a
magnitude greater than
the threshold of one pound per gallon (1 ppg), or any other value determined
from the
statistical analysis, may be highly risky. If the data used are equivalent
densities normalized
between zero and one for example, a variation of equivalent density of a
magnitude greater
than the threshold of seventy percent (70%), or any other value determined
from the
statistical analysis, may be uneconomical or suboptimal.
[0054] The thresholds determined at blocks 370 and 380 may depend on the
drilling
conditions. For example, the threshold may differ in WBM and in OBM, and/or
may depend
CA 02948185 2016-11-04
WO 2015/175508
PCT/US2015/030335
on other drilling conditions analyzed at block 340, such as formation type,
wellbore
inclination, etc... Also, the thresholds determined at blocks 370 and 380 may
depend on the
length of uncased wellbore. For example, the threshold may follow the trend
determined at
block 350.
[0055] The threshold values computed in accordance with the present disclosure
are thus
indicative of limits between aggressive and/or conservative of drilling
operations. Variations
of annular pressure measured around a drill pipe connection may be compared in
real-time or
near real-time with corresponding threshold values and the drilling operations
may be
adjusted based on the comparison as described in the flow chart 400 of FIG. 4.
The flow
chart 400 illustrates a method that may be used to change or adjust a pumping
rate or a
pumping duration based on the comparison; and a drilling fluid circulation
pump may be
operated (e.g., controlled) at the adjusted pumping rate or for the determined
pumping
duration subsequent the drill pipe connection. The method may also be used to
change or
adjust circulation flow rate, weight on bit and string rotation speed during a
drilling period
subsequent the connection.
[0056] At block 410, annular pressure data may be measured at one or more
locations along
drill string 12 using sensors 38, 40 shown in FIG. 1. Other data, such as
temperature data
may also be measured at block 410.
[0057] At block 420, the annular pressure data measured at block 410 may be
transmitted to a
well site computer or to a remote computer using a data transmission system,
such as the
WDP transmission system 46 shown in FIG. 1. For example, the data may be first
converted
in equivalent density using a true vertical depth ("TVD") computed by the well
site computer
or to the remote computer. The equivalent density may be processed and
filtered.
[0058] At block 430, pressure variations around one given pipe connection are
determined in
real-time or near real-time. Preprogrammed software may be used to identify
values that are
21
CA 02948185 2016-11-04
WO 2015/175508
PCT/US2015/030335
indicative of equivalent density in the different periods or in the same
period as described
herein and illustrated for example in FIG. 2. A pressure variation may be
determined from
identified first and second values. The variation may be normalized.
[0059] At block 440, the variation is compared to threshold values, for
example the pairs of
threshold values determined using the method of measuring performance and
quantifying risk
shown in FIG. 3. In some example embodiments, the comparison with one of the
threshold
values may suggests that duration of clean-up periods before connections is
too long, or the
comparison with the other of the threshold values may suggests that the
duration is too short.
In some other example embodiments, the comparison with one of the threshold
values may
suggests that the pumping rate of the circulation pump during ramp-up or slow-
down periods
increases too slowly or the comparison with the other of the threshold values
may suggests
that the pumping rate increases too fast. In yet some other example
embodiments, the
comparison with one of the threshold values may suggests that the rate of
penetration of the
drill bit is too slow, or the comparison with the other of the threshold
values may suggests
that the rate of penetration of the drill bit is too fast.
[0060] At block 450, the variation, threshold(s), and drilling condition(s)
may be displayed to
a driller. As shown for example in FIG. 5, the variation 530 between first and
second values
and the threshold value (510, 520) may be displayed on a visualization dial
500. In this
example, the threshold value 510 may correspond to a value beyond which
drilling operations
are low risk but uneconomical or suboptimal. The threshold value 520 may
correspond to a
value beyond which drilling operations are efficient but risky. As shown for
example in FIG.
6, block 450 may alternatively or additionally comprise adding the variation
between first and
second values on a log 600 including indications of drilling conditions. The
log 600 may
comprise a chart of amplitude 620 of normalized variation (increasing toward
the right of
FIG. 6) as a function of drill pipe connection depth (or time) 610 (increasing
toward the
22
CA 02948185 2016-11-04
WO 2015/175508
PCT/US2015/030335
bottom of FIG. 6). The variation may be added as a bar 644 at the bottom of
the log 600,
below the bars corresponding to the variations previously displayed on the log
600. Each bar
of the chart may be colored based on the comparison with the threshold values
indicative of
low risk but uneconomical or suboptimal operations, and efficient but risky
operations. For
example, bar 640 corresponding to a variation measured near the beginning of
the log 600
may be colored to indicate a variation value that falls beyond the threshold
value indicative of
efficient but risky operations. Bar 644 corresponding to the variation
measured the latest
during the drilling operation may be colored to indicate a variation value
that falls beyond the
threshold value indicative of low risk but uneconomical or suboptimal
operations. Similarly
bar 642 may be colored to indicate a variation value that falls neither beyond
the threshold
value indicative of efficient but risky operations, nor beyond the threshold
value indicative of
low risk but uneconomical or suboptimal operations. Also shown in log 600 are
indications
of rig crew tours 630, 633, 636. Indications of rig crew tours may be used to
compare the
performance between drillers for examples. In the shown example, the driller
of rig crew
tour 630 may have operated the drilling equipment in an efficient but risky
way, whereas the
driller of rig crew tour 636 may have operated the drilling equipment in a low
risk but
uneconomical or suboptimal way. Other drilling conditions (not shown) may
comprise at
least one of mud type, formation type, and wellbore inclination. These
drilling conditions
may help explain the variations shown in log 600. Also shown in log 600 are
trends 650,
such as trend with time or wellbore length. Trends 650 may also be used to
quantify risk and
evaluate performance.
[0061] Returning to FIG. 4, a determination of whether another analysis is to
be performed is
made at block 460. For example, the variation of the equivalent density
between the
beginning and the end of the pumps-off period at a first location along the
drill string may be
determined, evaluated and displayed in a first instance of blocks 430, 440 and
450. In some
23
CA 02948185 2016-11-04
WO 2015/175508
PCT/US2015/030335
cases, it may be useful to determine, evaluate and display the variation of
the equivalent
density between the beginning and the end of the pumps-off period at other
locations
different from the first location in subsequent instances of blocks 430, 440
and 450. In some
cases, it may be useful to also determine, evaluate and display the variation
of the equivalent
density between the clean-up period and the pump ramp-up or slow-down period,
the
variation of the equivalent density between the first drilling period and the
clean-up period,
and/or the variation of the equivalent density between the clean-up period and
the beginning
of the pumps-off period in subsequent instances of blocks 430, 440 and 450.
Thus, multiple
visualization dials 500 and logs 600 corresponding to variations between
different types of
periods may be displayed to the driller.
[0062] At block 470, the drilling equipment may be operated (e.g., actuated,
controlled,
etc...) based on one or more comparisons performed at block 450 as described
herein, for
example in the description of FIGS. 7, 8, 9 and 10.
[0063] One example embodiment of blocks 430, 440, 450, 460, and 470 is shown
in flow
chart 700. At block 730, at least a first pressure data value (e.g., a static
value) is identified
during a pumps-off period prior to making a connection. Optionally, other
pressure data
values may also be identified, for example a dynamic value during a
circulation period, etc...
At block 740, at least a second pressure data value is identified after making
the connection.
Again, other pressure data values may also be identified, for example a
dynamic value during
a pump ramp-up or slow-down period, etc... At block 750, the variation between
first and
second values is displayed. At block 760, the variation is compared to one or
more
thresholds. At optional block 770, a pumping rate, for example the pumping
rate used during
a subsequent ramp-up or slow-down period, or the pumping rate used during a
subsequent
drilling period, is determined based on the comparison. For example, the
pumping rate may
be decreased from a currently used value by five percent or by any other value
when the
24
CA 02948185 2016-11-04
WO 2015/175508
PCT/US2015/030335
variation value is beyond the threshold value indicative of efficient but
risky operations. The
pumping rate may alternatively be increased from the currently used value by
five percent or
any other value when the variation value is beyond the threshold value
indicative of low risk
but inefficient operations. The pumping rate may otherwise remain unchanged.
At optional
block 780, a pumping duration, for example the pumping duration used during a
subsequent
ramp-up or slow-down period, or the pumping duration used during a subsequent
clean-up
period is determined based on the comparison. For example, the pumping
duration may be
increased from a currently used value by five percent or by any other value
when the
variation value is beyond the threshold value indicative of efficient but
risky operations. The
pumping duration may alternatively be decreased from the currently used value
by five
percent or any other value when the variation value is beyond the threshold
value indicative
of low risk but inefficient operations. The pumping duration may otherwise
remain
unchanged. At block 790, the drilling fluid circulation pump is operated at
the pumping rate
and for pumping duration determined at blocks 770 and/or 780.
[0064] Another example embodiment of blocks 430, 440, 450, 460, and 470 is
shown in flow
chart 800. At block 830, a first pressure data value is identified during a
pumps-off period
prior to making a connection. At block 840, a second pressure data value is
identified during
a pumps-off period after making the connection. At block 850, the variation
between first
and second values is displayed. At block 860, the variation is compared to a
first threshold
indicative of low risk but uneconomical or suboptimal operations. At block
870, a duration
to be used for cleaning-up the wellbore prior to the subsequent drill pipe
connection is made
shorter than the duration used prior to the current drill pipe connection when
the variation
between first and second values is greater than the first threshold, or at
least as long as the
duration used prior to the current drill pipe connection when the variation
between first and
second values is not smaller than the first positive threshold. At block 880,
the variation is
CA 02948185 2016-11-04
WO 2015/175508
PCT/US2015/030335
compared to a second threshold indicative of efficient but risky operations.
At block 890, the
duration to be used for cleaning-up the wellbore prior to the subsequent drill
pipe connection
is made longer than the duration used prior to the current drill pipe
connection when the
variation between first and second values is less than the second negative
threshold, or at
least as long as the duration used prior to the current drill pipe connection
when the variation
between first and second values is not larger than the second threshold.
[0065] Another example embodiment of blocks 430, 440, 450, 460, and 470 is
shown in flow
chart 900. At block 930, a first pressure data value is identified during a
clean-up period
prior to making a connection. At block 940, a second pressure data value is
identified during
pump ramp-up period after making the connection. At block 950, the variation
between first
and second values is displayed. At block 960, the variation magnitude is
compared to a first
small threshold indicative of low risk but uneconomical or suboptimal
operations. At block
970, a duration to be used for kicking-in the pumps after the subsequent drill
pipe connection
is made shorter than the duration used after the current drill pipe connection
when the
variation magnitude is less than the first threshold, and a corresponding
pumping rate may be
increased. At block 980, the variation magnitude is compared to a second large
threshold
indicative of efficient but risky operations. At block 990, the duration to be
used for kicking-
in the pumps after the subsequent drill pipe connection is made longer than
the duration used
after the current drill pipe connection when the variation magnitude is larger
than the second
threshold, and a corresponding pumping rate is decreased.
[0066] Another example embodiment of blocks 430, 440, 450, 460, and 470 is
shown in flow
chart 1000. At block 1030, a first pressure data value is identified during a
clean-up period
prior to making the connection. At block 1040, a second pressure data value is
identified
during a drilling period prior to making a connection. At block 1050, the
variation between
first and second values is displayed. At block 1060, the variation is compared
to a first large
26
CA 02948185 2016-11-04
WO 2015/175508
PCT/US2015/030335
threshold indicative of low risk but uneconomical or suboptimal operations. At
block 1070,
the weight on bit is increased, and/or the string rotation speed is increased
when the variation
is higher than the first threshold, and a circulation rate may also be
decreased. Increasing the
weight on bit may be achieved by increasing the drill string hoist slack off,
and in other
words, by increasing the rate of penetration ("ROP") of the bit. At block
1080, the variation
magnitude is compared to a second small threshold indicative of efficient but
risky
operations. At block 1090, the weight on bit is decreased, and/or the string
rotation speed is
decreased when the variation is lower than the first threshold, and a
circulation rate may also
be increased.
[0067] Another example embodiment of blocks 430, 440, 450, 460, and 470 is
shown in flow
chart 1100. At block 1130, a first pressure data value is identified. At block
1140, a second
pressure data value is identified while setting drill string in slips, or
while picking up drill
string off slips. At block 1150, the variation between first and second values
is displayed. In
cases where the first pressure data is identified during a pumps-off period
when the drill
string is stationary in the wellbore, the first value is a pressure baseline,
and the variation
between the first and second values may be a relative pressure change mainly
influenced by
the speed of the drill string while setting it in slips, or while picking it
up off slips. In cases
where both the first and second values are identified while setting drill
string in slips or while
picking up drill string off slips, the variation between first and second
values maybe a
pressure change rate mainly influenced by the acceleration of the drill string
while setting it
in slips, or while picking it up off slips. At block 1160, the variation
magnitude is compared
to a first small threshold indicative of low risk but uneconomical or
suboptimal operations.
At block 1170, at least one of the speed and the acceleration of the traveling
block or other
hoisting equipment is increased when the variation is lower than the first
threshold. At block
1180, the variation magnitude is compared to a second large threshold
indicative of efficient
27
CA 02948185 2016-11-04
WO 2015/175508
PCT/US2015/030335
but risky operations. At block 1190, at least one of the speed and the
acceleration of the
traveling block or other hoisting equipment is decreased when the variation is
higher than the
second threshold.
[0068] The foregoing outlines features of several embodiments so that those
skilled in the art
may better understand the aspects of the present disclosure. Those skilled in
the art should
appreciate that they may readily use the present disclosure as a basis for
designing or
modifying other processes and structures for carrying out the same purposes
and/or achieving
the same advantages of the embodiments introduced herein. Those skilled in the
art should
also realize that such equivalent constructions do not depart from the spirit
and scope of the
present disclosure, and that they may make various changes, substitutions and
alterations
herein without departing from the spirit and scope of the present disclosure.
28