Note: Descriptions are shown in the official language in which they were submitted.
CA 02972306 2017-06-27
WO 2016/107740 - 1 - PCT/EP2015/079873
Method for the absolute quantification of naturally processed HLA-restricted
cancer peptides
The present invention relates to a method for the absolute quantification of
naturally
processed HLA-restricted cancer peptides, i.e. the determination of the copy
number
of peptide(s) as presented per cell. The present invention can not only be
used for
the development of antibody therapies or peptide vaccines, but is also highly
valuable for a molecularly defined immuno-monitoring, and useful in the
processes of
identifying of new peptide antigens for immunotherapeutic strategies, such as
respective vaccines, antibody-based therapies or adoptive T-cell transfer
approaches
in cancer, infectious and/or autoimmune diseases.
Field of the invention
Development of cancer immuno-therapeutics and immuno-therapies of autoimmune
and infectious diseases aiming to induce the immune system's T-cell arm to
fight
cancer might be substantially improved by a profound knowledge of human
leukocyte
antigen (HLA)-bound peptide presentation levels on primary diseased tissues.
This
information is relevant for antibody-based therapies or peptide vaccines in
particular
as well as for any other type of T-cell vaccine based on molecular entities
such as
protein, DNA or RNA. This kind of quantitative data has not been available for
patient-derived tissue on an absolute copy per cell-scale before.
A method for identifying peptides as above avoiding the "reverse immunology"-
associated problem was disclosed in EP150804761. As described above, this
method can not be used for the quantitation of said peptides. Another method
employing a labeling strategy was disclosed in WO 2005/076009 which allowed
for
some quantitation, but not on an absolute scale. Other labels were disclosed,
for
example, in WO 03/025576 or by Martin et al in Proteomics 2003, 3, 2208-2220.
Another method was disclosed by Fortier et al (The MHC class I peptide
repertoire is
molded by the transcriptome, JEM, Vol. 205, No. 3, March 17, 2008 595-610).
This
- 2 -
method has the disadvantages that it requires the dissection of MHC-bound
peptides
from non-MHC-binding peptides due to acid elution. This is performed using b2m-
knockout cell lines: Thus, this method can not be used for primary ¨ patient ¨
tumor
materials. In the method, primary murine thymocytes were compared to the
murine
EL4 cell line. The starting amounts had been adjusted by measuring MHC I
molecules. This alone is a strong restriction of the method disclosed by
Fortier et at.
Furthermore, a normalization as it would be required for primary tissues of
different
sizes and tissue origin was not applied. Rather, balanced starting materials
were
used making normalization obsolete. However, normalization is absolutely
necessary
for primary (patient) materials.
W02011/128448 discloses a method for quantitatively identifying relevant HLA-
bound peptide antigens from primary tissue specimens on a large scale without
labeling approaches. The method comprises the steps of providing at least one
diseased primary tissue sample and at least one sample of primary healthy
tissue
preferably corresponding to the diseased tissue, isolating MHC peptide ligands
from
said sample(s), performing an HPLC-MS analysis on said MHC ligand peptides,
extracting the precursor ion signal intensity (area) for each signal, as
derived from
the analyses, identifying the sequences of said MHC ligand peptides, and
normalizing steps and data quality control steps in order to relatively
quantify said
MHC peptide ligands without labeling.
Hassan et at. (in: Hassan C, et al, Accurate quantitation of MHC-bound
peptides by
application of isotopically labeled peptide MHC complexes, J Prot (2014))
disclose an
approach in which isotope-labeled peptide-MHC monomers (hpMHC) are prepared
and added directly after cell lysis, i.e. before the usual sample processing.
Using this
approach, all losses during sample processing can be accounted for and allow
accurate determination of specific MHC class l-presented ligands. The study
pinpoints the immunopurification step as the origin of the rather extreme
losses
during sample pretreatment and offers a solution to account for these losses.
The
strategy presented can be used to obtain a reliable view of epitope copy
number and
thus is said to allow improvement of vaccine design and strategies for
immunotherapy.
CA 2972306 2019-07-29
CA 02972306 2017-06-27
WO 2016/107740 - 3 - PCT/EP2015/079873
Stimulation of an immune response is dependent upon the presence of antigens
recognized as foreign by the host immune system. The discovery of the
existence of
tumor associated and disease antigens has raised the possibility of using a
host's
immune system to intervene in tumor growth. Various mechanisms of harnessing
both the humoral and cellular arms of the immune system are currently being
explored for cancer immunotherapy.
Specific elements of the cellular immune response are capable of specifically
recognizing and destroying tumor cells. The isolation of cytotoxic T-cells
(CTL) from
tumor-infiltrating cell populations or from peripheral blood suggests that
such cells
play an important role in natural immune defenses against cancer. CD8-positive
T-
cells (T-CD8+) in particular, which recognize peptides bound to class I
molecules of
the major histocompatibility complex (MHC). These peptides of usually 8 to 12
amino
acid residues are derived from proteins or defective ribosomal products
(DRIPS)
located in the cytosol and play an important role in this response. Human MHC-
molecules are also designated as human leukocyte-antigens (HLA).
There are two classes of MHC-molecules: MHC class I molecules that can be
found
on most cells having a nucleus. MHC molecules are composed of an alpha heavy
chain and beta-2-microglobulin (MHC class I receptors) or an alpha and a beta
chain
(MHC class ll receptors), respectively. Their three-dimensional conformation
results
in a binding groove, which is used for non-covalent interaction with peptides.
MHC
class I present peptides that result from proteolytic cleavage of
predominantly
endogenous proteins, DRIPs and larger peptides. MHC class II molecules can be
found predominantly on professional antigen presenting cells (APCs), and
primarily
present peptides of exogenous or transmembrane proteins that are taken up by
APCs during the course of endocytosis, and are subsequently processed.
Complexes of peptide and MHC class I molecules are recognized by CD8-positive
cytotoxic T-lymphocytes bearing the appropriate TCR (T-cell receptor), whereas
complexes of peptide and MHC class ll molecules are recognized by CD4-positive-
helper-T cells bearing the appropriate TCR. It is well known that the TCR, the
peptide
and the MHC are thereby present in a stoichiometric amount of 1:1:1.
For a peptide to trigger (elicit) a cellular immune response, it must bind to
an MHC-
CA 02972306 2017-06-27
WO 2016/107740 - 4 - PCT/EP2015/079873
molecule. This process is dependent on the allele of the MHC-molecule and
specific
polymorphisms of the amino acid sequence of the peptide. MHC-class-I-binding
peptides are usually 8-12 amino acid residues in length and usually contain
two
conserved residues ("anchors") in their sequence that interact with the
corresponding
binding groove of the MHC-molecule. In this way, each MHC allele has a binding
motif that controls the peptide's ability to specifically bind to the binding
groove.
In the MHC class I dependent immune reaction, peptides not only have to be
able to
bind to certain MHC class I molecules being expressed by tumor cells, they
also have
to be recognized by T cells bearing specific T cell receptors (TCR).
The antigens that are recognized by the tumor specific cytotoxic T
lymphocytes, that
is, their epitopes, can be molecules derived from all protein classes, such as
enzymes, receptors, transcription factors, etc. which are expressed and, as
compared to unaltered cells of the same origin, up-regulated in cells of the
respective
tumor.
The current classification of tumor associated or disease associated antigens
comprises the following major groups:
Cancer-testis antigens: The first TAAs [tumor-associated antigens; disease-
associated antigens are abbreviated DAA] ever identified that can be
recognized by
T cells belong to this class, which was originally called cancer-testis (CT)
antigens
because of the expression of its members in histologically different human
tumors
and, among normal tissues, only in spermatocytes/spermatogonia of testis and,
occasionally, in placenta. Since the cells of testis do not express class I
and II HLA
molecules, these antigens cannot be recognized by T cells in normal tissues
and can
therefore be considered as immunologically tumor-specific. Well-known examples
for
CT antigens are the MAGE family members or NY-ESO-1.
Differentiation antigens: These TAAs are shared between tumors and the normal
tissue from which the tumor arose; most are found in melanomas and normal
melanocytes. Many of these melanocyte lineage-related proteins are involved in
the
biosynthesis of melanin and are therefore not tumor specific but nevertheless
are
widely used for cancer immunotherapy. Examples include, but are not limited
to,
tyrosinase and Melan-A/MART-1 for melanoma or PSA for prostate cancer.
CA 02972306 2017-06-27
WO 2016/107740 - 5 - PCT/EP2015/079873
Over-expressed TAAs: Genes encoding widely expressed TAAs have been detected
in histologically different types of tumors as well as in many normal tissues,
generally
with lower expression levels. It is possible that many of the epitopes
processed and
potentially presented by normal tissues are below the threshold level for T-
cell
recognition, while their over-expression in tumor cells can trigger an
anticancer
response by breaking previously established tolerance. Prominent examples for
this
class of TAAs are Her-2/neu, Survivin, Telomerase or WT1.
Tumor specific antigens: These unique TAAs arise from mutations of normal
genes
(such as P-catenin, CDK4, etc.). Some of these molecular changes are
associated
with neoplastic transformation and/or progression. Tumor specific antigens are
generally able to induce strong immune responses without bearing the risk for
autoimnnune reactions against normal tissues. On the other hand, these TAAs
are in
most cases only relevant to the exact tumor on which they were identified and
are
usually not shared between many individual tumors.
TAAs arising from abnormal post-translational modifications: Such TAAs may
arise
from proteins which are neither specific nor over-expressed in tumors but
nevertheless become tumor associated by posttranslational processes primarily
active in tumors. Examples for this class arise from altered glycosylation
patterns
leading to novel epitopes in tumors as for MUC1 or events like protein
splicing during
degradation which may or may not be tumor specific.
Oncoviral proteins: These TAAs are viral proteins that may play a critical
role in the
oncogenic process and, because they are foreign (not of human origin), they
can
evoke a T-cell response. Examples of such proteins are the human papilloma
type 16
virus proteins, E6 and E7, which are expressed in cervical carcinoma.
For proteins to be recognized by cytotoxic T-lymphocytes as tumor-specific or -
associated antigens or disease-specific or -associated antigens, and to be
used in a
therapy, particular prerequisites must be fulfilled. The antigen should be
expressed
mainly by tumor cells or infected cells and not at all or only in comparably
small
amounts by normal healthy tissues, for example less by the factor 5, 10 or
more.
In infectious diseases there are two possibilities, first the infected cells
express an
antigen not expressed by healthy cells ¨ directly associated to the infection -
or the
infected cells over-express an antigen expressed only in very small amounts by
CA 02972306 2017-06-27
WO 2016/107740 - 6 - PCT/EP2015/079873
healthy cells ¨ the over-expression of an antigen normally found in the
peptidome of
a healthy cell.
It is furthermore desirable, that the respective antigen is not only present
in a type of
tumor, infection or strain, but also in high concentrations (i.e. copy numbers
of the
respective peptide per cell). Tumor-specific and tumor-associated antigens and
disease-specific or disease-associated antigens are often derived from
proteins
directly involved in transformation of a normal cell to a tumor / infected
cell due to a
function e.g. in cell cycle control or suppression of apoptosis.
In the case of cancer, additional downstream targets of the proteins directly
causative
for a transformation may be upregulated und thus may be indirectly tumor-
associated. Such indirect tumor-associated antigens may also be targets of a
vaccination approach (Singh-Jasuja H., Emmerich N. P., Rammensee H. G., Cancer
Immunol. lmmunother. 2004 Mar; 453 (3): 187-95). In both cases, it is
essential that
epitopes are present in the amino acid sequence of the antigen, since such a
peptide
("immunogenic peptide") that is derived from a tumor associated or disease
associated antigen should lead to an in vitro or in vivo T-cell-response.
Basically, any peptide which is able to bind a MHC molecule may function as a
T-cell
epitope. A prerequisite for the induction of an in vitro or in vivo T-cell-
response is the
presence of a T cell with a corresponding TCR and the absence of immunological
tolerance for this particular epitope.
Therefore, TAAs and DAAs are a starting point for the development of a tumor
vaccine. The methods for identifying and characterizing the TAAs and DAAs are
based on the use of CTL that can be isolated from patients or healthy
subjects, or
they are based on the generation of differential transcription profiles or
differential
peptide expression patterns between tumors and normal tissues.
However, the identification of genes over-expressed in tumor tissues or human
tumor
cell lines, or selectively expressed in such tissues or cell lines, does not
provide
precise information as to the use of the antigens being transcribed from these
genes
in an immune therapy. This is because only an individual subpopulation of
epitopes
-7-
of these antigens are suitable for such an application since a T cell with a
corresponding TCR has
to be present and immunological tolerance for this particular epitope needs to
be absent or
minimal. It is therefore important to select only those peptides from over-
expressed or selectively
expressed proteins that are presented in connection with MHC molecules against
which a
functional T cell can be found. Such a functional T cell is defined as a T
cell which upon stimulation
with a specific antigen can be clonally expanded and is able to execute
effector functions ("effector
T cell").
T-helper cells play an important role in orchestrating the effector function
of CTLs in anti-tumor
immunity. T-helper cell epitopes that trigger a T-helper cell response of the
TH, type support
effector functions of CD8-positive killer T cells, which include cytotoxic
functions directed against
tumor cells displaying tumor-associated peptide/MHC complexes on their cell
surfaces. In this
way tumor-associated 1-helper cell peptide epitopes, alone or in combination
with other tumor-
associated peptides, can serve as active pharmaceutical ingredients of vaccine
compositions
which stimulate anti-tumor immune responses.
Knowledge of the accurate copy number of HLA class I or II presented ligands
is important in
fundamental and clinical immunology. Currently, the best copy number
determinations are based
on mass spectrometry, employing single reaction monitoring (SRM) in
combination with a known
amount of isotopically labeled peptide. Nevertheless, these approaches are
still not precise
enough in order to be efficiently employed in the above approaches.
In view of the above, it is therefore the object of the present invention to
provide a method for an
absolute determination of copy numbers of HLA class I or ll presented ligands
which is precise,
efficient, easy to handle, and also can be performed on a "high-throughput"
level. Other objects
and advantages of the present invention will become readily apparent for the
person of skill when
studying the following description as provided.
Summary of the Invention
In one aspect it is provided a method for the absolute quantification of at
least one MHC peptide
ligand on a cell, said method comprising
a) preparing cells presenting said at least one MHC peptide ligand to be
quantified from a
biological sample selected from a tissue sample, a blood sample, a tumor
sample, or a sample of
an infected tissue comprising said cells, comprising enzymatic digestion of
tissues, and/or cellular
lysis,
CA 2972306 2019-07-29
= = CA 2972306 2020-03-13
-7a-
b) determining the cell count of said preparation of step a) comprising a
method selected from
counting cell nuclei, photometric DNA-determination, fluorimetric DNA-
determination, or
quantitative PCR,
c) adding a known amount of said at least one MHC peptide ligand labelled with
a first isotope
and/or MHC peptide ligand labelled with a first isotope in a MHC complex to be
quantified to said
preparation of step a) directly after tissue homogenization ("spiking I"),
d) isolating said at least one MHC peptide ligand labelled with a first
isotope to be quantified from
said preparation of step c) in order to obtain a peptide eluate,
e) adding a known amount of said at least one MHC peptide ligand labelled with
a second isotope
to be quantified to said peptide eluate ("spiking II"), wherein the first
isotope is different from the
second isotope,
f) performing a mass spectrometry analysis on said at least one MHC peptide
ligand to be
quantified from step e) and a), in order to generate at least one
aa) signal for the efficiency of the isolation in step d),
bb) signal for the known amount of said at least one MHC peptide ligand as
added in step e), and
cc) signal for said at least one MHC peptide ligand from said prepared cells
of step a), and;
g) quantifying said at least one MHC peptide ligand based on a comparison of
the signals as
obtained in step f) with
aa) the cell count as obtained,
bb) the known amount of said at least one MHC peptide ligand and/or MHC
peptide ligand
complex to be quantified as added in step c), and
cc) the known amount of at least one MHC peptide ligand to be quantified as
added in step e),
whereby an absolute quantification of at least one MHC peptide ligand on a
cell is achieved.
This summary of the invention does not necessarily describe all features of
the invention.
Description
In a first aspect of the present invention, the object of the invention is
solved by a method for the
absolute quantification of at least one MHC peptide ligand on a cell, said
method
CA 02972306 2017-06-27
WO 2016/107740 - 8 - PCT/EP2015/079873
comprising
a) preparing cells presenting said at least one MHC peptide ligand from a
biological
sample comprising cells,
b) determining the cell count of said preparation of step a),
c) adding a known amount of said at least one peptide-MHC ligand and/or
peptide-
MHC ligandcomplex to be quantified to said preparation of step a) ("spiking
I"),
d) isolating at least one MHC peptide ligand from said preparation of step c)
in order
to obtain a peptide eluate,
e) adding a known amount of at least one MHC peptide ligand to be quantified
to said
peptide eluate ("spiking II"),
f) performing a mass spectrometry analysis on said at least one MHC peptide
ligand
in order to generate at least one
aa) signal for the efficiency of the isolation in step d),
bb) signal for the known amount of said at least one MHC peptide ligand as
added in
step e), and
cc) signal for said at least one MHC peptide ligand from said prepared cells
of step
a),
and;
g) quantifying said at least one MHC peptide ligand based on a comparison of
the
signals as obtained in step f) with
aa) the cell count as obtained,
bb) the known amount of said at least one peptide-MHC ligand and/or peptide-
MHC
ligand complex to be quantified as added in step c), and
cc) the known amount of at least one MHC peptide ligand to be quantified as
added
in step e),
whereby an absolute quantification of at least one MHC peptide ligand on a
cell is, at
least in part, achieved.
In a method according to the present invention, where several samples are
analyzed
in parallel, step c) as above can be omitted once the isolation efficiency has
been
established, as the efficiency for one sample can be used to estimate the
isolation
efficiency for a second MHC peptide ligand and/or MHC peptide ligand complex
(i.e.
can be used as a cross-reference value).
CA 02972306 2017-06-27
WO 2016/107740 - 9 - PCT/EP2015/079873
Preferred is a method which furthermore uses the signal obtained from the
internal
calibration (spiking II) in e) as a constant and preserved (control) reference
for the
signal obtained from the isolated at least one MHC peptide ligand by
calculating a
ratio between these two signals. This ratio is compared with the established
calibration curve, which also includes the internal calibrant at the very same
amount,
preferably by using an identical aliquot of such internal calibrant. The
calibration
curve then describes the relation between these ratios and the amounts of
peptide.
See also Figure 3 and the legend thereof.
Surprisingly, in the context of the present invention the inventors found that
by
combining the above analysis steps, for the first time, direct absolute
quantitation of
MHC-, preferably HLA-restricted, peptide levels on cancer or other infected
tissues in
comparison to several different non-cancerous tissues or no-infected tissues
and
organs becomes possible.
In the context of the present invention, "spiking" refers to the addition of a
known
amount or concentration of at least one known, for example unbound ("free")
MHC
peptide ligand to be quantified to a sample, such as, for example, a
preparation (here
designated as "spiking I") or a peptide eluate (here designated as "spiking
II"). The
amounts/concentrations of peptide(s) to be added can be readily adjusted and
depend at least in part on the sample to be spiked and the method used for the
analysis.
Preferred is a method according to the present invention, wherein at least one
MHC
peptide ligand is selected from a tumor associated peptide (TAA) or disease
associated peptide (DAA).
Further preferred is a method according to the present invention wherein said
biological sample comprising cells is selected from a tissue sample, a blood
sample,
a tumor sample, or a sample of an infected tissue. In the context of the
present
invention, samples that are directly derived from subjects, such as patients,
are
termed "primary" samples, such as primary tissue or tumor samples, in contrast
to
samples of cell lines, such as, for example, established tumor cell lines. The
samples
can be fresh or conserved (e.g. frozen or prepared), as long as they are
suitable for
CA 02972306 2017-06-27
WO 2016/107740 - 10 - PC T/EP2015/079873
the method according to the invention. Preferred is a biological sample that
does not
include permanent cell lines.
As a preferred example, the HLA peptide pools from shock-frozen (primary)
tissue
samples can be obtained by immune precipitation from solid tissues using for
example the HLA-A, -B, -C-specific antibody w6/32 or the HLA-A*02-specific
antibody
BB7.2 coupled to CNBr-activated sepharose, followed by acid treatment, and
ultrafiltration. For different HLA-alleles other specific antibodies known in
the art can
be used as there are for example GAP-A3 for A*03, B1.23.2 for B-alleles. There
are
corresponding methods to obtain MHC-class I peptides for other mammals that
are
well known in the art.
The method according to the invention can also be used in the context of
infectious
diseases, such as viral or bacterial infections, for example dengue fever,
Ebola,
Marburg virus, tuberculosis (TB), meningitis or syphilis, preferable the
method is used
on antibiotic-resistant strains of infectious organisms, autoimmune diseases,
such as
arthritis, parasitic infections, such as malaria and other diseases such as MS
and
Morbus Parkinson, as long as the targeted moiety is a MHC class l-bound
peptide.
Examples for autoimmune diseases (including diseases not officially declared
to be
autoimmune diseases) are Chronic obstructive pulmonary disease, Ankylosing
Spondylitis, Crohn's Disease (one of two types of idiopathic inflammatory
bowel
disease "IBD"), Dermatonnyositis, Diabetes mellitus type 1, Endometriosis,
Goodpasture's syndrome, Graves' disease, Guillain-Barre syndrome (GBS),
Hashimoto's disease, Hidradenitis suppurativa, Kawasaki disease, IgA
nephropathy,
Idiopathic thrombocytopenic purpura, Interstitial cystitis, Lupus
erythematosus, Mixed
Connective Tissue Disease, Morphea, Myasthenia gravis, Narcolepsy,
Neuromyotonia, Pemphigus vulgaris, Pernicious anemia, Psoriasis, Psoriatic
Arthritis,
Polymyositis, Primary biliary cirrhosis, Relapsing polychondritis, Rheumatoid
arthritis,
Schizophrenia, Scleroderma, Sjogren's syndrome, Stiff person syndrome,
Temporal
arteritis (giant cell arteritis), Ulcerative Colitis (one of two types of
idiopathic
inflammatory bowel disease "IBD"), Vasculitis, Vitiligo and Wegener's
granulonnatosis.
CA 02972306 2017-06-27
WO 2016/107740 - 11 - PCT/EP2015/079873
The present invention is not restricted to human diseases, but can be used for
mammals, for example cows, pigs, horses, cats, dogs, rodents, such as rat,
mouse,
goat, and other domestic animals.
In yet another preferred embodiment of the method according to the present
invention, preparing of cells comprises, at least in part, enzymatic digestion
of
tissues, and/or cellular lysis.
Preferred is a method according to the present invention, wherein said cell
count is
determined using a method selected from counting cell nuclei, photometric DNA-
determination, fluorimetric DNA-determination (such as, for example, using the
Qubit0 technology), and quantitative PCR.
Further preferred is a method according to the present invention, further
comprising
determining the amount of at least one type of HLA-molecule in said
preparation of
step a). Determining the amount can be done using common methods in the art,
such as methods involving specific antibodies e.g. in an ELISA, gels, cell
sorting,
and/or chromatography.
Further preferred is a method according to the present invention, wherein the
at least
one peptide-MHC complex as added and/or the least one MHC peptide ligand as
added are labeled, and preferably are differentially labeled. Respective
labels are
known to the person of skill, and include isotopic labels, radioactive and non-
radioactive labels, enzymes, and other groups of preferably different masses.
Preferably, the labeling is specific for specific peptides to be quantified.
Most
preferred is a double-labeled TAA/TUMAP, for example in situations in which
two
differentially labeled spikings are required in the same experiment (see
examples,
below).
Preferred is a method according to the present invention, wherein isolating
comprises
chromatography, such as affinity chromatography. Thus, the isolated MHC/HLA
ligands can be separated according to their hydrophobicity by reversed-phase
chromatography (e.g. nanoAcquity UPLC system, Waters) followed by detection in
an Orbitrap hybrid mass spectrometer (ThermoElectron). Each sample is
preferably
- 12 -
analyzed by acquisition of replicate (e.g.) LCMS runs. The LCMS data is then
processed by analyzing the Tandem-MS (MS/MS) data.
The tandem-MS spectra recorded in a targeted way focusing on the m/z values of
the
peptides to be quantified are evaluated preferably by a software that extracts
the
intensities of pre-selected fragment ions of pre-defined transitions. One
example of
such a software is Skyline (MacLean B et al. Skyline: an open source document
editor for creating and analyzing targeted proteomics experiments.
Bioinformatics.
2010 Apr 1; 26(7):966-8.), an application for analyzing mass spectrometer data
of
data independent acquisition (DIA) experiments for parallel reaction
monitoring (PRM
¨ targeted MS/MS). This software can be used with respect to the co-eluting
isotope-
labeled peptide for specificity purposes as well as in order to extract the
single
transition intensities for further processing.
Comparability of peptide groups restricted to the same HLA allele between
different
samples is possible based on a common allele-specific antibody used for
purification,
if available, or alternatively based on assignment of sequences to common HLA-
alleles by means of anchor amino acid patterns.
For statistic reasons, preferred is a method according to the present
invention,
wherein at least two replicate mass spectrometry runs are performed for each
at least
one MHC ligand peptide.
Thus, yet another aspect of the present invention relates to a method
according to
the present invention, further comprising selecting overrepresented,
overexpressed
and/or tumor-specific MHC peptide ligands for the analysis.
Yet another aspect of the present invention relates to a method according to
the
present invention, wherein said method is capable of being performed or is
performed on a high-throughput basis, preferably up to 50 to 100 peptide
ligands can
be analyzed in parallel.
In still another preferred embodiment of the method according to the present
CA 2972306 2019-07-29
CA 02972306 2017-06-27
WO 2016/107740 - 13 - PCT/EP2015/079873
invention, the steps of said method are performed in the order as indicated in
the
appended claims, or as above. In still another preferred method according to
the
present invention said method consists of the steps as indicated above and
herein.
In a further preferred aspect of the method according to the present
invention, said
method relates to personalized therapy and diagnosis. For this, said sample(s)
as
analyzed is/are derived from one individual, or from a group of individuals
suffering
from the same medical condition as described herein. Also, a personalized MHC
ligand profile, preferably a personalized quantified disease-specific MHC
ligand
profile, based on said MHC peptide ligands as quantified can be generated
based on
the method according to the present invention as described herein.
Most preferably, the method according to the present invention is performed in
vitro.
In a further preferred aspect of the method according to the present
invention, said
method further comprises the step of synthesizing, preferably chemically
synthesizing, said at least one MHC peptide ligand as quantified by said
method on a
synthesizer or manually. Another aspect of the invention thus relates to a
method for
preparing an immunoreactive peptide with which a peptide is quantified
according to
the disclosed method and said peptide is synthesized chemically, in vitro or
in vivo.
Peptides can be prepared by chemical linkage of amino acids by the standard
methods known in the art.
Peptides can be prepared in vitro, for example, in cell-free systems, and in
vivo using
cells. The peptides can be formulated as disclosed, for example, in EP2111867
by
Lewandrowski et al.
Yet another aspect relates to the method according to the invention, wherein a
further step is performed, in which the presence of the T-lymphocytes is
detected.
Using this method, it is possible to specifically detect to what extent T-
lymphocytes
directed against isolated and identified peptides are pre-existing in
patients. By
performing this step it is possible to apply, as a vaccine, only those
peptides against
which T-lymphocytes are already pre-existing in the patient. The peptides can
then
CA 02972306 2017-06-27
WO 2016/107740 - 14 - PCT/EP2015/079873
be used to activate these specific T-Iymphocytes.
A further aspect relates to the method according to the invention, wherein the
detection of specific pre-existing T-lymphocytes is performed by labeling the
leukocytes with reconstituted complexes of antigen-presenting molecules and
antigenic peptide.
In yet another preferred embodiment of the method according to the present
invention, said method does furthermore exclude the use of knock-out cells,
cell lines
or animals.
A further preferred optional step of the present invention is an automatic
quality
control based on molecules spiked into the samples in defined amounts.
With the method according to the invention it is furthermore possible to
identify
patient-specific peptides, i.e. it is possible to precisely match peptides,
which are to
be used as vaccine, to the patient in order to induce a specific immune
response.
Another aspect of the invention then relates to a pharmaceutical composition
comprising defined amounts of one or more TAA and/or DAA peptides that have
been quantified by the method according to the invention.
The composition may be applied, for example, parenterally, for example
subcutaneously, intradernnally or intramuscularly, or may be administered
orally,
depending on the formulation and the target disease. In doing so, the peptides
are
dissolved or suspended in a pharmaceutically acceptable carrier, preferably an
aqueous carrier; the composition can further comprise additives, for example
buffers,
binders, etc. The peptides can also be administered together with
immunostimulating
substances, for example cytokines.
According to one aspect of the invention, the peptides may be used for the
treatment
of tumorous diseases and for preparing a drug for treatment of tumor diseases.
Tumorous diseases to be treated comprise solid tumors, such as renal, breast,
pancreas, gastric, testis and/or skin cancer or blood cancers, such as AML.
This list
CA 02972306 2017-06-27
WO 2016/107740 - 15 - PCT/EP2015/079873
of tumor diseases is only exemplary, and is not intended to limit the area of
application.
The peptides can further be used for assessment of the therapy-course of a
tumor
disease.
The peptides can also be used for monitoring a therapy in other immunizations
or
therapies. Therefore, the peptide may not only be used therapeutically but
also
diagnostically.
A further aspect of the invention then relates to the use of the peptides as
quantified
for generating an antibody. Polyclonal antibodies can be obtained, in a
general
manner, by immunization of animals by means of injection of the peptides and
subsequent purification of the immunoglobulin. Monoclonal antibodies can be
generated according to standardized protocols known in the art.
The present invention is of particular relevance for antibody-based
approaches, as
the target's copy number on the cell surface of a target cell determines
and/or
reflects, if the target is addressable for an antibody at all, and, if so,
which effector
functions can be used, such as conjugated drugs, toxins, bispecific antibodies
recruiting T cells or other effector cells. Other aspects relates to the use
in the
context of so-called scaffolding forming molecules, such as aptanners (target-
binding
oligonucleic acid or peptide molecules) and/or soluble T cell receptors
(TCRs). Here
again, similar as for antibodies, the copy number determines about required
avidities
and effector functions. For said scaffolding molecules.
Stimulation of an immune response is dependent upon the presence of antigens
recognized as foreign by the host immune system. The discovery of the
existence of
tumor associated antigens has now raised the possibility of using a host's
immune
system to intervene in tumor growth. Various mechanisms of harnessing both the
humoral and cellular arms of the immune system are currently explored for
cancer
immunotherapy.
Specific elements of the cellular immune response are capable of specifically
CA 02972306 2017-06-27
WO 2016/107740 - 16 - PCT/EP2015/079873
recognizing and destroying tumor cells. The isolation of cytotoxic T-cells
(CTL) from
tumor-infiltrating cell populations or from peripheral blood suggests that
such cells
play an important role in natural immune defenses against cancer. CD8-positive
T-
cells in particular, which recognize class I molecules of the major
histocompatibility
complex (MHC)-bearing peptides of usually 8 to 12 residues derived from
proteins or
defect ribosomal products (DRIPS) located in the cytosols, play an important
role in
this response. The MHC-molecules of the human are also designated as human
leukocyte-antigens (HLA).
MHC class I molecules can be found on most cells having a nucleus which
present
peptides that result from proteolytic cleavage of mainly endogenous, cytosolic
or
nuclear proteins, DRIPS, and larger peptides. However, peptides derived from
endosonnal compartments or exogenous sources are also frequently found on MHC
class I molecules. This non-classical way of class I presentation is referred
to as
cross-presentation in literature.
For proteins to be recognized by cytotoxic T-lymphocytes as tumor-specific or -
associated antigens, and to be used in a therapy, particular prerequisites
must be
fulfilled. The antigen should be expressed mainly by tumor cells and not by
normal
healthy tissues or in comparably small amounts. It is furthermore desirable,
that the
respective antigen is not only present in a type of tumor, but also in high
concentrations (i.e. copy numbers of the respective peptide per cell). Tumor-
specific
and tumor-associated antigens are often derived from proteins directly
involved in
transformation of a normal cell to a tumor cell due to a function e.g. in cell
cycle
control or apoptosis. Additionally, also downstream targets of the proteins
directly
causative for a transformation may be upregulated und thus are indirectly
tumor-
associated. Such indirect tumor-associated antigens may also be targets of a
vaccination approach. Essential is in both cases the presence of epitopes in
the
amino acid sequence of the antigen, since such peptide ("immunogenic peptide")
that
is derived from a tumor associated or disease associated antigen should lead
to an in
vitro or in vivo T-cell-response.
Basically, any peptide able to bind a MHC molecule may function as a T-cell
epitope.
A prerequisite for the induction of an in vitro or in vivo T-cell-response is
the
CA 02972306 2017-06-27
WO 2016/107740 - 17 - PCT/EP2015/079873
presence of a T cell with a corresponding TCR and the absence of immunological
tolerance for this particular epitope. Therefore, TAAs are a starting point
for the
development of a tumor vaccine. The methods for identifying and characterizing
the
TAAs are based on the use of CTL that can be isolated from patients or healthy
subjects, or they are based on the generation of differential transcription
profiles or
differential peptide expression patterns between tumors and normal tissues
(Lemmel
et al. 450-54;Weinschenk et al. 5818-27). However, the identification of genes
over-
expressed in tumor tissues or human tumor cell lines, or selectively expressed
in
such tissues or cell lines, does not provide precise information as to the use
of the
antigens being transcribed from these genes in an immune therapy. This is
because
only an individual subpopulation of epitopes of these antigens are suitable
for such
an application since a T cell with a corresponding TCR has to be present and
immunological tolerance for this particular epitope needs to be absent or
minimal. It
is therefore important to select only those peptides from over-expressed or
selectively expressed proteins that are presented in connection with MHC
molecules
against which a functional T cell can be found. Such a functional T cell is
defined as
a T cell that upon stimulation with a specific antigen can be clonally
expanded and is
able to execute effector functions ("effector T cell").
Considering the severe side-effects and expenses associated with treating
cancer,
better prognostic and diagnostic methods are desperately needed.
The term "peptide" is used herein to designate a series of amino acid
residues,
connected one to the other typically by peptide bonds between the alpha-amino
and
carbonyl groups of the adjacent amino acids. The peptides are preferably 9
amino
acids in length, but can be as short as 8 amino acids in length, and as long
as 10, 11,
12, 13 or 14 amino acids in length.
The term "oligopeptide" is used herein to designate a series of amino acid
residues,
connected one to the other typically by peptide bonds between the alpha-amino
and
carbonyl groups of the adjacent amino acids. The length of the oligopeptide is
not
critical to the invention, as long as the correct epitope or epitopes are
maintained
therein. The oligopeptides are typically less than about 30 amino acid
residues in
length, and greater than about 14 amino acids in length.
CA 02972306 2017-06-27
WO 2016/107740 - 18 - PCT/EP2015/079873
The term "polypeptide" designates a series of amino acid residues, connected
one to
the other typically by peptide bonds between the alpha-amino and carbonyl
groups of
the adjacent amino acids. The length of the polypeptide is not critical to the
invention
as long as the correct epitopes are maintained. In contrast to the terms
peptide or
oligopeptide, the term polypeptide is meant to refer to molecules containing
more
than about 30 amino acid residues.
A peptide, oligopeptide, protein or polynucleotide coding for such a molecule
is
"immunogenic" (and thus an "immunogen" within the present invention), if it is
capable of inducing an immune response. In the case of the present invention,
immunogenicity is more specifically defined as the ability to induce a T-cell
response.
Thus, an "imnnunogen" would be a molecule that is capable of inducing an
immune
response, and in the case of the present invention, a molecule capable of
inducing a
T-cell response.
A T cell "epitope" requires a short peptide that is bound to a class I MHC
receptor,
forming a ternary complex (MHC class I alpha chain, beta-2-microglobulin, and
peptide) that can be recognized by a T cell bearing a matching T-cell receptor
binding to the MHC/peptide complex with appropriate affinity. Peptides binding
to
MHC class I molecules are typically 8-14 amino acids in length, and most
typically 9
amino acids in length.
In the present description, the invention is described using cancer as an
example.
Nevertheless, the inventive method can also be applied in infectious diseases,
autoimmune diseases, and parasitic infections as long as the respective immune
answer is a MHC class I involving answer.
The invention shall now be described further in the following examples,
nevertheless,
without being limited thereto. In the accompanying Figures and the Sequence
Listing,
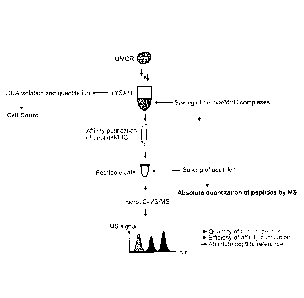
Figure 1: shows a general schematic overview over the experimental approach
according to the present invention.
CA 02972306 2017-06-27
WO 2016/107740 - 19 - PCT/EP2015/079873
Figure 2: shows a comparative MS analysis of a TUMAP mix with 10 fmol per
TUMAP of table 1. Each peptide results in a different MS signal showing the
peptide-
dependent detectability. Peptide 5 is not listed in table 1, i.e. the
sequences 1-4 in
table 1 correspond to Nos. 1 to 4 in Figure 2 and sequences 5-11 in table 1
correspond to Nos. 6 to 12 in Figure 2.
Furthermore, Peptides 19, 21, and 22 in Figure 2 are not listed in table 2,
i.e. the
sequences 13-18 in Figure 2 correspond to Nos. 12 to 17 in table 2, sequence
20 in
Figure 2 corresponds to No 18 in Table 2, and sequences 23 to 28 in Figure 2
corresponds to Nos 19-24 in Table 2.
Figure 3: shows the principle of the internal standard method. A calibration
curve is
generated by titration of an isotope-labeled version (depicted in light gray)
of the
TUMAP. For all MS measurements, a constant quantity of another isotope-labeled
version of the TUMAP internal standard peptide (depicted in dark gray) is
spiked into
the MS samples. A calibration curve function is calculated from the ratio of
MS
signals by logistic regression. The LLOQ is defined by visual examination and
considering the deviation from linearity. "Quantitation samples" (depicted in
green)
represent signal intensities measured in tumor samples selected for absolute
quantitation of TUMAP numbers.
Figure 4: shows calibration curves of the HLA-A*02 TUMAPs selected for
absolute
quantitation. The MS results of the respective TUMAPs in tumor tissue samples
used
for analysis of absolute TUMAP numbers per cell ("quantitation samples") are
included in each chart.
Figure 5: shows additional calibration curves of the HLA-A*02 TUMAPs selected
for
absolute quantitation. The MS results of the respective TUMAPs in tumor tissue
samples used for analysis of absolute TUMAP numbers per cell ("quantitation
samples") are included in each chart.
Figure 6: shows calibration curves of the HLA-A*24 TUMAPs selected for
absolute
quantitation. The MS results of the respective TUMAPs in tumor tissue samples
used
for analysis of absolute TUMAP numbers per cell ("quantitation samples") are
CA 02972306 2017-06-27
WO 2016/107740 - 20 - PCT/EP2015/079873
included in each chart
Figure 7: shows additional calibration curves of the HLA-A*24 TUMAPs selected
for
absolute quantitation. The MS results of the respective TUMAPs in tumor tissue
samples used for analysis of absolute TUMAP numbers per cell ("quantitation
samples") are included in each chart.
Figure 8: shows the estimated variation of MS replicate measurements over all
TUMAPs analyzed. Each dot represents the coefficient of variation (CV in ()/0)
for MS
replicates of an individual TUMAP in one specific tissue sample. The median of
the
CVs over all TUMAPs is regarded as average variation of MS replicate runs.
Figure 9: shows the efficiency of the peptideMHC isolation. The efficiency of
peptideMHC isolation was determined in eight A*02-positive samples for A*02
TUMAPs (A), and in six A*24-positive samples for A*24 TUMAPs (B). The
efficiency
of isolation varies on average 24% for A*02 TUMAPs and 32% for A*24 TUMAPs,
respectively (C).
Figure 10: shows evaluation methods of DNA content analysis. A. Comparison of
three different methods for interpolation of a cell count from a given DNA
amount:
using a standard curve prepared from tumor cell lines (dark gray), from PBMC
of
healthy donors (gray), and using the theoretical weight of a human diploid
genome
(light gray). Biological replicates, i.e. independent tissue lysate
preparations from
different pieces of the same tumor, highlighted in grey. B. Plot of the PBMC
standard
curve, which was used to determine the total cell count of tissue samples
analyzed in
absolute TUMAP quantitation.
Figure 11 shows the determination of cell count from solid, frozen tissue
samples.
Cell count analysis of A*02- and A*24-positive tumor samples (A) and estimated
variation of cell count analysis (B). Biological replicates are highlighted in
grey.
Figure 12 shows results for peptide copies per cell for HLA-A*02 TUMAPs. Eight
different GC tumors were analyzed, three of them in duplicates (biological
duplicates
are grouped and highlighted in gray). The LLOQ refers to the quantitation
range in
CA 02972306 2017-06-27
WO 2016/107740 - 21 - PCT/EP2015/079873
one MS experiment and is extrapolated to a sample- and TUMAP-specific LLOQ,
i.e.
the lowest copy number quantifiable in a specific sample for a specific TUMAP
(depicted in gray).
Figure 13 shows additional results for peptide copies per cell for HLA-A*02
TUMAPs.
Eight different GC tumors were analyzed, three of them in duplicates
(biological
duplicates are grouped and highlighted in grey). The LLOQ refers to the
quantitation
range in one MS experiment and is extrapolated to a sample- and TUMAP-specific
LLOQ, i.e. the lowest copy number quantifiable in a specific sample for a
specific
TUMAP (depicted in gray).
Figure 14 shows results for peptide copies per cell for HLA-A*24 TUMAPs. Six
different GC tumors were analyzed, three of them in duplicates (biological
duplicates
are grouped and highlighted in grey). The LLOQ refers to the quantitation
range in
one MS experiment and is extrapolated to a sample- and TUMAP-specific LLOQ,
i.e.
the lowest copy number quantifiable in a specific sample for a specific TUMAP
(depicted in gray).
Figure 15 shows additional results for peptide copies per cell for HLA-A*24
TUMAPs.
Six different GC tumors were analyzed, three of them in duplicates (biological
duplicates are grouped and highlighted in grey). The LLOQ refers to the
quantitation
range in one MS experiment and is extrapolated to a sample- and TUMAP-specific
LLOQ, i.e. the lowest copy number quantifiable in a specific sample for a
specific
TUMAP (depicted in gray).
Figure 16 shows the testing of an influence of a spiking of samples using 500
fmol of
free peptides in the MHC/peptide monomer preparation. Free peptide in the
analysis
does not have a substantial influence for the peptides as indicated.
Figure 17 shows the results of tests for the DNA isolation reproducibility
using Qubit
HS (fluorescence) vs. a standard curve. The samples (cancer samples, such as
NSCLC) show a sufficient homogeneity. DNA was isolated from 3 X 50 pl
aliquots.
SEQ ID No. 1 to 24 show the peptides of tables 1 and 2 that were selected for
- 22 -
absolute quantitation according to the examples.
Examples:
The following examples describe the inventive method in the context of
TAAs/cancer.
The invention is not restricted to the examples, as they are only one
preferred
embodiment of the invention.
Table 1: HLA-A*02 TUMAPs selected for absolute quantitation
Eleven peptides were selected for absolute quantitation.
No Peptide Code Sequence
1 IGF2BP3-001 KIQEILTQV
2 FAP-003 YVYQNNIYL
3 COL12A1-002 FLVDGSWSV
4 MXRA5-001 TLSSIKVEV
NCAPG-001 YLLSYIQSI
6 COL6A3-002 FLLDGSANV
7 VVNT5A-001 AMSSKFFLV
8 F2R-001 TLDPRSFLL
9 HIF1A-001 ALDGFVMVL
MET-001 YVDPVITSI
11 CCNB1-002 ILIDWLVQV
Table 2: HLA-A*24 TUMAPs selected for absolute quantitation
Fourteen peptides were selected for absolute quantitation. The properties of
one
peptide (PLK4-001) turned out to be not suitable for further experiments. For
the
remaining 13 peptides, absolute quantitation experiments were completed.
No Peptide Code Sequence
12 ASPM-002 SYNPLWLRI
13 SLC6A6-001 VYPNWAIGL
CA 2972306 2019-07-29
CA 02972306 2017-06-27
WO 2016/107740 - 23 - PCT/EP2015/079873
14 MMP3-001 VFIFKGNQF
15 CDC2-001 LYQILQGIVF
16 PLK4-001 QYASRFVQL
17 ASPM-001 RYLWATVT I
18 ATAD2-002 KYLTVKDYL
19 KIF2C-001 IYNGKLFDLL
20 MET-006 SYIDVLPEF
21 AVL9-001 FYISPVNKL
22 PPAP2C-001 AYLVYTDRL
23 UCHL5-001 NYLPFIMEL
24 UQCRB-001 YYNAAGFNKL
The quantitation of TUMAP copies per cell in solid tumor samples requires the
(sub-)
quantitation of
a) the isolated TUMAP,
b) the loss of the TUMAP during isolation, and
C) the cell count of the tissue sample analyzed.
An overview on the experimental approach according to the present invention is
given in Figure 1.
Peptide quantitation by nanoLC-MS/MS
For an accurate quantitation of peptides by mass spectrometry, basic knowledge
about the peptide-specific correlation of peptide quantity and MS signal needs
to be
learned first. As an example, the MS measurement of a peptide mixture with 10
fmol
per peptide reveals that there are large peptide-specific differences in the
MS signal
(Figure 2). This also implies that the range, in which a peptide may be
reliably
quantified by MS, depends on the individual peptide characteristics.
In addition, a linear correlation between the amount of a specific peptide and
the MS
signal can only be expected within a certain range. The inventors therefore
decided
to determine an individual calibration curve for each peptide. The range of
each
calibration curve was selected to reflect not only the individual quantitation
range of
the peptide, but also the range of MS signals for each peptide in previously
analyzed
tumor samples. The goal was that each calibration curve should comprise the
CA 02972306 2017-06-27
WO 2016/107740 - 24 - PCT/EP2015/079873
peptide-specific MS signal range of at least 80 % of our routine samples.
The generation of exact calibration curves requires a synthetic standard,
which has
to be quantified with an independent method and has the same characteristics
as the
natural TUMAP. The inventors used double isotope-labeled versions of the
TUMAPs,
i.e. two isotope-labeled amino acids were included during TUMAP synthesis. The
double-labeled versions can be distinguished from the natural TUMAP by a mass
difference of 12-18 Dalton depending on the labeled amino acid. Apart from the
mass, isotope labeling does not alter the properties of the peptide in MS,
i.e. peptides
with the same sequence result but different isotope labels result in the same
MS
signal intensities (Anderson et al., 2012). After synthesis, the double-
labeled
TUMAPs were precisely quantified by nitrogen analysis to allow an exact
correlation
of peptide quantity and MS signal.
The calibration curves were prepared in at least three different matrices,
i.e. HLA
peptide eluates from natural samples similar to the routine MS samples, and
each
preparation was measured in duplicate MS runs. In order to compensate for any
technical variations between MS runs, an internal standard peptide was
included in
all measurements. The ratio of the MS signals of the titrated peptide to the
fixed
internal standard was plotted, and the calibration curve was calculated by
logistic
regression (Figure 3). The lower limit of quantitation (LLOQ) was visually
determined
considering the deviation from linearity. If deviation from linearity was not
obvious,
such as for peptide FAP-003 (Figure 4), the mean ratio of the lowest peptide
quantity
was used to calculate the LLOQ. The upper limit of quantitation, i.e.
deviation from
linearity at higher concentrations, was not reached for any calibration curve.
In actual quantitation experiments, the same quantity of the internal standard
was
added to each sample as for the generation of the calibration curve, and the
ratio of
the natural to the internal standard peptide was calculated. This "internal
standard
method" is a common method in MS-based protein quantitation, e.g. for
biomarker
analysis in biological samples (Sturm et al., 2012; Prasad and Unadkat, 2014;
Sato
et al., 2012). The calibration curves and the values measured in actual tumor
samples are shown in Figure 4 and Figure 5 for HLA-A*02 and in Figure 6 and
Figure
7 for HLA-A*24 for all TUMAPs selected for absolute quantitation.
CA 02972306 2017-06-27
WO 2016/107740 - 25 - PCT/EP2015/079873
In order to estimate the variation of quantitative MS measurements, the
coefficient of
variation (CV in %) of the peptide content for each MS sample was calculated.
The
CVs per MS sample were plotted and the overall variation of MS measurements
was
estimated as the median CV (Figure 8).
Efficiency of peptide/MHC isolation
As for any protein purification process, the isolation of proteins from tissue
samples is
associated with a certain loss of the protein of interest. To determine the
efficiency of
TUMAP isolation, peptideMHC complexes were generated for all TUMAPs selected
for absolute quantitation. To be able to discriminate the spiked from the
natural
peptideMHC complexes, single-isotope-labeled versions of the TUMAPs were used,
i.e. one isotope-labeled amino acid was introduced during TUMAP synthesis.
These
complexes were spiked into the freshly prepared tissue lysates, i.e. at the
earliest
possible point of the TUMAP isolation procedure, and then captured like the
natural
peptideMHC complexes in the following affinity purification. Measuring the
recovery
of the single-labeled TUMAPs therefore allows conclusions regarding the
efficiency
of isolation of individual natural TUMAPs.
The efficiency of isolation was determined in 13 samples that had been
selected for
absolute TUMAP quantitation (7 HLA-A*02-positive, 5 HLA-A*24-positive, and 1
HLA-A*02/A*24 double-positive sample). Eight A*02-positive samples were
analyzed
for isolation efficiency of A*02 TUMAPs and six A*24-positive samples for A*24
TUMAPs (Figure 9 A, B). The results suggest that for most peptides the
isolation
efficiency is comparable among different tissue samples. In contrast, the
isolation
efficiency differs between individual peptides. This suggests that the
isolation
efficiency, although determined in only a limited number of tissue samples,
may be
extrapolated to any other tissue preparation. However, it is necessary to
analyze
each TUMAP individually as the isolation efficiency may not be extrapolated
from one
peptide to others.
In few cases, the efficiency of isolation is unrealistically high and/or
varies strongly,
e.g. for peptide NCAPG-001 (Figure 9 A). In cases in which the efficiency
could not
be determined e.g. due to peptide-dependent difficulties with quantitation
(e.g. high
CA 02972306 2017-06-27
WO 2016/107740 - 26 - PCT/EP2015/079873
LL00 level for peptides CCNB1-002, ASPM-001) or an efficiency higher than 100%
was calculated, the inventors assumed an isolation efficiency of 100%. This is
a
conservative approach which most likely overestimates the efficiency of
isolation and
thereby ultimately leads to an underestimation of peptide copies per cell.
To estimate the variation in the efficiency of TUMAP isolation, the
coefficient of
variation (CV in %) for the isolation of individual TUMAPs from 6-8 samples
was
plotted (Figure 9 C). Overall, the mean variation for A*02 TUMAPs is 24% and
for
A*24 TUMAPs 32%, respectively.
Determination of the cell count in solid, frozen tissue
Another critical factor for calculating the number of peptide copies per cell
is the
estimation of the total cell count of the tissue samples used for TUMAP
isolation. The
inventors decided to use DNA content analysis, as this method is applicable to
a
wide range of samples of different origin and, most importantly, frozen
samples
(Forsey and Chaudhuri, 2009; Alcoser et al., 2011; Alcoser et al., 2011; Silva
et al.,
2013).
Considering intra-tumor heterogeneity, it is necessary to determine the cell
count
from a tissue fraction which is representative for the complete tissue sample
used for
TUMAP isolation. The tissue lysate prepared during TUMAP isolation is a
suitable
sample for DNA analysis, as it is more homogenous as compared to a fraction of
the
solid tissue. After DNA isolation, the total DNA concentration was quantified
in a
fluorescence-based assay (Life Technologies, Qubit HS DNA Assay), and the
total
DNA content of the samples was calculated.
For the calculation of cell numbers from a given DNA quantity, the inventors
considered two different methods: First, the cell number may be calculated
using the
theoretical mass of a human genome, which has been estimated to be
approximately
6.67 pg DNA per diploid genome (Alcoser et al., 2011; Konigshoff et al.,
2003).
Alternatively, samples with known cell number may be used to prepare a DNA
standard curve with the same methods as used for the tissue samples. This
method
already compensates for any impact of the DNA isolation and quantitation
procedure,
thus improving the accuracy of our results. The inventors prepared two
different
CA 02972306 2017-06-27
WO 2016/107740 - 27 - PCT/EP2015/079873
standard curves, one from seven different tumor cell lines and the other from
peripheral blood mononuclear cells (PBMCs) of six different healthy donors.
To compare all three evaluation methods (theoretical DNA mass and two
different
cell-based standard curves), the number of cells per 1 g tissue was calculated
for
several samples (Figure 10 A). Calculations using the cell line standard
result in
substantially lower cell counts (max. 3.6-fold underestimation) as compared to
using
the PBMC standard. This was expected considering that tumor cell lines tend to
have
higher portions of aneuploid cells with a higher DNA content as compared to
healthy
diploid PBMCs. In the literature, the proportion of diploid gastric tumors
varies from
25-67% depending on the study (Hiyama et al., 1995; Tamura et al., 1991;
Wiksten
et al., 2008; Zhang et al., 2005; Sugai et al., 2005). As the ploidy and the
fraction of
aneuploid cells of the tissue samples are unknown, both standard curves may
only
give an estimate on the true cell count but not consider all properties of an
individual
tissue sample. Another source of variation is the unknown proliferation state
of the
tissue sample or the presence of necrotic cells. Particularly the doubling of
DNA
content in proliferating cells increases the quantity of DNA relative to the
cell number
and will thus bias cell count calculation. In two normal gastric tissue
samples, the
inventors calculated a lower number of cells per 1 g tissue as compared to the
tumor
samples with all three approaches.
As a conservative approach, the inventors decided to use the PBMC standard
curve
(Figure 10 B), which may lead to an overestimation of the cell count in the
portion of
hyper-diploid tissue samples, leading to an underestimation of peptide copies
per cell
in such samples, but should never overestimate peptide copies per cell in any
sample.
For the analysis of the tissue samples selected for absolute TUMAP
quantitation, the
inventors isolated DNA from 2-3 aliquots of tissue lysate, and each DNA
preparation
was quantified in 2-3 replicates in the fluorescence-based assay. The total
cell count
and the cell count per 1 g tissue were calculated from the total DNA content
using the
PBMC standard curve (Figure 11 A). In order to obtain an estimate of the
overall
variation of cell count analysis, the coefficient of variation (%) was first
determined at
the level of each sample or, if available, biological replicate (i.e.
independent tissue
CA 02972306 2017-06-27
WO 2016/107740 - 28 - PCT/EP2015/079873
lysate preparations from different pieces of the same tumor). This calculation
was
taking into account variation between the aliquots of tissue lysate as well as
replicate
measurements in the fluorescence assay. These CVs are shown in Figure 11 B,
and
the overall variation was determined as the median of the depicted CVs. The
variability may partially be explained by the fact that the tissue lysates are
not entirely
homogenized, i.e. remaining tissue particles containing undissociated cells
result in a
higher cell count for individual isolation replicates (see e.g. GC816T in
Figure 11 A).
Peptide copies per cell
With data for peptide quantitation in nanoLC-MS/MS runs ("total peptide"),
efficiency
of TUMAP isolation ("% isolation efficiency"), and cell count of each tumor
sample
available, it is possible to calculate the number of TUMAP copies per cell
according
to the following formula:
The quantity of total peptide is calculated from the result of 2-4 nanoLC-
MS/MS
experiments ("peptide/run [fmol]") using the calibration curves shown in
Figure 4 to
Figure 7.
to== (PePtle [fr-,
::s:3:1:-
- .
(2)
Only MS measurements above the LLOQ, as defined using the calibration curves,
are used for calculation of absolute peptide copy numbers. This LLOQ refers to
the
TUMAP quantity in a nanoLC-MS/MS experiment ("LLOQ/run [frnol]").
The copy number per cell over all peptides, which could be quantified, ranges
from
50 to 30000 copies per cell (see Table 3).
Table 3: Overview on the copy numbers per cell of HLA-A*02 and HLA-A*24
TUMAPs
HLA-A*02 TUMAPs were analyzed in eight samples, HLA-A*24 TUMAPs in six
samples. nq = not quantified as peptide quantity was below LLOQ
CA 02972306 2017-06-27
WO 2016/107740 - 29 - PCT/EP2015/079873
HLA- Peptide code Quantified in n Copies per cell (range of
Allele samples individual samples and
(% of analyzed biological replicates)
samples)
A*02 IGF2BP3- 1(13%) 350-450
001
A*02 FAP-003 1 (13%) 200-250
A*02 COL12A1- 0 (0%) nq
002
A*02 MXRA5-001 1(13%) 450
A*02 NCAPG-001 1(13%) 1000
A*02 COL6A3-002 0 (0%) nq
A*02 WNT5A-001 1 (13%) 400
A*02 F2R-001 5 (63%) 50-300
A*02 HIF1A-001 3 (38%) 9000-30000
A*02 MET-001 2 (25%) 200-250
A*02 CCNB1-002 0 (0%) nq
A*24 ASPM-002 0 (0%) nq
A*24 SLC6A6-001 2 (33%) 1000-5000
A*24 MMP3-001 2 (33%) 100-250
A*24 CDC2-001 0 (0%) nq
A*24 ASPM-001 0 (0%) nq
A*24 ATAD2-001 2 (33%) 1500-6000
A*24 KIF2C-001 1(17%) 3500
A*24 MET-006 3(50%) 2500-13500
A*24 AVL9-001 4 (67%) 1000-10000
A*24 PPAP2C-001 5 (83%) 200-1500
A*24 UCHL5-001 1(17%) 2500
A*24 UQCRB-001 1(17%) 900
In order to visualize the LLOQ in the context of õpeptide copies per cell",
the "LLOQ
per cell" was calculated for each TUMAP in each sample using the two formulas
shown above. As the samples differ in the total cell count, the LLOQ per cell
is
different for each sample (see Figure 12 and Figure 13 for A*02 TUMAPs and
Figure
CA 02972306 2017-06-27
WO 2016/107740 - 30 - PCT/EP2015/079873
14 and Figure 15 for A*24 TUMAPs).
Estimation of error in absolute TUMAP quantitation
In order to estimate the variation in absolute TUMAP quantitation, the
inventors
considered the relative variation of the three major experimental results as
described
above:
a) the quantity of isolated TUMAP: relative deviation 1.8% (A*02) and 2.1%
(A*24)
b) the efficiency of TUMAP isolation: relative deviation 24% (A*02) and 32%
(A*24)
c) the cell count of the tissue sample: relative deviation 27%
Assuming normal distribution of the variable values, the relative error (a) of
"copies
per cell" may be calculated as the square root of the sum of the quadratic
relative
error of each variable:
With the values given above, the coefficient of variation for absolute peptide
copy
numbers per cell is about 36 "Yo for HLA-A*02 peptides, and 42 % for HLA-A*24
peptides. To give an impression on the variation of the results, the absolute
and
relative error of peptide copies per cell for a model peptide and sample was
calculated (Table 4).
Table 4: Exemplary calculation of the absolute and relative error in absolute
TUMAP quantitation for a model peptide
A*02 A*24
value rel. error abs. rel. error abs.
(%) error (%) error
Total cell count/sample 1x10⁸ 27% 27%
Total peptide [fmol] 16.25 1.8% 2.1%
Efficiency of peptideMHC 10% 24% 32%
isolation
Peptide copies per cell 1000 36% 360 42% 420
CA 02972306 2017-06-27
WO 2016/107740 - 31 - PCT/EP2015/079873
This model calculation suggests that for the complex multi-step analysis of
absolute
quantitation, the variation of results is still in an acceptable range. For
individual
TUMAPs, the relative error may deviate from the averaged error calculated
here.
TUMAP copy numbers per cell may be quantitatively compared among different
TUMAPs, allowing prioritizing TUMAPs to choose suitable antibody and/or
soluble T
cell receptor targets.
Comparison of the TUMAP quantitation method to known published methods
An accurate approach for the absolute quantitation of MHC-associated peptide
copy
numbers per cell has not previously been shown. Most importantly, previously
published methods for the quantitation of MHC-bound peptides using MS analysis
did
not consider the loss of antigen during sample preparation (Tan et al., 2011;
Hogan
et al., 2005). The group of Peter A. von Velen recently published a method for
the
"accurate quantitation of MHC-bound peptides" (Hassan et al., 2014). In this
technical note, an approach was used to quantify two minor histocompatibility
antigens, LB-NISCH-1A and LB-SSR1-1S, on EBV-LCL JYpp65 cells. However, the
individual experimental steps differ substantially, which is summarized in the
table
below:
Table 5: Comparison of the methods for TUMAPs quantitation of Hassan et al.,
and the present invention
Hassan et al. present invention
Peptide Used only to determine the To determine the linear range,
calibration curves linear range, assuming all the LLOQ and to quantify
peptides share the same peptides; considers peptide-
correlation of peptide quantity specific correlation of quantity
and MS signal (slope = 1) and MS
signal for each
individual peptide
Peptide One point calibration: signal Internal standard method,
quantitation ratio to spiked standard based on peptide-specific
peptide
calibration curve, quantitation
of samples near the LLOQ
Efficiency of
peptideMHC complexes spiked peptideMHC complexes spiked
isolation in lysate after 2 hour lysis and directly after
tissue
CA 02972306 2017-06-27
WO 2016/107740 - 32 - PCT/EP2015/079873
clearance by centrifugation, homogenization, Le. the
disregards peptide loss in earliest point in peptide
these steps isolation
Samples Cell line Solid tumor tissue
Sample Additional C18
Immediate usage of a
preparation chromatography step prior to immunoprecipitated and filtered
the final nanoLC-MS/MS, used sample for nanoLC-MS/MS
to reduce sample complexity.
Determination of Counting of cells during cell DNA content analysis from
cell number pellet preparation lysate of solid tissues
Error calculation Consider only variation of MS Variations in MS replicates
(CV
replicates (CV 0.1-7.1%), but on average 1.8-
2.1%),
not the variation of
peptideMHC isolation efficiency
peptideMHC isolation (26% (CV on average 24-32%), and
and 91% respectively), and of cell count determination (CV on
the cell count. average 27%) are considered.
The copy numbers of the two peptides analyzed by Hassan et al. varied from 800
to
5300 (relative deviation 74%), and 3000 to 12000 (relative deviation 60%)
copies per
cell among the biological replicates, respectively. The reason for this
variation was
not clearly discussed, but may be due to the usage of different MS
instruments.
In summary, the more refined method of the present invention is expected to
contribute to more accurate and reliable results.
Quantification of peptides having low copy numbers
In order to show the power of the inventive method, the data as presented in
the
following table was generated. Peptides were identified that are present in
only very
small copy numbers, amongst them peptide PDE11-001. It can be seen that the
method allows the determination of as few as about 10 copies of the peptide
per cell.
Table 6: Quantification of peptides having low copy numbers
PC ¨ prostate cancer ¨ Sequence PDE11-001 is ALLESRVNL (SEQ ID No. 25)
CA 02972306 2017-06-27
WO 2016/107740 - 33 - PCT/EP2015/079873
Copies per cell Number of samples
Peptide > >
Code Min Median Max LLOQ LOD evaluable Source/HLA
Peptide 1 20 20 20 1 5 16 N SC LC/A*02
Peptide 2 10 30 300 13 16 17 N SC LC/A*02
Peptide 3 10 30 50 4 10 18 N SC LC/A*02
Peptide 4 10 30 100 17 17 19 N SC LC/A*02
Peptide 5 20 20 90 7 8 11 N SC LC/A*02
Peptide 6 10 20 50 6 6 10 N SC LC/A*02
Peptide 7 <
30 200 9 12 15 PC/A*02
PDE11-001 <
10 10 30 8 9 10 PC/A*02
PDE11-001 is an HLA-A*02 binding peptide derived from phosphodiesterase 11A
(PDE11A), which catalyzes the hydrolysis of cAMP and cGMP, thus downregulating
the respective signalling pathways. Mutations in PDE11A have been associated
with
adrenocortical hyperplasia as well as with familial testicular germ cell
tumors. The
peptide was detected on prostate cancer samples, and also in hepatocellular,
pancreatic and renal cell carcinoma and not on any normal tissues.
References as cited
Alcoser SY, Kimmel DJ, Borgel SD, Carter JP, Dougherty KM, Hollingshead MG
(2011). Real-time PCR-based assay to quantify the relative amount of human and
mouse tissue present in tumor xenografts. BMC. Biotechnol. 11, 124.
Anderson NL, Razavi M, Pearson TW, Kruppa G, Paape R, Suckau D (2012).
Precision of heavy-light peptide ratios measured by maldi-tof mass
spectrometry. J
Proteome. Res 1/, 1868-1878.
Forsey RW, Chaudhuri JB (2009). Validity of DNA analysis to determine cell
numbers
CA 02972306 2017-06-27
WO 2016/107740 - 34 - PCT/EP2015/079873
in tissue engineering scaffolds. Biotechnol. Lett. 31, 819-823.
Hassan C, Kester MG, Oudgenoeg G, de Ru AH, Janssen GM, Drijfhout JW,
Spaapen RM, Jimenez CR, Heemskerk MH, Falkenburg JH, van Veelen PA (2014).
Accurate quantitation of MHC-bound peptides by application of isotopically
labeled
peptide MHC complexes. J Proteomics.
Hiyama E, Yokoyama T, Tatsumoto N, Hiyama K, Imamura Y, Murakami Y, Kodama
T, Piatyszek MA, Shay JW, Matsuura Y (1995). Telomerase activity in gastric
cancer.
Cancer Res 55, 3258-3262.
Hogan KT, Sutton JN, Chu KU, Busby JA, Shabanowitz J, Hunt DF, Slingluff CL,
Jr.
(2005). Use of selected reaction monitoring mass spectrometry for the
detection of
specific MHC class I peptide antigens on A3 supertype family members. Cancer
Immunol. Immunother. 54, 359-371.
Konigshoff M, Wilhelm J, Bohle RM, Pingoud A, Hahn M (2003). HER-2/neu gene
copy number quantified by real-time PCR: comparison of gene amplification,
heterozygosity, and immunohistochemical status in breast cancer tissue. Clin
Chem.
49, 219-229.
Prasad B, Unadkat JD (2014). Comparison of Heavy Labeled (SIL) Peptide versus
SILAC Protein Internal Standards for LC-MS/MS Quantification of Hepatic Drug
Transporters. Int. J Proteomics. 2014, 451510.
Sato Y, Miyashita A, lwatsubo T, Usui T (2012). Simultaneous absolute protein
quantification of carboxylesterases 1 and 2 in human liver tissue fractions
using liquid
chromatography-tandem mass spectrometry. Drug Metab Dispos. 40, 1389-1396.
Silva AL, Rosalia RA, Sazak A, Carstens MG, Ossendorp F, Oostendorp J, Jiskoot
W
(2013). Optimization of encapsulation of a synthetic long peptide in PLGA
nanoparticles: low-burst release is crucial for efficient CD8(+) T cell
activation. Eur. J
Pharm. Biopharm. 83, 338-345.
CA 02972306 2017-06-27
WO 2016/107740 - 35 - PCT/EP2015/079873
Sturm R, Sheynkman G, Booth C, Smith LM, Pedersen JA, Li L (2012). Absolute
quantification of prion protein (90-231) using stable isotope-labeled
chymotryptic
peptide standards in a LC-MRM AQUA workflow. J Am. Soc. Mass Spectrom. 23,
1522-1533.
Sugai T, Habano W, Jiao YF, Suzuki M, Takagane A, Nakamura S (2005). Analysis
of genetic alterations associated with DNA diploidy, aneuploidy and
multiploidy in
gastric cancers. Oncology 68, 548-557.
Tamura G, Kihana T, Nomura K, Terada M, Sugimura T, Hirohashi S (1991).
Detection of frequent p53 gene mutations in primary gastric cancer by cell
sorting
and polynnerase chain reaction single-strand conformation polymorphism
analysis.
Cancer Res 51, 3056-3058.
Tan CT, Croft NP, Dudek NL, Williamson NA, Purcell AW (2011). Direct
quantitation
of MHC-bound peptide epitopes by selected reaction monitoring. Proteomics. 11,
2336-2340.
Wiksten JP, Lundin J, Nordling S, Kokkola A, Haglund C (2008). Comparison of
the
prognostic value of a panel of tissue tumor markers and established
clinicopathological factors in patients with gastric cancer. Anticancer Res
28, 2279-
2287.
Zhang H, Yi EC, Li XJ, Mallick P, Kelly-Spratt KS, MasseIon CD, Camp DG, Smith
RD, Kemp CJ, Aebersold R (2005). High throughput quantitative analysis of
serum
proteins using glycopeptide capture and liquid chromatography mass
spectrometry.
Mol. Cell Proteomics. 4, 144-155.