Note: Descriptions are shown in the official language in which they were submitted.
CA 02999890 2018-03-23
WO 2017/053915 PCT/US2016/053614
METHOD, APPARATUS, AND COMPUTER PROGRAM PRODUCT
FOR ANALYZING BIOLOGICAL DATA
CROSS-REFERENCE
This application claims the benefit of priority to United States Provisional
Patent Application
Serial Nos. 62/232,345, filed on September 24, 2015, and 62/399,376, filed on
September 24,
2016; both of which applications are incorporated by reference herein in their
entirety.
BACKGROUND OF THE DISCLOSURE
[0001] Biomarkers for conditions and diseases such as cancer include
biological molecules such
as proteins, peptides, lipids, nucleic acids (e.g., DNA, RNA) and variations
and modifications
thereof. The identification of states of specific biomarkers, such as specific
DNA, RNA and
proteins, within a biological sample from a patient may provide for a
diagnosis, prognosis, and/or
theranosis of conditions and/or diseases for the patient. Accordingly,
analysis of biomarkers
present within a biological sample can assist in the detection of a condition
and/or disease,
determining the severity of the condition and/or disease, determining
predisposition to the
condition and/or disease, and/or determine appropriate treatment options.
[0002] There remains a need to easily identify biomarkers for detecting and/or
treating a
condition or disease. In this regard, advancements in computing technology,
including increased
memory and processing power, as well as advancements in user interface
technology, have
allowed for application developers to create more complex applications that
provide a variety of
control features enabling user control of application functionality.
Accordingly, the present
invention provides systems, apparatus, methods, and computer program products
for analyzing
biological data such that an analysis of biomarkers may assist in patient
care, e.g., by providing
for a diagnosis, prognosis, and/or theranosis of conditions and/or diseases
present in the patient,
or by generating hypotheses for research studies.
BRIEF SUMMARY OF THE DISCLOSURE
[0003] The present disclosure provides systems, methods, apparatuses, and
computer program
products for providing a user interface for an application for analyzing
biological data.
[0004] In an aspect, the invention provides a method of analyzing biological
data, the method
comprising: receiving, at a computing device comprising a processor and
memory, patient data
for a plurality of patients, the patient data corresponding to at least one of
a biological sampling
event, a biological processing event, at least one therapeutic regime, at
least one biomarker
status, and a patient status; determining at least one interrelationship
between any one of the
biological sampling event, the biological processing event, the at least one
therapeutic regime,
the at least one biomarker status, and the patient status; performing a
therapeutic regime analysis
1
CA 02999890 2018-03-23
WO 2017/053915 PCT/US2016/053614
to determine an interrelationship status for the interrelationship between at
least one therapeutic
regime and at least one of the patient status and the at least one biomarker
status; and displaying
at least one graphical interface on a user interface in communication with the
computing device,
the graphical interface including a plurality of visual elements, each visual
element of the
plurality of visual elements being associated with the patient data, at least
one visual element
being associated with the at least one interrelationship, at least one visual
element including an
indicium corresponding to at least one of the interrelationship status and the
biomarker status. In
a related aspect, the invention provides a method of analyzing biological data
associated with a
biological sample from a target patient, the method comprising: receiving, at
a computing device
comprising a processor and memory, patient data associated with the target
patient, the patient
data corresponding to a biological sampling event, a biological processing
event, a therapeutic
regime, a marker status, and a patient status; receiving reference data
associated with a plurality
of patients, the reference data corresponding to a plurality of biological
sampling events,
biological processing events, therapeutic regimes, marker statuses, and
patient statuses;
determining at least one interrelationship between any one of the biological
sampling events, the
biological processing events, the therapeutic regimes, the marker statuses,
and the patient
statuses; performing a therapeutic regime analysis to determine the
interrelationship between at
least one therapeutic regime and at least one of the at least one patient
status and the at least one
marker status; displaying at least one graphical user interface, the graphical
user interface
configured to: i) display a plurality of graphical user interface objects
associated with the
reference data, ii) display a plurality of graphical user interface objects
associated with the
patient data, iii) display, on at least one graphical interface on a user
interface in communication
with the computing device, a primary graphical user interface object
configured to, upon
receiving an indication of a user input defining a selection of the primary
graphical user interface
object, cause the graphical user interface to display a secondary graphical
user interface object;
and assisting in providing patient care based on the one or more
interrelationships displayed on
the user interface.
[0005] The method of any preceding or subsequent aspect or embodiment, or
combinations
thereof, may further comprise manipulating a primary visual element to display
a secondary
visual element including additional information corresponding to the patient
data upon selection
thereof. The method may further comprise displaying the secondary visual
element such that the
secondary visual element overlays the primary visual element or the primary
visual element is
resized such that the secondary visual element is displayed adjacent to the
primary visual
element.
2
CA 02999890 2018-03-23
WO 2017/053915 PCT/US2016/053614
[0006] The method of any preceding or subsequent aspect or embodiment, or
combinations
thereof, may further comprise assisting in providing patient care based on the
one or more
interrelationships displayed on the user interface. In some embodiments,
assisting in providing
the patient care comprises assisting in at least one of providing a diagnosis,
providing a
prognosis, selecting a recommended therapeutic regime, generating a
hypothesis, and evaluating
an efficiency of the therapeutic regime, based on the one or more
interrelationships. In some
embodiments, assisting in providing the patient care comprises selectively
manipulating the
graphical interface and one or more of the plurality of visual elements
displayed thereon to
visually compare a target patient against a set of reference patients.
Visually comparing the target
patient against the set of reference patients can be based on various desired
attributes, including
without limitation shared patient attributes, the at least one therapeutic
regime, and / or the at
least one biomarker status.
[0007] In the method of any preceding or subsequent aspect or embodiment, or
combinations
thereof, performing the therapeutic regime analysis may comprise identifying a
positive
interrelationship status between the at least one therapeutic regime and at
least one positive
biomarker status in response to determining that the at least one therapeutic
regime is likely to be
more effective for a condition and/or disease when a positive biomarker status
for a particular
biomarker is detected in the at least one biological sampling event. The
particular biomarker can
be a biomarker listed in any one of Tables 1-7. The particular biomarker can
be listed elsewhere
herein. The particular biomarker may be as described in any one of US Patent
Publications
US20100113299, published May 6, 2010; US20140222443, published August 7, 2014;
US20150307947, published October 29, 2015; U520160186266, published June 30,
2016; and
U520150024952, published January 22, 2015; US Patent Nos. 8,700,335, issued
April 15, 2014
and 8,768,629, issued July 1, 2014; and Int'l Patent Publications
W02015116868, published
August 6, 2015 (equivalent to US Patent Application No. 15/115,617, filed July
29, 2016), and
W02016141169, published September 9, 2016; each of which patent publications
is incorporated
herein by reference in its entirety.
[0008] The method of any preceding or subsequent aspect or embodiment, or
combinations
thereof, may further comprise storing the patient data for the plurality of
patients in a clinical
database, a biomarker database, a knowledge database, and / or a cohort
database comprising a
combination of the clinical database, the biomarker database, and the
knowledge database. In an
embodiment, the method further comprises mapping the patient data from the
clinical database,
the biomarker database, the knowledge database, and / or the cohort database
and storing it in one
or more external databases in communication with the computing device. The
method may
further comprise creating one or more user defined roles to restrict specific
users from viewing
3
CA 02999890 2018-03-23
WO 2017/053915 PCT/US2016/053614
specific portions of the patient data and / or manipulating the mapped patient
data stored in the
one or more external databases. The one or more user defined roles can be
based on any desired
criteria, including without limitation at least one of disease lineage,
patient cohort, user
affiliation, or user's membership in a study group.
[0009] In the method of any preceding or subsequent aspect or embodiment, or
combinations
thereof, the plurality of visual elements may comprise any useful visual
element, including
without limitation at least one of a sunburst plot (see, e.g., FIGs. 4N-4Q), a
Kaplan Meier plot
(see, e.g., FIG. 4B), a waterfall plot (see, e.g., FIGs. 4C-4H), a table (see,
e.g., FIG. 4M), a
volcano plot (see, e.g., FIGs. 4K-4L), or a graph (see, e.g., FIGs. 4I-4J).
[0010] The method of any preceding or subsequent aspect or embodiment, or
combinations
thereof, may further comprise applying a filter to the patient data to filter
the patient data based
on any useful attribute, including without limitation at least one of a
particular biomarker or
group thereof, the at least one biomarker status, a patient cohort, a patient
status, the at least one
therapeutic regime, the biological processing event, the biological sampling
event, at least one
indicium listed in Table 1, and any combination thereof Display of at least
one of the plurality of
visual elements can be associated with the filtered patient data.
[0011] In the method of any preceding or subsequent aspect or embodiment, or
combinations
thereof, the patient data may further comprise historical data that tracks the
patient status over a
period of time. In some embodiments, the patient status comprises information
associated with an
age of the patient, a sex of the patient, a race of the patient, a condition
and / or disease of the
patient, a status of the condition and / or disease of the patient, and /or an
outcome of the
condition and / or disease of the patient. The outcome of the condition and /
or disease of the
patient may comprise any outcome of interest, including without limitation
death, partial
remission, complete remission, recurrence, or cure.
[0012] In the method of any preceding or subsequent aspect or embodiment, or
combinations
thereof, the condition or disease of the patient may comprise any condition or
disease of interest,
including without limitation a neoplastic/proliferative disease or disorder,
neurological disease or
disorder, autoimmune disease or disorder, cardiovascular disease or disorder,
or infectious
disease. In preferred embodiments, the neoplastic/proliferative disease
comprises cancer. The
lineage of the cancer can be a lineage listed in Table 1. The lineage of the
cancer can be a lineage
listed elsewhere herein. In some embodiments, the cancer comprises an acute
myeloid leukemia
(AML), breast carcinoma, cholangiocarcinoma, colorectal adenocarcinoma,
extrahepatic bile
duct adenocarcinoma, female genital tract malignancy, gastric adenocarcinoma,
gastroesophageal
adenocarcinoma, gastrointestinal stromal tumor (GIST), glioblastoma, head and
neck squamous
carcinoma, leukemia, liver hepatocellular carcinoma, low grade glioma, lung
bronchioloalveolar
4
CA 02999890 2018-03-23
WO 2017/053915 PCT/US2016/053614
carcinoma (BAC), non-small cell lung cancer (NSCLC), small cell lung cancer
(SCLC),
lymphoma, male genital tract malignancy, malignant solitary fibrous tumor of
the pleura
(MSFT), melanoma, multiple myeloma, neuroendocrine tumor, nodal diffuse large
B-cell
lymphoma, non epithelial ovarian cancer (non-EOC), ovarian surface epithelial
carcinoma,
pancreatic adenocarcinoma, pituitary carcinomas, oligodendroglioma, prostatic
adenocarcinoma,
retroperitoneal or peritoneal carcinoma, retroperitoneal or peritoneal
sarcoma, small intestinal
malignancy, soft tissue tumor, thymic carcinoma, thyroid carcinoma, or uveal
melanoma. The
cancer may be an acute lymphoblastic leukemia; acute myeloid leukemia;
adrenocortical
carcinoma; AIDS-related cancer; AIDS-related lymphoma; anal cancer; appendix
cancer;
astrocytomas; atypical teratoid/rhabdoid tumor; basal cell carcinoma; bladder
cancer; brain stem
glioma; brain tumor, brain stem glioma, central nervous system atypical
teratoid/rhabdoid tumor,
central nervous system embryonal tumors, astrocytomas, craniopharyngioma,
ependymoblastoma, ependymoma, medulloblastoma, medulloepithelioma, pineal
parenchymal
tumors of intermediate differentiation, supratentorial primitive
neuroectodermal tumors and
pineoblastoma; breast cancer; bronchial tumors; Burkitt lymphoma; cancer of
unknown primary
site (CUP); carcinoid tumor; carcinoma of unknown primary site; central
nervous system atypical
teratoid/rhabdoid tumor; central nervous system embryonal tumors; cervical
cancer; childhood
cancers; chordoma; chronic lymphocytic leukemia; chronic myelogenous leukemia;
chronic
myeloproliferative disorders; colon cancer; colorectal cancer;
craniopharyngioma; cutaneous T-
cell lymphoma; endocrine pancreas islet cell tumors; endometrial cancer;
ependymoblastoma;
ependymoma; esophageal cancer; esthesioneuroblastoma; Ewing sarcoma;
extracranial germ cell
tumor; extragonadal germ cell tumor; extrahepatic bile duct cancer;
gallbladder cancer; gastric
(stomach) cancer; gastrointestinal carcinoid tumor; gastrointestinal stromal
cell tumor;
gastrointestinal stromal tumor (GIST); gestational trophoblastic tumor;
glioma; hairy cell
leukemia; head and neck cancer; heart cancer; Hodgkin lymphoma; hypopharyngeal
cancer;
intraocular melanoma; islet cell tumors; Kaposi sarcoma; kidney cancer;
Langerhans cell
histiocytosis; laryngeal cancer; lip cancer; liver cancer; malignant fibrous
histiocytoma bone
cancer; medulloblastoma; medulloepithelioma; melanoma; Merkel cell carcinoma;
Merkel cell
skin carcinoma; mesothelioma; metastatic squamous neck cancer with occult
primary; mouth
cancer; multiple endocrine neoplasia syndromes; multiple myeloma; multiple
myeloma/plasma
cell neoplasm; mycosis fungoides; myelodysplastic syndromes;
myeloproliferative neoplasms;
nasal cavity cancer; nasopharyngeal cancer; neuroblastoma; Non-Hodgkin
lymphoma;
nonmelanoma skin cancer; non-small cell lung cancer; oral cancer; oral cavity
cancer;
oropharyngeal cancer; osteosarcoma; other brain and spinal cord tumors;
ovarian cancer; ovarian
epithelial cancer; ovarian germ cell tumor; ovarian low malignant potential
tumor; pancreatic
CA 02999890 2018-03-23
WO 2017/053915 PCT/US2016/053614
cancer; papillomatosis; paranasal sinus cancer; parathyroid cancer; pelvic
cancer; penile cancer;
pharyngeal cancer; pineal parenchymal tumors of intermediate differentiation;
pineoblastoma;
pituitary tumor; plasma cell neoplasm/multiple myeloma; pleuropulmonary
blastoma; primary
central nervous system (CNS) lymphoma; primary hepatocellular liver cancer;
prostate cancer;
rectal cancer; renal cancer; renal cell (kidney) cancer; renal cell cancer;
respiratory tract cancer;
retinoblastoma; rhabdomyosarcoma; salivary gland cancer; Sezary syndrome;
small cell lung
cancer; small intestine cancer; soft tissue sarcoma; squamous cell carcinoma;
squamous neck
cancer; stomach (gastric) cancer; supratentorial primitive neuroectodermal
tumors; T-cell
lymphoma; testicular cancer; throat cancer; thymic carcinoma; thymoma; thyroid
cancer;
transitional cell cancer; transitional cell cancer of the renal pelvis and
ureter; trophoblastic tumor;
ureter cancer; urethral cancer; uterine cancer; uterine sarcoma; vaginal
cancer; vulvar cancer;
Waldenstrom macroglobulinemia; or Wilm's tumor. The stage of the cancer may
comprise a
stage listed in Table 1. For example, the stage can be stage I, stage II,
stage III, stage IV,
unknown, or various subsets of such stages. In some embodiments, the histology
of the cancer is
as listed in Table 1.
[0013] In the method of any preceding or subsequent aspect or embodiment, or
combinations
thereof, determining the at least one interrelationship may comprise
determining an existence of a
relationship between the patient status and the at least one biomarker status
based on the
biological sampling event.
[0014] The method of any preceding or subsequent aspect or embodiment, or
combinations
thereof, may further comprise determining the at least one biomarker status by
detecting at least
one biomarker in the at least one biological sampling event and assessing at
least one
characteristic for the at least one particular biomarker. The at least one
characteristic may
comprise any desired characteristic, including without limitation at least one
of overexpression,
underexpression, a modification, a polymorphism, a deletion, an insertion, a
substitution, a
translocation, a fusion, a break, a duplication, an amplification, a repeat, a
copy number variant, a
DNA methylation variation, a transcript expression level, a transcript
variant, and a splice
variant. One of skill will appreciate that the at least one characteristic can
be selected based upon
the particular biomarker. By way of non-limiting example, the overexpression
and
underexpression of proteins can be detected using immunological assays and
mutations in nucleic
acids can be detected via sequence analysis (e.g., Sanger dye-termination
sequencing or high
throughput next-generation sequencing (NGS)). In come embodiments, detecting
the at least one
particular biomarker in the at least one biological sampling event comprises
assessing a
biological sample from a patient using at least one assessment technique. The
at least one
assessment technique may comprise any useful technique, including without
limitation gene
6
CA 02999890 2018-03-23
WO 2017/053915 PCT/US2016/053614
expression analysis, nucleic acid sequence analysis, nucleic acid methylation
analysis and / or
proteomic analysis. The at least one particular biomarker may comprise any
useful biomarker,
e.g., a protein, a nucleic acid, a lipid, a carbohydrate, or any combination
thereof The at least one
particular biomarker can be a biomarker listed in any one of Tables 1-7. The
at least one
particular biomarker can be listed elsewhere herein. The at least one
particular biomarker may be
as described in any one of US Patent Publications US20100113299, published May
6, 2010;
US20140222443, published August 7, 2014; U520150307947, published October 29,
2015;
U520160186266, published June 30, 2016; and U520150024952, published January
22, 2015;
US Patent Nos. 8,700,335, issued April 15, 2014 and 8,768,629, issued July 1,
2014; and Int'l
Patent Publications W02015116868, published August 6, 2015, and W02016141169,
published
September 9, 2016; each of which patent publications is incorporated herein by
reference in its
entirety.
[0015] The method of any preceding or subsequent aspect or embodiment, or
combinations
thereof, may further comprise processing the patient data to determine which
members of the
plurality of patients are matched and which members of the plurality of
patients are unmatched.
As further described herein, "matched" patient data may originate from
patients who had
molecular profiling performed and who received one or more therapeutic regime
predicted to
provide a benefit in treating a condition and / or disease based on the
molecular profiling. And
"unmatched" patient data may originate from patients who had molecular
profiling performed
and who received one or more therapeutic regime predicted to provide a
potential lack of benefit
in treating the condition and / or disease based on the molecular profiling.
The patient data can
also be processed to determine patients with mixed matched/unmatched
treatments or treatments
that were neither matched nor unmatched. In some embodiments, the method
further comprises
performing a survival analysis to compare the unmatched and matched patient
data. Such
embodiments may further comprise displaying on the at least one graphical user
interface a visual
element associated with the survival analysis. The visual element associated
with the survival
analysis can be a Kaplan Meier plot (see, e.g., FIGs. 4A-4C, 4E, 4H, 4K-N) or
other appropriate
visual element as desired.
[0016] In another related aspect, the invention provides a computer-readable
storage medium that
is non-transitory and has computer-readable program code portions stored
therein that, in
response to execution by a processor, cause an apparatus to at least: receive,
at a computing
device comprising the processor and memory, patient data for a plurality of
patients, the patient
data corresponding to at least one of a biological sampling event, a
biological processing event,
at least one therapeutic regime, at least one biomarker status, and a patient
status; determine at
least one interrelationship between any one of the biological sampling event,
the biological
7
CA 02999890 2018-03-23
WO 2017/053915 PCT/US2016/053614
processing event, the at least one therapeutic regime, the at least one
biomarker status, and the
patient status; perform a therapeutic regime analysis to determine an
interrelationship status for
the interrelationship between at least one therapeutic regime and at least one
of the patient status
and the at least one biomarker status; and display at least one graphical
interface on a user
interface in communication with the computing device, the graphical interface
including a
plurality of visual elements, each visual element of the plurality of visual
elements being
associated with the patient data, at least one visual element being associated
with the at least one
interrelationship, at least one visual element including an indicium
corresponding to at least one
of the interrelationship status and the biomarker status.
[0017] The computer readable storage medium of any preceding or subsequent
aspect or
embodiment, or combinations thereof, may have computer-readable program code
portions
stored therein that cause the apparatus to manipulate a primary visual element
to display a
secondary visual element including additional information corresponding to the
patient data upon
selection thereof. The apparatus may be caused to display the secondary visual
element such that
the secondary visual element overlays the primary visual element or the
primary visual element is
resized such that the secondary visual element is displayed adjacent to the
primary visual
element.
[0018] The computer readable storage medium of any preceding or subsequent
aspect or
embodiment, or combinations thereof, may have computer-readable program code
portions
stored therein that cause the apparatus to assist in providing patient care
based on the one or more
interrelationships displayed on the user interface. In some embodiments, the
apparatus is caused
to assist in at least one of providing a diagnosis, providing a prognosis,
selecting a recommended
therapeutic regime, generating a hypothesis, and evaluating an efficiency of
the therapeutic
regime, based on the one or more interrelationships in order to assist in
providing the patient
care.
[0019] The computer readable storage medium of any preceding or subsequent
aspect or
embodiment, or combinations thereof, may have computer-readable program code
portions
stored therein that cause the apparatus to selectively manipulate the
graphical interface and one
or more of the plurality of visual elements displayed thereon to visually
compare a target patient
against a set of reference patients in order to assist in providing the
patient care. A visual
comparison of the target patient against the set of reference patients can be
based on various
desired attributes, including without limitation shared patient attributes,
the at least one
therapeutic regime, and / or the at least one biomarker status.
[0020] In the computer-readable program code portions stored within the
computer readable
storage medium of any preceding or subsequent aspect or embodiment, or
combinations thereof,
8
CA 02999890 2018-03-23
WO 2017/053915 PCT/US2016/053614
performing the therapeutic regime analysis may comprise identifying a positive
interrelationship
status between the at least one therapeutic regime and at least one positive
biomarker status in
response to determining that the at least one therapeutic regime is likely to
be more effective for
a condition and/or disease when a positive biomarker status for a particular
biomarker is detected
in the at least one biological sampling event. The particular biomarker can be
a biomarker listed
in any one of Tables 1-7. The particular biomarker can be listed elsewhere
herein. The particular
biomarker may be as described in any one of US Patent Publications
US20100113299, published
May 6, 2010; US20140222443, published August 7, 2014; U520150307947, published
October
29, 2015; U520160186266, published June 30, 2016; and U520150024952, published
January
22, 2015; US Patent Nos. 8,700,335, issued April 15, 2014 and 8,768,629,
issued July 1, 2014;
and Int'l Patent Publications W02015116868, published August 6, 2015, and
W02016141169,
published September 9, 2016; each of which patent publications is incorporated
herein by
reference in its entirety.
[0021] The computer readable storage medium of any preceding or subsequent
aspect or
embodiment, or combinations thereof, may have computer-readable program code
portions
stored therein that cause the apparatus to store the patient data for the
plurality of patients in a
clinical database, a biomarker database, a knowledge database, and / or a
cohort database
comprising a combination of the clinical database, the biomarker database, and
the knowledge
database. In an embodiment, the apparatus is caused to map the patient data
from the clinical
database, the biomarker database, the knowledge database, and / or the cohort
database and
storing it in one or more external databases in communication with the
computing device. In
some embodiments, the apparatus is caused to create one or more user defined
roles to restrict
specific users from viewing specific portions of the patient data and / or
manipulating the
mapped patient data stored in the one or more external databases. The one or
more user defined
roles can be based on any desired criteria, including without limitation at
least one of disease
lineage, patient cohort, user affiliation, or user's membership in a study
group.
[0022] Within the computer-readable program code portions stored within the
computer readable
storage medium of any preceding or subsequent aspect or embodiment, or
combinations thereof,
the plurality of visual elements may comprise any useful visual element,
including without
limitation at least one of a sunburst plot (see, e.g., FIGs. 4N-4Q), a Kaplan
Meier plot (see, e.g.,
FIG. 4B), a waterfall plot (see, e.g., FIGs. 4C-4H), a table (see, e.g., FIG.
4M), a volcano plot
(see, e.g., FIGs. 4K-4L), or a graph (see, e.g., FIGs. 4I-4J).
[0023] The computer readable storage medium of any preceding or subsequent
aspect or
embodiment, or combinations thereof, may have computer-readable program code
portions
stored therein that cause the apparatus to apply a filter to the patient data
to filter the patient data
9
CA 02999890 2018-03-23
WO 2017/053915 PCT/US2016/053614
based on any useful attribute, including without limitation at least one of a
particular biomarker
or group thereof, the at least one biomarker status, a patient cohort, a
patient status, the at least
one therapeutic regime, the biological processing event, the biological
sampling event, at least
one indicium listed in Table 1, and any combination thereof. Display of at
least one of the
plurality of visual elements can be associated with the filtered patient data.
[0024] The computer readable storage medium of any preceding or subsequent
aspect or
embodiment, or combinations thereof, may have computer-readable program code
portions
stored therein that cause the apparatus to process patient data comprising
historical data that
tracks the patient status over a period of time. In some embodiments, the
patient status comprises
information associated with an age of the patient, a sex of the patient, a
race of the patient, a
condition and / or disease of the patient, a status of the condition and / or
disease of the patient,
and /or an outcome of the condition and / or disease of the patient. The
outcome of the condition
and / or disease of the patient may comprise any outcome of interest,
including without limitation
death, partial remission, complete remission, recurrence, or cure. The
condition or disease of the
patient may comprise any condition or disease of interest, including without
limitation a
neoplastic/proliferative disease or disorder, neurological disease or
disorder, autoimmune disease
or disorder, cardiovascular disease or disorder, or infectious disease. In
preferred embodiments,
the neoplastic/proliferative disease comprises cancer. The lineage of the
cancer can be a lineage
listed in Table 1. The lineage of the cancer can be a lineage listed elsewhere
herein. In some
embodiments, the cancer comprises an acute myeloid leukemia (AML), breast
carcinoma,
cholangiocarcinoma, colorectal adenocarcinoma, extrahepatic bile duct
adenocarcinoma, female
genital tract malignancy, gastric adenocarcinoma, gastroesophageal
adenocarcinoma,
gastrointestinal stromal tumor (GIST), glioblastoma, head and neck squamous
carcinoma,
leukemia, liver hepatocellular carcinoma, low grade glioma, lung
bronchioloalveolar carcinoma
(BAC), non-small cell lung cancer (NSCLC), small cell lung cancer (SCLC),
lymphoma, male
genital tract malignancy, malignant solitary fibrous tumor of the pleura
(MSFT), melanoma,
multiple myeloma, neuroendocrine tumor, nodal diffuse large B-cell lymphoma,
non epithelial
ovarian cancer (non-EOC), ovarian surface epithelial carcinoma, pancreatic
adenocarcinoma,
pituitary carcinomas, oligodendroglioma, prostatic adenocarcinoma,
retroperitoneal or peritoneal
carcinoma, retroperitoneal or peritoneal sarcoma, small intestinal malignancy,
soft tissue tumor,
thymic carcinoma, thyroid carcinoma, or uveal melanoma. The cancer may be an
acute
lymphoblastic leukemia; acute myeloid leukemia; adrenocortical carcinoma; AIDS-
related
cancer; AIDS-related lymphoma; anal cancer; appendix cancer; astrocytomas;
atypical
teratoid/rhabdoid tumor; basal cell carcinoma; bladder cancer; brain stem
glioma; brain tumor,
brain stem glioma, central nervous system atypical teratoid/rhabdoid tumor,
central nervous
CA 02999890 2018-03-23
WO 2017/053915 PCT/US2016/053614
system embryonal tumors, astrocytomas, craniopharyngioma, ependymoblastoma,
ependymoma,
medulloblastoma, medulloepithelioma, pineal parenchymal tumors of intermediate
differentiation, supratentorial primitive neuroectodermal tumors and
pineoblastoma; breast
cancer; bronchial tumors; Burkitt lymphoma; cancer of unknown primary site
(CUP); carcinoid
tumor; carcinoma of unknown primary site; central nervous system atypical
teratoid/rhabdoid
tumor; central nervous system embryonal tumors; cervical cancer; childhood
cancers; chordoma;
chronic lymphocytic leukemia; chronic myelogenous leukemia; chronic
myeloproliferative
disorders; colon cancer; colorectal cancer; craniopharyngioma; cutaneous T-
cell lymphoma;
endocrine pancreas islet cell tumors; endometrial cancer; ependymoblastoma;
ependymoma;
esophageal cancer; esthesioneuroblastoma; Ewing sarcoma; extracranial germ
cell tumor;
extragonadal germ cell tumor; extrahepatic bile duct cancer; gallbladder
cancer; gastric
(stomach) cancer; gastrointestinal carcinoid tumor; gastrointestinal stromal
cell tumor;
gastrointestinal stromal tumor (GIST); gestational trophoblastic tumor;
glioma; hairy cell
leukemia; head and neck cancer; heart cancer; Hodgkin lymphoma; hypopharyngeal
cancer;
intraocular melanoma; islet cell tumors; Kaposi sarcoma; kidney cancer;
Langerhans cell
histiocytosis; laryngeal cancer; lip cancer; liver cancer; malignant fibrous
histiocytoma bone
cancer; medulloblastoma; medulloepithelioma; melanoma; Merkel cell carcinoma;
Merkel cell
skin carcinoma; mesothelioma; metastatic squamous neck cancer with occult
primary; mouth
cancer; multiple endocrine neoplasia syndromes; multiple myeloma; multiple
myeloma/plasma
cell neoplasm; mycosis fungoides; myelodysplastic syndromes;
myeloproliferative neoplasms;
nasal cavity cancer; nasopharyngeal cancer; neuroblastoma; Non-Hodgkin
lymphoma;
nonmelanoma skin cancer; non-small cell lung cancer; oral cancer; oral cavity
cancer;
oropharyngeal cancer; osteosarcoma; other brain and spinal cord tumors;
ovarian cancer; ovarian
epithelial cancer; ovarian germ cell tumor; ovarian low malignant potential
tumor; pancreatic
cancer; papillomatosis; paranasal sinus cancer; parathyroid cancer; pelvic
cancer; penile cancer;
pharyngeal cancer; pineal parenchymal tumors of intermediate differentiation;
pineoblastoma;
pituitary tumor; plasma cell neoplasm/multiple myeloma; pleuropulmonary
blastoma; primary
central nervous system (CNS) lymphoma; primary hepatocellular liver cancer;
prostate cancer;
rectal cancer; renal cancer; renal cell (kidney) cancer; renal cell cancer;
respiratory tract cancer;
retinoblastoma; rhabdomyosarcoma; salivary gland cancer; Sezary syndrome;
small cell lung
cancer; small intestine cancer; soft tissue sarcoma; squamous cell carcinoma;
squamous neck
cancer; stomach (gastric) cancer; supratentorial primitive neuroectodermal
tumors; T-cell
lymphoma; testicular cancer; throat cancer; thymic carcinoma; thymoma; thyroid
cancer;
transitional cell cancer; transitional cell cancer of the renal pelvis and
ureter; trophoblastic tumor;
ureter cancer; urethral cancer; uterine cancer; uterine sarcoma; vaginal
cancer; vulvar cancer;
11
CA 02999890 2018-03-23
WO 2017/053915 PCT/US2016/053614
Waldenstrom macroglobulinemia; or Wilm's tumor. The stage of the cancer may
comprise a
stage listed in Table 1. For example, the stage can be stage I, stage II,
stage III, stage IV,
unknown, or various subsets of such stages. In some embodiments, the histology
of the cancer is
as listed in Table 1.
[0025] The computer readable storage medium of any preceding or subsequent
aspect or
embodiment, or combinations thereof, may have computer-readable program code
portions
stored therein that cause the apparatus to determine an existence of a
relationship between the
patient status and the at least one biomarker status based on the biological
sampling event to
determine the at least one interrelationship.
[0026] The computer readable storage medium of any preceding or subsequent
aspect or
embodiment, or combinations thereof, may have computer-readable program code
portions
stored therein that cause the apparatus to determine the at least one
biomarker status by detecting
at least one biomarker in the at least one biological sampling event and
assessing at least one
characteristic for the at least one particular biomarker The at least one
characteristic may
comprise any desired characteristic, including without limitation at least one
of overexpression,
underexpression, a modification, a polymorphism, a deletion, an insertion, a
substitution, a
translocation, a fusion, a break, a duplication, an amplification, a repeat, a
copy number variant, a
DNA methylation variation, a transcript expression level, a transcript
variant, and a splice
variant. One of skill will appreciate that the at least one characteristic can
be selected based upon
the particular biomarker. By way of non-limiting example, the overexpression
and
underexpression of proteins can be detected using immunological assays and
mutations in nucleic
acids can be detected via sequence analysis (e.g., Sanger dye-termination
sequencing or high
throughput next-generation sequencing (NGS)).
[0027] The computer readable storage medium of any preceding or subsequent
aspect or
embodiment, or combinations thereof, may have computer-readable program code
portions
stored therein that cause the apparatus to assess a biological sample from a
patient using data
generated via at least one assessment technique to detect the at least one
particular biomarker in
the at least one biological sampling event. The at least one assessment
technique may comprise
any useful technique, including without limitation gene expression analysis,
nucleic acid
sequence analysis, nucleic acid methylation analysis and / or proteomic
analysis. The at least one
particular biomarker may comprise any useful biomarker, e.g., a protein, a
nucleic acid, a lipid, a
carbohydrate, or any combination thereof The at least one particular biomarker
can be a
biomarker listed in any one of Tables 1-7. The at least one particular
biomarker can be listed
elsewhere herein. The at least one particular biomarker may be as described in
any one of US
Patent Publications US20100113299, published May 6, 2010; U520140222443,
published
12
CA 02999890 2018-03-23
WO 2017/053915 PCT/US2016/053614
August 7, 2014; US20150307947, published October 29, 2015; US20160186266,
published June
30, 2016; and US20150024952, published January 22, 2015; US Patent Nos.
8,700,335, issued
April 15, 2014 and 8,768,629, issued July 1, 2014; and Int'l Patent
Publications W02015116868,
published August 6, 2015, and W02016141169, published September 9, 2016; each
of which
patent publications is incorporated herein by reference in its entirety.
[0028] The computer readable storage medium of any preceding or subsequent
aspect or
embodiment, or combinations thereof, may cause the apparatus to process the
patient data to
determine which members of the plurality of patients are matched and which
members of the
plurality of patients are unmatched. The patient data can also be processed to
determine patients
with mixed matched/unmatched treatments or treatments that were neither
matched nor
unmatched. In some embodiments, the apparatus is caused to perform a survival
analysis with the
unmatched and matched patient data. The apparatus can further be caused to
display on the at
least one graphical user interface a visual element associated with the
survival analysis. The
visual element associated with the survival analysis can be a Kaplan Meier
plot (see, e.g., FIGs.
4A-4C, 4E, 4H, 4K-N) or other appropriate visual element as desired.
[0029] In still another related aspect, the invention provides an apparatus
for analyzing biological
data, the apparatus including a user interface, and a computing device in
communication with the
user interface, the computing device comprising a processor and memory
including computer-
readable program code stored therein, the computer-readable code configured,
upon the
execution thereof by the processor, to cause the apparatus to: receive patient
data for a plurality
of patients, the patient data corresponding to at least one of a biological
sampling event, a
biological processing event, at least one therapeutic regime, at least one
biomarker status, and a
patient status; determine at least one interrelationship between any one of
the biological sampling
event, the biological processing event, the at least one therapeutic regime,
the at least one
biomarker status, and the patient status; perform a therapeutic regime
analysis to determine an
interrelationship status for the interrelationship between at least one
therapeutic regime and at
least one of the patient status and the at least one biomarker status; and
display at least one
graphical interface on the user interface, the graphical interface including a
plurality of visual
elements, each visual element of the plurality of visual elements being
associated with the patient
data, at least one visual element being associated with the at least one
interrelationship, at least
one visual element including an indicium corresponding to at least one of the
interrelationship
status and the biomarker status.
[0030] The apparatus of any preceding or subsequent aspect or embodiment, or
combinations
thereof, may be caused to manipulate a primary visual element to display a
secondary visual
element including additional information corresponding to the patient data
upon selection
13
CA 02999890 2018-03-23
WO 2017/053915 PCT/US2016/053614
thereof. The apparatus may be caused to display the secondary visual element
such that the
secondary visual element overlays the primary visual element or the primary
visual element is
resized such that the secondary visual element is displayed adjacent to the
primary visual
element.
[0031] The apparatus of any preceding or subsequent aspect or embodiment, or
combinations
thereof, may be caused to assist in providing patient care based on the one or
more
interrelationships displayed on the user interface. In some embodiments, the
apparatus is caused
to assist in at least one of providing a diagnosis, providing a prognosis,
selecting a recommended
therapeutic regime, generating a hypothesis, and evaluating an efficiency of
the therapeutic
regime, based on the one or more interrelationships in order to assist in
providing the patient
care.
[0032] The apparatus of any preceding or subsequent aspect or embodiment, or
combinations
thereof, may be caused to selectively manipulate the graphical interface and
one or more of the
plurality of visual elements displayed thereon to visually compare a target
patient against a set of
reference patients in order to assist in providing the patient care. A visual
comparison of the
target patient against the set of reference patients can be based on various
desired attributes,
including without limitation shared patient attributes, the at least one
therapeutic regime, and / or
the at least one biomarker status.
[0033] In regards to the apparatus of any preceding or subsequent aspect or
embodiment, or
combinations thereof, performing the therapeutic regime analysis may comprise
identifying a
positive interrelationship status between the at least one therapeutic regime
and at least one
positive biomarker status in response to determining that the at least one
therapeutic regime is
likely to be more effective for a condition and/or disease when a positive
biomarker status for a
particular biomarker is detected in the at least one biological sampling
event. The particular
biomarker can be a biomarker listed in any one of Tables 1-7. The particular
biomarker can be
listed elsewhere herein. The particular biomarker may be as described in any
one of US Patent
Publications US20100113299, published May 6, 2010; US20140222443, published
August 7,
2014; U520150307947, published October 29, 2015; U520160186266, published June
30, 2016;
and U520150024952, published January 22, 2015; US Patent Nos. 8,700,335,
issued April 15,
2014 and 8,768,629, issued July 1, 2014; and Int'l Patent Publications
W02015116868,
published August 6, 2015, and W02016141169, published September 9, 2016; each
of which
patent publications is incorporated herein by reference in its entirety.
[0034] The apparatus of any preceding or subsequent aspect or embodiment, or
combinations
thereof, may be caused to store the patient data for the plurality of patients
in a clinical database,
a biomarker database, a knowledge database, and / or a cohort database
comprising a
14
CA 02999890 2018-03-23
WO 2017/053915 PCT/US2016/053614
combination of the clinical database, the biomarker database, and the
knowledge database. In an
embodiment, the apparatus is caused to map the patient data from the clinical
database, the
biomarker database, the knowledge database, and / or the cohort database and
storing it in one or
more external databases in communication with the computing device. In some
embodiments, the
apparatus is caused to create one or more user defined roles to restrict
specific users from
viewing specific portions of the patient data and / or manipulating the mapped
patient data stored
in the one or more external databases. The one or more user defined roles can
be based on any
desired criteria, including without limitation at least one of disease
lineage, patient cohort, user
affiliation, or user's membership in a study group.
[0035] In regards to the apparatus of any preceding or subsequent aspect or
embodiment, or
combinations thereof, the plurality of visual elements may comprise any useful
visual element,
including without limitation at least one of a sunburst plot (see, e.g., FIGs.
4N-4Q), a Kaplan
Meier plot (see, e.g., FIG. 4B), a waterfall plot (see, e.g., FIGs. 4C-4H), a
table (see, e.g., FIG.
4M), a volcano plot (see, e.g., FIGs. 4K-4L), or a graph (see, e.g., FIGs. 4I-
4J).
[0036] The apparatus of any preceding or subsequent aspect or embodiment, or
combinations
thereof, may be caused to apply a filter to the patient data to filter the
patient data based on any
useful attribute, including without limitation at least one of a particular
biomarker or group
thereof, the at least one biomarker status, a patient cohort, a patient
status, the at least one
therapeutic regime, the biological processing event, the biological sampling
event, at least one
indicium listed in Table 1, and any combination thereof Display of at least
one of the plurality of
visual elements can be associated with the filtered patient data.
[0037] In regards to the apparatus of any preceding or subsequent aspect or
embodiment, or
combinations thereof, the patient data may comprise historical data that
tracks the patient status
over a period of time. In some embodiments, the patient status comprises
information associated
with an age of the patient, a sex of the patient, a race of the patient, a
condition and / or disease of
the patient, a status of the condition and / or disease of the patient, and
/or an outcome of the
condition and / or disease of the patient. The outcome of the condition and /
or disease of the
patient may comprise any outcome of interest, including without limitation
death, partial
remission, complete remission, recurrence, or cure. The condition or disease
of the patient may
comprise any condition or disease of interest, including without limitation a
neoplastic/proliferative disease or disorder, neurological disease or
disorder, autoimmune disease
or disorder, cardiovascular disease or disorder, or infectious disease. In
preferred embodiments,
the neoplastic/proliferative disease comprises cancer. The lineage of the
cancer can be a lineage
listed in Table 1. The lineage of the cancer can be a lineage listed elsewhere
herein. In some
embodiments, the cancer comprises an acute myeloid leukemia (AML), breast
carcinoma,
CA 02999890 2018-03-23
WO 2017/053915 PCT/US2016/053614
cholangiocarcinoma, colorectal adenocarcinoma, extrahepatic bile duct
adenocarcinoma, female
genital tract malignancy, gastric adenocarcinoma, gastroesophageal
adenocarcinoma,
gastrointestinal stromal tumor (GIST), glioblastoma, head and neck squamous
carcinoma,
leukemia, liver hepatocellular carcinoma, low grade glioma, lung
bronchioloalveolar carcinoma
(BAC), non-small cell lung cancer (NSCLC), small cell lung cancer (SCLC),
lymphoma, male
genital tract malignancy, malignant solitary fibrous tumor of the pleura
(MSFT), melanoma,
multiple myeloma, neuroendocrine tumor, nodal diffuse large B-cell lymphoma,
non epithelial
ovarian cancer (non-EOC), ovarian surface epithelial carcinoma, pancreatic
adenocarcinoma,
pituitary carcinomas, oligodendroglioma, prostatic adenocarcinoma,
retroperitoneal or peritoneal
carcinoma, retroperitoneal or peritoneal sarcoma, small intestinal malignancy,
soft tissue tumor,
thymic carcinoma, thyroid carcinoma, or uveal melanoma. The cancer may be an
acute
lymphoblastic leukemia; acute myeloid leukemia; adrenocortical carcinoma; AIDS-
related
cancer; AIDS-related lymphoma; anal cancer; appendix cancer; astrocytomas;
atypical
teratoid/rhabdoid tumor; basal cell carcinoma; bladder cancer; brain stem
glioma; brain tumor,
brain stem glioma, central nervous system atypical teratoid/rhabdoid tumor,
central nervous
system embryonal tumors, astrocytomas, craniopharyngioma, ependymoblastoma,
ependymoma,
medulloblastoma, medulloepithelioma, pineal parenchymal tumors of intermediate
differentiation, supratentorial primitive neuroectodermal tumors and
pineoblastoma; breast
cancer; bronchial tumors; Burkitt lymphoma; cancer of unknown primary site
(CUP); carcinoid
tumor; carcinoma of unknown primary site; central nervous system atypical
teratoid/rhabdoid
tumor; central nervous system embryonal tumors; cervical cancer; childhood
cancers; chordoma;
chronic lymphocytic leukemia; chronic myelogenous leukemia; chronic
myeloproliferative
disorders; colon cancer; colorectal cancer; craniopharyngioma; cutaneous T-
cell lymphoma;
endocrine pancreas islet cell tumors; endometrial cancer; ependymoblastoma;
ependymoma;
esophageal cancer; esthesioneuroblastoma; Ewing sarcoma; extracranial germ
cell tumor;
extragonadal germ cell tumor; extrahepatic bile duct cancer; gallbladder
cancer; gastric
(stomach) cancer; gastrointestinal carcinoid tumor; gastrointestinal stromal
cell tumor;
gastrointestinal stromal tumor (GIST); gestational trophoblastic tumor;
glioma; hairy cell
leukemia; head and neck cancer; heart cancer; Hodgkin lymphoma; hypopharyngeal
cancer;
intraocular melanoma; islet cell tumors; Kaposi sarcoma; kidney cancer;
Langerhans cell
histiocytosis; laryngeal cancer; lip cancer; liver cancer; malignant fibrous
histiocytoma bone
cancer; medulloblastoma; medulloepithelioma; melanoma; Merkel cell carcinoma;
Merkel cell
skin carcinoma; mesothelioma; metastatic squamous neck cancer with occult
primary; mouth
cancer; multiple endocrine neoplasia syndromes; multiple myeloma; multiple
myeloma/plasma
cell neoplasm; mycosis fungoides; myelodysplastic syndromes;
myeloproliferative neoplasms;
16
CA 02999890 2018-03-23
WO 2017/053915 PCT/US2016/053614
nasal cavity cancer; nasopharyngeal cancer; neuroblastoma; Non-Hodgkin
lymphoma;
nonmelanoma skin cancer; non-small cell lung cancer; oral cancer; oral cavity
cancer;
oropharyngeal cancer; osteosarcoma; other brain and spinal cord tumors;
ovarian cancer; ovarian
epithelial cancer; ovarian germ cell tumor; ovarian low malignant potential
tumor; pancreatic
cancer; papillomatosis; paranasal sinus cancer; parathyroid cancer; pelvic
cancer; penile cancer;
pharyngeal cancer; pineal parenchymal tumors of intermediate differentiation;
pineoblastoma;
pituitary tumor; plasma cell neoplasm/multiple myeloma; pleuropulmonary
blastoma; primary
central nervous system (CNS) lymphoma; primary hepatocellular liver cancer;
prostate cancer;
rectal cancer; renal cancer; renal cell (kidney) cancer; renal cell cancer;
respiratory tract cancer;
retinoblastoma; rhabdomyosarcoma; salivary gland cancer; Sezary syndrome;
small cell lung
cancer; small intestine cancer; soft tissue sarcoma; squamous cell carcinoma;
squamous neck
cancer; stomach (gastric) cancer; supratentorial primitive neuroectodermal
tumors; T-cell
lymphoma; testicular cancer; throat cancer; thymic carcinoma; thymoma; thyroid
cancer;
transitional cell cancer; transitional cell cancer of the renal pelvis and
ureter; trophoblastic tumor;
ureter cancer; urethral cancer; uterine cancer; uterine sarcoma; vaginal
cancer; vulvar cancer;
Waldenstrom macroglobulinemia; or Wilm's tumor. The stage of the cancer may
comprise a
stage listed in Table 1. For example, the stage can be stage I, stage II,
stage III, stage IV,
unknown, or various subsets of such stages. In some embodiments, the histology
of the cancer is
as listed in Table 1.
[0038] The apparatus of any preceding or subsequent aspect or embodiment, or
combinations
thereof, may be caused to determine an existence of a relationship between the
patient status and
the at least one biomarker status based on the biological sampling event to
determine the at least
one interrelationship.
[0039] The apparatus of any preceding or subsequent aspect or embodiment, or
combinations
thereof, may be caused to determine the at least one biomarker status by
detecting at least one
biomarker in the at least one biological sampling event and assessing at least
one characteristic
for the at least one particular biomarker. The at least one characteristic may
comprise any
desired characteristic, including without limitation at least one of
overexpression,
underexpression, a modification, a polymorphism, a deletion, an insertion, a
substitution, a
translocation, a fusion, a break, a duplication, an amplification, a repeat, a
copy number variant, a
DNA methylation variation, a transcript expression level, a transcript
variant, and a splice
variant. One of skill will appreciate that the at least one characteristic can
be selected based upon
the particular biomarker. By way of non-limiting example, the overexpression
and
underexpression of proteins can be detected using immunological assays and
mutations in nucleic
17
CA 02999890 2018-03-23
WO 2017/053915 PCT/US2016/053614
acids can be detected via sequence analysis (e.g., Sanger dye-termination
sequencing or high
throughput next-generation sequencing (NGS)).
[0040] The apparatus of any preceding or subsequent aspect or embodiment, or
combinations
thereof, may be caused to assess a biological sample from a patient using at
least one assessment
technique. The at least one assessment technique may comprise any useful
technique, including
without limitation gene expression analysis, nucleic acid sequence analysis,
nucleic acid
methylation analysis and / or proteomic analysis to detect the at least one
particular biomarker in
the at least one biological sampling event. The at least one particular
biomarker may comprise
any useful biomarker, e.g., a protein, a nucleic acid, a lipid, a
carbohydrate, or any combination
thereof. The at least one particular biomarker can be a biomarker listed in
any one of Tables 1-7.
The at least one particular biomarker can be listed elsewhere herein. The at
least one particular
biomarker may be as described in any one of US Patent Publications
U520100113299, published
May 6, 2010; U520140222443, published August 7, 2014; U520150307947, published
October
29, 2015; U520160186266, published June 30, 2016; and U520150024952, published
January
22, 2015; US Patent Nos. 8,700,335, issued April 15, 2014 and 8,768,629,
issued July 1, 2014;
and Int'l Patent Publications W02015116868, published August 6, 2015, and
W02016141169,
published September 9, 2016; each of which patent publications is incorporated
herein by
reference in its entirety.
[0041] The apparatus of any preceding or subsequent aspect or embodiment, or
combinations
thereof, may be caused to process the patient data to determine which members
of the plurality of
patients are matched and which members of the plurality of patients are
unmatched. The patient
data can also be processed to determine patients with mixed matched/unmatched
treatments or
treatments that were neither matched nor unmatched. In some embodiments, the
apparatus is
caused to perform a survival analysis with the unmatched and matched patient
data. The
apparatus can further be caused to display on the at least one graphical user
interface a visual
element associated with the survival analysis. The visual element associated
with the survival
analysis can be a Kaplan Meier plot (see, e.g., FIGs. 4A-4C, 4E, 4H, 4K-N) or
other appropriate
visual element as desired.
[0042] These and other features, aspects, embodiments, and advantages of the
present disclosure
will be apparent from a reading of the following detailed description together
with the
accompanying drawings, which are briefly described below. The present
disclosure includes any
combination of two, three, four, or more features or elements set forth in
this disclosure or recited
in any one or more of the claims, regardless of whether such features or
elements are expressly
combined or otherwise recited in a specific embodiment description or claim
herein. This
disclosure is intended to be read holistically such that any separable
features or elements of the
18
CA 02999890 2018-03-23
WO 2017/053915 PCT/US2016/053614
disclosure, in any of its aspects and embodiments, should be viewed as
intended, namely to be
combinable, unless the context of the disclosure clearly dictates otherwise.
BRIEF DESCRIPTION OF THE SEVERAL VIEWS OF THE DRAWINGS
[0043] Having thus described the disclosure in general terms, reference will
now be made to the
accompanying drawings, which are not necessarily drawn to scale, and wherein:
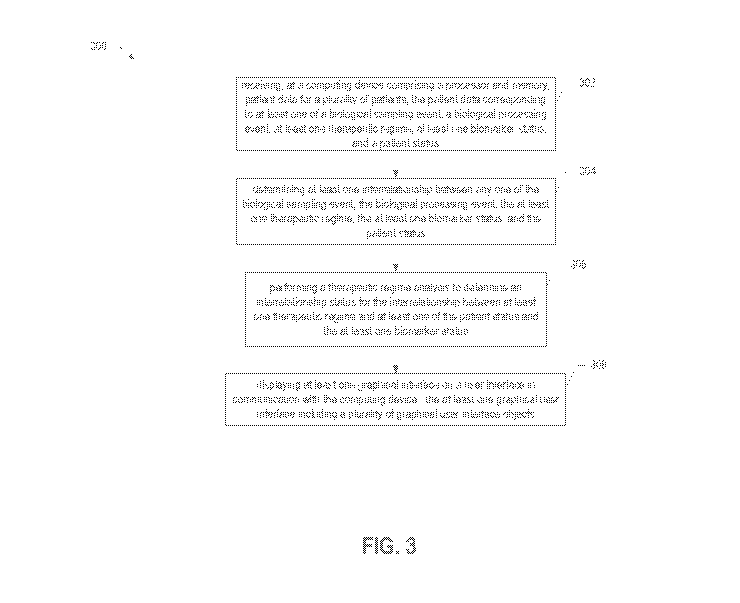
[0044] FIG. 1 illustrates a block diagram of an apparatus for providing a user
interface for an
application for analyzing biological data according to one aspect of the
present disclosure;
[0045] FIG. 2 illustrates an example system that may provide a user interface
for an application
for analyzing biological data according to one aspect of the present
disclosure;
[0046] FIG. 3 illustrates a flowchart according to an example method for
analyzing biological
data according to one aspect of the present disclosure;
[0047] FIG. 4A illustrates an example of a display of a user interface for an
application for
analyzing biological data according to one aspect of the present disclosure;
[0048] FIG. 4B illustrates a zoomed view of a portion of FIG. 4A according to
one aspect of the
present disclosure;
[0049] FIG. 4C illustrates an example of a display of a user interface for an
application for
analyzing biological data according to one aspect of the present disclosure;
[0050] FIG. 4D illustrates a zoomed view of the portion of FIG. 4C according
to one aspect of
the present disclosure;
[0051] FIG. 4E illustrates an example of a display of a user interface for an
application for
analyzing biological data according to one aspect of the present disclosure;
[0052] FIG. 4F illustrates a detailed example of a portion of FIG. 4E
according to one aspect of
the present disclosure;
[0053] FIG. 4G an example of a display of a user interface for an application
for analyzing
biological data according to one aspect of the present disclosure;
[0054] FIG. 4H illustrates an example of a display of a user interface for an
application for
analyzing biological data according to one aspect of the present disclosure;
[0055] FIG. 41 illustrates an example of a display of a user interface for an
application for
analyzing biological data according to one aspect of the present disclosure;
[0056] FIG. 4J illustrates a zoomed view of a portion of FIG. 41 according to
one aspect of the
present disclosure;
[0057] FIG. 4K illustrates an example of a display of a user interface for an
application for
analyzing biological data according to one aspect of the present disclosure;
[0058] FIG. 4L illustrates an example of a display of a user interface for an
application for
analyzing biological data according to one aspect of the present disclosure;
19
CA 02999890 2018-03-23
WO 2017/053915 PCT/US2016/053614
[0059] FIG. 4M illustrates an example of a display of a user interface for an
application for
analyzing biological data according to one aspect of the present disclosure;
[0060] FIG. 4N illustrates an example of a display of a user interface for an
application for
analyzing biological data according to one aspect of the present disclosure;
[0061] FIG. 40 illustrates an example of a display of a user interface for an
application for
analyzing biological data according to one aspect of the present disclosure;
[0062] FIG. 4P illustrates an example of a display of a user interface for an
application for
analyzing biological data according to one aspect of the present disclosure;
[0063] FIG. 4Q illustrates an example of a display of a user interface for an
application for
analyzing biological data according to one aspect of the present disclosure;
[0064] FIG. 4R illustrates an example display of a user interface for an
application for analyzing
biological data according to one aspect of the present disclosure; and
[0065] FIG. 5 illustrates an example data storage arrangement for an
application for analyzing
biological data according to one aspect of the present disclosure.
[0066] Accordingly, each of FIGS. 4A-4R illustrates an example display of a
user interface for
an application for analyzing biological data according to one aspect of the
present disclosure. The
specific data, text, numbers and such textual information provided in each of
FIGS. 4A-4R are
not necessary as to the inventive aspects provided herein. Such information is
merely provided as
an example of the kinds, types, and /or quantities of data, text, and /or
information that are
displayed on a user interface (i.e., the GUI) associated with the application
for analyzing the
biological data.
DETAILED DESCRIPTION OF THE DISCLOSURE
[0067] The present disclosure now will be described more fully hereinafter
with reference to the
accompanying drawings, in which some, but not all aspects of the disclosure
are shown. Indeed,
the disclosure may be embodied in many different forms and should not be
construed as limited
to the aspects set forth herein. Like numbers refer to like elements
throughout.
[0068] Molecular profiling systems and methods have been developed to profile
various
molecular characteristics of patient samples. Such profiling can be used for
various purposes,
such as providing diagnostic, prognostic and theranostic information.
Diagnosis may refer to the
detection, identification or characterization (e.g., staging or determining
progress) of an illness,
condition, disease or disorder by examination of symptoms and other patient
characteristics, such
as molecular analysis of patient samples. Prognosis may refer to the likely
course or outcome of a
condition or illness. For example, an advanced disease with limited treatment
options can have a
poor prognosis. Theranostics includes diagnostic testing that provides the
ability to affect therapy
or treatment of a diseased state. Theranostics testing provides a theranosis
in a similar manner
CA 02999890 2018-03-23
WO 2017/053915 PCT/US2016/053614
that diagnostics or prognostic testing provides a diagnosis or prognosis,
respectively. By way of
non-limiting example, theranosis includes detecting a state of a certain
biomarker in a patient
sample and making a prediction of a likely efficacy of a treatment option
based on the detected
state of the biomarker. As used herein, theranostics encompasses any desired
form of therapy
related testing, including predictive medicine, personalized medicine,
integrated medicine,
pharmacodiagnostics and Dx/Rx partnering. Therapy related tests can be used to
predict and
assess drug response in individual subjects in order to provide personalized
medicine. Predicting
a drug response comprises determining whether a subject is a likely responder
or a likely non-
responder to a candidate therapeutic agent, e.g., before the subject has been
exposed or otherwise
treated with the treatment. Assessing a drug response can be monitoring a
response to a drug,
e.g., monitoring the subject's improvement or lack thereof over a time course
after initiating the
treatment. Theranostic tests are useful to select a subject for treatment who
is particularly likely
to benefit from the treatment or to provide an early and objective indication
of treatment efficacy
in an individual subject.
[0069] As opposed to traditional medical approaches wherein patients with
similar clinical
criteria are lumped together for treatment options, molecular profiling
analysis may be used to
provide or assist in providing more informed and effective personalized
treatment options for
patients, resulting in improved patient care and enhanced treatment outcomes.
[0070] Molecular profiling can be used to determine one or more treatment
regimen for a
disease, for example a proliferative disorder such as cancer. As an overview,
one or more
samples from a patient are collected, including without limitation a tumor
sample or bodily fluid.
The samples are processed and any number of desired molecular tests is run on
the one or more
sample. For example, molecular testing can be performed to assess panels of
biomarkers
comprising proteins or nucleic acids. The states of the biomarkers can be
compared to biomarker-
drug association rules that map relations between states of various biomarkers
and therapeutic
agents that are more or less likely to benefit the patient. Thus, the states
of the biomarkers are
used to help guide treatment regimens for the patients. A report can be
generated that comprises
listings of the drugs that are predicted to be more likely to benefit the
patient, less likely to
benefit the patient, or of intermediate benefit. The report may list the
biomarkers that were tested,
the biomarker states determined, and other desired information such as
biomarker descriptions
and evidence behind the biomarker-drug association rules. Evidence may be
derived from
various sources such as scientific literature reports, clinical trials, and
prior molecular profiling
data. Systems can be constructed to carry out such molecular profiling. The
systems may
comprise various databases, including without limitation databases comprising
reference values
for the biomarkers tested, biomarker-drug association rules, and evidence
supporting each such
21
CA 02999890 2018-03-23
WO 2017/053915 PCT/US2016/053614
rule. The systems can comprise computer implemented instructions to compare
the test results
against the reference values and rules databases, determine drugs of likely
benefit, lack of
benefit, or intermediate benefit based on the comparisons, and generate the
molecular profiling
reports. Treating physicians such as oncologists can use such reports to
assist in determining
personalized treatment regimens for their patients.
[0071] Components of an exemplary molecular profiling system are described
herein in Example
1. Systems and methods for molecular profiling can be found in US Patent
Publications
US20100113299, published May 6, 2010; U520140222443, published August 7, 2014;
U520150307947, published October 29, 2015; U520160186266, published June 30,
2016; and
U520150024952, published January 22, 2015; US Patent Nos. 8,700,335, issued
April 15, 2014
and 8,768,629, issued July 1, 2014; and Int'l Patent Publications
W02015116868, published
August 6, 2015, and W02016141169, published September 9, 2016; each of which
patent
publications is incorporated herein by reference in its entirety. These
publications further
describe useful biomarkers and biomarker-drug association rules that can be
used to perform the
molecular profiling. These publications also provide illustrative molecular
profiling reports.
[0072] A large amount of data can be generated by molecular profiling of
individual patients. For
example, data may be generated by profiling of at least hundreds, thousands,
or tens of thousands
patients. Such composite data may be generated for patients having multiple
attributes such as
cancers of different lineages, histologies, and stages. The patients may
differ along clinical
parameters including without limitation age and sex. The composite data can
comprise the
biomarkers and biomarker states determined for the patient samples. As
available, data can also
be collected for treatment regimens that were actually prescribed to the
patients both before and
after the time of molecular profiling. Patient response to each treatment can
be recorded and
tracked over time to create a repository of outcomes data for the patients.
The outcomes data can
track whether patients were treated with regimens predicted to be of likely
benefit according to
the molecular profiling (which may be referred to herein as "matched"
treatments), treated with
regimens predicted to likely not be of benefit according to the molecular
profiling (which
referred to herein as "unmatched" treatments), and patients whose treatments
were of
indeterminate benefit or not reported according to the molecular profiling.
Systems can be
implemented to dynamically add additional patient molecular profile data and
outcomes data as
such data becomes available.
[0073] It will be appreciated that such biomarker and outcome data can provide
invaluable
knowledge towards the treatment of additional patients. For example,
oncologists may treat
patients with treatment regimens that were beneficial to other patients having
similar molecular
profiles. Such data may also be useful for hypothesis generation. For example,
molecular
22
CA 02999890 2018-03-23
WO 2017/053915 PCT/US2016/053614
profiling data reveals the incidence of states of various biomarkers in
various disease settings,
and can be mined to generate hypotheses about disease etiology and drug
targets. It will be
appreciated by one of skill that mining such data with hundreds of parameters
(e.g., different
biomarkers, states of biomarkers, molecular techniques, drugs, clinical
parameters) across patient
cohorts with tens or thousands of patients can be very complex. The present
invention provides
methods and systems that can be used to visualize and analyze complex
molecular profiling and
outcomes data. Accordingly, the present invention provides improvements in the
fields of life
sciences and medical practice and research including such aspects as assisting
in patient
treatment and hypothesis generation. See, e.g., Examples 2 and 3 herein.
[0074] As used herein, the terms "data" and "information" and similar terms
may be used
interchangeably to refer to data capable of being stored, transmitted,
received, and/or displayed in
accordance with various aspects of the present disclosure. Thus, use of any
such terms should not
be taken to limit the nature and/or scope of the disclosure.
[0075] Additionally, the term "computer-readable medium" as used herein refers
to any medium
configured to provide and/or assist in providing information such as, for
example instructions for
execution, to a processor. Computer-readable mediums may take many forms,
including, but not
limited to a non-transitory computer-readable storage medium (e.g., non-
volatile memory,
volatile memory, etc.), a transmission medium, and/or the like. Examples of
non-transitory
computer-readable media include a magnetic computer readable medium (e.g., a
floppy disk, a
hard disk, magnetic tape, and/or the like), an optical computer readable
medium (e.g., a compact
disc read only memory (CD-ROM), a digital versatile disk (DVD), a Blu-Ray
disc, and/or the
like), a random access memory (RAM), a programmable read only memory (PROM),
an erasable
programmable read only memory (EPROM), a FLASH-EPROM, and/or any other
suitable non-
transitory medium from which a computer can read. One skilled in the art may
appreciate that
where aspects are described as using a computer-readable storage medium, other
types of
computer-readable media may be substituted for or used in addition to the
computer-readable
storage medium in additional aspects. The term computer-readable storage
medium is used
herein to refer to any computer-readable medium except transmission media.
[0076] In this regard, transmission media may include wired and/or wireless
transmission media
such as, for example coaxial cables, copper wire, and carrier waves that
travel through space
without wires and/or cables. Carrier waves may include acoustic waves and
electromagnetic
waves, which may include radio, optical and infrared waves. Signals include
man-made transient
variations in amplitude, frequency, phase, polarization, and/or other physical
properties
transmitted through the transmission medium.
23
CA 02999890 2018-03-23
WO 2017/053915 PCT/US2016/053614
[0077] Additionally, as used herein, the term "circuitry" may refer to (1)
hardware-only circuit
implementations; (2) combinations of circuits and computer program product(s)
comprising
software and/or firmware instructions stored on one or more computer-readable
media that work
together to cause an apparatus to perform one or more functions described
herein; and/or (3)
circuits such as, for example, microprocessor(s) or portion(s) of
microprocessor(s) that require
software or firmware for operation even if the software or firmware is not
physically present. The
definition of "circuitry" applies to all uses of the term herein, including in
any of the claim(s). As
a further example, the term "circuitry" may include, for example, a baseband
integrated circuit or
applications processor integrated circuit for a mobile device or similar
integrated circuit in a
server, a cellular network device, and/or other computing and/or network
device.
[0078] FIG. 1 illustrates a block diagram of an apparatus 100 that may be
configured to provide a
graphical user interface (GUI) for an application in accordance with various
example aspects.
The apparatus 100 may be embodied as any computing device or plurality of
computing devices
that may execute and/or otherwise facilitate usage of an application for which
a GUI may be
provided for analyzing biological data. According to some example embodiments,
the apparatus
100 may be embodied as a server, desktop computer, a laptop computer, a mobile
computing
device (e.g., a smart phone, a tablet computer, and/or the like), or the like.
It will be appreciated
that the components, devices, and/or elements illustrated in and described
with respect to FIG. 1
below may not be mandatory, and thus, some components, devices and/or elements
may be
omitted in various embodiments. Additionally, some embodiments may include
additional or
different components, devices, and/or elements beyond those illustrated in and
described with
respect to FIG. 1.
[0079] In some example embodiments, a processor 102 may be embodied in various
forms. For
example, the processor 102 may be embodied as various hardware processing
means such as a
microprocessor, a coprocessor, a controller or various other computing or
processing devices
including integrated circuits such as, for example, an ASIC (application
specific integrated
circuit), an FPGA (field programmable gate array), some combination thereof,
or the like.
Although illustrated as a single processor, it will be appreciated that the
processor 102 may
comprise a plurality of processors. The plurality of processors may be in
operative
communication with each other and may be collectively configured to perform
one or more
functionalities of the apparatus 100. In some embodiments in which the
apparatus 100 is
embodied as a plurality of computing devices and/or in some embodiments in
which at least
some functionalities attributed to the apparatus 100 may be performed and/or
supported by a
remote computing device(s), such as in embodiments in which an application for
which a GUI
may be provided, is at least partially hosted by a computing device(s) located
remotely from an
24
CA 02999890 2018-03-23
WO 2017/053915 PCT/US2016/053614
application user (e.g., by a cloud computing infrastructure), a plurality of
processors, which may
collectively form the processor 102, may be distributed across a plurality of
computing devices
that may be in operative communication with each other, such as via a network.
In some example
embodiments, the processor 102 may be configured to execute instructions that
may be stored in
a memory 104 or that may be otherwise accessible to the processor 102. As
such, whether
configured by hardware or by a combination of hardware and software, the
processor 102 may be
capable of performing operations according to various embodiments disclosed
herein while
configured accordingly.
[0080] In some example embodiments, the memory 104 may include one or more
memory
devices. Memory 104 may include fixed and/or removable memory devices. In
embodiments in
which the memory 104 includes a plurality of memory devices, the plurality of
memory devices
may be embodied on a single computing device, or may be distributed across a
plurality of
computing devices, which may collectively provide functionality of the
apparatus 100. For
example, in some example embodiments in which an application for which a GUI
for analyzing
biological data may be provided in accordance with various example embodiments
is at least
partially remotely hosted (e.g., by a cloud computing infrastructure), the
memory 104 may
include one or more memory devices that may be disposed remotely from an
application user,
such as in a server or other cloud computing infrastructure that may host the
application. In some
embodiments, the memory 104 may provide a non-transitory computer-readable
storage medium
that may store computer program instructions (e.g., computer-readable program
code 106) that
may be executed by the processor 102. In this regard, the memory 104 may be
configured to
store information, data, applications, instructions and/or the like for
enabling the apparatus 100 to
carry out various functions in accordance with one or more example
embodiments. In some
embodiments, the memory 104 may be in communication with one or more of the
processor 102,
communication interface 108, or user interface 110 via a bus(es) for passing
information among
components of the apparatus 100.
[0081] The apparatus 100 may further include a communication interface 108.
The
communication interface 108 may enable the apparatus 100 to receive a signal
that may be sent
by another computing device, such as over a network. In this regard, the
communication interface
108 may include one or more interface mechanisms for enabling communication
with other
devices and/or networks. In some example embodiments, the communication
interface 108 may
include, for example, an antenna (or multiple antennas) and supporting
hardware and/or software
for enabling communications with a wireless communication network (e.g., a
cellular network,
Wi-Fi, WLAN, and/or the like) and/or a communication modem or other
hardware/software for
supporting communication via cable, digital subscriber line (DSL), USB,
FireWire, Ethernet or
CA 02999890 2018-03-23
WO 2017/053915 PCT/US2016/053614
other wireline networking methods. In some example embodiments, the
communication interface
108 may be configured to send data to and/or receive data from one or more
remote devices
and/or networks in support of an application for which a GUI may be provided
for analyzing
biological data in accordance with one or more example embodiments. Thus, in
some example
embodiments, data can be communicated to and/or received from another device
over a network
via communication interface 108 in response to user interaction with a GUI
object in accordance
with various example embodiments. As an example, in some example embodiments
in which a
GUI object may be provided for a biological data visualization application,
the GUI object may
be used to select a parameter for visualization, analysis, and/or the like to
apparatus 100 from a
remote content source (e.g., a database) via a network, and the selected
parameter may be
received from the remote content source via the communication interface 108.
[0082] In some example embodiments, the apparatus 100 may include the user
interface 110.
The user interface 110 may be in communication with the processor 102, memory
104, and/or
communication interface 108 to receive an indication of a user input and/or to
provide an audible,
visual, mechanical, or other output to a user. As such, the user interface 110
may include, for
example, a keyboard, a mouse, a joystick, a display, a touch screen display, a
microphone, a
speaker, and/or other input/output mechanisms. In embodiments wherein the user
interface 110
comprises a touch screen display, the user interface 110 may additionally be
configured to detect
and/or receive an indication of a touch gesture or other input to the touch
screen display. In some
example embodiments, the user interface 110 may comprise a display configured
to display a
GUI object in accordance with various example embodiments. For example, the
user interface
110 of some example embodiments may comprise a display that may be configured
to display a
plurality of GUI objects that are associated with patient data in accordance
with various example
embodiments. In some example embodiments in which the user interface 110
comprises a display
configured to display a GUI object, the user interface 110 may be configured
to detect user input
defining an interaction with the GUI object, such as a user input
corresponding to a selection of a
particular GUI object.
[0083] FIG. 2 illustrates a schematic block diagram of a system configured to
provide a GUI for
an application for analyzing biological data in accordance with various
example embodiments of
the present disclosure. For example, the user devices 100A, 100B, 100C may
include
components, devices, and/or elements included within the apparatus 100 as
shown in FIG. 1 and
described herein. Additionally, some user devices may include additional or
different
components, devices, and/or elements beyond those illustrated in and described
with respect to
FIG. 1.
26
CA 02999890 2018-03-23
WO 2017/053915 PCT/US2016/053614
[0084] As previously mentioned, the user devices 100A, 100B, 100C may include
a
communication interface 108 configured to communicate with any of the user
devices and/or a
database 90 over a network 80. The network 80 may, for example, comprise a
wireline network,
wireless network (e.g., a cellular network, wireless local area network,
wireless wide area
network, some combination thereof, or the like), or a combination thereof, and
in some example
embodiments may comprise the Internet.
[0085] The database 90 may be embodied as one or more servers, a cloud
computing
infrastructure, or the like, which may be configured to provide access to
patient data
corresponding to patient(s) to one or more user devices 100A, 100B, 100C via
the network 80. In
some example embodiments, the database 90 may be configured to store
information, data,
applications, instructions and/or the like for enabling the user devices to
carry out various
functions in accordance with one or more example embodiments. For example, the
database may
be configured to store patient data for a plurality of patients. In some
embodiments, the patient
data is associated with at least a biological sampling event, a biological
processing event, a
therapeutic regime, a marker status, and/or a patient status. Additionally,
the patient data may
include reference data associated with at least a biological sampling event, a
biological
processing event, a therapeutic regime, a marker status, and/or a patient
status. In further
embodiments, the patient data comprises historical data that tracks the
patient status over a period
of time. The period of time may comprise a period of time long enough to
provide significant
information regarding the patient's status. For example, the period of time
may comprise a two
year period, a three year period, a four year period, a five year period, a
six year period, a seven
year period, or a longer period time, such as the lifetime of the patient. The
period can be based
on any such period when the patient has an examination. The patient's status
may be updated
each time the patient comes in for an exam within that time period. Thus,
patient data may
comprise outcome data for the patient after one or more therapeutic regimens.
Accordingly, the
database 90 may be embodied as any suitable computing device and/or
infrastructure configured
to transmit patient data to any one of the user devices 100A, 100B, 100C via
the network 80.
[0086] In some example embodiments, the database 90 may be configured to store
and/or
provide access to an application to one or more of the user devices 100A,
100B, 100C via the
network 80. In this regard, in some example embodiments, functionality of the
application for
analyzing biological data may be divided between the user device and the
database. As an
example, in some embodiments, the database 90 may be configured to provide the
user device
100A, 100B, 100C with patient data corresponding to a biological sampling
event, a biological
processing event, a therapeutic regime, a marker status, and/or a patient
status. Additionally, the
database 90 may be configured to provide data corresponding to a relationship
between any one
27
CA 02999890 2018-03-23
WO 2017/053915 PCT/US2016/053614
of the biological sampling event(s), biological processing event(s),
therapeutic regime(s), marker
status(es), and/or patient status(es) to any one of the user devices via the
network. According to
another embodiment, the database 90 may be configured to determine the
existence of and/or the
nature of the relationship between any of the biological sampling event(s),
biological processing
event(s), therapeutic regime(s), marker status(es), and/or patient status(es).
Likewise, the
database 90 may be configured to receive data corresponding to patient data,
as described herein,
via the network 80. A more detailed description regarding a data base
arrangement including
database 90 is provided in reference to FIG. 5.
[0087] FIG. 3 illustrates a flowchart according to an example method of
analyzing biological
data according to various example aspects. In particular, the example method
300 of analyzing
biological data may be provided via an application having a GUI object
according to example
embodiments described herein. The method 300 may begin with receiving, at a
computing device
comprising a processor and memory, patient data, 302, for a plurality of
patients. The patient data
may correspond to at least one of a biological sampling event, a biological
processing event, a
therapeutic regime, a marker status (e.g., a biomarker status), and/or a
patient status. In some
embodiments, the patient data may include reference data corresponding to
biological sampling
event(s), biological processing event(s), therapeutic regime(s), marker
status(es), and/or patient
status(es) for a plurality of patients. According to another embodiment, the
patient data may
include data corresponding to at least one of a biological sampling event, a
biological processing
event, a therapeutic regime, a marker status, and/or a patient status for a
target patient associated
with a biological sample to be analyzed.
[0088] The method 300 may further include determining at least one
interrelationship between
any one of the biological sampling event, the biological processing event, the
therapeutic regime,
the marker status, and the patient status, 304. For example, an apparatus
and/or a database may
include components, devices, and/or elements to determine the existence of
and/or nature of a
relationship between a marker status and a patient status. In this regard, a
marker status (e.g.,
biomarker status) may indicate the presence of a particular marker within a
biological sample
(e.g., tissue, fluid, etc.). Additionally, data corresponding to a patient
status may include
information associated with patient attributes (e.g., age, sex, race, etc.),
the patient's condition
and/or disease (i.e., the particular condition and/or disease afflicting the
patient), the status of the
patient's condition and/or disease (i.e., remission, recurrence, etc.), an
outcome of the condition
and /or disease (i.e., death, partial remission, complete remission,
recurrence, or cure), and/or the
like. As such, an apparatus and/or a database may be configured to determine a
relationship
between a marker status and a patient status. For example, the apparatus
and/or database, as
described herein, may be configured to determine a relationship exists between
the status of a
28
CA 02999890 2018-03-23
WO 2017/053915 PCT/US2016/053614
patient's condition and/or disease and a biological sample that has been
processed so as to
indicate the presence of a particular biomarker.
[0089] The biological sample may include any relevant biological sample that
can be used for
molecular profiling (e.g., sections of tissues such as biopsy or tissue
removed during surgical or
other procedures, bodily fluids, autopsy samples, and frozen sections taken
for histological
purposes). Such samples include blood and blood fractions or products (e.g.,
serum, buffy coat,
plasma, platelets, red blood cells, and the like), sputum, malignant effusion,
cheek cells tissue,
cultured cells (e.g., primary cultures, explants, and transformed cells),
stool, urine, other
biological or bodily fluids (e.g., prostatic fluid, gastric fluid, intestinal
fluid, renal fluid, lung
fluid, cerebrospinal fluid, and the like), etc. The sample can comprise
biological material that is a
fresh frozen & formalin fixed paraffin embedded (FFPE) block, formalin-fixed
paraffin
embedded, or is within an RNA preservative + formalin fixative. More than one
sample of more
than one type can be assessed for an individual patient. In an embodiment, the
biological sample
comprises a tumor sample. The tumor sample may be a fixed tumor sample.
[0090] The marker/biomarker can be any useful biological molecule or entity,
including without
limitation a protein (including a polypeptide or peptide), nucleic acid,
lipid, carbohydrate, or a
combination of any combination thereof Nucleic acids include without
limitation
deoxyribonucleic acid (DNA) and ribonucleic acids (RNA), such as messenger RNA
(mRNA),
transfer RNA (tRNA), small RNAs, non-coding RNAs, and microRNAs. Any useful
characteristic can be determined for a marker/biomarker, including without
limitation a
concentration, expression level, copy number, amino acid or nucleic acid
sequence. Sequences
can be assessed for various characteristics, including without limitation at
least one of a mutation,
a polymorphism, a deletion, an insertion, a substitution, a translocation, a
fusion, a break, a
duplication, an amplification, a repeat, a copy number variant (CNV), a DNA
methylation
variation, a transcript expression level, a transcript variant, and a splice
variant.
[0091] A marker/biomarker status can be determined by any appropriate
laboratory technique for
assessing a molecule in a biological sample. The technique may comprise gene
expression
analysis, nucleic acid sequence analysis, nucleic acid methylation analysis
and/or proteomic
analysis. Techniques for assessing such markers include but are not limited
to, nucleic acid
sequencing, such as a DNA sequencing or RNA sequencing; protein immunoassays
such as
Western blots, ELISA or immunohistochemistry (IHC); nucleic acid analysis such
in situ
hybridization (ISH), including fluorescent in situ hybridization (FISH) and/or
chromogenic in
situ hybridization (CISH); nucleic acid amplification (e.g., polymerase chain
reaction (PCR), and
quantitative varieties thereof including qPCR or RT-PCR); various types of
microarray (mRNA
expression arrays, PCR-based low density arrays, protein arrays, etc); various
types of nucleic
29
CA 02999890 2018-03-23
WO 2017/053915 PCT/US2016/053614
acid sequencing (Sanger, pyrosequencing, etc); comparative genomic
hybridization (CGH); high
throughput sequencing (HTS) or Next Generation sequencing (NGS) of nucleic
acids; Northern
blot for RNA; Southern blot for DNA; flow cytometry; nucleic acid methylation
analysis; nucleic
acid fragment analysis; gel electrophoresis; and any other appropriate
technique to assay the
presence or quantity of a biological molecule of interest. In various
embodiments of the
invention, any one or more of these techniques are used concurrently or
subsequent to each other
for assessing markers of interest.
[0092] Additional description of useful samples and biomarker analysis
techniques can be found
in US Patent Publications US20100113299, published May 6, 2010; U520140222443,
published
August 7, 2014; U520150307947, published October 29, 2015; U520160186266,
published June
30, 2016; and U520150024952, published January 22, 2015; US Patent Nos.
8,700,335, issued
April 15, 2014 and 8,768,629, issued July 1, 2014; and Int'l Patent
Publications W02015116868,
published August 6, 2015, and W02016141169, published September 9, 2016; each
of which
patent publications is incorporated herein by reference in its entirety.
[0093] The technique used to assess a marker can be chosen by the evidence
that links a
characteristic of that marker to a diagnosis, prognosis and/or theranosis. In
one non-limiting
example, it is known that the protein level and DNA copy number of the
HER2/ERBB2 gene and
protein are related to the efficacy of anti-HER2 treatments such as
trastuzumab, ado-trastuzumab
emtansine, pertuzumab or lapatinib. Thus, one may choose to assess HER2 using
IHC at the
protein level or ISH to assess HER2 gene copy number.
[0094] Any number of markers can be assessed according to the invention. The
markers may be
chosen to relate to a diagnosis, prognosis and/or theranosis of a condition
and / or disease such as
a cancer. In some embodiments, the markers comprise at least one of 1p19q,
ABL1, AKT1,
ALK, APC, AR, ATM, BRAF, BRCA1, BRCA2, cKIT, cMET, CSF1R, CTNNB1, EGFR,
EGFRvIII, ER, ERBB2 (HER2), ERCC1, FGFR1, FGFR2, FLT3, GNAll, GNAQ, GNAS,
H3K36me3, HER2, HRAS, IDH1, IDH2, JAK2, KDR (VEGFR2), KRAS, MDM2, MGMT,
MLH1, MPL, NOTCH1, NRAS, PBRM1, PD1, PDL1, PDGFRA, Pgp, PIK3CA, PR, PTEN,
RET, RRM1, SMO, SPARC, TLE3, TOP2A, TOP01, TP53, TS, TUBB3, VHL, MLH1, MSH2,
MSH6, PMS2, microsatellite instability (MSI) and ROS1. The markers may also
include at least
one of CAIX, hENT1, IDO, LAG3, RET, and NTRK1 (NTRK, TRK). Any of the markers
can be
assessed using any appropriate laboratory technique disclosed above or known
in the art.
[0095] The markers may include at least one, e.g., at least 1, 2, 3, 4, 5, 6,
7, 8, 9, 10, 11, 12, 13,
14, 15, 16, 17, 18, 19, 20, 21, 22, 23, 24, 25, 26, 27, 28, 29, 30, 31, 32,
33, 34, 35, 36, 37, 38, 39,
40, 41, 42, 43, 44, 45 or 46, marker selected from ABL1, AKT1, ALK, APC, ATM,
BRAF,
BRCA1, BRCA2, CDH1, cKIT, cMET, CSF1R, CTNNB1, EGFR, ERBB2 (Her2), ERBB4,
CA 02999890 2018-03-23
WO 2017/053915 PCT/US2016/053614
FBW7, FGFR1, FGFR2, FLT3, GNAll, GNAQ, GNAS, HNF1A, HRAS, IDH1, JAK2, JAK3,
KDR (VGFR2), KRAS, MPL, NOTCH1, NPM1, NRAS, PDGFRA, PIK3CA, PTEN, PTPN11,
RB1, RET, SMAD4, SMARCB1, SMO, STK11, TP53, and VHL. These markers may be
assessed at the DNA sequence level, e.g., including without limitation at
least one of a mutation,
a polymorphism, a deletion, an insertion, a substitution, a translocation, a
fusion, a break, a
duplication, an amplification, a repeat, a copy number variant (CNV), a DNA
methylation
variation, a transcript expression level, a transcript variant, and a splice
variant.
[0096] In other embodiment, nucleic acid sequence analysis is used to assess
at least one gene,
e.g., at least 1, 2, 3, 4, 5, 6, 7, 8, 9, 10, 11, 12, 13, 14, 15, 16, 17, 18,
19, 20, 21, 22, 23, 24, 25,
26, 27, 28, 29, 30, 31, 32, 33, 34, 35, 36, 37, 38, 39, 40, 41, 42, 43, 44,
45, 46, 47, 48, 49, 50, 60,
70, 80, 90, 100, 110, 120, 130, 140, 150, 160, 170, 180, 190, 200, 250, 300,
350, 400, 450, 500,
or all genes, selected from the group consisting of ABIl, ABL2, ACSL3, ACSL6,
AFF1, AFF3,
AFF4, AKAP9, AKT2, AKT3, ALDH2, AMER1, AR, ARFRP1, ARHGAP26, ARHGEF12,
ARID1A, ARID2, ARNT, ASPSCR1, ASXL1, ATF1, ATIC, ATP1A1, ATP2B3, ATR, ATRX,
AURKA, AURKB, AXIN1, AXL, BARD1, BCL10, BCL11A, BCL11B, BCL2, BCL2L11,
BCL2L2, BCL3, BCL6, BCL7A, BCL9, BCOR, BCORL1, BCR, BIRC3, BLM, BMPR1A,
BRD3, BRD4, BRIP1, BTG1, BTK, BUB1B, Cl lorf30, Cl5orf21, C15orf55, C15orf65,
Cl6orf75, C2orf44, CACNA1D, CALR, CAMTA1, CANT1, CARD11, CARS, CASC5,
CASP8, CBFA2T3, CBFB, CBL, CBLB, CBLC, CCDC6, CCNB1IP1, CCND1, CCND2,
CCND3, CCNE1, CD274, CD74, CD79A, CD79B, CDC73, CDH11, CDK12, CDK4, CDK6,
CDK8, CDKN1B, CDKN2A, CDKN2B, CDKN2C, CDX2, CEBPA, CHCHD7, CHIC2, CHN1,
CIC, CIITA, CLP1, CLTC, CLTCL1, CNBP, CNOT3, CNTRL, COL1A1, COPB1, COX6C,
CREB1, CREB3L1, CREB3L2, CREBBP, CRKL, CRLF2, CRTC1, CRTC3, CSF3R, CTCF,
CTLA4, CTNNA1, CXCR7, CYLD, CYP2D6, DAXX, DDB2, DDIT3, DDX10, DDX5, DDX6,
DEK, DICER1, DNM2, DNMT3A, DOT1L, DUX4, EBF1, ECT2L, EIF4A2, ELF4, ELK4,
ELL, ELN, EML4, EP300, EPHA3, EPHA5, EPHB1, EPS15, ERC1, ERCC1, ERCC2, ERCC3,
ERCC4, ERCC5, ERG, ESR1, ETV1, ETV4, ETV5, ETV6, EWSR1, EXT1, EXT2, EZH2, EZR,
FAM123B, FAM22A, FAM22B, FAM46C, FANCA, FANCC, FANCD2, FANCE, FANCF,
FANCG, FANCL, FAS, FBX011, FCGR2B, FCRL4, FEV, FGF10, FGF14, FGF19, FGF23,
FGF3, FGF4, FGF6, FGFR1OP, FGFR3, FGFR4, FH, FHIT, FIP1L1, FLCN, FLI1, FLT1,
FLT4, FNBP1, FOXA1, FOXL2, FOX01, FOX03, FOX04, FOXP1, FSTL3, FUBP1, FUS,
GAS7, GATA1, GATA2, GATA3, GID4, GMPS, GNA13, GOLGA5, GOPC, GPC3, GPHN,
GPR124, GRIN2A, GSK3B, H3F3A, H3F3B, HERPUD1, HEY1, HGF, HIP1, HIST1H3B,
HIST1H4I, HLF, HMGA1, HMGA2, HNRNPA2B1, HOOK3, HOXA11, HOXA13, HOXA9,
HOXC11, HOXC13, HOXD11, HOXD13, HSP9OAA1, HSP90AB1, IGF1R, IKBKE, IKZFl,
31
CA 02999890 2018-03-23
WO 2017/053915 PCT/US2016/053614
IL2, IL21R, IL6ST, IL7R, INHBA, IRF4, IRS2, ITK, JAK1, JAZFl, JUN, KAT6A,
KCNJ5,
KDM5A, KDM5C, KDM6A, KDSR, KEAP1, KIAA1549, KIF5B, KLF4, KLHL6, KLK2,
KTN1, LASP1, LCK, LCP1, LGR5, LHFP, LIFR, LM01, LM02, LPP, LRIG3, LRP1B, LYL1,
MAF, MAFB, MALT1, MAML2, MAP2K1 (MEK1), MAP2K2 (MEK2), MAP2K4, MAP3K1,
MAX, MCL1, MDM2, MDM4, MDS2, MECOM, MED12, MEF2B, MEN1, MITF, MKL1,
MLF1, MLL, MLL2, MLL3, MLLT1, MLLT10, MLLT11, MLLT3, MLLT4, MLLT6, MN1,
MNX1, MRE11A, MSH2, MSH6, M5I2, MSN, MTCP1, MTOR, MUC1, MUTYH, MYB,
MYC, MYCL1, MYCN, MYD88, MYH11, MYH9, MYST4, NACA, NBN, NCKIPSD,
NCOA1, NCOA2, NCOA4, NDRG1, NF2, NFE2L2, NFIB, NFKB2, NFKBIA, NIN, NKX2-1,
NONO, NOTCH2, NR4A3, NSD1, NT5C2, NTRK2, NTRK3, NUMA1, NUP214, NUP93,
NUP98, OLIG2, OMD, P2RY8, PAFAH1B2, PAK3, PALB2, PATZ1, PAX3, PAX5, PAX7,
PAX8, PBRM1, PBX1, PCM1, PCSK7, PDCD1, PDCD1LG2, PDE4DIP, PDGFB, PDGFRB,
PDK1, PERI, PHF6, PHOX2B, PICALM, PIK3CG, PIK3R1, PIK3R2, PIM1, PLAG1, PML,
PMS1, PMS2, POLE, POT1, POU2AF1, POU5F1, PPARG, PPP2R1A, PRCC, PRDM1,
PRDM16, PRF1, PRKAR1A, PRKDC, PRRX1, PSIP1, PTCH1, PTPRC, RABEP1, RAC1,
RAD21, RAD50, RAD51, RAD51L1, RALGDS, RANBP17, RAP1GDS1, RARA, RBM15,
RECQL4, REL, RHOH, RICTOR, RNF213, RNF43, RPL10, RPL22, RPL5, RPN1, RPTOR,
RUNDC2A, RUNX1, RUNx1T1, SBDS, SDC4, SDHAF2, SDHB, SDHC, SDHD, SEPT5,
SEPT6, SEPT9, SET, SETBP1, SETD2, SF3B1, SFPQ, SFRS3, 5H2B3, SH3GL1, 5LC34A2,
SLC45A3, SMAD2, SMARCA4, SMARCE1, SOCS1, SOX10, 50X2, SPECC1, SPEN, SPOP,
SRC, SRGAP3, SRSF2, SS18, 5518L1, SSX1, 55X2, 55X4, STAG2, STAT3, STAT4,
STAT5B, STIL, SUFU, SUZ12, SYK, TAF15, TAL1, TAL2, TBL1XR1, TCEA1, TCF12,
TCF3, TCF7L2, TCL1A, TERT, TETI, TET2, TFE3, TFEB, TFG, TFPT, TFRC, TGFBR2,
THRAP3, TLX1, TLX3, TMPRSS2, TNFAIP3, TNFRSF14, TNFRSF17, TOP1, TPM3, TPM4,
TPR, TRAF7, TRIM26, TRIM27, TRIM33, TRIP11, TRRAP, TSC1, TSC2, TSHR, TTL,
U2AF1, UBR5, USP6, VEGFA, VEGFB, VTI1A, WAS, WHSC1, WHSC1L1, WIF1, WISP3,
WRN, WWTR1, XPA, XPC, XP01, YWHAE, ZBTB16, ZMYM2, ZNF217, ZNF331, ZNF384,
ZNF521, ZNF703, ZRSR2.
[0097] In another embodiment, nucleic acid sequence analysis is used to assess
at least one gene,
e.g., at least 1, 2, 3, 4, 5, 6, 7, 8, 9, 10, 11, 12, 13, 14, 15, 16, 17, 18,
19, 20, 21, 22, 23, 24, 25,
26, 27, 28, 29, 30, 31, 32, 33, 34, 35, 36, 37, 38, 39, 40, 41, 42, 43, 44,
45, 46, 47, 48, 49, 50, 60,
70, 80, 90, 100, 110, 120, 130, 140, 150, 160, 170, 180, 190, 200, 250, 300,
350, 400, 450, 500,
or all genes, selected from the group consisting of ABIl, ABL1, ABL2, ACKR3,
ACSL3,
ACSL6, AFF1, AFF3, AFF4, AKAP9, AKT1, AKT2, AKT3, ALDH2, ALK, AMER1
(FAM123B), APC, AR, ARAF, ARFRP1, ARHGAP26, ARHGEF12, ARID1A, ARID2, ARNT,
32
CA 02999890 2018-03-23
WO 2017/053915 PCT/US2016/053614
ASPSCR1, ASXL1, ATF1, ATIC, ATM, ATP1A1, ATP2B3, ATR, ATRX, AURKA, AURKB,
AXIN1, AXL, BAP1, BARD1, BCL10, BCL11A, BCL11B, BCL2, BCL2L11, BCL2L2, BCL3,
BCL6, BCL7A, BCL9, BCOR, BCORL1, BCR, BIRC3, BLM, BMPR1A, BRAF, BRCA1,
BRCA2, BRD3, BRD4, BRIP1, BTG1, BTK, BUB1B, Cllorf30 (EMSY), C15orf65,
C2orf44,
CACNA1D, CALR, CAMTA1, CANT1, CARD11, CARS, CASC5, CASP8, CBFA2T3, CBFB,
CBL, CBLB, CBLC, CCDC6, CCNB1IP1, CCND1, CCND2, CCND3, CCNE1, CD274 (PDL1),
CD74, CD79A, CD79B, CDC73, CDH1, CDH11, CDK12, CDK4, CDK6, CDK8, CDKN1B,
CDKN2A, CDKN2B, CDKN2C, CDX2, CEBPA, CHCHD7, CHEK1, CHEK2, CHIC2, CHN1,
CIC, CIITA, CLP1, CLTC, CLTCL1, CNBP, CNOT3, CNTRL, COL1A1, COPB1, COX6C,
CREB1, CREB3L1, CREB3L2, CREBBP, CRKL, CRLF2, CRTC1, CRTC3, CSF1R, CSF3R,
CTCF, CTLA4, CTNNA1, CTNNB1, CYLD, CYP2D6, DAXX, DDB2, DDIT3, DDR2,
DDX10, DDX5, DDX6, DEK, DICER1, DNM2, DNMT3A, DOT1L, EBF1, ECT2L, EGFR,
EIF4A2, ELF4, ELK4, ELL, ELN, EML4, EP300, EPHA3, EPHA5, EPHB1, EPS15, ERBB2
(HER2), ERBB3 (HER3), ERBB4 (HER4), ERC1, ERCC1, ERCC2, ERCC3, ERCC4, ERCC5,
ERG, ESR1, ETV1, ETV4, ETV5, ETV6, EWSR1, EXT1, EXT2, EZH2, EZR, FAM46C,
FANCA, FANCC, FANCD2, FANCE, FANCF, FANCG, FANCL, FAS, FBX011, FBW7,
FCRL4, FEV, FGF10, FGF14, FGF19, FGF23, FGF3, FGF4, FGF6, FGFR1, FGFR1OP,
FGFR2, FGFR3, FGFR4, FH, FHIT, FIP1L1, FLCN, FLI1, FLT1, FLT3, FLT4, FNBP1,
FOXA1, FOXL2, FOX01, FOX03, FOX04, FOXP1, FSTL3, FUBP1, FUS, GAS7, GATA1,
GATA2, GATA3, GID4 (C17orf39), GMPS, GNAll, GNA13, GNAQ, GNAS, GOLGA5,
GOPC, GPC3, GPHN, GPR124, GRIN2A, GSK3B, H3F3A, H3F3B, HERPUD1, HEY1, HGF,
HIP1, HIST1H3B, HIST1H4I, HLF, HMGA1, HMGA2, HMGN2P46, HNF1A, HNRNPA2B1,
HOOK3, HOXA11, HOXA13, HOXA9, HOXC11, HOXC13, HOXD11, HOXD13, HRAS,
HSP9OAA1, HSP90AB1, IDH1, IDH2, IGF1R, IKBKE, IKZFl, IL2, IL21R, IL6ST, IL7R,
INHBA, IRF4, IR52, ITK, JAK1, JAK2, JAK3, JAZFl, JUN, KAT6A (MYST3), KAT6B,
KCNJ5, KDM5A, KDM5C, KDM6A, KDR, KDSR, KEAP1, KIAA1549, KIF5B, KIT, KLF4,
KLHL6, KLK2, KMT2A (MLL), KMT2C (MLL3), KMT2D (MLL2), KRAS, KTN1, LASP1,
LCK, LCP1, LGR5, LHFP, LIFR, LM01, LM02, LPP, LRIG3, LRP1B, LYL1, MAF, MAFB,
MALT1, MAML2, MAP2K1, MAP2K2, MAP2K4, MAP3K1, MAX, MCL1, MDM2, MDM4,
MDS2, MECOM, MED12, MEF2B, MEN1, MET, MITF, MKL1, MLF1, MLH1, MLLT1,
MLLT10, MLLT11, MLLT3, MLLT4, MLLT6, MN1, MNX1, MPL, MRE11A, MSH2, MSH6,
M5I2, MSN, MTCP1, MTOR, MUC1, MUTYH, MYB, MYC, MYCL (MYCL1), MYCN,
MYD88, MYH11, MYH9, NACA, NBN, NCKIPSD, NCOA1, NCOA2, NCOA4, NDRG1, NF1,
NF2, NFE2L2, NFIB, NFKB2, NFKBIA, NIN, NKX2-1, NONO, NOTCH1, NOTCH2, NPM1,
NR4A3, NRAS, NSD1, NT5C2, NTRK1, NTRK2, NTRK3, NUMA1, NUP214, NUP93,
33
CA 02999890 2018-03-23
WO 2017/053915 PCT/US2016/053614
NUP98, NUTM1, NUTM2B, OLIG2, OMD, P2RY8, PAFAH1B2, PAK3, PALB2, PATZ1,
PAX3, PAX5, PAX7, PAX8, PBRM1, PBX1, PCM1, PCSK7, PDCD1 (PD1), PDCD1LG2
(PDL2), PDE4DIP, PDGFB, PDGFRA, PDGFRB, PDK1, PERI, PHF6, PHOX2B, PICALM,
PIK3CA, PIK3CG, PIK3R1, PIK3R2, PIM1, PLAG1, PML, PMS1, PMS2, POLE, POT1,
POU2AF1, POU5F1, PPARG, PPP2R1A, PRCC, PRDM1, PRDM16, PRF1, PRKAR1A,
PRKDC, PRRX1, PSIP1, PTCH1, PTEN, PTPN11, PTPRC, RABEP1, RAC1, RAD21, RAD50,
RAD51, RAD51B, RAF1, RALGDS, RANBP17, RAP1GDS1, RARA, RB1, RBM15, RECQL4,
REL, RET, RHOH, RICTOR, RMI2, RNF213, RNF43, ROS1, RPL10, RPL22, RPL5, RPN1,
RPTOR, RUNX1, RUNx1T1, SBDS, SDC4, SDHAF2, SDHB, SDHC, SDHD, SEPT5, SEPT6,
SEPT9, SET, SETBP1, SETD2, SF3B1, SFPQ, 5H2B3, SH3GL1, 5LC34A2, SLC45A3,
SMAD2, SMAD4, SMARCA4, SMARCB1, SMARCE1, SMO, 5NX29, SOCS1, SOX10,
50X2, SPECC1, SPEN, SPOP, SRC, SRGAP3, SRSF2, SRSF3, SS18, 5518L1, SSX1,
STAG2,
STAT3, STAT4, STAT5B, STIL, STK11, SUFU, SUZ12, SYK, TAF15, TAL1, TAL2,
TBL1XR1, TCEA1, TCF12, TCF3, TCF7L2, TCL1A, TERT, TETI, TET2, TFE3, TFEB, TFG,
TFPT, TFRC, TGFBR2, THRAP3, TLX1, TLX3, TMPRSS2, TNFAIP3, TNFRSF14,
TNFRSF17, TOP1, TP53, TPM3, TPM4, TPR, TRAF7, TRIM26, TRIM27, TRIM33, TRIP11,
TRRAP, TSC1, TSC2, TSHR, TTL, U2AF1, UBR5, USP6, VEGFA, VEGFB, VHL, VTI1A,
WAS, WHSC1, WHSC1L1, WIF1, WISP3, WRN, WT1, WWTR1, XPA, XPC, XP01,
YWHAE, ZBTB16, ZMYM2, ZNF217, ZNF331, ZNF384, ZNF521, ZNF703, ZRSR2.
[0098] In still another embodiment, nucleic acid sequence analysis is used to
assess at least one
gene, e.g., at least 1, 2, 3, 4, 5, 6, 7, 8, 9, 10, 11, 12, 13, 14, 15, 16,
17, 18, 19, 20, 21, 22, 23, 24,
25, 26, 27, 28, 29, 30, 31, 32, 33, 34, 35, 36, 37, 38, 39, 40, 41, 42, 43,
44, 45, 46, 47, 48, 49, 50,
60, 70, 80, 90, 100, 110, 120, 130, 140, 150, 160, 170, 180, 190, 200, 250,
300, 350, 400, 450,
500, 550, 600, 650, 700, or all genes, selected from the group consisting of
5T4, ABIl, ABL1,
ABL2, ACKR3, ACSL3, ACSL6, ActRIIA, ACVR1B, ADGRA2, AFF1, AFF3, AFF4, AKAP9,
AKT1, AKT2, AKT3, ALDH2, ALK, AMER1, ANG1/ANGPT1/TM7SF2,
ANG2/ANGPT2NPS51, APC, AR, ARAF, ARFRP1, ARHGAP26, ARHGEF12, ARID1A,
ARID1B, ARID2, ARNT, ASPSCR1, ASXL1, ATF1, ATIC, ATM, ATP1A1, ATP2B3, ATR,
ATRX, AURKA, AURKB, AXIN1, AXL, BAP1, BARD1, BBC3, BCL10, BCL11A, BCL11B,
BCL2, BCL2L1, BCL2L11, BCL2L2, BCL3, BCL6, BCL7A, BCL9, BCOR, BCORL1, BCR,
BIRC3, BLM, BMPR1A, BR2, BRAF, BRCA1, BRCA2, BRD3, BRD4, BRIP1, BTG1, BTK,
BUB1B, c-KIT, Cllorf30, Cl5orf65, C2orf44, CACNA1D, CALR, CAMTA1, CANT1,
CARD11, CARS, CASC5, CASP8, CBFA2T3, CBFB, CBL, CBLB, CBLC, CCDC6,
CCNB lIP1, CCND1, CCND2, CCND3, CCNE1, CD110, CD123, CD137, CD137/4, CD19,
CD22, CD274, CD27L, CD38, CD4, CD74, CD79A, CD79B, CDC73, CDH1, CDH11, CDK12,
34
CA 02999890 2018-03-23
WO 2017/053915 PCT/US2016/053614
CDK4, CDK6, CDK7, CDK8, CDKN1A, CDKN1B, CDKN2A, CDKN2B, CDKN2C, CDX2,
CEBPA, CHCHD7, CHD2, CHD4, CHEK1, CHEK2, CHIC2, Chkl, CHN1, CIC, CIITA, CLP1,
CLTC, CLTCL1, CNBP, CNOT3, CNTRL, COL1A1, COPB1, CoREST, COX6C, CRAF,
CREB1, CREB3L1, CREB3L2, CREBBP, CRKL, CRLF2, CRTC1, CRTC3, CSF1R, CSF3R,
CTCF, CTLA4, CTNNA1, CTNNB1, CUL3, CXCR4, CYLD, CYP17A1, CYP2D6, DAXX,
DDB2, DDIT3, DDR1, DDR2, DDX10, DDX5, DDX6, DEK, DICER1, DLL-4, DM4, DNAPK,
DNM2, DNMT3A, DOT1L, DS6, EBF1, ECT2L, EGFR, EIF4A2, ELF4, ELK4, ELL, ELN,
EML4, EP300, EPHA3, EPHA5, EPHA7, EPHA8, EPHB1, EPHB2, EPS15, ERBB2, ERBB3,
ERBB4, ERC1, ERCC1, ERCC2, ERCC3, ERCC4, ERCC5, ERG, ERRFIl, ESR1, ETBR,
ETV1, ETV4, ETV5, ETV6, EWSR1, EXT1, EXT2, EZH2, EZR, FAK, FAM46C, FANCA,
FANCC, FANCD2, FANCE, FANCF, FANCG, FANCL, FAS, FAT1, FBX011, FBW7,
FCRL4, FEV, FGF, FGF10, FGF14, FGF19, FGF23, FGF3, FGF4, FGF6, FGFR1, FGFR1OP,
FGFR2, FGFR3, FGFR4, FH, FHIT, FIP1L1, FKBP12, FLCN, FLI1, FLT1, FLT3, FLT4,
FNBP1, FOXA1, FOXL2, FOX01, FOX03, FOX04, FOXP1, FRS2, FSTL3, FUBP1, FUS,
GABRA6, GAS7, GATA1, GATA2, GATA3, GATA4, GATA6, GCC, GID4, GITR, GLI1,
GMPS, GNAll, GNA13, GNAQ, GNAS, GNRH1, GOLGA5, GOPC, GPC3, GPHN, GRIN2A,
GRM3, GSK3B, H3F3A, H3F3B, HCK, HERPUD1, HEY1, HGF, HIP1, HIST1H3B,
HIST1H4I, HLF, HMGA1, HMGA2, HMGN2P46, HMT, HNF1A, HNRNPA2B1, HOOK3,
HOXA11, HOXA13, HOXA9, HOXC11, HOXC13, HOXD11, HOXD13, HRAS, HSD3B1,
HSP9OAA1, HSP90AB1, IAP, IDH1, IDH2, IGF1R, IGF2, IKBKE, IKZFl, IL2, IL21R,
IL6,
IL6ST, IL7R, INHBA, INPP4B, IRF2, IRF4, IRK, ITGAV, ITGB1, ITK, JAK1, JAK2,
JAK3,
JAZFl, JUN, KAT6A, KAT6B, KCNJ5, KDM5A, KDM5C, KDM6A, KDR, KDSR, KEAP1,
KEL, KIAA1549, KIF5B, KIR3DL1, KLF4, KLHL6, KLK2, KMT2A, KMT2A (MLL),
KMT2C, KMT2C (MLL3), KMT2D, KMT2D (MLL2), KRAS, KTN1, LASP1, LCK, LCP1,
LGR5, LHFP, LIFR, LM01, LM02, LOXL2, LPP, LRIG3, LRP1B, LSD1, LYL1, LYN,
LZTR1, MAF, MAFB, MAGI2, MALT1, MAML2, MAP2K1, MAP2K2, MAP2K4, MAP3K1,
MAPK1, MAPK11, MAX, MCL1, MDM2, MDM4, MDS2, MECOM, MED12, MEF2B,
MEK1, MEK2, MEN1, MET, MITF, MKL1, MLF1, MLH1, MLLT1, MLLT10, MLLT11,
MLLT3, MLLT4, MLLT6, MMP9, MN1, MNX1, MPL, MPS1, MRE11A, MS4A1, MSH2,
MSH6, M5I2, MSN, MST1R, MTCP1, MTOR, MUC1, MUC16, MUTYH, MYB, MYC,
MYCL, MYCN, MYD88, MYH11, MYH9, NACA, NAE1, NBN, NCKIPSD, NCOA1, NCOA2,
NCOA4, NDRG1, NF1, NF2, NFE2L2, NFIB, NFKB2, NFKBIA, NIN, NKX2-1, NONO,
NOTCH1, NOTCH2, NOTCH3, NPM1, NR4A3, NRAS, NSD1, NT5C2, NTRK1, NTRK2,
NTRK3, NUMA1, NUP214, NUP93, NUP98, NUTM1, NUTM2B, OLIG2, OMD, P2RY8,
PAFAH1B2, PAK3, PALB2, PARK2, PARP1, PATZ1, PAX3, PAX5, PAX7, PAX8, PBRM1,
CA 02999890 2018-03-23
WO 2017/053915 PCT/US2016/053614
PBX1, PCM1, PCSK7, PDCD1, PDCD1LG2, PDE4DIP, PDGFB, PDGFRA, PDGFRB, PDK1,
PERI, PHF6, PHOX2B, PICALM, PIK3C2B, PIK3CA, PIK3CB, PIK3CD, PIK3CG, PIK3R1,
PIK3R2, PIM1, PKC, PLAG1, PLCG2, PML, PMS1, PMS2, POLD1, POLE, POT1, POU2AF1,
POU5F1, PPARG, PPP2R1A, PRCC, PRDM1, PRDM16, PREX2, PRF1, PRKAR1A, PRKCI,
PRKDC, PRLR, PRRX1, PRSS8, PSIP1, PTCH1, PTEFb, PTEN, PTK2, PTPN11, PTPRC,
PTPRD, QKI, RABEP1, RAC1, RAD21, RAD50, RAD51, RAD51B, RAF1, RALGDS,
RANBP17, RANBP2, RANKL, RAP1GDS1, RARA, RB1, RBM10, RBM15, RECQL4, REL,
RET, RHOH, RICTOR, RMI2, RNF213, RNF43, ROS1, RPL10, RPL22, RPL5, RPN1,
RPS6KB1, RPTOR, RUNX1, RUNx1T1, SBDS, SDC4, SDHA, SDHAF2, SDHB, SDHC,
SDHD, SEPT5, SEPT6, SEPT9, SET, SETBP1, SETD2, SF3B1, SFPQ, 5H2B3, SH3GL1,
SLAMF7, 5LC34A2, SLC45A3, SLIT2, SMAD2, SMAD3, SMAD4, SMARCA4, SMARCB1,
SMARCE1, SMO, SNCAIP, 5NX29, SOCS1, SOX10, 50X2, 50X9, SPECC1, SPEN, SPOP,
SPTA1, SRC, SRGAP3, SRSF2, SRSF3, SS18, 5518L1, SSX1, 55X2, 55X4, STAG2,
STAT3,
STAT4, STAT5B, STEAP1, STIL, STK11, SUFU, SUZ12, SYK, TAF1, TAF15, TAL1, TAL2,
TBL1XR1, TBX3, TCEA1, TCF12, TCF3, TCF7L2, TCL1A, TERC, TERT, TETI, TET2,
TFE3, TFEB, TFG, TFPT, TFRC, TGFB1, TGFBR2, THRAP3, TIE2, TLX1, TLX3, TMPRSS2,
TNFAIP3, TNFRSF14, TNFRSF17, TOP1, TOP2A, TORK, TP53, TPM3, TPM4, TPR, TRAF7,
TRIM26, TRIM27, TRIM33, TRIP11, TRRAP, TSC1, TSC2, TSHR, TTL, U2AF1, UAE,
UBR5, USP6, VEGFA, VEGFB, VEGFR, VHL, VTI1A, WAS, WEE1, WHSC1, WHSC1L1,
WIF1, WISP3, WNT, WRN, WT1, WWTR1, XPA, XPC, XP01, YWHAE, ZAK, ZBTB16,
ZBTB2, ZMYM2, ZNF217, ZNF331, ZNF384, ZNF521, ZNF703, and ZRSR2.
[0099] In an embodiment, nucleic acid sequence analysis is used to assess a
copy number
variation in at least 1, 2, 3, 4, 5, 6, 7, 8, 9, 10, 11, 12, 13, 14, 15, 16,
17, 18, 19, 20, 21, 22, 23,
24, 25, 26, 27, 28, 29, 30, 31, 32, 33, 34, 35, 36, 37, 38, 39, 40, 41, 42,
43, 44, 45, 46, 47, 48, 49,
50, 60, 70, 80, 90, or all of ABL1, AKT1, AKT2, ALK, ANG1/ANGPT1/TM7SF2,
ANG2/ANGPT2NPS51, APC, ARAF, ARID1A, ATM, AURKA, AURKB, BBC3, BCL2,
BIRC3, BRAF, BRCA1, BRCA2, CCND1, CCND3, CCNE1, CDK4, CDK6, CDK8, CDKN2A,
CHEK1, CHEK2, CREBBP, CRKL, CSF1R, CTLA4, CTNNB1, DDR2, EGFR, EP300, ERBB3,
ERBB4, EZH2, FBW7, FGF10, FGF3, FGF4, FGFR1, FGFR2, FGFR3, FLT3, GATA3,
GNAll, GNAQ, GNAS, HNF1A, HRAS, IDH1, IDH2, JAK2, JAK3, KRAS, MCL1, MDM2,
MLH1, MPL, MYC, NF1, NF2, NFKBIA, NOTCH1, NPM1, NRAS, NTRK1, PAX3, PAX5,
PAX7, PAX8, PDGFRA, PDGFRB, PIK3CA, PTCH1, PTEN, PTPN11, RAF1, RB1, RET,
RICTOR, ROS1, SMAD4, SRC, TOP1, TOP2A, TP53, VHL, and WT1.
[00100] In a further embodiment, nucleic acid sequence analysis is used to
detect a gene
fusion in at least 1, 2, 3, 4, 5, 6, 7, 8, 9, 10, 11, 12, 13, 14, 15, 16, 17,
18, 19, 20, 21, 22, 23, 24,
36
CA 02999890 2018-03-23
WO 2017/053915 PCT/US2016/053614
25, 26, 27, 28 or 29 of ALK, AR, BCR, BRAF, ETV1, ETV4, ETV5, ETV6, EWSR1,
FGFR1,
FGFR2, FGFR3, FUS, MYB, NFIB, NR4A3, NTRK1, NTRK2, NTRK3, PDGFRA, RAF1,
RARA, RET, ROS1, SSX1, SSX2, SSX4, TFE3, and TMPRSS2. In a related embodiment,
nucleic acid sequence analysis is used to detect a gene fusion in at least 1,
2, 3, 4, 5, 6, 7, 8, 9, 10,
11, 12, 13, 14, 15, 16, 17, 18, 19, 20, 21, 22, 23, 24, 25, 26, 27, 28, 29,
30, 31, 32, 33, 34, 35, 36,
37, 38, 39 or 40 of AKT3, ALK, ARHGAP26, AXL, BRAF, BRD3/4, EGFR, ERG, ESR1,
ETV1/4/5/6, EWSR1, FGFR1/2/3, FGR, INSR, MAML2, MAST1/2, MET, MSMB, MUSK,
MYB, NOTCH1/2, NRG1, NTRK1/2/3, NUMBL, NUTM1, PDGFRA/B, PIK3CA, PKN1,
PPARG, PRKCA/B, RAF1, RELA, RET, ROS1, RSP02/3, TERT, TFE3, TFEB, THADA and
TMPRSS2.
[00101] The biological sample may be assessed using techniques which
include, but are
not limited to, IHC analysis, gene expression analysis, ISH analysis, and/or
sequencing analysis
(such as by PCR, RT-PCR, pyrosequencing, HTS, NGS) for at least one of the
following:
ABCC1, ABCG2, ACE2, ADA, ADH1C, ADH4, AGT, AR, AREG, ASNS, BCL2, BCRP,
BDCA1, beta III tubulin, BIRC5, B-RAF, BRCA1, BRCA2, CA2, caveolin, CD20,
CD25,
CD33, CD52, CDA, CDKN2A, CDKN1A, CDKN1B, CDK2, CDW52, CES2, CK 14, CK 17,
CK 5/6, c-KIT, c-Met, c-Myc, COX-2, Cyclin D1, DCK, DHFR, DNMT1, DNMT3A,
DNMT3B, E-Cadherin, ECGF1, EGFR, EML4-ALK fusion, EPHA2, Epiregulin, ER,
ERBR2,
ERCC1, ERCC3, EREG, ESR1, FLT1, folate receptor, FOLR1, FOLR2, FSHB, FSHPRH1,
FSHR, FYN, GART, GNAll, GNAQ, GNRH1, GNRHR1, GSTP1, HCK, HDAC1, hENT-1,
Her2/Neu, HGF, HIF1A, HIG1, HSP90, HSP9OAA1, HSPCA, IGF-1R, IGFRBP, IGFRBP3,
IGFRBP4, IGFRBP5, IL13RA1, IL2RA, KDR, Ki67, KIT, K-RAS, LCK, LTB, Lymphotoxin
Beta Receptor, LYN, MET, MGMT, MLH1, MMR, MRP1, MS4A1, MSH2, MSH5, Myc,
NFKB1, NFKB2, NFKBIA, NRAS, ODC1, OGFR, p16, p21, p27, p53, p95, PARP-1,
PDGFC,
PDGFR, PDGFRA, PDGFRB, PGP, PGR, PI3K, POLA, POLA1, PPARG, PPARGC1, PR,
PTEN, PTGS2, PTPN12, RAF1, RARA, ROS1, RRM1, RRM2, RRM2B, RXRB, RXRG, 5IK2,
SPARC, SRC, SSTR1, SSTR2, SSTR3, SSTR4, SSTR5, Survivin, TK1, TLE3, TNF, TOP1,
TOP2A, TOP2B, TS, TUBB3, TXN, TXNRD1, TYMS, VDR, VEGF, VEGFA, VEGFC, VHL,
YES1, and ZAP70.
[00102] Exemplary biomarker-drug association rules include without
limitation:
performing IHC on PD1 to determine likely benefit or lack of benefit from a PD-
1 modulating
therapy, PD-1 inhibitor, anti-PD-1 immunotherapy, anti-PD-1 monoclonal
antibody, nivolumab,
pidilizumab (CT-011, CureTech, LTD), pembrolizumab (lambrolizumab, MK-3475,
Merck), a
PD-1 antagonist, a PD-1 ligand soluble construct, and/or AMP-224 (Amplimmune);
performing
IHC on PD-L1 to determine likely benefit or lack of benefit from a PD-L1
modulating therapy,
37
CA 02999890 2018-03-23
WO 2017/053915 PCT/US2016/053614
PD-L1 inhibitor, anti-PD-Ll immunotherapy, anti-PD-Ll monoclonal antibody, BMS-
936559,
MPDL3280A/RG7446, and/or 1V1EDI4736 (MedImmune); performing IHC on RRM1 to
determine likely benefit or lack of benefit from an antimetabolite and/or
gemcitabine; performing
IHC on TS to determine likely benefit or lack of benefit from a
antimetabolite, fluorouracil,
capecitabine, and/or pemetrexed; performing IHC on TOP01 to determine likely
benefit or lack
of benefit from a TOP01 inhibitor, irinotecan and/or topotecan; performing at
least one of IHC
on MGMT, pyrosequencing for MGMT promoter methylation, and sequencing on IDH1
to
determine likely benefit or lack of benefit from an alkylating agent,
temozolomide, and/or
dacarbazine; performing IHC on AR to determine likely benefit or lack of
benefit from an anti-
androgen, bicalutamide, flutamide, abiraterone and/or enzalutamide; performing
IHC on ER to
determine likely benefit or lack of benefit from a hormonal agent, tamoxifen,
fulvestrant,
letrozole, and/or anastrozole; performing IHC on at least one of ER, PR and AR
to determine
likely benefit or lack of benefit from a hormonal agent, tamoxifen,
toremifene, fulvestrant,
letrozole, anastrozole, exemestane, megestrol acetate, leuprolide, goserelin,
bicalutamide,
flutamide, abiraterone, enzalutamide, triptorelin, abarelix, and/or degarelix;
performing at least
one of IHC on HER2 and ISH on HER2 to determine likely benefit or lack of
benefit from a
tyrosine kinase inhibitor and/or lapatinib, pertuzumab, and/or ado-trastuzumab
emtansine (T-
DM1); performing at least one of IHC on HER2, ISH on HER2, IHC on PTEN and
sequencing
on PIK3CA to determine likely benefit or lack of benefit from HER2 targeted
therapy, and/or
trastuzumab; performing at least one of ISH on TOP2A, ISH on HER2, IHC on
TOP2A and IHC
on PGP to determine likely benefit or lack of benefit from an anthracycline,
doxorubicin,
liposomal-doxorubicin, and/or epirubicin; performing sequencing on at least
one of cKIT and
PDGFRA to determine likely benefit or lack of benefit from a tyrosine kinase
inhibitor and/or
imatinib; performing at least one of ISH on ALK and ISH on ROS1 to determine
likely benefit or
lack of benefit from a tyrosine kinase inhibitor and/or crizotinib; performing
at least one of IHC
on ER or sequencing on PIK3CA to determine likely benefit or lack of benefit
from an mTOR
inhibitor, everolimus, and/or temsirolimus; performing sequencing on RET to
determine likely
benefit or lack of benefit from a tyrosine kinase inhibitor, and/or
vandetanib; performing IHC on
at least one of TLE3, TUBB3 and PGP to determine likely benefit or lack of
benefit from a
taxane, paclitaxel, and/or docetaxel; performing IHC on SPARC to determine
likely benefit or
lack of benefit from a taxane, and/or nab-paclitaxel; performing at least one
of PCR and
sequencing on BRAF to determine likely benefit or lack of benefit from a
tyrosine kinase
inhibitor, vemurafenib, dabrafenib, and/or trametinib; performing at least one
of sequencing on
KRAS, sequencing on BRAF, sequencing on NRAS, sequencing on PIK3CA and IHC on
PTEN
to determine likely benefit or lack of benefit from an EGFR-targeted antibody,
cetuximab, and/or
38
CA 02999890 2018-03-23
WO 2017/053915 PCT/US2016/053614
panitumumab; performing sequencing on EGFR to determine likely benefit or lack
of benefit
from an EGFR-targeted antibody, and/or cetuximab; performing at least one of
sequencing on
EGFR, sequencing on KRAS, ISH on cMET, sequencing on PIK3CA and IHC on PTEN to
determine likely benefit or lack of benefit from a tyrosine kinase inhibitor,
erlotinib, and/or
gefitinib; performing sequencing on EGFR to determine likely benefit or lack
of benefit from a
tyrosine kinase inhibitor, and/or afatinib; performing sequencing on cKIT to
determine likely
benefit or lack of benefit from a tyrosine kinase inhibitor, and/or sunitinib;
performing
sequencing on at least one of BRCA1, BRCA2 and/or IHC on ERCC1 to determine
likely benefit
or lack of benefit from carboplatin, cisplatin, and/or oxaliplatin; performing
ISH on ALK to
determine likely benefit or lack of benefit from ceritinib; and performing ISH
to detect 1p19q
codeletion to determine likely benefit or lack of benefit from procarbazine,
lomustine, and/or
vincristine (PCV).
[00103] Additional biomarkers of interest, descriptions thereof, and rules
associating the
states of various biomarkers to predicted therapeutic/drug efficacies can be
found in US Patent
Publications US20100113299, published May 6, 2010; U520140222443, published
August 7,
2014; U520150307947, published October 29, 2015; U520160186266, published June
30, 2016;
and U520150024952, published January 22, 2015; US Patent Nos. 8,700,335,
issued April 15,
2014 and 8,768,629, issued July 1, 2014; and Int'l Patent Publications
W02015116868,
published August 6, 2015, and W02016141169, published September 9, 2016; each
of which
patent publications is incorporated herein by reference in its entirety.
[00104] The methods, systems, apparatus and/or computer program of the
invention can be
used to analyze biological data in any relevant setting. The setting can be
related to a disease,
such as a neoplastic/proliferative disease, neurological disease, autoimmune
disease,
cardiovascular disease, or infectious disease. In a preferred embodiment, the
disease comprises a
cancer, such as an acute myeloid leukemia (AML), breast carcinoma,
cholangiocarcinoma,
colorectal adenocarcinoma, extrahepatic bile duct adenocarcinoma, female
genital tract
malignancy, gastric adenocarcinoma, gastroesophageal adenocarcinoma,
gastrointestinal stromal
tumor (GIST), glioblastoma, head and neck squamous carcinoma, leukemia, liver
hepatocellular
carcinoma, low grade glioma, lung bronchioloalveolar carcinoma (BAC), non-
small cell lung
cancer (NSCLC), small cell lung cancer (SCLC), lymphoma, male genital tract
malignancy,
malignant solitary fibrous tumor of the pleura (MSFT), melanoma, multiple
myeloma,
neuroendocrine tumor, nodal diffuse large B-cell lymphoma, non epithelial
ovarian cancer (non-
EOC), ovarian surface epithelial carcinoma, pancreatic adenocarcinoma,
pituitary carcinomas,
oligodendroglioma, prostatic adenocarcinoma, retroperitoneal or peritoneal
carcinoma,
retroperitoneal or peritoneal sarcoma, small intestinal malignancy, soft
tissue tumor, thymic
39
CA 02999890 2018-03-23
WO 2017/053915 PCT/US2016/053614
carcinoma, thyroid carcinoma, or uveal melanoma. The cancer may be an acute
lymphoblastic
leukemia; acute myeloid leukemia; adrenocortical carcinoma; AIDS-related
cancer; AIDS-related
lymphoma; anal cancer; appendix cancer; astrocytomas; atypical
teratoid/rhabdoid tumor; basal
cell carcinoma; bladder cancer; brain stem glioma; brain tumor, brain stem
glioma, central
nervous system atypical teratoid/rhabdoid tumor, central nervous system
embryonal tumors,
astrocytomas, craniopharyngioma, ependymoblastoma, ependymoma,
medulloblastoma,
medulloepithelioma, pineal parenchymal tumors of intermediate differentiation,
supratentorial
primitive neuroectodermal tumors and pineoblastoma; breast cancer; bronchial
tumors; Burkitt
lymphoma; cancer of unknown primary site (CUP); carcinoid tumor; carcinoma of
unknown
primary site; central nervous system atypical teratoid/rhabdoid tumor; central
nervous system
embryonal tumors; cervical cancer; childhood cancers; chordoma; chronic
lymphocytic
leukemia; chronic myelogenous leukemia; chronic myeloproliferative disorders;
colon cancer;
colorectal cancer; craniopharyngioma; cutaneous T-cell lymphoma; endocrine
pancreas islet cell
tumors; endometrial cancer; ependymoblastoma; ependymoma; esophageal cancer;
esthesioneuroblastoma; Ewing sarcoma; extracranial germ cell tumor;
extragonadal germ cell
tumor; extrahepatic bile duct cancer; gallbladder cancer; gastric (stomach)
cancer;
gastrointestinal carcinoid tumor; gastrointestinal stromal cell tumor;
gastrointestinal stromal
tumor (GIST); gestational trophoblastic tumor; glioma; hairy cell leukemia;
head and neck
cancer; heart cancer; Hodgkin lymphoma; hypopharyngeal cancer; intraocular
melanoma; islet
cell tumors; Kaposi sarcoma; kidney cancer; Langerhans cell histiocytosis;
laryngeal cancer; lip
cancer; liver cancer; malignant fibrous histiocytoma bone cancer;
medulloblastoma;
medulloepithelioma; melanoma; Merkel cell carcinoma; Merkel cell skin
carcinoma;
mesothelioma; metastatic squamous neck cancer with occult primary; mouth
cancer; multiple
endocrine neoplasia syndromes; multiple myeloma; multiple myeloma/plasma cell
neoplasm;
mycosis fungoides; myelodysplastic syndromes; myeloproliferative neoplasms;
nasal cavity
cancer; nasopharyngeal cancer; neuroblastoma; Non-Hodgkin lymphoma;
nonmelanoma skin
cancer; non-small cell lung cancer; oral cancer; oral cavity cancer;
oropharyngeal cancer;
osteosarcoma; other brain and spinal cord tumors; ovarian cancer; ovarian
epithelial cancer;
ovarian germ cell tumor; ovarian low malignant potential tumor; pancreatic
cancer;
papillomatosis; paranasal sinus cancer; parathyroid cancer; pelvic cancer;
penile cancer;
pharyngeal cancer; pineal parenchymal tumors of intermediate differentiation;
pineoblastoma;
pituitary tumor; plasma cell neoplasm/multiple myeloma; pleuropulmonary
blastoma; primary
central nervous system (CNS) lymphoma; primary hepatocellular liver cancer;
prostate cancer;
rectal cancer; renal cancer; renal cell (kidney) cancer; renal cell cancer;
respiratory tract cancer;
retinoblastoma; rhabdomyosarcoma; salivary gland cancer; Sezary syndrome;
small cell lung
CA 02999890 2018-03-23
WO 2017/053915 PCT/US2016/053614
cancer; small intestine cancer; soft tissue sarcoma; squamous cell carcinoma;
squamous neck
cancer; stomach (gastric) cancer; supratentorial primitive neuroectodermal
tumors; T-cell
lymphoma; testicular cancer; throat cancer; thymic carcinoma; thymoma; thyroid
cancer;
transitional cell cancer; transitional cell cancer of the renal pelvis and
ureter; trophoblastic tumor;
ureter cancer; urethral cancer; uterine cancer; uterine sarcoma; vaginal
cancer; vulvar cancer;
Waldenstrom macroglobulinemia; or Wilm's tumor.
[00105] Another example relationship the apparatus and/or database may be
configured to
determine includes a relationship between a particular therapeutic regime and
a biological sample
that has been processed so as to indicate the presence of a particular
biomarker. Accordingly, the
method 300 may include performing a therapeutic regime analysis to determine a
relationship
status for the relationship between a therapeutic regime and at least one of
the patient status and
the marker status, 306. In this regard, the apparatus and/or database may be
configured to
determine a positive interrelationship status between a particular therapeutic
regime and a
positive marker status (i.e., a particular therapeutic regime is shown to be
statistically more
effective for a particular condition and/or disease in response to determining
that a particular
biomarker is detected in a patient's biological sample). The apparatus and/or
database may
include computer-readable program code that includes instructions for
comparing a particular
therapeutic regime with a marker status and/or patient status. Accordingly,
the apparatus and/or
database may be configured to determine that patients having particular
attributes may respond
more positively or negatively to a particular therapeutic regime than those
patients that did not
possess the particular attribute. Likewise, the apparatus and/or database may
be configured to
determine that patients whose biological sample indicated the presence of a
particular marker
may respond more positively or negatively to a particular therapeutic regime
than those patients
whose biological sample indicated the particular marker was absent. The
presence of a particular
marker may include an expression level, or presence of a particular mutation
or other
characteristic of interest.
[00106] Additionally, the method 300 may include displaying at least one
graphical user
interface on a user interface (e.g., user interface 110, FIG. 1) in
communication with the
computing device, that includes a plurality of graphical user interface
objects, 308, wherein each
GUI object may be associated with any one of the patient data, the
relationship, and/or
relationship status, and wherein at least one GUI object includes an indicium
corresponding to at
least one of the patient data, the relationship, and/or relationship status,
wherein at least one GUI
object is associated with a target patient and includes indicia corresponding
to any one of the
patient data, the relationship, and/or relationship status of the target
patient. For example, the
apparatus may be configured to display a GUI on a monitor that includes a
plurality of GUI
41
CA 02999890 2018-03-23
WO 2017/053915 PCT/US2016/053614
objects. In some embodiments, the GUI may include a plurality of differing
views that provide
visualization for analyzing biological data. For example, the GUI may include
a reference data
view as shown in FIG. 4A and 4B, a cohort view as shown in FIGS. 4C and 4D, a
waterfall plot
as shown in FIGS. 4E through 4H, a matrix view as shown in FIGS. 41 and 4J, a
volcano plot for
a specific drug as shown in FIG. 4K, a volcano plot for a specific biomarker
as shown in FIG.
4L, a demography table as shown in FIG. M, a view of a sunburst plot for the
plurality of
biomarkers as shown in FIGS. 4N and FIG. 40, a view of a sunburst plot for the
plurality of
drugs as shown in FIGS. 4P and 4Q, and a patient view as shown in FIG. 4R. One
of ordinary
skill in the art may appreciate that these various GUIs displayed are merely
exemplary and that
other suitable GUIs for analyzing the biological sample are encompassed within
the disclosure
herein.
[00107] According to some embodiments, the method 300 may include
displaying at least
one GUI that includes a first GUI object configured to cause the display of a
second GUI object
upon the selection thereof. In some embodiments, the first GUI object may
include information
corresponding to patient data and the second GUI object may include
information corresponding
to patient data that is not ascertainable from the first GUI object. That is,
the first GUI object may
provide information corresponding to the patient data at a higher level, while
the second GUI
object may provide additional details corresponding to information presented
by the first GUI
object that is not presented by the first GUI object. For example, as shown in
FIG. 4A, a GUI
400A may include a first GUI object 402A and a second GUI object 404A. In this
regard, FIG.
4A illustrates a GUI where the first GUI object 402A has been selected thereby
causing the
display of the second GUI object 404A. The first GUI object 402A includes
information of the
various conditions and/or diseases of patients included in the reference data.
Upon selection of a
portion of the first GUI object 402A (i.e., the region of the pie chart
associated with Breast
Carcinoma), the apparatus may cause the GUI to display a second GUI object
404A (i.e., a
Kaplan Meier Plot corresponding to Breast Carcinoma cases). Accordingly, the
second GUI
object 404A provides information, indicia, and/or the like not previously
ascertainable from the
display of the first GUI object 402A.
[00108] In some additional embodiments, the method 300 may include an
additional step
comprising assisting in providing patient care based on the one or more
interrelationships
displayed on the user interface. For example, assisting in providing the
patient care comprises
providing a diagnosis, providing a prognosis, selecting a recommended
therapeutic regime,
generating a hypothesis, and evaluating an efficiency of the therapeutic
regime, based on the one
or more interrelationships. Accordingly, an apparatus and/or database may be
configured to
display a graphical user interface that provides for a visual comparison
between patient data
42
CA 02999890 2018-03-23
WO 2017/053915 PCT/US2016/053614
corresponding to a biological sampling event(s), a biological processing
event(s), therapeutic
regime(s), marker status(es), and/or patient status(es) of a target patient
and reference data
corresponding to any one of the biological sampling event(s), biological
processing event(s),
therapeutic regime(s), marker status(es), and/or patient status(es) for the
plurality of patients
included in the reference data. As such, a clinician may manipulate the
graphical user interface
and the various GUI objects displayed thereby to visually compare a particular
target patient
against a set of reference patients based on shared patient attributes,
therapy regime(s), marker
status(s), and/or the like so as to increase the likelihood of a positive
outcome and/or patient
status. When so doing, the target patient data may not appear in the same GUI
object as the
reference patients. For example, the clinician may have a molecular profiling
report for the target
patient and compare results in the report against reference patients with
desired attributes
displayed in the various GUI objects.
[00109] In this regard, FIGS. 4A ¨ 4R illustrate exemplary graphical user
interfaces
according to various embodiments of the present disclosure. In particular, a
GUI 400 may include
a plurality of GUI objects 402. As shown in FIG. 4A, a GUI 400A may be
configured to display
information corresponding to reference data associated with at least a
biological sampling event,
a biological processing event, a therapeutic regime, a marker status, and/or a
patient status. For
example, the GUI 400A may include a first GUI object 402A (i.e., a pie chart
illustrating the
breakdown of the conditions and/or diseases of the patients included in the
reference data).
Additionally, the GUI 400A may include a second GUI object 404A that may be
displayed upon
detecting a selection of a portion of the first GUI object 402A. For example,
a user may select a
portion of the first GUI object 402A (e.g., the portion of the pie chart
corresponding to the
patients having breast carcinoma) that may cause an apparatus to display the
second GUI object
404A (e.g., a pop-up overlay displaying a Kaplan Meier plot of those patients
having breast
carcinoma) within the graphical user interface 400.
[00110] FIG. 4B illustrates a zoomed view of the second or secondary GUI
object 404A in
FIG. 4A. As previously mentioned, the second GUI object 404A comprises a
Kaplan Meier plot
that includes a plurality of indicia that correspond to patient data
associated with a particular
patient. In some embodiments, the plurality of indicia includes various
demarcations and/or
regions having differing colors, patterns, shapes, and/or the like that
correspond with patient data
associated with at least a biological sampling event, a biological processing
event, at least one
therapeutic regime, a marker status, and/or at least one patient status. For
example, as shown in
FIG. 4B, the second GUI object 404A illustrates a survival analysis (i.e., a
determination of
percent survival over a period of time) performed for a particular condition
and / or disease
lineage using patient data identifying matched patients and unmatched
patients. In some
43
CA 02999890 2018-03-23
WO 2017/053915 PCT/US2016/053614
embodiments, matched patient data includes patients who received one or more
therapeutic
regime that provides a benefit in treating a condition and / or disease and
unmatched patient data
includes patients who received one or more therapeutic regime that provides a
potential lack of
benefit in treating the condition and / or disease. As illustrated in
reference to FIGS. 4A-4B, the
condition and / or disease lineage comprises breast carcinoma.
[00111] FIG. 4C illustrates another GUI 400B that includes a first or
primary GUI object
402B, a secondary GUI object 404B, a tertiary GUI object 406B, and a
quaternary GUI object
408B. The GUI 400B, in some embodiments, comprises a waterfall plot over which
the plurality
of GUI objects 402B, 404B, 406B, 408B may be overlaid. Although the GUI 400B
illustrated in
FIG. 4C illustrates a plurality of GUI objects 402B, 404B, 406B, 408B being
nested with respect
to one another to a fourth level, various embodiments may be configured to
provide for any
number of GUI objects that are nested, related, and/or ordered with respect to
one another to any
number of levels. As shown in FIG. 4C, each primary GUI object 402B (i.e.,
each vertical
column) corresponds to a particular patient and includes a plurality of
indicia that corresponds to
data associated with at least a biological sampling event, a biological
processing event, a
therapeutic regime, a marker status, and/or a patient status.
[00112] Upon detecting the selection of any one of the primary or first
GUI objects 402B,
an apparatus may be configured to display a secondary GUI object 404B that
includes an overlay
displaying information corresponding to the patient data. For example, the
secondary GUI object
404B includes data associated with a patient's case identification number, a
patient's gender, a
patient's age at diagnosis of the condition and/or disease, the condition
and/or disease afflicting
the patient, the severity of the condition and/or disease at the time of
diagnosis, the method in
which the biological sample from the patient was processed, and/or the
date/time when the
biological sample was processed. Additionally, the secondary GUI object 404B
may include
additional objects (i.e., hyperlinks) that, upon selection thereof, may cause
the apparatus to
display a tertiary GUI object 406B. For example, a tertiary GUI object 406B
may include indicia
that provides information corresponding to biomarker status(es) determined
during a processing
of the biological sample of the patient. In some example embodiments, each of
the indicia may
be user selectable and upon the selection of any one of the indicia included
in the tertiary GUI
object 406B, the apparatus may cause the GUI 400B to display a quaternary GUI
object 408B
(e.g., a Kaplan Meier plot illustrating the survivability of those patients
based on the selected
indicia corresponding to a particular biomarker).
[00113] FIG. 4D illustrates a zoomed view of the region A in FIG. 4C. As
previously
mentioned, each of the primary GUI objects 402B (i.e., each of the vertical
columns) in FIG. 4C
correspond with a particular patient. As shown in greater detail in FIG. 4D,
each of the primary
44
CA 02999890 2018-03-23
WO 2017/053915 PCT/US2016/053614
GUI objects 402B may include a plurality of indicia that corresponds with
patient data associated
with the particular patient. For example, the plurality of indicia may include
various
demarcations and/or regions having differing colors, patterns, shapes, and/or
the like that
correspond with patient data associated with at least a biological sampling
event, a biological
processing event, at least one therapeutic regime, a marker status, and/or at
least one patient
status. For example, as shown in FIG. 4D, the primary GUI object 402B may
include a biological
processing event indicia 410B that provides information corresponding to when
a biological
processing event occurred. In this regard, as shown in FIGS. 4C and 4D, each
of the primary GUI
objects 402B may be aligned with respect to one another based upon the
biological processing
event. That is, each of the primary GUI objects 402B are aligned with respect
to one another such
that the biological processing event indicia 410B of each of the primary GUI
objects are aligned.
[00114] The primary GUI object 402B may further include a biological
sampling event
indicia 412B indicating when the biological sample was obtained from the
particular patient. As
shown in FIG. 4D, a biological sampling event indicia 412B may be shown as a
blue line and/or
region within the primary GUI object 402B. Additionally, the primary GUI
object 402B may
include additional indicia corresponding to a therapeutic regime. For example,
each of the
therapeutic regime indicia 414B, 416B, 418B corresponds with a particular
therapeutic regime
administered to the patient. In some embodiments, the therapeutic regime
indicia 414B, 416B,
418B may be a region of the primary GUI object 402B that has a height
corresponding to the
length of time the therapeutic regime was administered. Further, each of the
therapeutic regime
indicia 414B, 416B, 418B may further provide a visual indication corresponding
to a relationship
status between the particular therapeutic regime and at least one marker
status. For example,
beneficial therapeutic regime indicia 414B may be a region of the primary GUI
object 402B
shaded in a green color, which may correspond with a positive relationship
(e.g., increased
efficacy and/or probabilities of positive outcomes) between the particular
therapeutic regime and
a particular biomarker present in the patient's biological sample.
Accordingly, a non-beneficial
therapeutic regime indicia 418B may be a region of the primary GUI object 402B
shaded in a red
color, which may correspond with a negative relationship (e.g., decreased
efficacy, lower
probabilities of positive outcomes, and/or the like) between the particular
therapeutic regime and
the particular biomarker present in the patient's biological sample. In
another embodiment, the
primary GUI object 402B may include an inconclusive therapeutic regime indicia
416B that is
shown in FIG. 4D as a yellow shaded region. The inconclusive therapeutic
regime indicia 416B
may indicate that a positive or negative relationship between the particular
therapeutic regime
and the particular biomarker present in the patient's biological sample has
not been established
by the apparatus.
CA 02999890 2018-03-23
WO 2017/053915 PCT/US2016/053614
[00115] Additionally, the primary GUI object 402B may include indicia of a
patient status.
For example, the primary GUI object 402B may include a treatment-free indicia
420B illustrating
a portion of time where no therapeutic regimes were administered to the
patient. In this regard,
the treatment-free indicia 420B may be portions of the primary GUI object 402B
shaded in a grey
color. Additionally or alternatively, an indicia of a patient status may
include a death indicia
422B, which may correspond to the point in time where the patient died. For
example, the death
indicia 422B may include a bolded black line at the top of the primary GUI
object 402B, which
indicates the point in time when the patient died. As such, a clinician may
visually compare
patient data corresponding to a target patient against reference data for the
plurality of patients by
causing the apparatus to display a GUI object that corresponds to the target
patient (i.e., causing
the apparatus to display an additional column that includes indicia
corresponding to patient data
associated with the target patient). Additionally or alternatively, the
apparatus may be configured
to perform a therapeutic regime analysis and display a comparison between the
target patient data
and the reference data by causing the display of an additional GUI object that
corresponds to the
target patient information.
[00116] FIG. 4E illustrates another example GUI 400C that includes a first
or primary GUI
object 402C, a secondary GUI object 404C, a tertiary GUI object 406C, and a
quaternary GUI
object 408C. The GUI 400C, in some embodiments, comprises each of the
plurality of GUI
objects 402C, 404C, 406C, and 408C sized to fit within the GUI 400C, rather
than being overlaid
(e.g., GUI 400B, FIG. 4C) with respect to each other. Although the GUI 400C
illustrates the
plurality of GUI objects 402C, 404C, 406C, and 408C being sized to fit within
the GUI 400C,
various embodiments of the GUI 400Care configurable to provide for any number
of GUI objects
to fit within the GUI 400C, as well as to be nested, related, and / or ordered
with respect to one
another and / or any number of levels.
[00117] As shown in FIG. 4E, the GUI 400C includes data from a specific
database. For
example, the patient data displayed in the GUI 400C comprises patient data
received from a
selected database, i.e., Registry vl 3. Such patient data may be mapped,
processed, and / or
stored in a manner to be described below in reference to FIG. 5. Additionally,
the GUI 400C is
configured to display the patient data that is filtered based on at least one
biomarker status, a
patient status, at least one therapeutic regime, a biological processing
event, and / or a biological
sampling event. As shown in FIG. 4E, a filter is applied to thereto so that
only patient data
associated with a specific condition and / or disease lineage (i.e., breast
carcinoma) is displayed.
[00118] In FIG. 4E, the primary GUI object 402C comprises a waterfall
plot, similar to
the waterfall plot displayed in the GUI 400B in FIG. 4C, where each vertical
column of the
waterfall plot corresponds to a particular patient and includes a plurality of
indicia that
46
CA 02999890 2018-03-23
WO 2017/053915 PCT/US2016/053614
corresponds to data associated with at least a biological sampling event, a
biological processing
event, a therapeutic regime, a marker status, and/or a patient status.
[00119] The patient data provided in the primary GUI object 402C is
configured to be
further analyzed using the secondary GUI object 404C. The secondary GUI object
404C
comprises a plurality of selectable indicia for further filtering of the
patient data provided in the
primary GUI object 402C. More particularly, the secondary GUI object 404C
provides a visual
display of the selectable indicia to allow a user to efficiently identify one
or more particular
patient or a patient cohort presenting the indicium(a) selected by the user.
For example, the
secondary GUI object 404C comprises a selection panel such as that illustrated
in greater detail
in FIG. 4F. Primary indicia 410C for selection may be displayed in the
secondary GUI object
404C. For example, the primary indicia 410C is individually selectable by the
clinician. Upon
selection of a primary indicium 410C, a drop down menu comprising a plurality
of secondary
indicia 412C associated with the selected primary indicium 410C is displayed.
For example, FIG.
4E illustrates a primary indicium 410C comprising a biomarker and secondary
indicia 412C
comprising one or more techniques for detecting a specific biomarker. In this
example, the one or
more techniques comprise fragment analysis, immunohistochemistry (IHC), in
situ hybridization
(ISH), and next-generation sequencing (NGS), as well as one or more specific
biomarker
detectable through each technique. Selection of the specific biomarker may
result in
manipulating the primary GUI object 402, as described below.
[00120] FIG. 4F illustrates a detailed view of the secondary GUI object
404C of FIG. 4E.
More particularly, a detailed listing of each of the primary indicium 410C and
their associated
secondary indicia 412C is illustrated. For example, a biomarker primary
indicium 410C in FIG.
4F comprises additional techniques including epidermal growth factor receptor
(EGFR) H-score,
06-methylguanine-methyltransferase (MGMT) methylation, rearrangement, and
sequencing.
FIG. 4F also illustrates additional primary indicium and associated secondary
indicium. For
example, additional primary indicium 410C comprises cohort data, patient
(clinical), biomarker
result(s), treatment data, and case data. Secondary indicia associated with
the cohort primary
indicium includes condition and /or disease lineage(s), and match or
unmatched. Secondary
indicia associated with the patient (clinical) primary indicium includes age,
sex, stage at
diagnosis, and histology. Secondary indicia associated with the biomarker
result primary
indicium includes status of biomarker result (e.g., positive, negative,
unknown, normal).
Secondary indicia associated with the treatment primary indicium includes
total drugs. Secondary
indicia associated with the case primary indicium includes case list (e.g., a
listing of de-identified
patients). As may be apparent to one of ordinary skill in the art, the example
primary indicium
47
CA 02999890 2018-03-23
WO 2017/053915 PCT/US2016/053614
410C and associated secondary indicia 412C described above are merely examples
and are in no
way limiting.
[00121] Exemplary indicia that can be used to filter the patient data
displayed in the GUI
objects are listed in Table 1. One of skill will appreciate that the filters
can be updated as
additional patient data having additional attributes is acquired.
Table 1: Filter indicia
Indicium Exemplary Values
Cancer Lineage Breast Carcinoma, Non-small cell lung cancer (NSCLC), Ovarian
Surface
Epithelial Carcinoma, Gastroesophageal Adenocarcinoma, Soft Tissue Tumors,
Cancer of Unknown Primary (CUP), Colorectal Adenocarcinoma,
Neuroendocrine tumors, Female Genital Tract Malignancy, Leiomyosarcoma,
Neuroblastoma, Pancreatic Adenocarcinoma, Lymphoma, Urinary Tract,
Melanoma, Head and neck Squamous Carcinoma, Liver Hepatocellular
Carcinoma, Cholangiocarcinoma, Lung Bronchioloalveolar carcinoma (BAC),
Major & Minor Salivary Glands, Adrenal cortical carcinoma, Prostatic
Adenocarcinoma, Glioblastoma, Non Epithelial Ovarian Cancer (non-EOC),
Anal Cancer, Epithelial Skin Cancer, Paraganglioma, Small Intestinal
Malignancies, Uveal Melanoma
Histology Infiltrating duct carcinoma (NOS), Adenocarcinoma (NOS), Serous
cystadenocarcinoma (NOS), Signet ring cell adenocarcinoma, Alveolar soft
part sarcoma, Carcinoma (NOS), Intestinal type adenocarcinoma,
Endometrioid adenocarcinoma (NOS), Papillary serous cystadenocarcinoma,
Small cell carcinoma (NOS), Clear cell adenocarcinoma (NOS), Squamous cell
carcinoma (NOS), Leiomyosarcoma (NOS), Mucinous adenocarcinoma,
Neuroblastoma (NOS), Ewing sarcoma, Undifferentiated carcinoma (NOS),
Mixed cell adenocarcinoma, Infiltrating ductular carcinoma, Non-small cell
carcinoma, Carcinosarcoma (NOS), Epithelioid sarcoma, Diffuse large B-cell
malignant lymphoma (NOS), Papillary transitional cell carcinoma, Amelanotic
melanoma, Papillary carcinoma (NOS), Transitional cell carcinoma (NOS),
Endocervical adenocarcinoma type, Mullerian mixed tumor, Desmoplastic
small round cell tumor, Adenocarcinoma with mixed subtypes, Neuroendocrine
carcinoma (NOS), Intraductal papillary adenocarcinoma with invasion, Serous
adenocarcinofibroma, Adenosquamous carcinoma, Hepatocellular carcinoma
(NOS), Large cell neuroendocrine carcinoma, Lobular carcinoma (NOS),
Papillary adenocarcinoma (NOS), Cholangiocarcinoma, Invasive intraductal
papillary-mucinous carcinoma, Keratinizing squamous cell carcinoma (NOS),
Renal cell carcinoma (NOS), Malignant melanoma (NOS), Sarcoma (NOS),
Mucinous bronchiolo-alveolar carcinoma, Tubular adenoma (NOS), Infiltrating
lobular carcinoma (NOS), Ductal carcinoma (NOS), Clear cell
adenocarcinofibroma, Mucinous cystadenocarcinoma (NOS), Large cell
carcinoma (NOS), Metaplastic carcinoma (NOS), Serous surface papillary
carcinoma, Papillary serous adenocarcinoma, Infiltrating duct adenocarcinoma,
Infiltrating duct and lobular carcinoma, Duct adenocarcinoma (NOS),
Collecting duct carcinoma, Adrenal cortical carcinoma, Spindle cell sarcoma,
48
CA 02999890 2018-03-23
WO 2017/053915 PCT/US2016/053614
Gliosarcoma, Poorly differentiated Sertoli-Leydig cell tumor, Infiltrating
lobular mixed with other types of carcinoma, Malignant teratoma (NOS),
Nodular melanoma, Myxoid leiomyosarcoma, Adenocarcinoma in
adenomatous polyp, Malignant mixed tumor (NOS), Mesodermal mixed tumor,
Pheochromocytoma, malignant, Spindle cell squamous cell carcinoma,
Papillary squamous cell carcinoma, Signet ring cell carcinoma, Glioblastoma
(NOS), Malignant epithelioid hemangioendothelioma, Serous adenocarcinoma
(NOS), Malignant chondroblastoma, Pleomorphic liposarcoma, Malignant
peripheral nerve sheath tumor, Myxoid liposarcoma, Adenosarcoma, Eccrine
adenocarcinoma, In situ infiltrating duct mixed with other types of carcinoma,
Medullary carcinoma (NOS), Malignant granulosa cell tumor, Osteosarcoma
(NOS), Malignant desmoplastic melanoma, Malignant fibrous histiocytoma,
Malignant neoplasm, Liposarcoma (NOS), Serous carcinoma (NOS), Primary
serous papillary carcinoma of peritoneum, Papillary urothelial carcinoma,
Clear cell carcinoma
Stage I, II, III, IV
Biomarkers EGFR H-score: EGFR
Fragment Analysis: ALK, microsatellite instability (MSI)
IHC: Androgen Receptor, BCRP, c-KIT, CAV-1, CK, CK14, CK17, cMET,
COX-2, Cyclin D1, ECAD, EGFR, ER, ERCC1, Her2, IGF1R, Ki67, MGMT,
MLH1, MRP1, MSH2, MSH6, p53, PD-1, PD-L1, PDGFR, PGP, PMS2, PR,
PTEN, RRM1, SPARC, TLE3, TOP2A, TOP01, TS, TUBB3
ISH: cMET, cMYC, EGFR, Her2, PIK3CA, TOP2A
Methylation: MGMT Promoter
Rearrangement: ALK (2p23), ROS1
Sequencing: ABL1, AKT1, ALK, APC, ATM, BRAF, BRCA1, BRCA2, c-
KIT, CDH1, cMET, CSF1R, CTNNB1, EGFR, ERBB2, ERBB4, FBXW7,
FGFR1, FGFR2, FLT3, GNAll, GNAQ, GNAS, HNF1A, HRAS, IDH1,
JAK2, JAK3, KDR, KRAS, MLH1, MPL, NOTCH1, NPM1, NRAS,
PDGFRA, PIK3CA, PTEN, PTPN11, RB1, RET, SMAD4, SMARCB1, SMO,
STK11, TP53, VHL
Drug carboplatin, cisplatin, cyclophosphamide, doxorubicin
hydrochloride,
fluorouracil, gemcitabine hydrochloride, methotrexate, patupilone, vinorelbine
tartrate, docetaxel, erlotinib hydrochloride, pemetrexed disodium, paclitaxel,
pegylated liposomal doxorubicin hydrochloride, topotecan hydrochloride,
epirubicin hydrochloride, trabectedin, bevacizumab, etoposide, irinotecan
hydrochloride, nab-paclitaxel, trastuzumab, letrozole, capecitabine,
leucovorin
calcium, oxaliplatin, cetuximab, floxuridine, panitumumab, tamoxifen citrate,
sorafenib tosylate, temozolomide, vincristine sulfate, ifosfamide, imatinib
mesylate, imc-a12, temsirolimus, anastrozole, lapatinib ditosylate,
investigational agent, prednisone, rituximab, everolimus, vinblastine sulfate,
paclitaxel poliglumex, goserelin acetate, octreotide acetate, exemestane,
fulvestrant, interferon, bortezomib, ziv-aflibercept, melphalan, cytarabine,
hydrocortisone sodium succinate, pazopanib hydrochloride, raloxifene,
investigational agent/placebo, 1-leucovorin, pralatrexate, megestrol acetate,
49
CA 02999890 2018-03-23
WO 2017/053915 PCT/US2016/053614
bibf1120, dactinomycin, eribulin mesylate, mitomycin c, dasatinib, sunitinib
malate, leuprolide acetate, bleomycin sulfate, mitoxantrone hydrochloride,
dacarbazine, crizotinib, afatinib dimaleate, thalidomide, ado-trastuzumab
emtansine, imiquimod, bicalutamide, ipilimumab, farletuzumab, abiraterone
acetate, dalantercept, chlorambucil, degarelix, axitinib, recombinant
interferon
alfa-2a, lambrolizumab, cabozantinib-s-malate, veliparib, pertuzumab,
regorafenib
Clinical Age/s, Sex, Patient ID
Treatment Matched, unmatched, mixed, indeterminate
Regimen
[00122] Referring back to FIG. 4E, the tertiary GUI object 406C includes a
matrix of
biomarkers and / or drugs associated with a particular patient displayed as a
vertical column in
the primary GUI object 402C (i.e., the waterfall plot). The tertiary GUI
object 406C in FIG. 4E
provides further indicia associated with each patient of the plurality of
patients. More
particularly, the tertiary GUI object 406C provides a distinct row associated
with the selections
made in the secondary GUI object 404C. Notably, manipulation of the secondary
GUI object
404C results in manipulation of the tertiary GUI object 406C, as well as the
primary GUI object
402C. For example, manipulating the secondary GUI object 404C includes
selecting or
deselecting, moving, adjusting, etc., indicia displayed in the GUI object. For
example, selecting a
secondary indicium 412C in the secondary GUI object 404C adds a corresponding
row to the
tertiary GUI object 406C, while unselecting a secondary indicium 412C in the
secondary GUI
object 404C removes the corresponding row from the tertiary GUI object 406C.
For example,
where a biomarker primary indicium 410C is selected and subsequent secondary
indicia 412C of
an Androgen Receptor, an Estrogen Receptor (ER), and a progesterone receptor
(PR) are selected
under the IHC technique, individual rows associated with each secondary
indicium 412C are
displayed in the tertiary GUI object 406C. In this example, the selection of
'N' or negative for
each secondary indicium 412C in the secondary GUI object 404C results in
visual indications in
each added row for patients, e.g., where a 'neg' or negative value exists for
each of the Androgen
Receptor, the ER, and PR (thereby selecting for a patient cohort of triple
negative breast cancer).
[00123] In some embodiments, patients exhibiting each of the secondary
indicium 412C
selected in the secondary GUI object 404C are grouped to one side of the
tertiary GUI object
406C. Likewise, the primary GUI object 402C is modified based on the selection
of primary and
/or secondary indicium 410C, 412C in the secondary GUI object 404C. More
particularly, the
patient data provided in the primary GUI object 402C that comprises the
indicia selected (i.e.,
'selected' patients) in the secondary GUI object 404C may be manipulated such
that this patient
data is moved toward one side of the primary GUI object 402C and those cases
that do not
CA 02999890 2018-03-23
WO 2017/053915 PCT/US2016/053614
comprise the indicia selected (i.e., `unselected' patients) in the secondary
GUI object 404C may
be manipulated such that this patient data is moved toward an opposite side of
the primary GUI
object 402C. For example and in reference to FIG. 4E, patients negative for
the Androgen
Receptor, ER, and PR (i.e., triple negative breast cancer) are all grouped to
the left side of the
GUI 400C in each of the primary GUI object 402C and the tertiary GUI object
406C, while
patients who are not negative for all three of the Androgen Receptor, ER, and
PR are all grouped
to the right side of the GUI 400C in each of the primary GUI object 402C and
the tertiary GUI
object 406C.
[00124] Quaternary GUI object 408C provides one or more graphical
comparisons of the
patient data illustrated in the primary GUI object 402C based on the primary
and secondary
indicia 410C, 412C selected in the secondary GUI object 404C. For example,
four Kaplan Meier
plots with a survival analysis are provided as the quaternary GUI object 408C.
The Kaplan Meier
plots from left to right illustrate: i) a survival analysis comparing all
patients who have been
matched versus all patients who are unmatched; ii) a survival analysis
comparing all selected
patients versus all unselected patients; iii) a survival analysis comparing
selected matched
patients versus selected unmatched patients; and iv) a survival analysis
comparing unselected
matched patients versus unselected unmatched patients. However, the apparatus
may be
configured to process or analyze the data and display Kaplan Meier plots for
indicia such as
patient information, specific biomarkers, etc, as desired.
[00125] In another example embodiment, as shown in FIG. 4G, the quaternary
GUI object
408C provides indicia associated with a specific patient selected in the
primary GUI object 402C.
For example, the quaternary GUI object 408C comprises graphical and visual
information in a
patient demographic GUI object 414C, a patient treatment history GUI object
416C, and a
specific biomarker GUI object 418C. The patient demographic GUI object 414C
comprises a
table with a plurality of indicia specific to the patient selected (i.e., the
vertical column selected)
in the primary GUI object 402C. Such indicia may include a de-identified
patient number,
gender, age, race, a primary tumor site, condition and / or disease lineage,
histology, followed
(i.e., matched or unmatched), etc. The treatment history GUI object 416C
comprises a graphical
representation of specific drugs or therapeutic regimes and a length of
treatment time for each
drug or therapeutic regime. The effectiveness of each specific drug or
therapeutic regime relative
to the particular biomarker present may be indicated by color, shading, etc.,
or any other manner
corresponding to the particular therapeutic regime and the particular
biomarker present in the
patient's biological sample displayed in the primary GUI object 402C.
[00126] The specific biomarker GUI object 418C comprises a list view of
the technique
used to assess the patient and the presence or absence of a specific biomarker
resulting from that
51
CA 02999890 2018-03-23
WO 2017/053915 PCT/US2016/053614
technique. The presence of a specific biomarker may be displayed differently
than the absence of
a specific biomarker. For example, the specific biomarker GUI object 418C
comprises two
different techniques, ISH and IHC. In this example, a Ribonucleotide Reductase
Catalytic
Subunit M1 (RRM1) was not detected (i.e., was absent) in the patient's
biological sample using
IHC. The RRM1 is, thus, colored in red in specific biomarker GUI object 418C.
Further to this
example, an Androgen Receptor was detected (i.e., was present) in the
patient's biological
sample using IHC. The Androgen Receptor is, thus, colored in green in the
specific biomarker
GUI object 418C.
[00127] In some embodiments, a quinary GUI object 420C is provided in the
GUI 400C.
The quinary GUI object 420C is, in some embodiments, nested or otherwise
displayed relative to
selection of indicia from the quaternary GUI object 408C. For example, as
illustrated in FIG. 4G,
the quaternary GUI object 420C is displayed upon selection of a specific
biomarker in the
specific biomarker GUI object 418C. Unlike the GUI objects 402C-408C, the
quinary GUI object
420C overlays the GUI 400C, rather than being sized to fit within; though, in
some embodiments,
the quinary GUI object 420C is sized to fit within the GUI 400C. The quinary
GUI object 420C
is configured to provide additional data regarding a specific biomarker. For
example, as
illustrated in FIG. 4G, the quinary GUI object 420C is configured to display
the biomarker name,
the technique, the status of the biomarker, and / or an image corresponding to
analysis of the
biomarker. In this case, the image comprises a stained IHC slide, and other
appropriate images
may be displayed for different analysis techniques (e.g., traces for Sanger
sequencing,
fluorescence microscopy images for FISH, etc). Further selection of the
quinary GUI object
420C results in providing a senary GUI object 422C including an image of the
specific biomarker
in greater detail in either overlay form or sized to fit within the GUI 400C.
[00128] In another example, as shown in FIG. 4H, the quaternary GUI object
408C
provides indicia associated with a specific biomarker selected in the
secondary GUI object 404C.
For example, the quaternary GUI object 408C comprises graphical and visual
information in a
biomarker behavior GUI object 424C, a survival analysis GUI object 426C, and a
statistic GUI
object 428C. The biomarker behavior GUI object 424C comprises a volcano plot
with an
indication of a specific biomarker's behavior in various condition and / or
disease lineages. For
example, where a PR biomarker is selected in the secondary GUI object 404C,
the behavior of
that biomarker in condition and / or disease lineages such as breast
carcinoma, ovarian surface
epithelial carcinoma, etc., is displayed. Selecting a certain condition and /
or disease lineage in
the biomarker behavior GUI object 424C results in displaying a quinary GUI
object 430C
including additional information corresponding to patient data. For example, a
Kaplan Meier plot
for that condition and / or disease lineage is displayed by the quinary GUI
object 430C. For
52
CA 02999890 2018-03-23
WO 2017/053915 PCT/US2016/053614
example, selection of the breast carcinoma lineage in the quaternary GUI
object 424C results in
displaying a survival analysis Kaplan Meier plot 430C that overlies portions
of the GUI objects
402C-408C.
[00129] The survival analysis GUI object 426C comprises a Kaplan Meier
plot for a
specific condition and / or disease lineage (e.g., ovarian surface epithelial
carcinoma) where the
specific biomarker is detected and where it is undetected. The statistic GUI
object 428C provides
a bar graph illustrating a ratio of positive and negative biomarker statuses
for the specific
biomarker selected in the secondary GUI object 404C for different condition
and / or disease
lineages. As desired, the data behind statistic GUI object 428C may be drawn
from a larger
cohort of patient data, e.g., including all patients that have been
appropriate biomarker status data
as opposed to only those with therapeutic regimen data such as in GUI object
402C.
[00130] In another example embodiment, as shown in FIGS. 41 and 4J, a
graphical user
interface 400D may include a matrix illustrating a marker status for each
biomarker in the
biological sample determined during a biological processing event. For
example, a primary GUI
object 402D may be defined by each cell of the matrix displayed by the GUI
400D. In this
regard, FIG. 4J illustrates the region B of FIG. 41 in greater detail.
[00131] Further, each column of the matrix may correspond to an individual
patient, while
each row may correspond to a specific biomarker tested during the biological
sampling event.
Further, upon selection of the primary GUI object 402D, the apparatus may be
configured to
cause the display of a secondary GUI object 404D upon the graphical user
interface 400D. In
particular, selection of a primary GUI object 402D may cause the apparatus to
display an overlay
that includes additional information corresponding to the primary GUI object.
For example, the
secondary GUI object 404D may include information corresponding to the marker
status, the
biological processing event, and/or the like.
[00132] Additionally or alternatively, each of the primary GUI objects
402D may further
include an indicium that corresponds with a relationship status between the
marker status and the
patient. For example, a primary GUI object 402D may include a particular
color, shade, pattern,
and/or the like within the matrix cell to indicate the presence of a
particular biomarker in the
biological sample taken for the particular patient. For example, as shown in
FIG. 4J, a positive
marker status indicium 430D corresponding to the presence and/or detection of
a particular
biomarker in the biological sample from the specific patient may include a
matrix cell filled with
a red color. Likewise a negative marker status indicium 432D corresponding to
the absence of a
particular biomarker in the biological sample from the particular patient may
include a matrix
cell filled with a blue color. Additional colors may be utilized to indicate
an additional or
alternative relationship status between the marker status and the patient.
53
CA 02999890 2018-03-23
WO 2017/053915 PCT/US2016/053614
[00133] In another embodiment, a graphical user interface 400F, 400G may
be configured
to display a volcano plot corresponding to a particular therapeutic regime
(e.g., a drug) and/or a
particular marker (e.g., a biomarker). In particular, FIG. 4K illustrates a
volcano plot of a log-
rank test p-value with respect to a hazard ratio for the selected therapeutic
regime in different
conditions and/or diseases (i.e., differing condition and / or disease
lineages). Likewise, FIG. 4L
illustrates a volcano plot of a log-rank test p-value with respect to a hazard
ratio for the selected
biomarker in different conditions and/or diseases. In this regard, FIG. 4K
includes a primary GUI
object 402F that corresponds with patient data associated with a particular
condition (e.g., breast
carcinoma). Upon selection of the primary GUI object 402F, a secondary GUI
object 404F (i.e.,
an overlay) may be displayed by the GUI 400F that includes information
corresponding to the
efficacy of the selected therapeutic regime for the particular condition.
Likewise, as shown in
FIG. 4L, upon selection of the primary GUI object 402G displayed by the GUI
400G, the
apparatus may cause the display of a secondary GUI object 404G that includes
information
corresponding to the presence of the selected biomarker for a particular
condition.
[00134] In another embodiment, a GUI 400E is configured to display a
demography table
GUI object 402E. The demography table GUI object 402E is configured to display
indicia
relating to patient data for the plurality of patients. For example, the
indicia comprise a specific
condition and / or disease lineage, status of the condition and / or disease
(e.g., stage), matched
patients, unmatched patients, a match ratio, etc. In another embodiment, the
GUI 400E is
configured to display another demography table GUI object 404E. The demography
table GUI
object 404E is also configured to display indicia relating to patient data for
the plurality of
patients. In some embodiments, the indicia displayed in the demography table
GUI object 402E
and the indicia displayed in the demography table GUI object 404E differs
based on a filter
applied. For example, the filter is based on at least one biomarker status,
the patient status, the at
least one therapeutic regime, the biological processing event, and / or the
biological sampling
event. The filter applied to the patient data that is displayed in the
demography table GUI object
402E comprises a stage (i.e., stage I, II, III, IIIA, IIIB, IIIC, IV, or
unknown). The filter applied
to the patient data that is displayed in the demography table GUI object 404E
may comprise a
specific biomarker and the technique used to assess the biomarker (i.e., PR
IHC, ER IHC, etc).
[00135] The GUI 400E also displays a primary GUI object 406E as an overlay
to the
demography table on which the primary GUI object 406E is based. More
particularly, the indicia
provided in the demography table (e.g., 402E, 404E) is selectable by a
clinician to be
transformed into various types of graphical, textual, tabular, etc., displays.
As illustrated in FIG.
4M, the indicia provided in the demography table GUI object 404E is used as
the data for the
primary GUI object 406E, which comprises a volcano plot. The volcano plot 406E
in FIG. 4M is
54
CA 02999890 2018-03-23
WO 2017/053915 PCT/US2016/053614
configured to display indicia corresponding to a particular assessment
technique and/or a
particular biomarker. In particular, the volcano plot GUI object 406E
illustrates a volcano plot of
a log-rank test p-value with respect to a hazard ratio for different
biomarkers detected using the
selected assessment technique (e.g., IHC). In this regard, upon selection of a
specific biomarker
within the volcano plot GUI object 406E, a secondary GUI object 408E (i.e., an
overlay) may be
displayed by the GUI 400E. The secondary GUI object 408E comprises a Kaplan
Meier survival
analysis for indicia based on the specific biomarker and assessment technique
selected in the
primary GUI object 406E.
[00136] According to yet another aspect, as shown in FIG. 4N, a graphical
user interface
400H may be configured to provide a first or primary GUI object 402H that upon
selection, may
be configured to cause a secondary GUI object 404H to be displayed by the GUI
400H. In
particular, FIG. 4N illustrates a sunburst plot detailing the relationship
between any one of a
marker status, a biological processing, and/or a patient's condition and/or
disease. In this regard,
a primary GUI object 402H, as shown in FIG. 4N, visually indicates the
percentage of biological
samples that include a particular biomarker (e.g., RRM1 in this example) that
were obtained
using IHC for conditions and/or diseases that are classified as "Others".
[00137] Accordingly, each concentric circle and/or ring of the sunburst
plots illustrated in
FIGS. 4N-4Q represents a relationship between a particular level (i.e. a
particular circle and/or
ring) and preceding and/or subsequent levels. In this regard, FIGS. 4N and 40
illustrate the
relationships between the biomarker, the condition and/or disease, and a
particular processing
method for detecting the biomarker. Likewise, FIGS. 4P and 4Q illustrate the
relationships
between a particular therapeutic regime and a patient condition and/or
disease.
[00138] For example, referring to FIG. 4N, a top level GUI object 406H
indicates the
sunburst plot illustrates the relationship between the top level GUI object
(e.g., biomarkers) and
the subsequent level GUI objects. A secondary level GUI object 408H is defined
by the portion
of the sunburst plot demarcated by an angular interval. Accordingly, a
relationship between the
total number of patients and the particular condition and/or disease (e.g.,
breast carcinoma) is
illustrated by the size of the angular interval and the corresponding portion
defined thereby. A
tertiary level GUI object 410H and a quaternary level GUI object 412H may
illustrate the
relationship between a method of processing a biological sample, a biomarker
status, and/or a
patient condition and/or disease. For example, the size of the tertiary level
GUI object 410H, as
defined by the portion of the tertiary ring demarcated by a particular angular
interval may
visually indicate the percentage of patients that have a particular condition
(e.g., breast
carcinoma) whose biological sample was processed using a particular method
(e.g.,
immunohistochemistry). Likewise, the size of the quaternary level GUI object
412H may visually
CA 02999890 2018-03-23
WO 2017/053915 PCT/US2016/053614
indicate the percentage of patients that have a particular condition (e.g.,
breast carcinoma) whose
biological sample was processed using a particular method (e.g.,
immunohistochemistry) that
have a positive indication for a particular biomarker (e.g., RRM1).
[00139] Additionally, in some embodiments, the selection of an
intermediate level GUI
object may cause the apparatus to display a GUI 4001 that illustrates an
intermediate level
sunburst plot. For example, selection of the secondary level GUI object 408H
in a GUI 400H of a
top level sunburst plot, as shown in FIG. 4N, may cause the apparatus to
display a GUI 4001 of
an intermediate level sunburst plot, as shown in FIG. 40. Accordingly, the
angular interval
demarcating the portion of the secondary level GUI object 408H increases to
360 degrees
indicating the displayed intermediate level sunburst plot is associated with
methods used for
processing the biological sample and biomarkers detected for only a particular
patient condition
and/or disease (e.g., breast carcinoma). In some embodiments, selection of a
primary level GUI
object 406H provided by a GUI 4001 illustrating an intermediate level sunburst
plot may cause
the apparatus to display a GUI 400H illustrating the top level sunburst plot.
In this regard, FIGS.
4P and 4Q illustrates various sunburst plot GUIs 400J, 400K that are provided
by an apparatus
according to example embodiments of the present disclosure and act in a
similar fashion to the
sunburst plot GUIs 400H, 4001, as shown in FIGS. 4N and 40, respectively. More
particularly,
the sunburst plot GUIs 400J, 400K illustrated in FIGS. 4P and 4Q illustrate
the relationship
between a particular therapeutic regime and a patient condition and/or
disease.
[00140] In yet another embodiment of the present invention, FIG. 4R
illustrates an
apparatus that is configured to display a GUI 400L that includes a first GUI
object 402L and a
second GUI object 404L. In particular, the GUI 400L may include GUI objects,
information,
and/or indicia corresponding to a particular patient such as, for example a
target patient. In
another embodiment, the GUI 400L may include GUI objects, information, and/or
indicia
corresponding to a patient included in the reference data. Upon selection of
the first GUI object
402L, which includes indicia corresponding with a relationship status between
a therapeutic
regime and a biomarker status for example, the apparatus may be configured to
cause the GUI
400L to display a second GUI object 404L that includes additional, more
detailed information
corresponding to therapeutic regime and/or patient status. Indicia
corresponding with a
relationship status may include a variety of shading, coloring, highlighting,
bolding, and/or any
other suitable visual and/or audible signals that provide an indication of the
relationship status.
[00141] FIG. 5 illustrates a schematic of a data storage arrangement,
generally designated
500. The data storage arrangement 500 is generically embodied by the database
90 described in
reference to FIG. 2. More particularly, the data storage arrangement 500 is
configured to store
and/or provide access to an application to one or more of the user devices
100A, 100B, 100C via
56
CA 02999890 2018-03-23
WO 2017/053915 PCT/US2016/053614
the network 80 (see, FIG. 2). The user devices 100A, 100B, 100C are depicted
in FIG. 5 as a
computing device 502 comprising a hardware processor and memory and a display
in
communication therewith. Such a computing device 502 is a special purpose
computing device
that is configured to improve the art of providing patient care. For example,
providing patient
care using the computing device 502 comprises assisting with diagnosis,
providing a prognosis,
selecting a recommended therapeutic regime, generating a hypothesis, and
evaluating an
efficiency of the therapeutic regime, based on the one or more
interrelationships.
[00142] The computing device 502 is configured to receive patient data
from one or more
database. In various embodiments, the one or more database comprises a
clinical database 504, a
biomarker database 506, a knowledge database 508, and / or a cohort database
510 comprising a
combination of the clinical database 504, the biomarker database 506, and the
knowledge
database 508. Each database 506-510 is configured to receive updated patient
data by either
requesting such data or by receiving updated data from another source (e.g., a
third party source,
a government source, etc.). The patient data is then configured to be mapped
in order to organize
the data by various characteristics, such as at least a biological sampling
event, a biological
processing event, a therapeutic regime, a marker status, and/or a patient
status. The patient data
can be mapped at a repository or the like, 512, or may be mapped in each of
databases 506-510.
As illustrated in FIG. 5, the data is mapped at repository 512 separate from
the databases 506-
510.
[00143] After the data is mapped, the mapped data may be transmitted to
one or more
external database relative to the computing device 502. For example, a first
external database
514A is a database that comprises original data from one or more of the
clinical database 504, the
biomarker database 506, the knowledge database 508, and / or the cohort
database 510 including
protected health information (PHI) data, as well as the mapped data from the
repository 512. In
some embodiments, the first external database 514A comprises the capabilities
for staging the
data contained within. More particularly, the first external database 514A is
configured to stage
the original data and the mapped data via processing the data in an extract,
transform, and load
(ETL) process. The ETL process is performed with validations or rules applied
to the data in
order to reject some of the patient data that does not comprise
correct/expected values in a given
domain. In some embodiments, the first external database 514A is configured to
transmit the
original data and the mapped data to a relational database for the staging of
the data to be
performed.
[00144] In some embodiments, after the data is staged, the staged data may
be combined
with further mapped data from the data repository. In this embodiment, the
combined data may
be transformed to prepare all the data for querying and analysis, e.g., by a
clinician using the
57
CA 02999890 2018-03-23
WO 2017/053915 PCT/US2016/053614
computing device 502. The first external database 514A is configured to either
perform the data
transformation itself or transmit the data stored within to a relational
database.
[00145] In some embodiments, after the data is transformed at least a
portion of the data is
sent to a second external database 514B, where the data is combined with
further mapped data
and processed to integrate the data sets, as well as to remove any PHI data.
The portion of the
data sent to the second external database 514B comprises data that is ready to
be queried,
searched, analyzed, etc., at the computing device 502. In some embodiments,
all of the data is
considered 'load production ready' data and is transmitted to the second
external database 514B.
As illustrated in FIG. 5, it is the second external database 514B that is in
communication with the
computing device 502. However, in some embodiments, not illustrated, the first
external database
514A and the second external database 514B are the same and all back-end data
processing is
performed in the same database that is in communication with the computing
device 502.
[00146] The patient data stored in at least the second external database
514B can be
configured to have limited access. Accordingly, in some embodiments, one or
more user defined
roles are created in order to restrict specific users from viewing specific
portions of the patient
data and / or manipulating the mapped patient data stored. For example, the
user defined roles
enable a particular user to access only patient data from the clinical
database 504, another user to
access only patient data from the biomarker database 506, another user to
access patient data
from each of the clinical database, the biomarker database 506, and the
knowledge database. In
other examples, the user defined roles enable a particular user to only access
data from the
second external database 514B. The one or more user defined roles can be
created based on any
desired attribute, e.g., at least one of condition and / or disease lineage, a
patient cohort, a user
affiliation, or user's membership in a study group. As examples of each, user
access may be
restricted to view only patient data for a given lineage such as only breast
cancer, a given patient
cohort such as only patient data for patients having a certain biomarker
profile or being treated at
a certain hospital or physician practice group, or a study group such as only
patients participating
in a certain clinical trial or other study.
[00147] It will be understood that each block of the flowchart in FIG. 3,
and combinations
of blocks in the flowchart, may be implemented by various means, such as
hardware and/or a
computer program product comprising one or more computer-readable mediums
having
computer readable program instructions stored thereon. For example, one or
more of the
procedures described herein may be embodied by computer program instructions
of a computer
program product. In this regard, the computer program product(s) which may
embody the
procedures described herein may be stored by one or more memory devices of a
mobile terminal,
server, or other computing device and executed by a processor in the computing
device. In some
58
CA 02999890 2018-03-23
WO 2017/053915 PCT/US2016/053614
embodiments, the computer program instructions comprising the computer program
product(s)
which embody the procedures described above may be stored by memory devices of
a plurality
of computing devices. As will be appreciated, any such computer program
product may be
loaded onto a computer or other programmable apparatus to produce a machine,
such that the
computer program product including the instructions which execute on the
computer or other
programmable apparatus creates means for implementing the functions specified
in the flowchart
block(s). Further, the computer program product may comprise one or more
computer-readable
memories on which the computer program instructions may be stored such that
the one or more
computer-readable memories can direct a computer or other programmable
apparatus to function
in a particular manner, such that the computer program product comprises an
article of
manufacture which implements the function specified in the flowchart block(s).
The computer
program instructions of one or more computer program products may also be
loaded onto a
computer or other programmable apparatus to cause a series of operations to be
performed on the
computer or other programmable apparatus to produce a computer-implemented
process such
that the instructions which execute on the computer or other programmable
apparatus implement
the functions specified in the flowchart block(s). Accordingly, blocks of the
flowchart support
combinations of means for performing the specified functions. It will also be
understood that one
or more blocks of the flowchart, and combinations of blocks in the flowchart,
may be
implemented by special purpose hardware-based computer systems which perform
the specified
functions, or combinations of special purpose hardware and computer program
product(s).
EXAMPLES
Example 1: Molecular Profiling Systems
[00148] Molecular profiling is performed to assist in determining a
treatment regimen for a
cancer. Using a molecular profiling approach, molecular characteristics of the
disease itself are
assessed to determine a candidate treatment. Thus, this approach provides the
ability to select
treatments without regard to the anatomical origin of the diseased tissue, or
other traditional
"one-size-fits-all" approaches that do not take into account personalized
characteristics of a
particular patient's affliction. The profiling comprises determining gene and
gene product
expression levels, gene copy number and mutation analysis. Treatments are
identified that are of
likely benefit or not against cancer cells that overexpress certain genes or
gene products,
underexpress certain genes or gene products, carry certain chromosomal
aberrations or mutations
in certain genes, or any other measureable molecular attributes as compared to
reference cells.
The system has the power to take advantage of any useful technique to measure
any biological
characteristic that can be linked to a therapeutic efficacy. The end result
allows caregivers to
59
CA 02999890 2018-03-23
WO 2017/053915 PCT/US2016/053614
expand the range of therapies available to treat patients, thereby providing
the potential for
longer life span and/or quality of life than traditional "one-size-fits-all"
approaches to selecting
treatment regimens.
[00149] This Example illustrates components of a molecular profiling
system that
performs analysis of a cancer sample using a variety of molecular assessment
techniques that
measure expression levels, chromosomal aberrations, mutations, rearrangements
and other
characteristics. The molecular "blueprint" of the cancer is used to generate a
prioritized ranking
of druggable targets and/or drug associated targets in tumor and their
associated therapies. This
Example provides components of a molecular profiling system that can be used
to generate
patient data for use in the methods, systems, storage medium and apparatus of
the invention.
Such components (e.g., biomarkers or analysis techniques) can be used as
criterion to filter the
visualized patient data as described herein.
[00150] Formalin-fixed paraffin-embedded (FFPE) tumor samples are received
from a
treating physician and are reviewed by a pathologist for quality control
before subsequent
analysis. Analysis methods and biomarkers assessed are as described in Tables
2-6. As indicated
in Table 2, certain tests may be performed based on tumor lineage as desired.
In Table 2,
mutation and copy number variation (CNV) on DNA can be assessed using next-
generation
sequencing (NGS) of the biomarkers according to Tables 3 and 4, and fusions
can be assessed
using NGS on RNA on the biomarkers according to Table 5. Table 6 lists certain
"hotspot" genes
with mutations linked to drug efficacy, prognosis, and clinical trial
enrollment. The tables
generally refer to genes by their recognized gene names. Listing of gene names
and descriptions
can be found using a variety of online databases, including GeneCards
(www.genecards.org),
HUGO Gene Nomenclature (www.genenames.org), Entrez Gene
(www.ncbi.nlm.nih.gov/entrez/query.fcgi?db=gene), UniProtKB/Swiss-Prot
(www.uniprot.org),
UniProtKB/TrEMBL (www.uniprot.org), OMIM
(www.ncbi.nlm.nih.gov/entrez/query.fcgi?db=0MIM), GeneLoc
(genecards.weizmann.ac.il/geneloc/), and Ensembl (www.ensembl.org). Generally,
gene symbols
and names below correspond to those approved by HUGO, and protein names are
those
recommended by UniProtKB/Swiss-Prot. Where a protein name indicates a
precursor, the mature
protein is also implied. Gene and protein symbols may be used interchangeably
herein and the
meaning can be derived from context, e.g., NGS is used to analyze nucleic
acids whereas IHC is
used to analyze proteins.
Table 2: Molecular Profiling Tests
Tumor Lineage Immunohistochemistry (IHC) Sequencing Other
Biomarkers (NGS)
Biomarkers
CA 02999890 2018-03-23
WO 2017/053915 PCT/US2016/053614
Bladder ERCC1, PD-L1, RRM1, TOP2A, Mutation, CNV
TRKA/B/C (NTRK), TS, Analysis (DNA)
TUBB3
Breast AR, ER, ERCC1, Her2/Neu, PD- Mutation, CNV TOP2A (CISH)
L1, PR, PTEN, RRM1, TLE3, Analysis (DNA)
TRKA/B/C (NTRK)
Cancer of Unknown ERCC1, PD-L1, RRM1, TOP01, Mutation, CNV
Primary (CUP) TRKA/B/C (NTRK), TS, Analysis (DNA)
TUBB3
Cervix ER, ERCC1, PD-L1, PR, RRM1, Mutation, CNV
TOP2A, TOP01, TRKA/B/C Analysis (DNA)
(NTRK), TS, TUBB3
Cholangiocarcinoma / ERCC1, Her2/Neu, PD-L1, Mutation, CNV
Hepatobillary RRM1, TOP01, TRKA/B/C Analysis (DNA)
(NTRK), TS, TUBB3
Colorectal ERCC1, PD-L1, PTEN, TOP01, Mutation, CNV MSI (Fragment
TRKA/B/C (NTRK), TS Analysis (DNA) Analysis)
Endometrial ER, ERCC1, PR, PD-L1, PTEN, Mutation, CNV MSI (Fragment
RRM1, TOP2A, TOP01, Analysis (DNA) Analysis)
TRKA/B/C (NTRK), TS,
TUBB3
Gastric/Esophageal ERCC1, Her2/Neu, PD-L1, Mutation, CNV
TOP2A, TOP01, TRKA/B/C Analysis (DNA)
(NTRK), TS, TUBB3
GIST PD-L1, PTEN, TRKA/B/C Mutation, CNV
(NTRK) ERCC1, PD-L1, TOPO 1 Analysis (DNA)
Glioma ERCC1, PD-L 1 , RRM1, Mutation, CNV MGMT
TRKA/B/C (NTRK), TS, Analysis (DNA); Methylation
Fusion Analysis (Pyro
TUBB3 (RNA) Sequencing)
Head & Neck ERCC1, PD-L1, RRM1, TOP2A, Mutation, CNV
TRKA/B/C (NTRK), TUBB3 Analysis (DNA)
Kidney ERCC1, MGMT, PD-L1, Mutation, CNV
TRKA/B/C (NTRK), TUBB3 Analysis (DNA)
Melanoma ERCC1, PD-L 1 , MGMT, Mutation, CNV
Analysis (DNA)
61
CA 02999890 2018-03-23
WO 2017/053915
PCT/US2016/053614
TOP2A, TS
Non-Small Cell Lung ALK, ERCC1, PD-L1, PTEN, Mutation, CNV
RRM1, TOP01, TRKA/B/C Analysis (DNA);
Fusion Analysis
(NTRK), TS, TUBB3 (RNA)
Ovarian ER, ERCC1, PD-L1, PR, RRM1, Mutation, CNV
TOP2A, TOP01, TRKA/B/C Analysis (DNA)
(NTRK), TUBB3
Pancreatic ERCC1, MLH1, MSH2, MSH6, Mutation, CNV
PD-L1, PMS2, RRM1, TOP01, Analysis (DNA)
TRKA/B/C (NTRK), TS,
TUBB3
Prostate AR, ERCC1, PD-L1, TRKA/B/C Mutation, CNV
(NTRK), TUBB3 Analysis (DNA)
Sarcoma ERCC1, MGMT, PD-L1, RRM1, Mutation, CNV
TOP2A, TOP01, TRKA/B/C Analysis (DNA)
(NTRK), TUBB3
Thyroid ERCC1, PD-L1, TOP2A, Mutation, CNV
TRKA/B/C (NTRK) Analysis (DNA)
Other Tumors ERCC1, PD-L1, RRM1, TOP2A, Mutation, CNV
TRKA/B/C (NTRK), TS, Analysis (DNA)
TUBB3
Table 3: Next-Generation Sequencing Mutation Analysis
Mutations
ABIl
BRD4 CRLF 2 FOX04 HOXC11 KLF 4 MUC 1 PAK3 RHOH TAL2
ABL1 BTG1 DDB 2 F STL3 HO XC13 KLK2 MUTYH PATZ1 RNF 213 TBL1XR
1
ACKR3 BTK
DDIT3 GATA1 HOXD11 LA SP1 MYCL PAX8 RPL10 TCEA1
(MYCL1)
AKT1 C15 orf65 DNM2 GATA2 HOXD13 LMO1 NBN
PDE4DIP SEP T5 TCL1A
AMER1 CBLC DNMT3A GNA11 HRAS LMO2 NDRG1 PHF6 SEPT6 TERT
(FAM123
B)
AR
CD79B EIF4A2 GPC3 IKBKE MAFB NKX2-1 PHOX2B SFPQ TFE3
ARAF CDH1 ELF4 HEY1 INHBA MAX NONO PIK3CG SLC45A3 TFPT
ATP2B3 CDK12 ELN HI S T 1H3 IR S2
MEC OM NO TCH1 PLAG1 SMARC A THRAP3
4
ATRX CDKN2B ERCC1 HIST1H4 JUN
MED12 NRAS PMS1 SOCS1 TLX3
62
CA 02999890 2018-03-23
WO 2017/053915
PCT/US2016/053614
BCL11B CDKN2C ETV4 HLF KAT6A MKL1 NUMA1 POU5F1 SO X2 TMPRSS
(MYST3) 2
BCL2 CEBPA FAM46C HMGN2P KAT6B MLLT11 NUTM2B PPP2R1A SPOP UBR5
46
BCL2L2 CHCHD7 FANCF HNFlA KCNJ5 MN1 OLIG2 PRF1 SRC
VHL
BCOR CNOT3 FEV HOXA11 KDM5C MPL OMD PRKDC SSX1 WAS
BCORL1 COL1A1 FOXL2 HOXA13 KDM6A MSN P2RY8 RAD21 STAG2 ZB TB16
BRD3 COX6C FOX03 HOXA9 KD SR MTCP1 PAFAH1 RECQL4 TAL 1 ZRSR2
B2
Table 4: Next-Generation Sequencing Mutation and CNV Analysis
Mutations and Copy Number Variations (CNV)
ABL2 BRCA21 COPB1 ESR1 FUS KIT MYB PERI RUNX1 TFG
AC SL3 BRIP1 CREB1 ETV1 GA S7 KLHL6 MYC PIC ALM RUNX1T TFRC
1
AC SL6 BUB1B CREB3L1 ETV5 GATA3 KMT2A MYCN PIK3CA SBDS TGFBR2
(MLL)
AFF1 Cllorf30 CREB3L2 ETV6 GID4 KMT2C MYD88 PIK3R1 SDC4
TLX1
(EMS Y) (C17orf39 (MLL3)
)
AFF3 C2orf44 CREBBP EWSR1 GNP S KMT2D MYH11 PIK3R2 SDHAF2 TNFAIP3
(MLL2)
AFF 4 CACNA1 CRKL EXT1 GNA13 KRA S MYH9 PIM1 SDHB
TNFRSF 1
D 4
AKAP9 CALR CRT Cl EXT2 GNAQ KTN1 NACA PML SDHC
TNFRSF 1
7
AKT2 CAMTA1 CRT C3 EZH2 GNAS LCK NCKIPS PMS2 SDHD TOP1
D
AKT3 CANT1 CSF1R EZR GOLGA5 LCP1 NCOA1 POLE SEPT9 TP53
ALDH2 CARD11 CSF3R FANCA GOPC LGR5 NCOA2 POT1 SET
TPM3
ALK CARS CTCF FANCC GPHN LHFP NCOA4 POU2AF SETBP1 TPM4
1
APC CASC5 CTLA4 FANCD2 GPR124 LIFR NF1 PPARG SETD2 TPR
ARFRP1 CASP8 CTNNA1 FANCE GRIN2A LPP NF2 PRCC SF3B1 TRAF 7
ARHGAP CBFA2T3 CTNNB1 FANCG GSK3B LRIG3 NFE2L2 PRDM1 SH2B3 TRIM26
26
ARHGEF CBFB CYLD FANCL H3F3A LRP1B NFIB PRDM16 SH3GL1
TRIM27
12
ARID1A CBL CYP2D6 FAS H3F3B LYL1 NFKB2 PRKAR1 SLC34A2 TRIM33
A
ARID2 CBLB DAXX FB X011 HERPUD MAF NFKBIA PRRX1 SMAD2 TRIP 11
1
ARNT CCDC6 DDR2 FB XW7 HGF MALT1 NIN P SIP1 SMAD4 TRRAP
ASPSCR1 CCNB HP DDX10 FCRL4 HIP1 MAML2 NOTCH2 PTCH1 SMARCB TSC1
1 1
ASXL1 CCND1 DDX5 FGF10 HMGA1 MAP2K1 NPM1 PTEN SMARCE TS C2
63
CA 02999890 2018-03-23
WO 2017/053915
PCT/US2016/053614
1
ATF 1 CCND2 DDX6 FGF 14 HMGA2 MAP2K2 NR4A3 PTPN11 SMO T
SIM
ATIC CCND3 DEK FGF 19 HNRNPA MAP2K4 NSD1 PTPRC SNX29 TTL
2B1
ATM CCNE1 DICER1 FGF23 HOOK3 MAP3K1 NT5C2 RABEP1 SOX10 U2AF1
ATP1A1 CD274 DOT1L FGF3 HSP90A MCL1 NTRK1 RAC1 SPECC1
USP6
(PDL1) Al
ATR
CD74 EBF1 FGF4 HSP90AB MDM2 NTRK2 RADS 0 SPEN VEGF A
1
AURKA CD79A EC T2L FGF6 IDH1 MDM4 NTRK3 RADS 1 SRGAP3 VEGFB
AURKB CDC 73 EGFR FGFR1 IDH2 MD S2 NUP214 RADS 1B SRSF2 VTI1A
AXIN1 CDH11 ELK4 FGFR10 IGF 1R MEF2B NUF'93 RAF 1
SRSF3 WHS Cl
P
AXL CDK4 ELL FGFR2 IKZF1 MEN1 NUP98 RALGDS S S18
WHSC1L
1
BAP1 CDK6 EML4 FGFR3 IL2 MET NUTM1 RANBP1 SS18L1 WIF1
(cMET) 7
BARD1 CDK8 EP300 FGFR4 IL21R MITF PALB 2 RAP1GD STAT3 WI SP3
S1
B CLIO CDKN1B EPHA3 FH IL 6 ST MLF1 PAX3 RARA STAT4 WRN
BCL11A CDKN2A EPHA5 FHIT IL 7R MLH1 PAX5 RB1 STAT5B WT1
BCL2L11 CDX2 EPHB1 FIP1L1 IRF4 MLLT1 PAX7 RBM15 STIL
WWTR1
BCL3 CHEK1 EP S15 FLCN ITK MLLT10 PBRM1 REL STK11 XPA
B CL 6 CHEK2 ERBB2 FLI1 JAK1 MLL T3 PB X1 RET SUFU XPC
(HER2)
BCL7A CHIC2 ERBB3 FLT 1 JAK2 MLLT4 PCM1 RICTOR SUZ12 XPO 1
(HER3)
B CL 9 CHN1 ERBB4 FLT3 JAK3 MLL T6 PC SK7 RMI2 SYK
WHAE
(IIER4)
B CR CIC ERC1 FLT4
JAZF1 MNX1 PDCD1 RNF 43 TAF 15 ZMYM2
(PD1)
BIRC3 CIITA ERC C2 FNBP1 KDM5A MRE1 1 A PDCD1L RO S1
TCF 12 ZNF217
G2
(PDL2)
BLM CLP1 ERCC3 FOXA1 KDR MSH2 PDGFB RPL22 TCF3 ZNF331
(VEGFR2
)
BMPR1A CLTC ERCC4 FOX01 KEAP1 MSH6 PDGFRA RPL5
TCF7L2 ZNF384
BRAF CLTCL1 ERCC5 FOXP1 KIAA154 M5I2 PDGFRB RPN1 TET 1
ZNF521
9
BRCAll CNBP ERG
FUBP1 KIF5B MTOR PDK1 RP TOR TET2 ZNF703
CNTRL TFEB
Table 5: Next-Generation Fusions and Transcript Variants
Gene Fusions (RNA) Variant
Transcripts
(RNA)
64
CA 02999890 2018-03-23
WO 2017/053915 PCT/US2016/053614
ALK BRAF NTRK1 NTRK2 NTRK3 RET ROS1 RSPO3 EGFR \TM MET Exon
14 Skipping
Table 6: Next-Generation Sequencing Hotspots
Next-Generation Sequencing Hotspots
ABL1 BRCA1 CTNN31 FGER1 GNAS JAK3 MPL PIK3CA SMAD4 VHL
AKT1 BRCA2 EGFR FGFR2 HNFlA KDR NOTCH1 P TEN SMARCB1
(VEGFR2)
ALK BRAF ERBB2 FLT3 HRAS KIT NPM1 PTPN11 SMO
(HER2) (cKIT)
APC CDH1 ERBB4 GNAll IDH1 KRAS NRAS RB1 STK11
(HER4)
ATM C SF1R FBW7 GNAQ JAK2 MET PDGFRA RET TP53
(cMET)
[00151] The desired molecular tests from Tables 2-6 are performed and
results analyzed.
The results can be compared against a database of drug-biomarker associations
to identify
therapeutic drug regimens that are more or less likely to benefit the patient.
Certain biomarker
states may indicate that the patient is a candidate for enrollment in certain
clinical trials.
Exemplary biomarker-drug associations are shown in Table 7.
Table 7: Exemplary biomarker-drug associations
Drug / Agent Biomarker Platform
aspirin (assoc. in PIK3CA NGS
CRC)
afatinib (assoc. in EGFR NGS
NSCLC) ERBB2 (HER2) NGS
afatinib + cetuximab EGFR T790M NGS
(combination assoc.
in NSCLC)
cabozantinib (assoc. cMET NGS
in NSCLC)
capecitabine, TS IHC
fluorouracil,
pemetrexed
carboplatin, BRCA1 NGS
cisplatin, oxaliplatin BRCA2 NGS
ERCC1 IHC
ceritinib ALK IHC
cetuximab, BRAF NGS
panitumumab (assoc. KRAS NGS
in CRC) NRAS NGS
PIK3CA NGS
PTEN IHC
cetuximab (assoc. in EGFR CISH
NSCLC)
CA 02999890 2018-03-23
WO 2017/053915 PCT/US2016/053614
crizotinib ALK IHC
cMET CISH, NGS
ROS1 FISH
dabrafenib, BRAF NGS
vemurafenib
dacarbazine, MGMT IHC
temozolomide MGMT-Methylation Pyrosequencing
IDH1 (associated in High Grade Glioma) NGS
docetaxel, paclitaxel, TLE3 IHC
nab-paclitaxel TUBB3 IHC
doxorubicin, HER2/Neu CISH
liposomal- TOP2A IHC
doxorubicin, CISH
epirubicin
erlotinib, gefitinib EGFR NGS
(assoc. in NSCLC) KRAS NGS
PIK3CA NGS
cMET CISH
PTEN IHC
everolimus, ER (associated in Breast) IHC
temsirolimus PIK3CA NGS
gemcitabine RRM1 IHC
hormone therapies AR IHC
ER IHC
PR IHC
imatinib cKIT NGS
PDGFRA NGS
irinotecan TOP 0 1 IHC
topotecan (excluding
Breast, CRC,
NSCLC)
lapatinib, HER2/Neu IHC; CISH
pertuzumab, T-DM1
lomustine, 1 p 1 9q FISH
procarbazine,
vincristine
mitomycin-c BRCA1 NGS
BRCA2
nivolumab, PD-L1 IHC
pembrolizumab
(assoc. in Bladder,
Kidney, Melanoma,
NSCLC)
olaparib BRCA1 NGS
(assoc. in Ovarian) BRCA2
osimertinib EGFR T790M NGS
(assoc. in NSCLC)
palbociclib ER IHC
66
CA 02999890 2018-03-23
WO 2017/053915 PCT/US2016/053614
(assoc. in Breast) HER2/Neu IHC; CISH
sunitinib (assoc. in cKIT NGS
GIST)
trametinib (assoc. in BRAF NGS
Melanoma)
trastuzumab ERBB2 (HER2) NGS
HER2/Neu IHC; CISH
PTEN (associated in Breast) IHC
PIK3CA (associated in Breast) NGS
vandetanib RET NGS
clinical trials EGFR PTEN IHC
clinical trials EGFRvIII Fragment
Analysis
clinical trials cMET CISH; NGS
clinical trials MLH1, MSH2, MSH6, PMS2 IHC
MSI Fragment
Analysis
clinical trials ABL1, AKT1, ALK, APC, ATM, CSF1R, NGS
CTNNB1, EGFR, ERBB2 (Her2), FGFR1, FGFR2,
FLT3, GNAll, GNAQ, GNAS, HRAS, IDH1,
JAK2, KDR (VEGFR2), KRAS, MPL, NOTCH1,
NRAS, PTEN, SMO, TP53, VHL
[00152] In reference to Table 7, cetuximab/panitumumab,
vemurafenib/dabrafenib, and
trametinib may be reported in combination in colorectal cancer (CRC). Hormone
therapies may
include tamoxifen, toremifene, fulvestrant, letrozole, anastrozole,
exemestane, megestrol acetate,
leuprolide, goserelin, bicalutamide, flutamide, abiraterone, enzalutamide,
triptorelin, abarelix,
and degarelix. Abbreviations in Table 7 are as used herein: CRC: colorectal
cancer; NSCLC:
non-small cell lung cancer; IHC: Immunohistochemistry; CISH: Chromogenic in
situ
Hybridization; FISH: Fluorescence in situ Hybridization; NGS: Next-Generation
Sequencing.
[00153] A report is generated from the above molecular profiling system.
The report
contains listings of drugs that are more likely to benefit the patient, less
likely to benefit the
patient, and of indeterminate benefit. The report is used by a treating
physician to assist in
providing a treatment plan for the patient whose tumor was profiled. Ultimate
treatment decisions
lie with the treating physician.
[00154] Further details of systems and methods for molecular profiling,
including without
limitation listings of biomarkers and biomarker-drug association rules, and
exemplary molecular
profiling reports, can be found in US Patent Publications U520100113299,
published May 6,
2010; U520140222443, published August 7, 2014; U520150307947, published
October 29,
2015; U520160186266, published June 30, 2016; and U520150024952, published
January 22,
2015; US Patent Nos. 8,700,335, issued April 15, 2014 and 8,768,629, issued
July 1, 2014; and
Int'l Patent Publications W02015116868, published August 6, 2015, and
W02016141169,
67
CA 02999890 2018-03-23
WO 2017/053915 PCT/US2016/053614
published September 9, 2016; each of which patent publications is incorporated
herein by
reference in its entirety.
Example 2: Treatment Planning
[00155] A database is assembled comprising patient data from over 100,000
molecular
profiles collected over several years. Outcomes data is available for over 5
years for 10% of the
profiles.
[00156] An oncologist having a patient with triple negative breast cancer
orders molecular
profiling of a tumor sample collected from the patient during surgery. The
oncologist receives a
molecular profiling report. The oncologist queries the database using the
visualization methods
and apparatus of the invention through a secure web interface to examine
treatments and
outcomes for other patients with triple negative breast cancer. In one
instance, the oncologist
identifies previous triple negative breast cancer patients in a waterfall plot
that have certain
similar molecular profiling results as the current patient. Based on a
combination of the
molecular profiling report, the visualization analysis, and expert medical
opinion, the oncologist
selects a treatment regimen most likely to benefit the patient.
Example 3: Hypothesis Generation
[00157] A database is assembled comprising patient data from over 100,000
molecular
profiles collected over several years. Outcomes data is available for over 5
years for 10% of the
profiles. A researcher is interested in identifying biomarker targets for
triple negative breast
cancer patients. The researcher queries the database using the visualization
methods and
apparatus of the invention through a secure web interface to examine
treatments and outcomes
for patients with triple negative breast cancer. The researcher identifies
classes of drugs and
biological pathways that correspond to the biological states and/or treatment
of prior triple
negative breast cancer patients. The researcher chooses to examine members of
a biological
pathway with a high incidence of mutations as candidates for development of
targeted drug
therapy.
[00158] Many modifications and other embodiments of the inventions set
forth herein will
come to mind to one skilled in the art to which these inventions pertain
having the benefit of the
teachings presented in the foregoing descriptions and the associated drawings.
Therefore, it is to
be understood that the embodiments of the invention are not to be limited to
the specific
embodiments disclosed and that modifications and other embodiments are
intended to be
included within the scope of the invention. Moreover, although the foregoing
descriptions and
the associated drawings describe example embodiments in the context of certain
example
combinations of elements and/or functions, it should be appreciated that
different combinations
of elements and/or functions may be provided by alternative embodiments
without departing
68
CA 02999890 2018-03-23
WO 2017/053915 PCT/US2016/053614
from the scope of the invention. In this regard, for example, different
combinations of elements
and/or functions than those explicitly described above are also contemplated
within the scope of
the invention. Although specific terms are employed herein, they are used in a
generic and
descriptive sense only and not for purposes of limitation.
69