Note: Descriptions are shown in the official language in which they were submitted.
CA 03001448 2018-04-06
WO 2017/061943
PCT/SE2016/050966
1
MEDICAL ARRANGEMENTS AND A METHOD FOR DETERMINING
PARAMETERS RELATED TO INSULIN THERAPY, PREDICTING
GLUCOSE VALUES AND FOR PROVIDING INSULIN DOSING
RECOMMENDATIONS
Field of the invention
The present invention relates in general to insulin therapy and to the
determining of patient-specific physiological and pharmacokinetic
parameters related to the glucose-lowering effect of insulin from data
collected from the individual, and how to utilize these parameters to
improve the insulin therapy outcome.
Technical Background
Globally, 300 to 400 million people have developed diabetes. In 2035
the number is expected to be closer to 600 million. About 5-10% of the
diabetic population have type I diabetes and require intensive insulin
treatment, and a majority with type II diabetes also require insulin 6-10
years post diagnosis. Modern insulin therapy consists of multiple daily
injections using an insulin pen (MDI) or by means of continuous infusion by
an insulin pump (CSII). To assess the glucose level personal glucose
meters (SMBG), providing a reading of the plasma glucose level at the time
of measurement, as well as the evolving continuous glucose measurement
systems (CGM), which give frequent measurements (typically every 5
minutes) of the glucose level in the subcutaneous tissue where the sensor
is placed, are used. Poor glycemic control due to excessive or insufficient
insulin doses may result in both short-term and long-term complications,
such as, e.g., acute seizures and coma due to hypoglycemia (low blood
glucose concentration) or, e.g., chronic renal disease, blindness and micro-
and macrovascular diseases due to long-term hyperglycemia (high blood
glucose concentration).
Generally, the diabetes population has unsatisfying glycemic levels
and there is a large demand for means to improved control. To optimize
CA 03001448 2018-04-06
WO 2017/061943 PCT/SE2016/050966
2
the insulin therapy for each individual, knowledge of the glucose-lowering
effect and the specific dose requirements are essential. However, current
practice and technology do not provide means to effectively and reliably
determining these factors on an individual basis.
Summary of the invention
In one aspect the present invention provides a method for determg
a personalized estimate, the magnitude of an intended medical effect, a
duration and a shape of this, for a drug, based on sections of data where a
target biomarker and dose history have been recorded, wherein the
personalized estimate of a finite impulse response model a = [ao, a2 an]
and the basal hepatic glucose production Gb is determined according to:
= 11(tk-i)(i) y (7-(y=(t )(A)Arok...i)
i=1:3 (1)
Gti) V(4)t E
/(tk) represents a drug infusion and y(tk)Ois a biomarker level at a time
sample tk, v(tk) N(0, o-v) corresponds to a process noise perturbation with
variance av2, and Ti represents the time instances in a dataset j, and where
impulse-response model parameters a = [ao, al ... an] have a biomarker
dependence;
for each biomarker level G of interest, the following problem is solved to
retrieve the parameter estimates; a and Gb = [Gb(1)...Gb(N) 'using N periods
of data:
{a KO, Gb ¨ y(i) 50.3) IH-G + a a R
=1
1 (2)
subject to
CA 03001448 2018-04-06
WO 2017/061943 PCT/SE2016/050966
3
(1.1) =
= 0
(3)
and wherein a second-order regularization matrix R is populated as
follows:
1-10,
¨
j+1)= [I 2 I j = [1, (4)
= 1
wherein tl ' is the collected biomarker data for data record j
covering sample times Ti ...... [11 141, and Y ¨ LYtis a' is the
corresponding estimate of biomarker level according to the equation (1);
VVG is the quadratic kernel matrix defining the weight of each biomarker
measurement according to the distance to the biomarker level G; Gb is the
1 0 prior expected value estimate of Gb, and a, and y are penalty terms.
In one embodiment the method further comprises a step of estimating
a required dosage needed, during different time intervals, to achieve an
intended effect of the drug on the biomarker.
In one embodiment the method comprises a step of calculating the
sensitivity factor of the drug for different glucose values G by summing up
all the a(G) = [ao,(G) ai (G)... an(G)] terms given by the method according
to the present invention.
In one embodiment the method comprises calculating an average
sensitivity factor of the drug by averaging the sensitivity factors of the
above.
In one embodiment the method comprises a step of calculating a drug
dose based on the sensitivity factor, the shape and duration of the drug
action, information about previous doses Dj at times Tj, the current
biomarker level G and target biomarker level Gt according to:
CA 03001448 2018-04-06
WO 2017/061943 PCT/SE2016/050966
4
D ................ max(th _____________
s (8)
and
DzoB 1);(1¨ ___________ ), Vj < ¨ 5 = n
Ki SR
i=1 (9)
In one embodiment the method comprises the steps of using the
parameters estimated according to the present invention together with
information of the planned dosage and measurements of the biomarker, for
calculating an expected effect for a time period covering p sample steps
ahead according to:
fkkõ14 = I ¨ cieWitk ceYt
(1 0)
E ai(y(tk))/(tk-i: ab,T
(11)
k E 41-4(E/444+j 1).444.i...i)
v=1) (12)
tr-ib,T, I < P
Yt 1
where is the measurement update, is
the time update, and
Y4+14-litk4 is the predicted value one step ahead, and a is the Kalman
filter constant, and 1(tk) is the insulin dose at time tk; and to issue at
least
one alarm in an electronic device when predefined thresholds are broken.
In one embodiment the method comprises the steps of using the
parameters estimated according to the present invention and
measurements of the biomarker for simulating the effect of different dosage
alternatives for a time period covering p sample steps ahead according to:
= 1. +alit
(10)
CA 03001448 2018-04-06
WO 2017/061943 PCT/SE2016/050966
=fitk- xItk = E aicy(tk. /(tk___i)
(11)
9i4:4-.H-At.k+j = E
(12)
a!) < < p
=
it = .614-4-1 t.;;;
where is the measurement update, = = ' is the time update, and
th = - = t = =
5 is the predicted value one step ahead, and 1(tk) is the insulin
dose at time tk and is the Kalman filter constant.
In one embodiment the method comprises the steps of using the
parameters estimated according to the present invention and measurements
of the biomarker for simulating the effect of different dosage alternatives
for a
time period covering p sample steps ahead according to:
= (1 ¨ tt)fitklt +
(10)
= ail:-Vtk))/(4¨i) G ,T
i (11)
= Eai(.61/4õ,t.114.4.jõ,31(44.J___i)
(12)
+ 13 <
where k is the measurement update, . is
the time update, and
fit
ilk+j is the predicted value one step ahead, 1(tk) is the insulin dose
at time tk, and a is the Kalman filter constant; and for optimizing a
CA 03001448 2018-04-06
WO 2017/061943 PCT/SE2016/050966
6
therapy, where is=i17-.../7-4 is the suggested insulin dose at the time point
of calculation (sample number T) and L(p) samples ahead according to:
min C.Vir ¨ YR )
ils (13)
subject to
> . 'wow, j = [7: . T (14)
where C is a convex cost function, Y= ;1)T4,1]7- is the simulated
biomarker trace calculated according to the equations (10)-(12), YR= [yR
yR] is a vector the same size as of the target biomarker value yR.
In one embodiment the method comprises the steps of using the
parameters estimated according to the present invention with information
about the planned dosage and measurements of the biomarker, for
calculating an expected effect and for reprogramming planned doses in a
drug delivery pump when predefined thresholds are broken, wherein the new
reprogramming dose is=i17-.../7-4 at the time point of calculation (sample
number T) and L(p) samples ahead is based on an optimization according
to:
m C.:7=Cir YR )
(13)
subject to
'wow, = 4_ Li (14)
. ,
where C is a convex cost function, Y = Yr+rf is the simulated
biomarker according to Eq (10-12) trace, YR= [yR yR] is a vector the same
size as Y of the target biomarker value y.
One aspect of the present invention relates to a method for
determining a personalized estimate of finite impulse response model br=[bri,
br2 ...brd of a biomarker elevating effect of a meal intake of recipe r,
according
to a maximum likelihood approach where the total likelihood is maximized:
A:, tv.ANICN b) A)
max b,A (15)
CA 03001448 2018-04-06
WO 2017/061943 PCT/SE2016/050966
7
and where Y = [yi yno yi(N)_ y(N)1 is the concatenated glucose
reference for all meal instances, calculated according to
= yak- OW + Ai Y. agyok)u))1-(4_0
i=o
R m
g .i.14:1) (A_ v e T
(16)
where 1(tk) represents the drug infusion at time tk, Mr(tk) is the meal intake
in
grams of carbohydrates in recipe r at time sample tk, v(tk) N(0,o-,)
corresponds to a process noise perturbation, with variance o-,2, and Ti
represents the time instances in dataset j;
In one embodiment the method comprises the steps of using the
parameters estimated according to the present invention together with
information of the planned dosage and measurements of biomarker, for
calculating the expected effect for a time period covering p sample steps
ahead according to:
= 1 ¨ a)fit.1, ahtt
(18)
9tk4 th(vik /(t,i) G b,T
1,1) (19)
tk+i
i=o
R zrs
+ V: Ifnt<
r= 1 + (ha T 1 < < P
(20)
and to issue at least one alarm in an electronic device when predefined
thresholds are broken.
In one embodiment the method comprises the steps of using the
parameters estimated according to the present invention and measurements
CA 03001448 2018-04-06
WO 2017/061943 PCT/SE2016/050966
8
of biomarker for simulating the effect of different dosage alternatives for a
time period covering p sample steps ahead according to:
¨ +
(18)
= 444 E aicy(tk.))/(tk--i)
(19)
94:444+j-I aiotk+.,14,õ
br, ArPftv.4)
fiTt ab,T, < < p
(20)
In one embodiment the method comprises the steps of using the
parameters estimated according to the present invention and recent
measurements of biomarker for simulating the effect of different dosage
alternatives for a time period covering p sample steps ahead according to:
fits,j4 = ¨ aViti,14_1
(18)
= -.9414 4-E (11(. (4. )/(tk-1. ) -) '
(19)
=
ab,T, I< P
(20)
and for optimizing a therapy is=i17-.../T+dat the time point of calculation
(sample number T) and L(p) samples ahead according to:
rt i Cf. ---- YR )
(13)
subject to
..................... T = (14)
CA 03001448 2018-04-06
WO 2017/061943
PCT/SE2016/050966
9
. ,
where C is a convex cost function, Y r.F4 LIT is the simulated
biomarker according to Eq (10-12) trace, YR= [yR yR] is a vector the same
size as Y of the target biomarker value yR.
Another aspect of the present invention relates to a system for
controlling insulin delivery to a patient according to the method described in
the present invention where the measured biomarker is glucose.
In one embodiment the system may be comprising an insulin pump, a
glucose meter, a receiver unit for a continuous glucose meter, a smartphone,
a tablet, a computer or any other device that may have the capability to
display information to a user and perform the necessary measurements and
calculations.
Yet another aspect of the present invention relates to a medical device
performing the calculations according to the present invention.
With the above description in mind, an aspect of some of the
embodiments of this invention relates to determining parameters used to
improve insulin therapy in insulin treated diabetes from collected data from
an
individual. Using these parameters, the glucose-lowering effect, from the time
point of an insulin injection until it no longer can be detected, can be
determined specifically for that individual. Additionally, the insulin
required to
maintain, or reach, a treatment target, such as achieving a predefined
glucose level, can be calculated for a given time period. The estimates above
can be used together with a measurement of the current glucose level, in a
medical device or system, to predict the future glucose level and to issue
alarms to the user when the predicted value at a certain time point ahead
breaks thresholds, indicating potentially dangerous future low or high glucose
values. In these devices or systems, different treatment scenarios can be
simulated allowing the user to scrutinize and choose a suitable dosing
regime. Specifically, in systems where the insulin dosing can be manipulated
such as insulin pumps, the insulin delivery can be suspended based on these
CA 03001448 2018-04-06
WO 2017/061943
PCT/SE2016/050966
prediction, and a new insulin dose for the near future can be programmed to
reduce the risk of developing dangerously low or high glucose values.
Short description of the drawings
Figure 1. Example of a section of collected glucose and insulin infusion
5 data. The data in this example has been sampled with a five minute
interval.
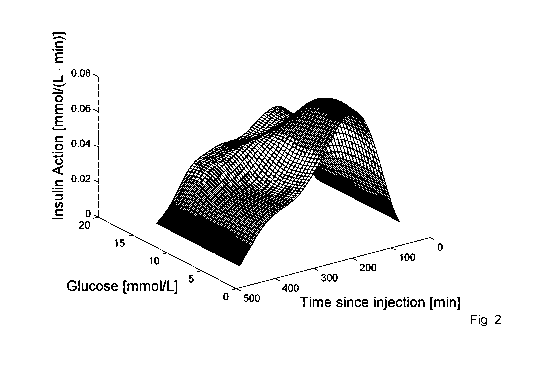
Figure 2. Example of estimated insulin action across the glucose
range.
Figure 3. Example of estimated insulin requirements.
Figure 4. Example of an estimated glucose independent insulin action
10 curve.
Figure 5. Summary of the steps in process to retrieve the parameter
estimates.
Detailed description of the invention
Embodiments of the present invention will be described more fully
hereinafter with reference to the accompanying drawings, in which
embodiments of the invention are shown. This invention may, however, be
embodied in many different forms and should not be construed as limited to
the embodiments set forth herein. Rather, these embodiments are provided
so that this disclosure will be thorough and complete, and will fully convey
the
scope of the invention to those skilled in the art. Like reference signs refer
to
like elements throughout.
Embodiments of the present invention relate, in general, to the field of
insulin therapy. By the term "insulin action" is meant the combined
pharmacokinetic and pharmacodynamic metabolic glucose-lowering effect of
a specific insulin type for a specific individual.
The pharmacokinetic and pharmacodynamics properties of different
insulin types are based on generic assumptions derived from population
results, and do not necessarily reflect any particular individual. Using these
generic estimates may therefore deviate considerably when applied to a given
individual, with potentially poor and dangerous treatment outcomes as result.
CA 03001448 2018-04-06
WO 2017/061943
PCT/SE2016/050966
11
To mitigate this situation, some additional heuristic rules-of-thumb have been
derived. In terms of how to determine the total glucose-lowering effect¨the
insulin sensitivity factor (ISF)¨different formulas exist, but the most widely
used is the so-called the 100-rule (or 1800-rule if the mg/di scale is used).
This rule suggests that the ISF can be calculated by dividing 100 by the
amount of the total daily insulin dose (TDD). Recently these rules were
revised by the originators with slight adjustments to the 100-rule (one author
suggests using 109 and the other to use 95). Again, this rule is generic and
generally produces poor estimates, and many patients complement this rule
by estimating the ISF from personal experience, e.g., from occasional
correction boluses. In terms of determining the duration of the metabolic
effect no existing method is available. For patients who look for guidance to
healthcare professional organizations online often encounter quite short
suggested duration of the insulin action, despite that numerous clamp studies
suggest that the duration may be up to 8 hours. The American Diabetes
Association (ADA) online patient information suggests that the rapid acting
insulins peak in about an hour and that the total duration is 2-4 hours.
National Institutes of Health (NIH) suggests a peak somewhere between 30
and 90 minutes and a total duration of 3 to 5 hours. Group HealthCare, a non-
profit member-owned healthcare organization based in Seattle, suggests a
peak at 90 minutes and a total duration of 3 hours. Joslin Diabetes Center
advices 30 min - 3 hour peak and a total duration of 3-5 hours. Similar
information is provided by NovoNordisk; maximum effect in-between 1 and 3
hours and a total duration of 3-5 hours.
Apparently there is quite a spread in the suggested duration and this
reflects the variability in the population, as different clamp studies have
suggested. However, for the individual the insulin action duration as well as
the shape thereof, are crucial parameters to determine. The shape
determines the glucose-lowering effect for each time sample of the total
duration from the time point of injection until the time point when the effect
is
CA 03001448 2018-04-06
WO 2017/061943
PCT/SE2016/050966
12
no longer detectable. Mismatch between the expected duration and shape
and the true effect and corresponding true shape may result in, e.g., stacking
of doses and unexpected hypoglycemia.
The shape of the insulin action is equivalent to a functional description
of the dynamic glucose-lowering effect over time of a subcutaneously
administered injection of a predefined amount of insulin.
Many modern insulin pumps, as well as some glucose meters, offer
decision support systems (DSS) for insulin therapy to the user in the form of
so-called bolus guides. These calculators can be used to determine insulin
doses based on the current glucose level, a treatment target, the insulin
sensitivity factor and the amount of remaining insulin from previous
injections.
In these systems, the user may select the insulin sensitivity factor, e.g. by
the
rule presented above, as well as the duration of the insulin action.
The shape of the insulin action profile is sometimes linear, i.e., the
glucose-lowering effect is considered constant over the active period, and in
some cases a nonlinear curve is used to better reflect the glucose-lowering
effect over the action period. As stressed above, neither the magnitude of the
glucose-lowering effect nor the dynamics thereof are properly determined for
each individual with the currently available methods, reducing the efficacy of
these decision supports.
The present invention relates to determining patient-specific
physiological and pharmacokinetic parameters related to the glucose-lowering
effect of insulin from data collected from said individual, and how to utilize
these parameters to improve the insulin therapy outcome. Specifically, the
invention discloses a method of how to estimate the insulin sensitive factor
for
a given person and insulin type, as well as the duration and shape of the
glucose-lowering effect. Furthermore, the method also provides an estimate
of the insulin requirement for this person at different time instances or
occasions. Using these calculated estimates together with recent glucose
measurements for example in a computer or any other device with calculating
CA 03001448 2018-04-06
WO 2017/061943
PCT/SE2016/050966
13
capabilities, the future glucose level may be simulated hours in advance.
Thus, the method may be used to warn the patient of impeding dangerous
low or high glucose values, and different therapy adjustments may be
simulated in advance. The description below is based upon that health related
data have been collected from an individual treated with insulin and made
available, preferably in a digital format. The health related data may cover
one or more of: insulin injections of the different insulin types the
individual
uses, glucose readings from a personal glucose meter and/or continuous
glucose sensor or from any other means to measure the capillary, venous or
interstitial glucose level. All glucose readings will hereafter be referred to
as
simply 'glucose'.
In an embodiment of the present invention, the insulin action can be
estimated from a record including N different sections of combined insulin
dose and glucose data from an individual. An example of collected data can
be seen in Fig. 1. These data sections may represent different time frames,
e.g. each section represents a specific time section of the day and the entire
record covers such sections from couple of weeks or months of data.
A black-box Finite Impulse Response (FIR) model is considered to
describe the insulin action, allowing for heterogeneous effects of the insulin
action across the glucose range, i.e., higher or lower glucose-lowering effect
depending on the current glucose level. However, the fasting glucose
dynamics depends on internal dynamics, related to the hepatic glucose
production and fasting metabolism, as well as the externally provided insulin.
In this approach, this was summarized into a total net basal endogenous
glucose production Gb in fasting state. In total, the glucose dynamics during
fasting at time point tk after may then be described as
y(- E ,,,(y(tk)(i))1(ta_i) 4-
(1)
(4)
(4 -uf tk), ik ET)
CA 03001448 2018-04-06
WO 2017/061943 PCT/SE2016/050966
14
where /(tk) represents the insulin infusion and y(tk)w is the glucose level at
time sample tk in section j, v(tk) ¨ N(0, o-v) corresponds to a process noise
perturbation, with variance av2, and Ti represents the time instances in data
set j, and where the impulse-response model parameters a = [al, a2 an]
have a glucose dependence. The sampling interval is generally five minutes,
but other sampling schemes may also be considered. To estimate the model,
e.g., locally-weighted least squares using a quadratic Epaneichnikov kernel or
some other kernel may be employed.
In order to keep the estimate smooth, e.g., second-order regularization
may also be considered, utilizing e.g. a Gaussian prior for Gb. To reduce the
model size, the parameters may be regularized by the 1-norm. To fulfill the
physiological requirements of glucose-lowering response to insulin, the
parameters are constrained to non-positive numbers, and the start and end of
the insulin action are enforced to zero. For each glucose level G of interest,
the following optimization problem is solved to retrieve the parameter
estimates; a = [ao,ai an] and Gb = 1Gb(1) .Gb(N) .1 using N periods of
data.
fa(G), Gil = .arg nail y(j) kst, +
j=
¨
131. Gik 12) (2)
subject to
0õ k= .1., , ,n ¨111
ao = 0
aõ = 0
(3)
and where the second-order regularization matrix R is populated as follows:
(4)
CA 03001448 2018-04-06
WO 2017/061943 PCT/SE2016/050966
r(j) .......... [Y Y 1
¨ IJ = = r
Here, = - is the
collected glucose data for data record j
- -
--
covering sample times Ti IC, and ¨ YH, is the
corresponding estimate according to Eq. (1). e is the quadratic kernel matrix
defining the weight of each glucose measurement according to the distance
5 to the glucose level G. Gb is the prior expected value estimate of Gb,
and a,
and y are penalty terms. An example of the insulin action can be seen in Fig.
2 and the Gb is exemplified in Fig. 3.
The total stationary glucose-lowering effect, the insulin sensitivity factor
KISR at a given glucose level yb is then:
= -4 = KiSR(A)
10 (5)
It is also possible to calculate the mean insulin sensitivity factor over
the nG different glucose values.
K
(6)
The mean value may be used as a useful approximation of the
15 glucose-lowering effect independent of the glucose value. Likewise, the
finite
impulse response parameters may also be averaged over the glucose range
to get a glucose independent insulin action curve.
"
' (7)
For an example se Fig. 4.
The estimation may be undertaken anew when new data has been
collected, thereby assuring that the estimates are up to date. The frequency
of re-estimation may vary depending on data availability, clinical practice,
and
personal conditions. The steps have been summarized in Fig. 5.
The estimates may be used for decision support for insulin bolus dose
calculation for both insulin pump and insulin pen therapy. In a bolus
CA 03001448 2018-04-06
WO 2017/061943
PCT/SE2016/050966
16
calculator, the suggested bolus dose D at time T (rounded to closest 5 minute
interval) needed to reach the glucose target Gt, considering m previous doses
D1 (j=1...n) taken at time point Ti within the time frame of the insulin
action is
calculated as:
G Gt r srl, = D T-1
D = Ma*. _____________________________
sR (8)
where DIOB is the amount of active insulin remaining from the previous doses:
T ¨T
=
Kisn
j=1 (9)
The calculated values may be available in an insulin pump, a glucose meter,
in a receiver unit for a continuous glucose meter, in smartphones, tablets,
computers or other devices that may be used to display information to a user.
In an embodiment of the present invention the method described may
be used to get estimates of Gb, which describe the underlying basal insulin
requirement. The estimates may reveal diurnal patterns, day-to-day variations
and variations over longer trends. This information may prove useful in
clinical
practice to enable long-term trend analysis of the patient's health condition,
understanding of drivers of glucose variability and barriers to achieving
treatment targets, and ultimately a tool for evaluation of changes to the
current therapy plan. Paired with monitoring of physical activity, correlation
analysis may be undertaken to find causality connections between the level of
physical activity and the effect on insulin requirement, thereby enabling
preventive action to be undertaken, e.g. to temporarily reduce the insulin
doses or reprogram the basal dose regime to avoid hypoglycemic events.
These estimates may be made available in analysis software in a computer,
smartphone, tablet or other devices that may be used to display information to
a user.
In an embodiment of the present invention the method may also be
used to assess the risk of developing hypo- or hyperglycemia in the near
CA 03001448 2018-04-06
WO 2017/061943 PCT/SE2016/050966
17
future. Considering the recent insulin dosage and glucose history, and a prior
Gb , a posterior estimate of a scalar Gb for this time period is calculated by
maximizing the likelihood p(GblY,I,GO, where Y = 1)/7--k ... y71 is the recent
glucose history at time T looking k sampling steps back, and i= /71 is
the corresponding recent insulin usage history. Depending on the distribution
of the prior, a closed form expression may exist for the estimate. Otherwise,
e.g. sequential Monte Carlo methods may be applied. Then, assuming the
patient will follow the planned basal regime and based on new glucose
measurements yr, the expected glucose trace for the coming hours may be
calculated by applying, e.g., a Kalman filter:
1)414 = ¨ +
(10)
114+ ift1,14: >. ai(v(tki))1..(ik_i.). Gbx
(1 1 )
okõ,, 1 < p
(12)
i)t = liv
Where is the measurement
update, - is the time update, and
tk+j is the predicted value one step ahead, and a is the Kalman
filter constant.
The normal glycemic range is defined by an upper and lower limit. If
the simulated value falls outside these predefined thresholds, alarms are
issued to notify the user of the impeding hypo- or hyperglycemia to allow for
preventive actions to be taken. To guide the user, suggestions of suitable
actions to mitigate the situation may also be provided. These suggestions
may be based on reducing or increasing the basal insulin delivery (for insulin
pump users) or reduced basal dose (for insulin pen users), and in the case of
hyperglycemia of additional correction bolus doses is=i17-.../7-4, where is is
CA 03001448 2018-04-06
WO 2017/061943
PCT/SE2016/050966
18
the suggested insulin dose at the time point of calculation (sample number T)
and L(p) samples ahead, according to the following optimization routine:
min Crir ¨ YR
Is (13)
Subject to
>11., T 4- Ll (14)
where C is a convex cost function, Y = fin- ... 1/74 if is the simulated
glucose
trace, YR= [yR yR] is a vector the same size as Y of the target glucose
value yR, and where the constraint strictly enforces that no hypoglycemia may
occur (hypoglycemic threshold pow). An example is found in Fig. 6. If no
solution is found due to constraint violation (infeasible problem), the user
is
informed of this and no insulin dose suggestion is provided. Such a warning
algorithm may be utilized in an insulin pump, a glucose meter, in a receiver
unit for a continuous glucose meter, in smartphones, tablets, computers or
other devices that may be used to display information to a user.
In yet another embodiment of the present invention the warning
algorithm may be extended to not only deliver alarms, but also to allow for
the
user to simulate the effect of changes to the insulin therapy on the expected
glucose trace for the coming hours by exchanging the insulin doses /with the
new planned /new in Eq (11) and (12). Thereby the user may assess the risk of
different treatment scenarios at his/her own discretion.
In yet another embodiment of the present invention the estimated
values may be used in an algorithm to reduce or shutoff insulin delivery in an
insulin pump. When the predicted glucose value falls below the predefined
hypoglycemic threshold with the current therapy plan as calculated by Eq.
(10-12), the insulin delivery may be reduced or completely shut off as
determined by performing an optimization according to Eq (13-14).
The method described above is not in any way limited to the use of
insulin. Dose calculations for other drugs, self-medicated or not, may also
benefit from this method to understand the dose response better and thereby
CA 03001448 2018-04-06
WO 2017/061943
PCT/SE2016/050966
19
enable better tailored doses to each individual. In these cases, the variable
correspondences in the equations above are exchanged accordingly, as
obvious to someone skilled in the art.
The present invention, as described by the different embodiments in
conjunction with equations 1 to 14 above, may also be implemented in a
system or device for controlling insulin delivery to a patient. Such a system
or
device may for instance be an insulin pump, a glucose meter, a receiver unit
for a continuous glucose meter, a smartphone, a tablet, a computer or any
other device that may have the capability to display information to a user and
perform the necessary measurements and calculations described in
conjunction with equations 1 to 14 in the above text. Many modern insulin
pumps, as well as some glucose meters, offer decision support systems
(DSS) for insulin therapy to the user in the form of so-called bolus guides.
These calculators can be used to determine insulin doses based on the
current glucose level, a treatment target, the insulin sensitivity factor and
the
amount of remaining insulin from previous injections. In these systems, the
user may select the insulin sensitivity factor, e.g. by the method presented
in
equations 1 to 14, as well as the duration of the insulin action.
According another aspect of the disclosure, a computer implemented
method for managing blood glucose is provided. The method comprises the
step of estimating the required insulin dosage needed, during different time
intervals, to achieve normoglycemia. The computer implemented method
further comprising the step of calculating the sensitivity factor of the drug
according to Eq. (6) and the shape and duration of the drug action according
to Eq. (7). Finally, comprising the step of calculating a dose according to
Eq.
(8) and (9) based on the sensitivity factor, the shape and duration of the
drug
action, information about previous doses, the current biomarker level and
target biomarker level.
The terminology used herein is for the purpose of describing particular
embodiments only and is not intended to be limiting of the invention. As used
CA 03001448 2018-04-06
WO 2017/061943
PCT/SE2016/050966
herein, the singular forms "a", "an" and "the" are intended to include the
plural
forms as well, unless the context clearly indicates otherwise. It will be
further
understood that the terms "comprises" "comprising," "includes" and/or
"including" when used herein, specify the presence of stated features,
5 integers, steps, operations, elements, and/or components, but do not
preclude the presence or addition of one or more other features, integers,
steps, operations, elements, components, and/or groups thereof.
Unless otherwise defined, all terms (including technical and scientific
terms) used herein have the same meaning as commonly understood by one
10 of ordinary skill in the art to which this invention belongs. It will be
further
understood that terms used herein should be interpreted as having a meaning
that is consistent with their meaning in the context of this specification and
the
relevant art and will not be interpreted in an idealized or overly formal
sense
unless expressly so defined herein.
15 The
foregoing has described the principles, preferred embodiments
and modes of operation of the present invention. However, the invention
should be regarded as illustrative rather than restrictive, and not as being
limited to the particular embodiments discussed above. The different features
of the various embodiments of the invention can be combined in other
20 combinations than those explicitly described. It should therefore be
appreciated that variations may be made in those embodiments by those
skilled in the art without departing from the scope of the present invention
as
defined by the following claims.
This model according to Eq (1) can be extended with another FIR
model, which represents the net glucose-elevating effect, the meal impact,
following a meal. By incorporating the insulin gain A, the glucose dynamics at
time point tk, during meal instance j, may then be described as:
CA 03001448 2018-04-06
WO 2017/061943 PCT/SE2016/050966
21
Atk)(1) = .Atik-1)(1) 4- A j :a.1(y(tk)(1))44-1)
i=0
/le) 01_4) G + v(tk), tk
= -
r i=0
(15)
where 1(tk) represents the insulin infusion, Mr(tk) is the meal intake in
grams of
carbohydrates in recipe r, and y(tk) is the glucose level at time sample tk,
v(tk)
N(0,o-v) corresponds to a process noise perturbation, with variance o-v2, and
Ti represents the time instances in dataset j. The meal impact parameters
br=[bri, br2 ...brd are fixed for each recipe. In order to fulfill
physiologically
qualitatively correct responses, constraints were imposed on the FIR
parameters. Just as the parameters of the insulin action FIR were restricted
to
non-positive numbers, the parameters of the meal impact model were
restricted to non-negative numbers. A recipe is a unique combination of
ingredients, and may denote a single ingredient. Also note that the recipes
are specific to an individual (i.e., two persons eating a banana constitutes
two
different recipes). The net basal endogenous glucose production Gb and the
insulin multipliers are allowed to vary between different meal instances to
capture variations in insulin sensitivity. The insulin action model was
considered fixed with the parameter values given by the estimation of that
model. To estimate br, Gb=[Gb(1) GO)]
and A = [A(1) ... AN] for N number of
meal instances, a maximum-likelihood approach is considered. The total
likelihood for the entire dataset from all the meal instances is:
, I, Mrõ Gbõ ..4, b) p(Y Gt*õ A, b) - p(b)
AY (1 6)
where Y = ynoL
yi(N)_ y(N)] is the concatenated glucose reference
for all meal instances. We would like to maximize this in order to retrieve
our
parameter estimates. Different priors may be utilized as deemed appropriate.
One method among others, a Gibbs sampler, where samples are drawn in an
CA 03001448 2018-04-06
WO 2017/061943 PCT/SE2016/050966
22
iterative scheme from the conditional distributions may be used to retrieve
the
parameter estimates:
(Gb, "OM),f :q
(17)
0-)
where k is the sampling index and is
the meal impact vector without term
bi. When a sufficient number of samples have been collected the expected
values can be retrieved. A suitable number of iterations may be determined
by someone skilled in the art. The samples are restricted to positive numbers
to fulfill the physiological constraints.Using the augmented model, the
glucose
may be predicted, using the same notation as in Eq (10-12,15):
11414 = 1 alit
¨ + (18)
94:4- = fit + Yai(VA))/(4---i) G $
- (19)
= jitk 1.
na
-4_ V V br. uNt
s At-0
G6,T, < < p
(20)
Likewise, Eq (13-14) may be updated with the augmented model according to
Eq (15) to recommend doses.