Note: Descriptions are shown in the official language in which they were submitted.
SYSTEM AND METHOD FOR REAL TIME ASSAY MONITORING
[0001]
FIELD OF THE DISCLOSURE
[0002] The present disclosure generally relates to systems and methods for
real
time assay monitoring. More particularly, the present disclosure relates to
systems
and method for utilizing real time assay monitoring for quality control,
repeat testing
and reflex testing before sample preparation is completed.
BACKGROUND
[0003] An assay is an analytical procedure that can be performed to measure
one
or more properties associated with a biological specimen, for example, and
array of
molecules, a tissue section or a preparation of cells. In some assays,
specimens
may be processed for analysis by applying one or more fluids to the specimens.
For
example, microscope slides bearing biological specimens may be treated with
one or
more dyes or reagents to add color and contrast to otherwise transparent or
invisible
cells or cell components. lmmunohistochemical (IHC) and in situ hybridization
(ISH)
assay staining procedures can be used to process tissue specimens and provide
information regarding the presence, location and/or amount of particular
molecules in
a sample.
CA 3007159 2019-11-08
CA 03007159 2018-06-01
WO 2017/114749
PCT/EP2016/082377
- 2 -
[0004] Assay and platform development as well as commercial assay testing can
be
costly in terms of time and resources, particularly when tests fail and must
be
repeated. Currently, tissue staining quality of a specimen undergoing an assay
is
evaluated by a pathologist only after the assay is completed, and the
pathologist
does not have any access to the slide before the specimen leaves the assay
processing platform. This process can take up to 13 hours for ISH assays.
During
assay and platform development, the same experimental conditions can be
repeatedly performed to produce results, which then are evaluated by a
pathologist,
again, only after the assay is completed, to ensure consistent outcomes for
the
assays. Information about where and when any failures in the staining process
occurred is unknown to the pathologist, and platform developers are left to
run entire
batteries of assays to find the root cause of failures that need to be fixed.
[0005] Laboratories could use a solution that addresses the limited
availability of
stain quality control information during sample processing so that should
problems
arise, a new test could be started or a precious sample could be rescued by
performing some remedial procedure. Additionally, it would be advantageous if
assays could be monitored such that they are not run longer than needed, or
even
better, if preliminary results could be made available prior to assay
completion.
Preliminary results not only could allow laboratories to improve efficiency by
running
tests only as long as needed, but could also permit a laboratory (or
healthcare
provider) to order/start additional tests indicated by such preliminary tests
results.
Patients that depend on complete test results for diagnoses of their
conditions are
also appreciative of a faster time to first result, and thankful to avoid the
need to
provide an additional sample for testing, assuming that is even possible.
CA 03007159 2018-06-01
WO 2017/114749
PCT/EP2016/082377
- 3 -
SUMMARY
[0006] The present disclosure is directed to digital pathology tools that
provide
electronic results of assay outcomes and stain quality, which in some
embodiments
is provided early in the assay such that problems can be addressed and/or new
samples can be started much sooner than if the sample requires a read by a
pathologist to determine test quality. In one embodiment, a digital pathology
tool can
include a real time monitoring system with automated scoring that can score
the
slides from an assay. In a particular embodiment, the real time monitoring
system
can provide a "saturation index," which is a score that correlates to a signal
intensity
score. By providing the saturation index in real time, the real time
monitoring system
can be used to evaluate assay quality in real time while the assay is
occurring. The
generation of the saturation index can be automated in the real time
monitoring
system and used for various assay monitoring applications, such as the
monitoring of
assays with various protocols, while the assays are occurring. In addition,
the results
of assay outcome can be obtained in real time, before the assay is complete,
the
slide is "coverslipped," and then examined by a pathologist.
BRIEF DESCRIPTION OF THE DRAWINGS
[0007] The patent or application file contains at least one drawing executed
in
color. Copies of this patent or patent application publication with color
drawings(s)
will be provided by the Office upon request and payment of the necessary fee.
[0008] FIG. 1 schematically shows an embodiment of a real time assay
monitoring
system.
[0009] FIG. 2 shows an embodiment of an imaging system and a sample
processing system for the real time assay monitoring system depicted by FIG.
1.
CA 03007159 2018-06-01
WO 2017/114749
PCT/EP2016/082377
- 4 -
[0010] FIG. 3 schematically shows an embodiment of a controller for the real
time
assay monitoring system depicted by FIG. 1.
[0011] FIG. 4 shows an exemplary image used for boundary detection.
[0012] FIG. 5 shows another exemplary image used for boundary detection.
[0013] FIG. 6 shows an embodiment of a process for determining an amount of
adjustment fluid for an assay.
[0014] FIG. 7A shows a first position for the fluid in the system of FIG. 2.
[0015] FIG. 7B shows a second position for the fluid in the system of FIG. 2.
[0016] FIG. 7C shows a third position for the fluid in the system of FIG. 2.
[0017] FIG 7D shows a fourth position for the fluid in the system of FIG. 2.
[0018] FIG. 8 shows an exemplary screenshot of a graphical user interface
(GUI)
displayed by a real time adjustment system.
[0019] FIG. 9 shows an embodiment of a process for monitoring an assay.
[0020] FIG. 10 shows an embodiment of an HSV color model.
[0021] FIG. 11 shows an embodiment of a captured image with a region of
interest selected.
[0022] FIG. 12 shows an embodiment of matrix values corresponding to the
region of interest in FIG. 11.
[0023] FIG. 13 shows an exemplary graph of a correlation between signal
intensity
scores and saturation indexes.
[0024] FIG. 14 shows an exemplary graph of a correlation between signal
intensity
scores and value indexes.
[0025] FIG. 15 shows an exemplary graph of the saturation index of a specimen
over time.
[0026] FIG. 16 shows another exemplary graph of saturation index of a specimen
over time.
CA 03007159 2018-06-01
WO 2017/114749
PCT/EP2016/082377
- 5 -
[0027] FIG. 17 shows an embodiment of an image analysis process for monitoring
staining in a system.
[0028] FIG. 18 shows an example of the results for several different schemes
of
color space conversion followed by conversion to grayscale.
[0029] FIG. 19 shows a comparison of several schemes of color space conversion
followed by conversion to grayscale.
[0030] FIG. 20 shows a comparison of results obtained using a disclosed
automated real-time method for stain intensity scoring based on saturation
with
intensity scoring through visual pathological scoring
[0031] FIG. 21 shows a comparison results obtained using a disclosed automated
real-time method for stain intensity scoring based on color space conversion
and
grayscale conversion with intensity scoring through visual pathological
scoring
[0032] FIG. 22 shows a disclosed grayscale intensity index vs. antibody
incubation
time.
[0033] FIG. 23 shows a disclosed automated method for real-time calculation of
percent positive cells for a CD20 IHC assay.
[0034] FIG. 24 shows a disclosed automated method for real-time separation of
different stain colors in a multiplexed assay.
[0035] Wherever possible, the same reference numbers are used throughout the
drawings to refer to the same or like parts.
DETAILED DESCRIPTION
[0036] The present application generally pertains to a real time assay
monitoring
system (RTAMS) that can monitor fluid volume in assays for volume adjustment
control, monitor stain process quality in real-time, and/or output test
results in real-
time. In one embodiment, the disclosed system includes a real time imaging
system
to obtain images of a sample undergoing a processing step (such as staining,
de-
CA 03007159 2018-06-01
WO 2017/114749
PCT/EP2016/082377
- 6 -
staining, bluing or differentiation) to calculate a saturation index that
correlates to a
signal intensity score. The RTAMS can use the calculated saturation index to
monitor the signal intensity of assays in real time and predict assay outcomes
before
they are complete. The imaging system in the RTAMS can be used to measure the
on-site fluid volume with the specimen to control the system to overcome any
fluid
evaporation issues that may occur in an assay process. The imaging system in
the
RTAMS can also be applied, for example, to monitor an assay by tracking
changes in
tissue color(s) and other image based characteristics to predict assay
outcomes or
results. With the capability to monitor an assay while the assay is ongoing,
the
RTAMS can be a developmental tool to develop new reagents, assays, or
platforms.
Tissue, slide and stain quality can also be tracked in real time for quality
assurance,
and users alerted early in the process such that remedial measures can be
taken.
Furthermore, the RTAMS can function as a diagnostic tool, enabling and
supporting
early digital reporting of patient results before an assay is complete, and
even
ordering repeat or reflex tests based on the results as they develop. The
RTAMS
may also serve as a digital pathology tool to support early electronic
reporting of
assay results and in some embodiments could replace the use of scanners used
for
analysis of completed assay results.
[0037] One aspect of the certain embodiments of the disclosed system and
method is the ensuring of stain quality by monitoring and controlling assay
outcomes.
[0038] Another aspect of the certain embodiments of the disclosed system and
method is the ability to provide a faster result of stain quality in real time
before the
assay is complete, and permit remediation of any quality issues by alerting a
user to
possible quality issue, or even to automatically order a second test so that
ordering
CA 03007159 2018-06-01
WO 2017/114749
PCT/EP2016/082377
- 7 -
such a test does not require a delay in time for a pathologist to read the
test results
and request the test due to quality issues evident in a finished assay.
[0039] Another aspect of certain embodiments of the disclosed system and
method
is the ability to optimize newly developed reagents, assays, and platforms to
provide
assay protocols that take less time or that can be automatically stopped when
sufficiently developed, thereby shortening assay time "on-the-fly."
[0040] Other features and advantages of various embodiments of the disclosed
system and method will be apparent from the following more detailed
description of
the identified embodiments, taken in conjunction with the accompanying
drawings
which show, by way of example, the principles of the disclosure.
[0041] FIG. 1 shows an embodiment of a real time assay monitoring system 10.
The system 10 includes a controller 12 that can be used to control an imaging
system 15 and a sample processing system 21. In one embodiment, the sample
processing system 21 can use a thin-film technology with low fluid volumes,
however,
in other embodiments, the sample processing system 21 can use "puddle"
technology wherein reagents are applied directly onto substrates, such as
slides, on
which a tissue or cell sample is placed. In one embodiment as shown in FIG. 1,
one
controller 12 can be used to control all of the components of the imaging
system 15
and the sample processing system 21. However, in other embodiments, the
controller 12 can include more than one controller controlling one or more
components of the imaging system 15 and/or the sample processing system 21.
The
controller 12 (and other distributed controllers) can be connected to the
imaging
system 15 (which can include a camera 14, and one or more of a front light
source
16 and a back light source 18) and the sample processing system 21 (which can
include, for example, one or more of a fluid motion mechanism 20, a fluid
exchange
system 22 and a fluid dispense system 24) by a network. In one embodiment, the
CA 03007159 2018-06-01
WO 2017/114749
PCT/EP2016/082377
- 8 -
network connecting the controller 12 and the imaging system 15 and the sample
processing system 21 can be a local area network (LAN) that uses an Ethernet
protocol to communicate over the network. However, in other embodiments, the
network may be the Internet, an Intranet, a wide area network (WAN), or any
other
type of communication network using one or more communication protocols such
as
the transmission control protocol/Internet protocol (TCP/IP) when using the
Internet.
In a further embodiment, the camera 14 can be connected to controller 12 using
a
GigE vision interface, but the camera 14 can, in other embodiments, be
connected to
the controller 12 using other types of interfaces, such as a USB vision or
Camera
Link interface. In still another embodiment, the controller 12 can connect
with other
controllers and workflow control software system solutions, for example, to a
user
alert system 26 or an automated test ordering system 26. The controller 12 can
further connect and interface with other Internet applications and imaging
applications.
[0042] FIG. 2 shows a particular embodiment of an imaging system 15 and a
sample processing system 21 of a real time assay monitoring system 10 of FIG.
1.
The imaging system 15 can include a camera 14 and a front light source 16 and
a
back light source 18 as shown in FIG. 2. However, in other embodiments, the
imaging system 15 can include more than one camera 14, more than one front
light source 16 and more than one back light source 18. In one embodiment,
some or all of the components of the imaging system 15 can be mounted on the
sample processing system 21. The imaging system 15 can be used to illuminate
and capture images of one or more samples in the sample processing system 21.
The sample processing system 21 can include a fluid motion mechanism 20 to
move fluid in the sample and a fluid exchange system 22 that has a fluid
dispenser
24 (see FIG. 1, not shown in FIG. 2) to add fluid to the sample and a fluid
removal
- 9 -
device (not shown)to remove fluid from the sample, which together function as
a
fluid exchange system 22 (as depicted in FIG. 1). In one embodiment, the fluid
motion mechanism 20 can include a roller. However, in other embodiments, the
sample processing system may not include a fluid motion mechanism 20. The
fluid motion mechanism 20 (schematically shown in FIG. 2) can include one or
more staining cassettes (not shown) having one or more samples 50 undergoing
an assay. In other embodiments, the sample processing system 21 can include
more than one fluid motion mechanism 20 and more than one fluid exchange
system 22. Examples of sample processing systems that can be used with the
present application are described in commonly-assigned U.S. Patent Application
Publication No. 2015/0323776, entitled "Specimen Processing Systems and
Methods for Holding Slides" and published on November 12, 2015 and commonly-
assigned U.S. Patent No. 8,883,509, entitled "Apparatus and Method for
Biological
Sample Processing" and granted on November 11, 2014.
[0043] Each of the samples 50 held by cassettes in the sample processing
system
21 can include a slide 52 holding one or more specimens 54 to be analyzed by
the
assay. The sample 50 shown in FIG. 2 is a schematic representation of an assay
sample used to show the components in the sample and is not intended to
provide
any details on the relative sizes of the components. One or more fluids 56,
such as
reagents and/or stains, can be applied to and/or removed from the specimen 54
with
the fluid exchange system 22. In one embodiment, the reagents and/or stains 56
can include, but are not limited to, antibody diluent, protease 3, reaction
buffer,
system fluid, HRP (horseradish peroxidase) inhibitors, antibodies, HQ linker,
HRP
multimers, H202, DAB (3,3'-Diaminobenzidine), copper reagent, Hematoxylin
(HTX),
probe reagent and bluing reagent. A cover 58 can then be placed over the
specimen
CA 3007159 2019-11-08
CA 03007159 2018-06-01
WO 2017/114749
PCT/EP2016/082377
-10-
54 and the reagent and/or stain 56. In one embodiment, the cover 58 can be a
clear
or translucent solid plastic or acrylic, but may have different color tints,
e.g., a yellow
tint, in other embodiments. In a further embodiment, the cover 58 can also be
a clear
fluid.
[0044] The camera 14 can be placed a predetermined distance (d) above the
sample 50 such that the sample 50 is within the field of view (FOV) of the
camera 14.
In one embodiment, the camera 14 can be an area scan camera with global
shutter
to prevent the distortion of the moving object, i.e., the reagent and/or stain
56.
However, other types of cameras can be used in other embodiments.
[0045] The camera 14 can be a 1600 x 1200 pixels (2 megapixel, 2MP) camera
with a 35 mm fixed focal length lens that has a field of view of 988 x 740 mm
with
about 61.25 pm/pixel resolution. However, in other embodiments, the camera 14
can
have greater than or less than 2 megapixels, a fixed focal length lens that is
greater
than or less than 35 mm, a field of view that is greater than or less than 988
x 740
mm, and/or a resolution that is greater than or less than about 61.25
pm/pixel. In still
another embodiment, the camera 14 can have a pixel scale (or resolution) of
0.16
mm or lower. In a further embodiment, the camera 14 can use a 50mm fixed focal
length lens with a smaller FOV but a higher resolution.
[0046] The predetermined distance for placement of the camera 14 above the
sample 50 can be based on the resolution of the camera 14 and the number of
samples 50 to be captured in the field of view of the camera 14. In one
embodiment,
the predetermined distance can be 19.5 inches to capture three samples 50.
However, other predetermined distances can be used in other embodiments. In
another embodiment, if more than three samples 50 are to be captured, a camera
14
can use a pixel array with an increased size and a lens with a decreased focal
length
to maintain the same image quality.
CA 03007159 2018-06-01
WO 2017/114749
PCT/EP2016/082377
- 11 -
[0047] The front light source 16 and the back light source 18 can each
generate
white light that is used to illuminate the sample 50. In some embodiments, the
front
light source 16 and/or the back light source 18 can be assembled into a lamp
for use
with a lighting fixture. As an example, the light source may be implemented by
an
incandescent bulb, a light emitting diode (LED), or a fluorescent light. Yet
other types
of light sources and types of light are possible in other embodiments. As
shown in
the embodiment of FIG. 2, the front light source 16 can be positioned in the
field of
view of the camera 14 and direct light (L1) toward one side of the sample 50,
while
the back light source 18 can be positioned outside of the field of view of the
camera
14 and direct light (L2) toward the opposite side of the sample 50. In other
embodiments, one or both of the front light source 16 and the back light
source 18
can be either within or outside of the field of view of the camera 14.
[0048] FIG. 3 shows an embodiment of the controller 12. The controller 12 can
include logic 31, referred to herein as "controller logic," for generally
controlling the
operation of the controller 12, including communicating with the imaging
system 15
and the sample processing system 21. The controller 12 also includes a volume
estimator 37 to determine the amount of fluid, e.g., reagent and/or stain 56,
being
used with a sample 50, an image analyzer 33 to analyze the images from the
imaging system 15, and a dispenser volume calculator 35 to determine how much
reagent and/or stain 56 to apply to the sample 50 with the fluid exchange
system 22
based on information from the volume estimator 37. The controller logic 31,
the
image analyzer 33, the dispenser volume calculator 35 and the volume estimator
37
can be implemented in software, hardware, firmware or any combination thereof.
In
the controller 12 shown in FIG. 3, the controller logic 31, the image analyzer
33, the
dispenser volume calculator 35 and the volume estimator 37 are implemented in
software and stored in memory 38 of the controller 12. Note that the
controller logic
CA 03007159 2018-06-01
WO 2017/114749
PCT/EP2016/082377
- 12 -
31, the image analyzer 33, the dispenser volume calculator 35 and the volume
estimator 37, when implemented in software, can be stored and transported on
any
non-transitory computer-readable medium for use by or in connection with an
instruction execution apparatus that can fetch and execute instructions.
[0049] The controller 12 can include at least one conventional processing
element
40, which has processing hardware for executing instructions stored in memory
38.
As an example, the processing element 40 may include a central processing unit
(CPU) or a digital signal processor (DSP). The
processing element 40
communicates to and drives the other elements within the controller 12 via a
local
interface 42, which can include at least one bus. Furthermore, an input
interface 44,
for example, a keypad, keyboard or a mouse, can be used to input data from a
user
of the controller 12, and an output interface 46, for example, a printer,
monitor, liquid
crystal display (LCD), or other display apparatus, can be used to output data
to the
user. Further, a communication interface 48 may be used to exchange data over
one or more networks with, for example, the front light source 16, the back
light
source 18, the camera 14, the fluid motion mechanism 20 and the fluid exchange
system 22.
[0050] The imaging system 15 can be used to obtain quality images of the
sample
50 for image analysis, volume calculation, and assay sensing. In one
embodiment,
the camera 14 can have sufficient resolution (or distance per pixel) and
contrast to
capture the fluid edge and the specimen 54 in the sample 50. In other
embodiments,
the camera 14 can have higher resolution, i.e., a lower distance per pixel,
and a lens
with a smaller field of view to capture images of the sample 50 in more
detail. The
imaging system 15 can be used for fluid volume sensing. When sensing or
measuring fluid volume, the imaging system 15 can use the front light source
16 and
the back light source 18 to make the fluid boundaries bright so that the
controller 12
CA 03007159 2018-06-01
WO 2017/114749
PCT/EP2016/082377
- 13 -
can differentiate the fluid, e.g., reagent and/or stain 56, from the specimen
54 in the
background, even when the specimen 54 has a color associated with it. In one
embodiment as shown in FIG. 2, the back light source 18 can be placed outside
of
the field of view of camera 14 to provide dark field imaging to make the fluid
boundary or edge in the sample 50 bright, so the fluid edge or boundary has
strong
contrast to the dark and normal background. In addition, by using dark field
imaging,
several other issues such as interference from shadows or a pipette blocking a
light
source can also be resolved. In another embodiment, the front light source 16
and
the back light source 18 can be positioned about the sample 50 to provide
uniform
illumination of the sample 50 so that any determinations by the controller 12
using
images from the imaging system 15 are not biased or skewed by lighting. In a
further
embodiment, bright field imaging can be used by the imaging system 15 by
placing
the front light source 16 in the field of view of the camera 14.
[0051] The real time assay monitoring system 10 can be used as a real time
fluid
adjustment system (RTFAS) to track the fluid, e.g., the reagent and/or stain,
volume
in the sample 50 and determine an amount of fluid to be added to or removed
from
the sample 50, if any, by the fluid exchange system 22. The RTFAS can use the
imaging system 15, the image analyzer 33, the volume estimator 37, the
dispenser
volume calculator 35, the fluid exchange system 22 and a position signal from
fluid
motion mechanism 20. When the fluid motion mechanism 20 signals the controller
12 that it is time to take a measurement, the controller 12 would perform
frame
checking on the image(s) from the imaging system 15 and suggest an adjustment
amount from dispenser volume calculator 35 to fluid exchange system 22,
forming a
feedback control loop. In another embodiment, the adjustment amount from
dispenser volume calculator 35 can be provided to a user interface and a user
can
CA 03007159 2018-06-01
WO 2017/114749
PCT/EP2016/082377
- 14 -
then control the fluid exchange system 22 to provide the reagent and/or stain
56 to
the sample 50.
[0052] In one embodiment of the RTFAS, motion-based foreground detection is
used to detect the boundary of clear fluid and color-thresholding foreground
detection
is used to detect the boundary of a stain or colored reagent, e.g.,
hematoxylin. The
boundary detection methodologies used by the RTFAS can use a distinct feature
of
the fluid (target) for boundary detection and work under various conditions
such as
changing specimen color or the existence of random tissue patterns in the
specimen
54.
[0053] For a clear fluid, motion can be the most distinct feature because the
clear
fluid is the only part moving in the field of view. In one embodiment, a
Gaussian
mixture model foreground detection algorithm can be used by the RTFAS for
boundary detection of a clear fluid. FIG. 4 shows an exemplary image generated
by
the Gaussian mixture model foreground detection algorithm used for boundary
detection. In the Gaussian mixture model foreground detection algorithm, two
boundaries of the fluid droplet (56 of FIG. 2) located on the right and left
of the
droplet can be extracted to calculate the fluid volume.
[0054] To identify the edge or boundary of a stain or colored reagent, e.g.,
hematoxylin, a color-thresholding foreground detection algorithm can be used
because of the distinctive color feature of the fluid. The color-
thresholding
foreground detection algorithm can be used for boundary detection even if the
specimen 54 may get a similar color to the reagent and/or stain 56 during the
staining
process because the intensity of the reagent and/or stain 56 is still much
stronger
than the specimen 54 so that the algorithm can differentiate reagent and/or
stain 56
from the stained tissue of the specimen 54. The color-thresholding foreground
detection algorithm can transfer the captured images from the imaging system
15 to
CA 03007159 2018-06-01
WO 2017/114749
PCT/EP2016/082377
- 15 -
an HSV (hue, saturation, and value) color map (see FIG. 12) for the selection
of the
proper hue range to extract the region of reagent and/or stain 56. FIG. 5
shows an
exemplary image generated by the color-thresholding foreground detection
algorithm
used for boundary detection of the fluid 56 (of FIG. 2) even when the fluid 56
and
tissue sample 54( of FIG. 2) are of similar colors. Using the color-
thresholding
foreground detection algorithm, the area of the reagent can be extracted and
the fluid
volume can be calculated from the extracted area.
[0055] Referring back to FIG. 1, the controller 12 can be connected to the
camera
14 to receive acquired or captured images from the camera 14. The controller
12
can also be connected to a digital I/O device associated with the fluid motion
mechanism 20 to receive a digital signal indicative of the sample position of
the
sample 50 in the staining cassette. With the image and position signal, the
RTFAS
can perform image analysis, error checking, and volume calculation to suggest
a
proper adjustment volume. In one embodiment, the images from the camera 14 can
be captured at the same sample position and then analyzed for consistent
results. In
another embodiment, the image analysis can be performed on either color or
grayscale images.
[0056] FIG. 6 shows an embodiment of a process for determining an amount of
adjustment fluid with an RTFAS. The process begins by configuring the camera
14
(step 102) by setting parameters such as exposure, brightness, and gain. The
I/O
device can then be configured (step 104). After the camera 14 and the I/O
device
have been configured, an image is acquired (step 106) from the camera 14. A
foreground detection algorithm can be applied to the captured image (step 108)
by
the image analyzer 33 to identify fluid boundaries. In one embodiment, the
image
analyzer 33 can be continuously provided with images or video in order to
identify the
image background by machine learning. The image analyzer 33 (see, FIG. 3) can
CA 03007159 2018-06-01
WO 2017/114749
PCT/EP2016/082377
- 16 -
remove any noise from the processed image (step 110). An I/O signal check is
then
made to determine if a signal indicating the proper sample position to make a
fluid
measurement has been received (step 112). If the proper I/O signal has not
been
received, the process returns to step 106 to acquire another image.
[0057] The sample position, as provided by the I/O signal, can be acquired
each
time an image or frame is acquired in step 106 to identify the position of the
reagent
and/or stain 56 in the sample 50 (see FIG. 2). Sample position can be
determined by
the step motor positions in the fluid motion mechanism 20 (of FIG. 1) that
move the
staining cassette and samples 50 and thereby move the reagent and/or stain 56
in
the sample 50. In one embodiment, the step motor positions and corresponding
sample positions can be around +4500, which indicates one end position
corresponding to the reagent and/or stain 56 at the right end of the slide 50
(see FIG.
7B), and -4500, which indicates another end position corresponding to the
reagent
and/or stain 56 at the left end of the slide 50 (see FIG. 7A), from a center
position.
The proper sample position for taking a measurement can be when the reagent
and/or stain 56 is located at the center of the slide 52. FIG. 7C shows the
reagent
and/or stain 56 at sample position 0, which corresponds to the center
position, when
the reagent and/or stain 56 is moving from right to left in FIG. 7C, which
sample
position does not correspond to the reagent and/or stain 56 being in the
center of the
slide 52. Since the reagent and/or stain 56 is moving in the sample 50, the
proper
sample position would be at a predetermined location relative to the center of
the
slide (which corresponds to sample position 0) depending on the direction of
travel
and the viscosity of the reagent and/or stain 56. In one embodiment as shown
in
FIG. 7D, the reagent and/or stain 56 is at the measurement point, i.e., the
reagent
and/or stain 56 is in the center of the slide, at sample position -300, when
the reagent
and/or stain 56 is moving from right to left in the sample 50. The embodiments
CA 03007159 2018-06-01
WO 2017/114749
PCT/EP2016/082377
- 17 -
shown in FIGS. 7A-7D are schematic representations used to show the position
of
the reagent and/or stain 56 relative to sample position and are not intended
to
provide any details on the relative sizes of the components.
[0058] As described above, the reagent and/or stain 56 can be dragging behind
the
center of the sample position, so the measurement should be taken slightly
away
from the central point of the sample position. For example, when acquiring
images at
the central point of the fluid motion mechanism 20, the majority of the
reagent and/or
stain 56 can be on the left-hand side of the central point when the reagent
and/or
stain 56 is travelling to the right and the majority of the reagent and/or
stain 56 can be
on the right-hand side of the central point when the reagent and/or stain 56
is
travelling to the left. In one embodiment, the RTFAS can be used to
characterize the
relationship between the motion of the reagent and/or stain 56 and fluid
motion
mechanism 20, to understand how reagent and/or stain 56 rolls at different
rolling
speed and rolling volume, and to investigate how different reagents with
different
viscosities behave during the rolling operation since the RTFAS can acquire
images
at certain sample positions.
[0059] In one embodiment, the RTFAS can check sample position periodically. A
detection mechanism in the fluid motion mechanism 20, which generates the I/O
signal, can determine if the sample position passes sample position -300 when
moving from sample position +4500. The detection mechanism can adjust the I/O
signal to a "1" if the sample position is between -300 and +4500 and adjust
the I/O
signal to a "0" in other positions. The RTFAS can record or store the I/O
signal, and
if the previous I/O signal equals to 1 and the current I/O signal changes to
0, then the
RTFAS knows the reagent and/or stain 56 is moving from an sample position of
+4500 and just crossed a sample position of -300, which corresponds to the
reagent
and/or stain 56 being in the proper position for a measurement. In another
CA 03007159 2018-06-01
WO 2017/114749
PCT/EP2016/082377
- 18 -
embodiment, the detection mechanism can send a signal that corresponds to the
sample position and the RTFAS can evaluate the signal from the detection
mechanism to determine whether the corresponding sample position from the
signal
is within a predetermined range of the predetermined location of the sample
position.
For example, the RTFAS can indicate a positive I/O signal if the sample
position is
between about -200 and -400 when the reagent and/or stain 56 is moving from
right
to left in the sample 50.
[0060] Referring back to FIG. 6, if an I/O signal is received indicating the
proper
sample position, then a fluid volume is calculated by the volume estimator 37
(step
114). In one embodiment, the volume of the reagent and/or stain 56 can be
calculated based on the system (or "ARC") geometry and the measured fluid
bandwidth or length, i.e., the distance between the detected fluid boundaries.
In one
embodiment, the calculated volume may have to be calibrated to account for
assumptions used in the volume calculation and/or other possible matters that
may
affect the accuracy of the calculation. A frame check is then performed (step
116) to
determine if the frame and corresponding volume calculation are acceptable.
The
frame check can check for errors such as an excessive volume change and check
for
other abnormal frame conditions such as a pipette blocking the field of view.
If the
frame or volume calculation is not acceptable, i.e., there is an error or
abnormality
associated with the frame or the volume calculation, the process returns to
step 106
to acquire another image. If the frame and volume calculation are acceptable,
an
adjustment amount is calculated (step 118) by the dispenser volume calculator
35
and the process returns to step 106 to acquire another image.
[0061] In one embodiment, an adjustment amount should only be determined when
the volume calculation is done from a satisfactory image or frame with clear
fluid
boundaries as can be judged by image processing analyzer 33 of FIG. 3 . During
the
CA 03007159 2018-06-01
WO 2017/114749
PCT/EP2016/082377
- 19 -
staining process, several different types of events can occur that can affect
the
accuracy of the volume estimation and thereby affect the calculation of the
adjustment amount. For example, a frame with a pipette arm travelling through
the
field of view may yield an excessive calculated volume. To overcome some of
the
problems with accurate volume estimation, the ratio of the bright pixels in a
frame is
calculated as part of the frame check in step 116 to ensure that an adjustment
amount is not calculated when bright pixels represents more than 50% of the
frame.
In other words, an acceptable frame has less than 50% of bright pixels in the
frame.
[0062] In another embodiment, an accurate volume calculation cannot occur when
one part of the fluid boundary is not in the field of view. For example, the
fluid
boundary may be out of range, i.e., not in the field of view, when the reagent
and/or
stain 56 has a large volume, such as 200pL or more, and is moving at a high
speed,
such as more than 100mm/s. In a further embodiment, an accurate volume
calculation cannot occur when the foreground analysis of step 108 cannot
provide a
correct fluid boundary. In the above two embodiments, the RTFAS can compare
the
previous volume to the current volume. If there is a large difference between
the two
volumes, the RTFAS can wait until the next measurement point to determine the
current volume. In other words, when there is a large difference between two
calculated volumes, the frame check in step 116 can reject the volume
measurement
and return the process to step 106 to acquire a new image.
[0063] In one embodiment, the RTFAS can provide a user interface for a user to
monitor the process of FIG. 6. FIG. 8 shows an exemplary screenshot of a user
interface displayed by the RTFAS. The user interface 140 displayed by the
RTFAS
can include four panels to provide information to the user on the process of
FIG. 6. A
first panel 142 shows the current image acquired by camera 14. A second panel
144
shows the foreground detected using the Gaussian Mixture Model or color-
CA 03007159 2018-06-01
WO 2017/114749
PCT/EP2016/082377
- 20 -
thresholding method. A third panel 146 shows the calculated current volume
(over
time) based on the detected foreground. A fourth panel 148 shows the
calculated
adjustment amount (over time) based on a user-input target volume, an offset
volume, and the measured volume. As shown in the third panel 146 of FIG. 8, a
decline of measured volume of about 8pL can be observed due to the evaporation
of
the reagent and/or stain 56 during 120 seconds of rolling.
[0064] The RTFAS can detect for the formation of bubbles in the reagent and/or
stain 56 and can compensate for the presence of the bubbles in the volume
calculation in step 114. If volume calculation does not compensate for the
presence
of bubbles, the volume calculation may be overestimated because the bubbles
formed in the reagent and/or stain 56 would increase the measured fluid
bandwidth.
In one embodiment, bubbles may form in the reagent and/or stain 56 when
antibody
diluent is being used in the sample 50.
[0065] In one embodiment, the circular shape of the bubbles inside the fluid
can be
used to detect for the presence of the bubbles and then perform compensation
for
the bubbles. A circle detection scheme can be used to identify any bubbles in
the
detected foreground of the acquired image. By calculating the numbers of
bubbles in
the image and giving proper volume compensations for the bubbles, the volume
of
the reagent and/or stain 56 can be measured more accurately in the presence of
bubbles in the reagent and/or stain 56.
[0066] In one embodiment, the RTFAS can perform image acquisition, sample
position acquisition, and image analysis in about 0.06 seconds and would have
a
frame rate of about 16 frames per second. The processing time can be based on
the
programming language used to perform the image analysis and the performance of
the computer used to execute the image analysis. Improvements in processing
time
- 21 -
may be obtained by using more efficient programming languages or better
performing computers.
[0067] The real time assay monitoring system 10 can also be used to calculate
a
saturation index for an assay that corresponds to a signal intensity score
given by a
pathologist analyzing the results of the assay with a microscope at the
completion of
the assay. The calculated indices, such as the saturation index, can be
obtained
from changes in colors on the tissue specimen. The changes in color are
captured
during a reaction in which chromogen colors get deposited on the sample
specimen
during a reaction (e.g., during DAB depostition) and other color uptakes (e.g.
dyes
and fluorophores used, for example, in multiplexing assays). Thus, the system
10
can monitor and measure an index of a reaction in real time. In addition, the
calculated saturation index can be used to monitor, in real time, the staining
process
for the samples 50. An example of a staining process that can be used with the
present application are described in commonly-assigned U.S. Patent Application
Publication No. 2013/0302852, entitled "Hematoxylin Staining Method" and
published on November 14, 2013.
[0068] FIG. 9 shows an embodiment of a process for monitoring the staining
process of an assay. The process begins by configuring the camera 14 (step
182)
by setting parameters such as exposure, brightness, and gain. After the camera
14
has been configured, an image is acquired (step 184) from the camera 14. Each
acquired image can be composed of a matrix with values representing the color
for
each pixel. In one embodiment, the HSV (hue, saturation, value) color model
can be
used. However, in other embodiments, different color models, such as RGB (red,
green, blue), L*A*B*, or YCbCr, can be used. For the HSV color model, the hue
index provides information, in the form of numbers, about the color of the
specimen
54, the saturation index provides information on the lightness or darkness of
the
CA 3007159 2019-11-08
CA 03007159 2018-06-01
WO 2017/114749
PCT/EP2016/082377
- 22 -
staining, and the value index, sometimes called the brightness index, also
provides
light! dark information on the stain. FIG. 10 shows an embodiment of an HSV
color
model. As shown in FIG. 10, the hue index (or value) represents the color, a
saturation index (or value) close to zero refers to a very light color close
to white, and
a value index (or value) close to zero refers to a very dark color close
black. When
the saturation index and the value index each reach a peak, a "pure color" is
obtained.
[0069] Referring back to the process of FIG. 9, a region of interest (ROI) can
be
selected (step 186) in the captured image. As shown in FIG. 11, a box 202 can
be
positioned to correspond to the selected for the region of interest (ROI) in
the
acquired image. In one embodiment, an ROI can be selected in a region of the
tissue being stained either by a user or automatically by the system 10. In
another
embodiment, the same or a different ROI can be selected for each acquired
image
from one sample 50. Within the ROI, the image has a number or index
representing
the local intensity for each pixel as shown in FIG. 11. The array of different
intensities corresponding to the pixels in the ROI can be analyzed and
compared to
each other. In one embodiment, the ROI can be established as the same location
of
a tissue biopsy that has been placed on different slides. The arrays of the
ROls from
the different slides can be compared to each other, either prior to or during
the assay
process, to provide a baseline. Once the baseline is established, any
differences
between the arrays of the ROls of processed samples and the baseline are
directed
to the result of the assay process. A saturation index and a signal intensity
score for
the selected ROI can be calculated (step 188). The calculated saturation index
can
be converted to a signal intensity score using a predefined correlation. FIG.
13
shows a graph of the correlation between signal intensity scores and
saturation
indexes. In one embodiment, the correlation between signal intensity scores
and
CA 03007159 2018-06-01
WO 2017/114749
PCT/EP2016/082377
- 23 -
saturation indexes can be made experimentally by performing staining
procedures
with different antibody and DAB incubation times and recording the saturation
index
for each of the staining procedures just before the end of the staining
procedure.
The results of each of the staining procedures can then be provided to a
pathologist
for a signal intensity score which is then correlated to the recorded
saturation index.
[0070] In another embodiment, the value index can be used instead of the
saturation index to generate the signal intensity score. FIG. 14 shows a graph
of the
correlation between signal intensity scores and value indexes. In one
embodiment,
the correlation between signal intensity scores and value indexes can be made
experimentally by performing staining procedures with different antibody and
DAB
incubation times and recording the value index for each of the staining
procedures
just before the end of the staining procedure. The results of each of the
staining
procedures can then be provided to a pathologist for a signal intensity score
which is
then correlated to the recorded value index. In still another embodiment both
the
saturation index and the value index can both be used to generate a
corresponding
signal intensity score. In a further embodiment, the hue index can be used for
color
detection when multiple colors are used to distinguish multiple assay targets
in the
same specimen through multiplexing staining procedures since similar colors
are
encoded close to each other in numeric values.
[0071] The calculated signal intensity score can be used to evaluate the
staining of
the specimen (step 189). The calculated signal intensity score can be used to
determine if the staining process is proceeding as expected while the staining
process is still ongoing. A determination can then be made as to whether the
assay
had been completed or should be stopped or modified (step 190). If the assay
has
been completed because the specified incubation time has elapsed or if the
assay
should be stopped or modified because the signal intensity score indicates a
problem
CA 03007159 2018-06-01
WO 2017/114749
PCT/EP2016/082377
- 24 -
with the staining process, the process ends, otherwise the process returns to
step
184 to acquire another image.
[0072] In one embodiment, the real time assay monitoring system 10 can be used
to ensure tissue staining uniformity. The system 10 can segment the specimen
areas into different ROls and compare their saturation indexes. If there is a
declining
or increasing trend of saturation indexes, there can be a gradient of the
staining
signal intensity, which occurs in the case of a non-uniform stained sample.
When
performing the saturation index comparison, the saturation index value can be
normalized to the slide background to ensure that saturation index differences
are
not obtained from differences in local lighting conditions.
[0073] In another embodiment, the real time assay monitoring system 10 can be
used to optimize assay protocols. For example, the real time assay monitoring
system 10 can monitor the saturation index in real time at about a frame per
minute
/or less for antibody incubation time optimization while maintaining DAB
incubation
time the same for each sample. As shown in FIG. 15, 16 minutes of antibody
incubation time results in the saturation index being above 0.7 after 2
minutes during
the DAB color reaction, which indicates that the 16 minute antibody incubation
time
results in the desired signal intensity for stain quality measurement
optimization. If
the antibody incubation time is shortened to 8 minutes, the saturation index
during
the DAB color reaction can only saturate around 0.68. Further, if the antibody
incubation time is shortened to 3 minutes, the saturation index can only reach
around
0.66. In another example, the real time assay monitoring system 10 can also
monitor
the saturation index in real time at about a frame per minute for DAB/H202
incubation
time optimization while maintaining the antibody incubation time the same for
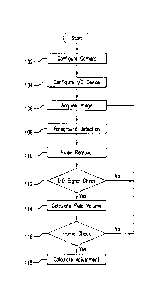
each
sample. As shown in FIG. 16, DAB incubation for only 1 minute shows that the
saturation index just stops while the saturation index is in a sharply
increasing region,
CA 03007159 2018-06-01
WO 2017/114749
PCT/EP2016/082377
- 25 -
as evidenced by the other samples. For 15 minutes of DAB incubation, the
saturation index rises above 0.7 after 6 minutes and may indicate that the
extra
minutes of DAB incubation time are not necessary. Finally, a DAB incubation
time of
6-8 minutes may provide better results because the signal is allowed to
saturate with
the time and there is also a time margin about 2-4 minutes to ensure the
signal
saturation. The difference in the saturation index from the different assay
protocols
shows that the real time assay monitoring system 10 can be used to optimize
assay
protocols, such as antibody incubation time and/or DAB incubation time.
[0074] In one embodiment, the system 10 can discern and measure changes in
color during an assay chromogen reaction. The system 10 can discern the
presence
or absence of color, determine the type of color and distinguish intensity and
brightness. By measuring the changes in color during the assay chromogen
reaction, the system 10 can be used for assay and platform development and
extended to quality control monitoring and workflow monitoring.
[0075] In another embodiment, the system 10 can be equipped to provide a
scoring
assessment of the stain quality in real time. The stain quality scores provide
insight
of the assay performance and staining results before the assay is complete. As
the
system 10 calculates the results obtained from a digital image, preliminary
scores
can be stored and/or reported electronically for various purposes. The
preliminary
scores may aid pathologists and technicians by providing an assessment of the
stain
quality, initial results of the assay, and preliminary diagnostic assessment
of the test
case. Thus, the system 10 can be used as a digital pathology tool enabling and
supporting early digital reporting of patient results to pathologists before
assay
procedure is complete. Moreover, data collected throughout the assay procedure
can also be stored as part of the slide's barcode as part of a workflow
solution. The
CA 03007159 2018-06-01
WO 2017/114749
PCT/EP2016/082377
- 26 -
system 10 can be used to maintain record keeping of the assay workflow
accessible
on cloud based workflow software outside of the staining platform.
[0076] In a further embodiment, the system 10 can be used as an assay and
reagent development tool. As a development tool, the system 10 can measure and
profile measurement parameters linked to color change based on experimental
testing for chromogens, reagents and antibody development. The measured
results
can help determine the optimal reagent, antibody, chromogen and counterstain
incubation times based on pathologist scoring criteria. The measured results
provided by the system 10 enables determining which experimental conditions of
antibody, chromogen detection and counterstain reagents incubations are
sufficient
and necessary in real time for optimal assay performance in the development
and
validation of the assays. The system 10 can be applied to both fluorescent and
non-
fluorescent chromogens contingent on having filters that permit visual
inspection at
appropriate wavelengths.
Moreover, because the system 10 permits color
separation, the system 10 can separate multiple different fluorophores and
bright
field chromogen colors at the same time during multiplexing IHO
(immunohistochemistry). Thus
multiplexing characterization of staining and
validation can be enabled and readily optimized by quantitative parameters
obtained
with the system 10. Moreover, the system 10 can be used to implement any
experimental manipulation including assessment of bulk reagents and test their
impact on stain quality with the scoring algorithm.
[0077] In still another embodiment, the scoring algorithm used by the system
10
also enables quality monitoring and evaluation of platform performance. For
example, implementation of real time assay monitoring could permit assessment
of
staining quality linking the potential platform design changes or platform
related
CA 03007159 2018-06-01
WO 2017/114749
PCT/EP2016/082377
- 27 -
testing to the potential impact on stain quality for both primary and advanced
staining
platforms.
[0078] In an additional embodiment, the system 10 can be used with marketed
platforms to monitor consistency in desired stain quality in situations where
global
customers have varying preferences in stain intensity and hue. Thus, the
system 10
can enable customers to program stain preference and hue based on a
quantitative
scale such as through a touch screen. The quantitative scale could serve as a
metric
for real time monitoring, and evaluating stain preference in a quality
controlled
approach. The monitoring system 10 can provide an unbiased quantitative
parameter to distinguish those settings that could be validated by
pathologists.
[0079] Turning now to FIG. 17, and embodiment of a process 300 for image
analysis of DAB signal intensity is shown, which process can be used for
monitoring
stain process progression (for example, for quality control or assay
development) that
could trigger a user alert or for providing early results of an assay (such as
a
threshold % positivity of cells having a particular biomarker) that could
trigger the
automatic ordering of a reflex test to investigate for a correlated biomarker
that could
aid in a patient diagnosis. Once the controller of the system triggers 302
image
acquisition 304, the image analysis system then identifies the tissue through
a
process of basic registration 306, edge detection 308, filtering of noise 310,
formation
of a binary mask 312 (a process that can include dilation, filling and image
erosion as
is shown in FIG. 18), and production of a cropped image 314. The cropped image
314 is then further analyzed to segment that different colors in the images
by, for
example, K-means clustering 316, RGB thresholding 318, selection of an ROI 320
and generation of a positive signal image 322. The positive signal image 322
is then
scored in this embodiment by first making a color space conversion 324,
conversion
to grayscale 326, and generation of an average score 328.
CA 03007159 2018-06-01
WO 2017/114749
PCT/EP2016/082377
- 28 -
[0080] Panel A of FIG. 18 shows images visually illustrating the process of
tissue
identification as described with regard to the process of FIG 17. Panel B of
FIG. 18
visually demonstrates the processes of color segmentation and scoring as
described
in FIG 17, but further illustrating several embodiments of color space
conversions
that are possible alternatives.
[0081] FIG. 19 illustrates additional types of average grayscale and
saturation
scores that can be generated according to additional embodiments of the
disclosed
system and method and that can be used to assess stain process progression and
quality.
[0082] The correlation between pathologists' signal intensity score was
investigated
when the staining system was a "puddle" system as opposed to the thin film
staining
system of FIG. 2. Two indices were considered for the scoring approach for
signal
intensity score of stained tissues in RTAMS: one was a grayscale intensity
converted from RGB color space, and the other was the saturation index in HSV
color space, which was used successfully in the thin-film staining
environment.
[0083] Grayscale images contain multiple shades of gray in between black and
white. Grayscale index was chosen because each pixel only carries intensity
information after colorimetric conversion from RGB color space or another
color
space. 8-bit grayscale index format converted from RGB color space was
applied.
This index varies from black as absolute absence of intensity (0 out of 255)
to white
as absolute presence of intensity (255 out of 255), and thus is inversely
proportional
to an intensity score provided by pathologist, since a darker signal will
receive higher
intensity score from pathologists but a lower index value from grayscale. As
described and shown in FIGS. 17 and 18, edge detection was used to create a
binary mask that separated the section containing tissue from the entire
acquired
image including some image dilation and erosion. Next, color segmentation was
CA 03007159 2018-06-01
WO 2017/114749
PCT/EP2016/082377
- 29 -
used to separate the stains by colors, which are positive signals,
counterstain signal
and background. Different color segmentation strategies had been tested but k-
means clustering for setting thresholds in RGB color space works well for the
CD20
assay in the puddle environment.
[0084] In order to demonstrate the utility of grayscale and saturation as
RTAMS
scores for monitoring assay progression in the puddle environment, the
correlation of
both indices to pathologists' intensity score was established. Various
incubation
times of CD20 antibody and Hematoxylin were chosen to create different
intensity
levels of positive signal and counterstain signal on tonsil tissues following
a standard
DAB detection protocol (UltraView DAB, Ventana Medical Systems, Inc., Tucson,
AZ,
USA) as shown in Table 1 below. Two slides were stained under each set of
experimental condition. The assay process images were captured by the RTAM
system at 0.5 fps starting at the moment the DAB detection reagents were
dispensed
onto the slides.
Table
Reagents Time (minutes)
DAB 8 T 8 -r
8 8 8 8 8 4
CD-20
Antibody 16 12 8 4 16 16 16 4
Hematoxylin 4 4 4 4 16 12 8 4
Control i
[0085] As mentioned above, a saturation index was utilized for the thin film
staining
environment of FIG. 2, and in comparison with pathologists' intensity scoring
had
reached a correlation of R2 = 0.89 (see, FIG. 13).
[0086] FIG. 20 shows the correlation between pathologists' scores and the
saturation value in the puddle environment. The R2 value is lower than what
was
CA 03007159 2018-06-01
WO 2017/114749
PCT/EP2016/082377
- 30 -
seen in the thin film environment. In contrast, as shown in FIG. 21,
generation of the
8-bit grayscale index proved to reach outstanding correlation (R2 = 0.94) with
intensity score given by pathologists and thus demonstrated the feasibility of
monitoring CD20 assay in real time by a computer provided by the RTAMS to
monitor the assay staining process of CD20 assay. Furthermore, these tests
demonstrated that the system can provide interpretive results before the assay
ends,
since RTAMS calculates the scores at the moment before hematoxylin is
dispensed
onto the tissue samples, whereas the pathologists' scores were made after the
slides
had undergone the complete assay protocol.
[0087] Further evidence that RTAMS can monitor assay development in real time
was obtained by an experiment wherein only the antibody incubation time was
varied, but the DAB detection time was kept constant. The experimental
conditions
for this test are shown below in Table 2, and the results are shown in FIG.
22, which
clearly demonstrates a correlation between the RTAMS grayscale score and the
antibody incubation time.
Table 2
Reagents Incubation Time (minutes)
DAB 8 8 8 8
CD-20
Antibody 16 12 8 41
[0088] RTAMS can also be used to calculate a percentage of positive cells of
in the
CD20 according to the embodiment of FIG 23. In the CD20 assay, three colors
are
evident in the images: brown for the DAB signal, light blue for the
counterstaining
signal and a white background, as is shown in Panel A of FIG. 23. As
illustrated in
Panel B of FIG. 23, K-means clustering in HSV color space can be used to
separate
CA 03007159 2018-06-01
WO 2017/114749
PCT/EP2016/082377
- 31 -
brown with other colors. And then, threshold setting in RGB color space is
used to
divide blue from white background. This particular example calculates an index
based on pixels instead of cells, wherein the % positive cells is calculated
by dividing
the number of brown pixels by the sum of brown and blue pixels and multiplying
by
100. A possible alternative to this method is to utilize machine learning
method to
build a classifier to separate stained cell and non-stained cells and arrive
at a percent
% cells. Since such measures of %positive cells can be obtained during the
assay, it
is possible to provide a logic module as part of the automated test ordering
system
28 of FIG. 1, wherein if for a given test a predetermined number of cells in a
sample
are positive for a particular marker, a second (and possibly third, fourth or
more) test
is automatically ordered before the first test is finished. Alternatively, a
test result (for
example, a result upon which a particular therapy decision could be made)
could be
output from controller 12 immediately upon the number of positive cells
reaching a
predetermined value.
[0089] Another embodiment of the disclosed real time assay system and method
includes a system and method for separating the portion of a sample image that
is
stained by DAB (brown) and a Red chromogen. Setting a threshold in RGB channel
is no longer a proper method for color detection since both brown and red
contain
main intensity in the R channel for a DAB/Red assay. Therefore, k-means
clustering
in various color spaces including RGB, HSV and L*a*b* was tested. As a result,
k-
means clustering in RGB color space was found to be the optimal solution for
color
detection in DAB/Red assay. The overall scheme of this embodiment is shown in
FIG. 24.
[0090] The strategy, however, could be altered other combinations of
thresholding,
segmenting, clustering and color spaces as needed for other assays having
different
colors. Although the figures herein may show a specific order of method steps,
the
CA 03007159 2018-06-01
WO 2017/114749
PCT/EP2016/082377
- 32 -
order of the steps may differ from what is depicted. Also, two or more steps
may
be performed concurrently or with partial concurrence.
Variations in step
performance can depend on the software and hardware systems chosen and on
designer choice. All such variations are within the scope of the application.
Software implementations could be accomplished with standard programming
techniques, with rule based logic and other logic to accomplish the various
connection steps, processing steps, comparison steps and decision steps.
[0091] It should be understood that the identified embodiments are offered by
way of example only. Other substitutions, modifications, changes and omissions
may be made in the design, operating conditions and arrangement of the
embodiments without departing from the scope of the present application.
Accordingly, the present application is not limited to a particular
embodiment, but
extends to various modifications that nevertheless fall within the scope of
the
application. It should also be understood that the phraseology and terminology
employed herein is for the purpose of description only and should not be
regarded
as limiting.
[0092] As used herein, the singular terms "a," "an," and "the" include plural
referents unless the context clearly indicates otherwise. Similarly, the word
"or" is
intended to include "and" unless the context clearly indicates otherwise.
[0093]The terms "comprising," "including," "having," and the like are used
interchangeably and have the same meaning. Similarly, "comprises," "includes,"
"has," and the like are used interchangeably and have the same meaning.
Specifically, each of the terms is defined consistent with the common United
States patent law definition of "comprising" and is therefore interpreted to
be an
open term meaning "at least the following," and is also interpreted not to
exclude
additional features, limitations, aspects, etc. Thus, for example, "a device
having
CA 03007159 2018-06-01
WO 2017/114749
PCT/EP2016/082377
- 33 -
components a, b, and c" means that the device includes at least components a,
b
and c. Similarly, the phrase: "a method involving steps a, b, and c" means
that the
method includes at least steps a, b, and c. Moreover, while the steps and
processes may be outlined herein in a particular order, the skilled artisan
will
recognize that the ordering steps and processes may vary unless a particular
order is clearly indicated by the context.