Note: Descriptions are shown in the official language in which they were submitted.
CA 03027248 2018-12-10
WO 2018/022542 PCT/US2017/043588
GAS MEASUREMENT SYSTEM
Cross Reference to Related Application
[0001] This application claims the benefit of U.S. Application Serial No.
62/366,594 filed on
July 25, 2016, the disclosure of which is hereby incorporated by reference in
its entirety.
Field
[0002] The invention relates generally to systems and methods for detecting
and measuring
gases in a sample. More particularly, in certain embodiments, the invention
relates to absorption
spectroscopy systems and methods for quantifying a rare species (e.g.,
hydrogen sulfide) in a gas
sample, e.g., a natural gas sample.
Background
[0003] Natural gas has become more important for industries, such as power
generation, to
meet more stringent regulatory constraints, and provide cleaner alternatives
to reduce equipment
maintenance and service. As more infrastructure and fracking well supplies
proliferate in the US
and overseas markets, reliable traditional natural gas reserves are being
mixed or replaced with
natural gas supplies with more physical make-up variability. Natural gas
supplies are becoming
more readily available. Distribution sites and associated infrastructure, like
ports, make products
like compressed natural gas (CNG) and liquefied natural gas (LNG) more readily
available to
replace other fossil fuels such as coal and oil. However, as these traditional
and new sources are
mixed in pipelines and into saleable product, mixtures are becoming more
varied and require
1
CA 03027248 2018-12-10
WO 2018/022542 PCT/US2017/043588
more accurate and higher temporal resolution in continuous testing for
undesirable contaminants
if the company is going to meet consumer expectations.
[0004] Natural gas is composed primarily of methane (CH4) and hydrocarbon
gases and
contaminants such as carbon dioxide (CO2), nitrogen (N2), hydrogen sulfide
(H2S) and water
(H20). As more sources of fracking gas come on-line and industries convert to
cleaner burning
fuels like CNG, the composition of CNG is more varied and includes species
like sulfur
compounds which may cause corrosion and performance issues.
[0005] The presence of sulfur in its most common reduced form in natural
gas is as hydrogen
sulfide (H2S). The hydrogen sulfide molecule consists of two hydrogen atoms
bonded to a single
sulfur atom. Its molecular composition is similar to that of water (H20), two
hydrogen atoms
bonded to a single oxygen atom. Because sulfur can substitute as an oxidizer
in place of oxygen,
H2S is easily produced in anaerobic environments from the sulfur left over
from decayed organic
matter such as is found in fossil fuels. H2S is generally found in higher
concentrations in
fracking gas due to the association of the natural gas and H2S in the
interstices of porous material
where fracking gas is obtained. Fracking involves the recovery of shale gas
which is natural gas
that is trapped within layers and pores of rock formations or boundary layers.
The fracking
boom of the early 2000's has resulted in a variety of gas sources that differ
in quality and
physical characteristics such as sulfur content. Natural gas is considered
"sour" if it has a high
percentage of hydrogen sulfide. It has been estimated that 15 to 25% of
natural gas in the U.S.
may contain hydrogen sulfide at part per million by volume (ppmv) levels.
[0006] Energy companies must ensure that gas feeds from fracking meet
quality industry
standards before distributing to its customers. A fast and ultra-sensitive
instrument for
measuring H2S content is critical to the efficiency and cost effectiveness of
these operations.
2
CA 03027248 2018-12-10
WO 2018/022542 PCT/US2017/043588
Additionally, when one company sells or transfers gas to another company such
as from a
fracking site to a pipeline company, it is called a "custody transfer point."
At this point where
the gas is transferred, the gas purchaser must measure hydrogen sulfide
concentration or risk
pipeline damage or damage to equipment at a downstream customer or consumer
location. In
most natural gas supply agreements, The Federal Energy Regulatory Commission
(FERC)
requires that pipeline gas contain hydrogen sulfide in amounts less than 4
PPM/V. Most custody
transfer contracts also specify this limit.
[0007] Water is also found in natural gas and may be more concentrated in
fracking gas due
also to the association with the interstices in porous material and the need
to inject large
quantities of water in the fracking process. When water combines with carbon
dioxide and
hydrogen sulfide it forms carbonic and sulfuric acids which are very corrosive
to metals. The
acids can quickly break down metal pipes, tanks, or other metal materials with
which they come
into contact. The corrosive nature of H2S can cause pipes or tanks to develop
leaks or weaken
the structure, causing failure.
[0008] Thus, there is a need for an improved method and system for
monitoring hydrogen
sulfide, water, or other trace species in natural gas.
Summary
[0009] Presented herein are systems and methods for quantifying trace
and/or ultra-trace
levels of a species ¨ for example, H2S or H20 ¨ in a natural gas line. The
systems and methods
employ a tunable laser, such as a tunable diode laser (e.g., distributed
feedback laser (DFB),
vertical-cavity surface-emitting laser (VCSEL), external cavity diode laser or
a vertical external-
cavity surface-emitting laser (VECSEL) or a tunable quantum cascade laser
(QCL). The laser
3
CA 03027248 2018-12-10
WO 2018/022542 PCT/US2017/043588
produces an output beam over a relatively (e.g., very) narrow (or "high
resolution") wavelength
band whose center can be continuously or discretely scanned from about 0.1 Hz
to about 1000
Hz. A natural gas sample comprising a trace level of a species of interest
(e.g., H2S or H20)
passes through a flow cell into which the output beam from the laser is
guided. An optical
detector receives light from the flow cell, producing a signal indicative of
the absorption
attenuation from which the concentration of the trace species is determined
(e.g., via
chemometric analysis of the generated absorption spectrum in the time or
frequency domain).
[0010] In one aspect, the invention is directed to a spectroscopy system
[e.g., a tunable diode
laser absorption spectroscopy (TDLAS system) or a tunable quantum cascade
laser (QCL)
system] for measuring a trace level (e.g., no greater than 1000 ppm, e.g., no
greater than 500
ppm, e.g., no greater than 250 ppm, e.g., no greater than 200 ppm, e.g., no
greater than 100 ppm,
e.g., no greater than 50 ppm, e.g., no greater than 25 ppm, e.g., no greater
than 10 ppm, e.g., no
greater than 5 ppm, e.g., no greater than 2 ppm, e.g., no greater than 1 ppm)
and/or an ultra-trace
level (e.g., less than 1 ppm, e.g., less than 500 ppb, e.g., less than 250
ppb, e.g., less than 100
ppb, e.g., less than 50 ppb, e.g., less than 25 ppb, e.g., less than 10 ppb,
e.g., less than 5 ppb, e.g.,
less than 2 ppb, e.g., less than 1 ppb) of a first gas (e.g., hydrogen sulfide
or H20) in a natural gas
sample, the system comprising: a laser [e.g., a tunable diode laser, such as a
distributed feedback
laser (DFB), a vertical-cavity surface-emitting laser (VCSEL), an external
cavity diode laser or a
vertical external-cavity surface-emitting laser (VECSEL)] [e.g., a tunable
quantum cascade laser
(QCL)] for producing an output beam over a set of one or more discrete or
continuous
wavelength bands at a scan rate from about 0.1 Hz to about 1000 Hz over the
set of one or more
discrete or continuous wavelength bands [e.g., at a resolution of from 0.01 to
0.0001 cm', e.g., at
an ultra-high resolution, e.g., at a resolution of 0.001 cm' or lower
(/better)]; transmitting optics
4
CA 03027248 2018-12-10
WO 2018/022542 PCT/US2017/043588
for guiding and/or shaping the output beam from the tunable diode laser to the
natural gas sample
[e.g., guiding and/or shaping the beam to a flow cell (e.g., a multi-pass
cell) through which the
natural gas sample flows, e.g., wherein the natural gas sample is an absorbing
medium]; an
optical detector (e.g., a photodiode or other fast response detector) for
receiving light from the
natural gas sample and producing a detector signal corresponding to the
received light (e.g., said
received light having been transmitted through and/or reflected from transfer
optics located
between the natural gas sample and the optical detector); and a processor of a
computing device
and a memory (non-transitory computer-readable medium) having instructions
stored thereon,
wherein the instructions, when executed by the processor, cause the processor
to compute the
trace level (e.g., no greater than 1000 ppm, e.g., no greater than 500 ppm,
e.g., no greater than
250 ppm, e.g., no greater than 200 ppm, e.g., no greater than 100 ppm, e.g.,
no greater than 50
ppm, e.g., no greater than 25 ppm, e.g., no greater than 10 ppm, e.g., no
greater than 5 ppm, e.g.,
no greater than 2 ppm, e.g., no greater than 1 ppm) and/or ultra-trace level
(e.g., less than 1 ppm,
e.g., less than 500 ppb, e.g., less than 250 ppb, e.g., less than 100 ppb,
e.g., less than 50 ppb, e.g.,
less than 25 ppb, e.g., less than 10 ppb, e.g., less than 5 ppb, e.g., less
than 2 ppb, e.g., less than 1
ppb) of the first gas (e.g., hydrogen sulfide or H20) in the natural gas
sample from the signal
corresponding to the received light.
[0011] In certain embodiments, the first gas is hydrogen sulfide and
wherein the set of one or
more discrete or continuous wavelength bands comprises one or both of bands
(i) and (ii) as
follows: (i) a first band at least 0.05 cm' in width (e.g., at least 1 cm', at
least 2 cm', at least 3
-
cm', at least 4 cm', at least 5 cm', at least 8 cm') (e.g., and/or no greater
than 50 cm' in width,
e.g., no greater than 40 cm', no greater than 30 cm', no greater than 20 cm',
no greater than 15
cm' in width) said first band containing at least one value between 5066 cm'
and 5076 cm'
CA 03027248 2018-12-10
WO 2018/022542 PCT/US2017/043588
(e.g., said band containing or overlapping at least partially with 5070 6
cm'); and (ii) a second
band at least 0.05 cm' in width (e.g., at least 1 cm', at least 2 cm', at
least 3 cm', at least 4 cm
1, at least 5 cm', at least 8 cm') (e.g., and/or no greater than 50 cm' in
width, e.g., no greater
than 40 cm', no greater than 30 cm', no greater than 20 cm', no greater than
15 cm' in width)
said second band containing at least one value between 5086 cm' and 5097 cm'
(e.g., said band
containing or overlapping at least partially with 5092 6 cm').
[0012] In certain embodiments, the instructions, when executed by the
processor, cause the
processor to synchronize wavelength scanning of the laser with the detector
signal to align, in a
time domain, measurement of the detector signal with the wavelength scanning
to generate an
absorption spectrum.
[0013] In certain embodiments, the instructions, when executed by the
processor, cause the
processor to analyze the generated absorption spectrum [e.g., to perform a
chemometric analysis
of the generated absorption spectrum either in the time domain or frequency
domain (by
demodulation), e.g., thereby analyzing spectral absorbance within the one or
more discrete or
continuous wavelength bands and interference peaks] to determine the trace
level and/or ultra-
trace level of the first gas (e.g., hydrogen sulfide or H20) in the natural
gas sample.
[0014] In certain embodiments, the natural gas sample is at least 20%
methane (e.g., at least
30%, at least 40%, at least 50%, at least 60%, at least 70%, at least 80%, or
at least 90%) [e.g.,
wherein methane has an absorption peak that interferes with the absorption
peak of the first gas
(e.g., hydrogen sulfide or H20), which is present in the gas sample in only a
trace amount (e.g.,
no greater than 1000 ppm, e.g., no greater than 500 ppm, e.g., no greater than
250 ppm, e.g., no
greater than 200 ppm, e.g., no greater than 100 ppm, e.g., no greater than 50
ppm, e.g., no greater
than 25 ppm, e.g., no greater than 10 ppm, e.g., no greater than 5 ppm, e.g.,
no greater than 2
6
CA 03027248 2018-12-10
WO 2018/022542 PCT/US2017/043588
ppm, e.g., no greater than 1 ppm) and/or an ultra-trace amount (e.g., less
than 1 ppm, e.g., less
than 500 ppb, e.g., less than 250 ppb, e.g., less than 100 ppb, e.g., less
than 50 ppb, e.g., less than
25 ppb, e.g., less than 10 ppb, e.g., less than 5 ppb, e.g., less than 2 ppb,
e.g., less than 1 ppb)].
[0015] In certain embodiments, the instructions, when executed by the
processor, identify an
absorption peak corresponding to methane in the natural gas sample and use the
absorption peak
corresponding to methane to line-lock (or, equivalently, to frequency load
lock) output
wavelength (or frequency) of the laser and stabilize one or more output
wavelength bands of the
laser (e.g., the set of one or more discrete or continuous wavelength bands),
thereby reducing
error caused by laser drift without use of a separate reference gas (e.g.,
methane) cell.
[0016] In certain embodiments, the system further comprises a supplemental
optical detector
for receiving light from the output beam of the laser (e.g., directed by
transfer optics from the
laser to the supplemental optical detector) that does not pass through the
natural gas sample, and
for producing a resulting supplemental signal, wherein the instructions, when
executed by the
processor, analyze the supplemental signal to determine a reference channel
baseline signature
(e.g., from reproducible modal fluctuations in laser intensity) and subtract
the reference channel
baseline signature from a sample gas baseline signal (said sample gas baseline
signal determined
from the photodetector signal corresponding to the light received from the
natural gas sample),
thereby reducing noise (e.g., determined from the supplemental signal).
[0017] In certain embodiments, the system further comprises a sample gas
conditioning
system (e.g., a heater and/or a temperature controller and/or a filter for
conditioning the natural
gas sample (e.g., prior to flow of the natural gas sample through the flow
cell)).
[0018] In certain embodiments, the system further comprises a flow control
device for
controlling a flow rate of the natural gas sample into/through the flow cell.
7
CA 03027248 2018-12-10
WO 2018/022542 PCT/US2017/043588
[0019] In certain embodiments, the system further comprises a pump for
controlling and/or
reducing pressure of the natural gas sample prior to flow of the sample
into/through the flow cell.
[0020] In certain embodiments, the system further comprises a vacuum pump
(e.g.,
downstream of the flow cell) for producing a vacuum (reduced pressure) of the
natural gas
sample in the flow cell (e.g., for measurement of hydrogen sulfide in the
natural gas sample)
(e.g., wherein the natural gas sample is at least 20% methane ¨ e.g., at least
30%, at least 40%, at
least 50%, at least 60%, at least 70%, at least 80%, or at least 90% methane).
[0021] In another aspect, the invention is directed to a spectroscopy
method [e.g., a tunable
diode laser absorption spectroscopy (TDLAS method) or quantum cascade laser
(QCL) method]
for measuring a trace level and/or an ultra-trace level of a first gas in a
natural gas sample, the
method comprising: producing an output beam over a set of one or more discrete
or continuous
wavelength bands at a scan rate from about 0.1 Hz to about 1000 Hz over the
set of one or more
discrete or continuous wavelength bands [e.g., at a resolution of from 0.01 to
0.0001 cm', e.g., at
an ultra-high resolution, e.g., at a resolution of 0.001 cm' or lower
(/better)] (e.g., by a laser
[e.g., a tunable diode laser, such as a distributed feedback laser (DFB), a
vertical-cavity surface-
emitting laser (VCSEL), an external cavity diode laser or a vertical external-
cavity surface-
emitting laser (VECSEL)] [e.g., a tunable quantum cascade laser (QCL)]);
introducing a natural
gas sample into a flow cell, wherein the natural gas sample comprises a trace
level (e.g., no
greater than 1000 ppm, e.g., no greater than 500 ppm, e.g., no greater than
250 ppm, e.g., no
greater than 200 ppm, e.g., no greater than 100 ppm, e.g., no greater than 50
ppm, e.g., no greater
than 25 ppm, e.g., no greater than 10 ppm, e.g., no greater than 5 ppm, e.g.,
no greater than 2
ppm, e.g., no greater than 1 ppm) and/or an ultra-trace level (e.g., less than
1 ppm, e.g., less than
500 ppb, e.g., less than 250 ppb, e.g., less than 100 ppb, e.g., less than 50
ppb, e.g., less than 25
8
CA 03027248 2018-12-10
WO 2018/022542 PCT/US2017/043588
ppb, e.g., less than 10 ppb, e.g., less than 5 ppb, e.g., less than 2 ppb,
e.g., less than 1 ppb) of a
first gas (e.g., hydrogen sulfide or H20) (e.g., wherein the natural gas
sample is at least 20%
methane, e.g., at least 30%, at least 40%, at least 50%, at least 60%, at
least 70%, at least 80%, or
at least 90% methane); guiding and/or shaping the output beam (e.g., by
transmitting optics)
from the tunable diode laser to the natural gas sample [e.g., guiding and/or
shaping the beam to
the flow cell (e.g., a multi-pass cell) through which the natural gas sample
flows, e.g., wherein
the natural gas sample is an absorbing medium]; receiving light, by an optical
detector (e.g., a
photodiode or other fast response detector), from the natural gas sample and
producing a detector
signal corresponding to the received light (e.g., said received light having
been transmitted
through and/or reflected from transfer optics located between the natural gas
sample and the
optical detector); and determining, by a processor of a computing device and a
memory (non-
transitory computer-readable medium) having instructions stored thereon, the
trace level and/or
ultra-trace level of the first gas in the natural gas sample from the signal
corresponding to the
received light.
[0022] In certain embodiments, the first gas is hydrogen sulfide and
wherein the set of one or
more discrete or continuous wavelength bands comprises one or both of bands
(i) and (ii) as
follows: (i) a first band at least 0.05 cm-1 in width (e.g., at least 1 cm-1,
at least 2 cm-1, at least 3
-
cm', at least 4 cm', at least 5 cm', at least 8 cm') (e.g., and/or no greater
than 50 cm' in width,
e.g., no greater than 40 cm-1, no greater than 30 cm-1, no greater than 20 cm-
1, no greater than 15
cm-1 in width) said first band containing at least one value between 5066 cm-1
and 5076 cm-1-
(e.g., said band containing or overlapping at least partially with 5070 6 cm-
1); and (ii) a second
band at least 0.05 cm-1 in width (e.g., at least 1 cm-1, at least 2 cm-1, at
least 3 cm-1, at least 4 cm-
- -
1, at least 5 cm', at least 8 cm') (e.g., and/or no greater than 50 cm' in
width, e.g., no greater
9
CA 03027248 2018-12-10
WO 2018/022542 PCT/US2017/043588
than 40 cm', no greater than 30 cm', no greater than 20 cm', no greater than
15 cm' in width)
said second band containing at least one value between 5086 cm' and 5097 cm'
(e.g., said band
containing or overlapping at least partially with 5092 6 cm').
[0023] In certain embodiments, the method further comprises synchronizing,
by the
processor, wavelength scanning of the laser with the detector signal to align,
in a time domain,
measurement of the detector signal with the wavelength scanning to generate an
absorption
spectrum.
[0024] In certain embodiments, the method further comprises analyzing, by
the processor,
the generated absorption spectrum [e.g., performing a chemometric analysis of
the generated
absorption spectrum either in the time domain or frequency domain (by
demodulation), e.g.,
thereby analyzing spectral absorbance within the one or more discrete or
continuous wavelength
bands and interference peaks] to determine the trace level and/or ultra-trace
level of the first gas
(e.g., hydrogen sulfide or H20) in the natural gas sample.
[0025] In certain embodiments, the natural gas sample is at least 20%
methane (e.g., at least
30%, at least 40%, at least 50%, at least 60%, at least 70%, at least 80%, or
at least 90%) [e.g.,
wherein methane has an absorption peak that interferes with the absorption
peak of the first gas
(e.g., hydrogen sulfide or H20), which is present in the gas sample in only a
trace amount (e.g.,
no greater than 1000 ppm, e.g., no greater than 500 ppm, e.g., no greater than
250 ppm, e.g., no
greater than 200 ppm, e.g., no greater than 100 ppm, e.g., no greater than 50
ppm, e.g., no greater
than 25 ppm, e.g., no greater than 10 ppm, e.g., no greater than 5 ppm, e.g.,
no greater than 2
ppm, e.g., no greater than 1 ppm) and/or an ultra-trace amount (e.g., less
than 1 ppm, e.g., less
than 500 ppb, e.g., less than 250 ppb, e.g., less than 100 ppb, e.g., less
than 50 ppb, e.g., less than
25 ppb, e.g., less than 10 ppb, e.g., less than 5 ppb, e.g., less than 2 ppb,
e.g., less than 1 ppb)].
CA 03027248 2018-12-10
WO 2018/022542 PCT/US2017/043588
[0026] In certain embodiments, the method further comprises identifying, by
the processor,
an absorption peak corresponding to methane in the natural gas sample; and
using the absorption
peak corresponding to methane to line-lock (or, equivalently, to frequency
load lock), by the
processor, output wavelength (or frequency) of the laser and stabilize one or
more output
wavelength bands of the laser (e.g., the set of one or more discrete or
continuous wavelength
bands), thereby reducing error caused by laser drift without use of a separate
reference gas (e.g.,
methane) cell.
[0027] In certain embodiments, the method further comprises receiving light
(e.g., by a
supplemental optical detector) from the output beam of the laser (e.g.,
directed by transfer optics
from the laser to the supplemental optical detector) that does not pass
through the natural gas
sample; producing a resulting supplemental signal; and analyzing, by the
processor, the
supplemental signal to determine a reference channel baseline signature and
subtracting the
reference channel baseline signature from a sample gas baseline signal (said
sample gas baseline
signal determined from the photodetector signal corresponding to the light
received from the
natural gas sample), thereby reducing noise.
[0028] In certain embodiments, the method further comprises conditioning
the natural gas
sample (e.g., using a heater, and/or a temperature controller, and/or a
filter) (e.g., prior to flow of
the natural gas sample through the flow cell).
[0029] In certain embodiments, the method further comprises controlling a
flow rate of the
natural gas sample into/through the flow cell (e.g., via a flow control
device).
[0030] In certain embodiments, the method further comprises controlling
and/or reducing
pressure of the natural gas sample prior to flow of the sample into/through
the flow cell (e.g., via
a pump).
11
CA 03027248 2018-12-10
WO 2018/022542 PCT/US2017/043588
[0031] In certain embodiments, the method further comprises producing a
vacuum (reduced
pressure) (e.g., by a vacuum pump) of the natural gas sample in the flow cell
(e.g., for
measurement of hydrogen sulfide in the natural gas sample) (e.g., wherein the
natural gas sample
is at least 20% methane ¨ e.g., at least 30%, at least 40%, at least 50%, at
least 60%, at least
70%, at least 80%, or at least 90% methane).
[0032] In another aspect, the invention is directed to a system for
measuring hydrogen
sulfide in natural gas, comprising: a light source emitting light at a
frequency substantially
corresponding to an absorption line of hydrogen sulfide in the 5066-5076 cm'
(1970-1974 nm)
wavelength range and/or 5086-5097 cm' (1962-1966 nm) wavelength range, wherein
the light
source is positioned to emit light through the natural gas; a first detector
configured to detect an
intensity of the light emitted from the light source; a second detector
configure to detect an
intensity of the light after passing through the natural gas; and a processing
module coupled to
the first and second detector for determining the level of hydrogen sulfide in
the natural gas.
[0033] In certain embodiments, the light source scans over the wavelength
range at a rate
from 10 Hz to 200 Hz.
[0034] In certain embodiments, the signals from the detectors are sampled
with a resolution
from 0.01 to 0.0001 cm'.
[0035] Elements of embodiments involving one aspect of the invention (e.g.,
methods) can
be applied in embodiments involving other aspects of the invention (e.g.,
systems), and vice
versa.
Brief Description of the Drawings
[0036] The advantages described herein, together with further advantages,
may be better
12
CA 03027248 2018-12-10
WO 2018/022542 PCT/US2017/043588
understood by referring to the following description taken in conjunction with
the accompanying
drawings. The drawings are not necessarily to scale, emphasis instead
generally being placed
upon illustrating the principles of the embodiments.
[0037] FIG. 1 is a schematic illustration of a system for measuring
hydrogen sulfide in
natural gas, according to an illustrative embodiment.
[0038] FIG. 2 is a schematic illustration of a Tunable Diode Laser (TDL)
package, according
to an illustrative embodiment.
[0039] FIG. 3 is a plot of laser absorption lines illustrating how the
proximity of one line
relative to another affects the shape of each peak, according to an
illustrative embodiment.
[0040] FIG. 4 is a plot illustrating absorptivity coefficient examples for
different peaks
selected for quantification, according to an illustrative embodiment.
[0041] FIG. 5 is a plot of a merit and sensitivity score chart for
different H2S absorption
lines, according to an illustrative embodiment.
[0042] FIG. 6 is a plot of peaks over a range of wavenumbers, including two
candidate bands
for H2S detection and quantification demonstrating low noise and low
interference, according to
an illustrative embodiment.
[0043] FIG. 7 is a plot with an inset expanding the box containing the two
candidate peaks in
FIG. 6, according to an illustrative embodiment.
[0044] FIG. 8 is a plot illustrating a further zoom-in of the window "Band
1" identified in
FIG. 7, according to an illustrative embodiment.
[0045] FIG. 9 is a plot of absorption features within a tuning range of the
laser, according to
an illustrative embodiment.
13
CA 03027248 2018-12-10
WO 2018/022542 PCT/US2017/043588
[0046] FIG. 10 is a block diagram of an example network environment for use
with or in the
system described herein, according to an illustrative embodiment.
[0047] FIG. 11 is a block diagram of an example computing device and an
example mobile
computing device, for use in illustrative embodiments.
[0048] FIG. 12 is a schematic of a spectroscopy system, according to an
illustrative
embodiment.
[0049] FIG. 13 is a schematic of a spectroscopy method, according to an
illustrative
embodiment.
Detailed Description
[0050] Embodiments described herein relate to absorption spectroscopy
systems and
methods for measurement of hydrogen sulfide in natural gas. The systems and
methods are
based on absorption of electromagnetic (EM) energy at specific wavelengths
where hydrogen
sulfide strongly absorbs the energy. Embodiments described herein are also
related to
measurement of water and other substance and compounds in natural gas.
[0051] Hydrogen sulfide has absorbance features in both the Mid-IR (MIR)
and Near-IR
(NIR) EM regions. MIR regions are typically stronger than the NIR absorbance
bands.
However, the overlap of many other compound absorbance bands, such as water,
with H2S bands
in the MIR regions is problematic for many instruments to accurately detect
the compounds. The
MIR regions also, typically, require the use of Quantum Cascade Lasers (QCL)
to generate the
frequencies in these areas of the EM spectrum. The use of weaker NIR
absorbance bands result
in lower signal to noise ratio and there are also interferences from, most
notably, methane (CH4),
carbon dioxide (CO2) and alkanes (e.g., propane (C3H8)).
14
CA 03027248 2018-12-10
WO 2018/022542 PCT/US2017/043588
[0052] A TDL is a type of laser, which stands for "Light Amplification by
Stimulated
Emission of Radiation." It is a laser diode, similar to a light emitting diode
(LED), which has a
junction between two semiconductors (one positive, one negative). This
junction is known as a
p-n junction. These semiconductors are incredibly small, made of very thin
slices of
semiconducting material, and are very carefully manufactured so as to create
the p-n junction. A
TDL is a laser that, because of its semiconductor construction and elemental
make-up, allows the
laser to lase in a narrow region of interest. Then, a very narrow emission
line can be selected by
using an internal or external Bragg grating (or similar device) or external
etalon to scan across
absorbance features of a target compound.
[0053] For example, when using an internal Bragg grating, the laser diode's
frequency tuning
is accomplished by changing the temperature of the internal or external
grating which changes
the spacing of the grating and the frequency of the EM oscillation mode in the
device to change
the frequency that is being emitted by the semiconductor device. The
temperature may be
changed by directly controlling the grating temperature with a device such as
a Peltier Thermo-
electric cooler (TEC), or by changing the pumping current provided to the TDL
so that more
excess waste heat is generated which influences the temperature of the
grating. The output
frequency of the TDL may also be tuned using an external etalon that may also
be temperature
influenced to achieve the reproducible frequencies of interest. Frequency
chirping is another
way of tuning wavelength, which involves turning the laser on and off so the
laser heats up and
cools down quickly and sweeps over a series of frequencies of interest.
However, the proper
center frequency of interest must be specified during the TDL device
fabrication process so that
it is close to the frequencies of interest. This is typically required because
TDL's are able to
operate in relatively narrow bands around the center frequency of the device.
In addition, TDL
CA 03027248 2018-12-10
WO 2018/022542 PCT/US2017/043588
technology was previously developed for transmission of digital data through
fiber optic cable.
The operating characteristics of available TDL's have not focused on areas of
the
electromagnetic spectrum where overlapping frequencies exist (e.g., for
example, in gas analysis,
where many compounds have spectral features that overlap with each other).
[0054] Lasers are monochromatic. For a laser to function, within the
cavity, many photons
of light of the same frequency will travel coaxially due to the constraints of
the waveguide,
causing them to constructively interfere with each other, which stabilizes the
electromagnetic
wave's oscillation and propagation modes. In a laser diode, the light is
emitted because there are
both electrons, in the negative substance, and holes (the absence of
electrons) in the positive
substance. When the negative substance is charged, the electrons in the
negative substance jump
to fill the holes in the positive substance. When the electrons jump, they
lose energy in the form
of photons, which are "light quanta," or small indivisible packets of light.
Because all the
electrons jumped down to fill holes in a certain semiconducting material, all
of the photons are of
the same frequency. This causes a laser beam to form and come out the facet of
the laser diode.
Some of the beam reflecting back through the cavity helps stimulate this
process and thus
amplify the light emission process.
[0055] In certain embodiments, the laser is operated in a constant current
mode. In this
mode, no feedback diode is required. However, in certain embodiments that
operate in a
constant power mode, a feedback diode is required. Because laser diodes have
to be operated at
a relatively high current density, and have a low forward resistance when
lasing action occurs,
they are at risk of destroying themselves due to thermal runaway. Their
operating light density
can also rise to a level where the coating of the waveguide can start
delaminating. This means
that a laser diode's current must be regulated by a constant current circuit
(rather than a simple
16
CA 03027248 2018-12-10
WO 2018/022542 PCT/US2017/043588
series resistor), and a laser device needs to be temperature controlled by a
TEC. Running in the
constant power mode, most laser diodes have a silicon PIN photodiode built
right into the
package, arranged so that it automatically receives a fixed proportion of the
laser's output to
monitor the laser's output. The output of this monitor diode can then be used
to either limit or
control the current fed through the laser by the current control circuit, for
stable and reliable
operation.
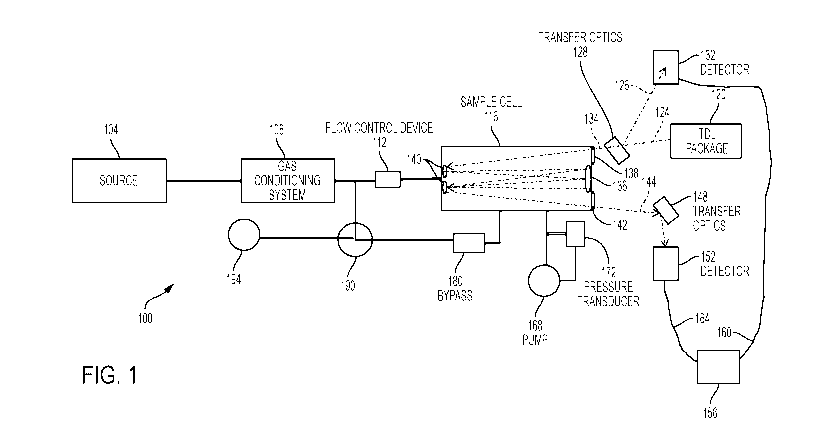
[0056] FIG. 1 is a schematic illustration of a system 100 for measuring
hydrogen sulfide in
natural gas, according to an illustrative embodiment. A source 104 of gas
(e.g., a natural gas
pipeline) supplies the sample gas to a gas conditioning system 108. The gas
conditioning system
108 is configured to; for example, optionally reduce the pressure of the gas
from the supply
pressure level of, for example, a natural gas pipeline, for further
processing. In some
embodiments, the gas conditioning system 108 also heats the gas and/or reduces
particulates in
the gas by filtering the gas. The heating addition is to prevent phase changes
to the sample gas
and prevent any moisture or hydrocarbon condensation due to the Joule-Thompson
effect of a
rapidly de-pressurizing gas. Adding heat to the system prevents this
phenomenon from
occurring and allows for an accurate reading of the gas sample composition on
a volume to
volume concentration basis. Heating the sample aids in maintaining consistent
properties in the
sample, so the spectral lines stay uniform. In addition, heating the sample
to, for example, 50-
60 C prevents the sample from condensing on the optics by keeping the sample
in a vapor
phase.
[0057] The conditioned gas is then delivered to a flow control device 112
which controls the
flow rate of the gas into a sample cell 116. The flow control device 112 can
be, for example, an
orifice or valve used to vary the flow of gas. A light source 120 (e.g., a TDL
package) outputs a
17
CA 03027248 2018-12-10
WO 2018/022542 PCT/US2017/043588
light beam 124 at a desired frequency to a set of transfer optics 128. The
transfer optics 128
include one or more mirrors, lenses, and/or filters to modify the shape or
orientation of the light
beam 124 as necessary to direct it to subsequent optical components in the
system 100. To
measure hydrogen sulfide in the gas, the TDL package 120 outputs the light 124
at a frequency
substantially corresponding to an absorption line of hydrogen sulfide in the
5066-5076 cm'
(1970 to 1974 nm) or the 5086-5097 cm' (1962-1966 nm) wavelength range.
Selection of
absorbance peaks from the hundreds of other frequencies where other target
compounds are
present in percent or trace level concentrations exist is not a trivial task.
By analytically and
experimentally identifying this particular wavelength band, Applicant is able
to detect H25 with
sensitivity and accuracy levels in natural gas that is necessary for practical
use.
[0058] A complex method was used to choose the peaks of interest that would
be successful
in measuring trace levels of H25 in a high concentration hydrocarbon
background as found in
typical natural gas sample matrices. The technical challenge of the
measurement was to separate
trace H25 (sub-ppm level) from very rich CH4 background (e.g., as found in
typical natural gas
sample matrices, e.g., a pipeline gas) (e.g., from about 90% to about 100%,
e.g., near 100%
level) and other lower percentages of hydrocarbons, and ppm levels of carbon
dioxide, sulfurs,
and moisture. Traditional optical measurement with an incoherent light source
cannot detect such
a wide dynamic range with a resolution typically no better than 0.1 cm', thus
making it difficult
to separate a heavily overlapped absorption spectrum between H25 and CH4.
Therefore, a
distributed feedback (DFB) laser was used as the source, which can reach a
much better
resolution; typically better than 0.001 cm'. At this resolution, the
individual absorption peaks
can be resolved and H25 peaks can be separated from CH4 absorption peaks for
quantification.
18
CA 03027248 2018-12-10
WO 2018/022542 PCT/US2017/043588
In this work, it was demonstrated that with DFB tunable laser absorption
spectroscopy (DFB-
TDLAS), a sub-ppm level H2S detection in a natural gas background can be
achieved.
[0059] Selectivity of H25 with the existence of 90-100% CH4 was a major
hurdle. The
absorption line of H25 had to be adjacent to relatively weak CH4 absorption
bands; otherwise, the
interference will exceed the capability of any data processing method.
Modeling work was
based on a HITRAN database.
[0060] FIG. 3 is a plot of laser absorption lines illustrating that the
proximity (distance) of
one line relative to another line will affect the shape of each peak by the
equation provided in the
figure. To properly perform a simulation model on the effects that nearby
peaks had on the
target peak ILS, the equation for the distortion that nearby Lorentzian lines
had on the target
peak for H25 is simulated (e.g., at low pressures, e.g., at pressures of about
100 TOIT or less) and
applied to all possible target compound absorption peaks in the target
compound spectrum. The
target compound spectrum for H25 contains hundreds of possible peaks for
quantification. To
properly choose a peak as a target for quantification, the peaks had to be
examined and the
distortion quantified as to the effect of all possible other compounds in the
sample matrix that
might be present. The distortion was measured and quantified by holding the
target compound
peak concentration constant and perturbing any nearby peak compounds
concentration for each
of the possible interferents that may be present in the sample matrix. This
method of calculating
interferences is a worst case analysis, and does not account for improvements
that may occur
from using multi-component chemometrics models. Additionally, sensitivity
based on that peaks
absorptivity coefficient was also examined. Both of these factors were
simulated to choose the
best target compound peak to use for quantification. Laser sources were then
investigated to
choose one that had the proper emission range and to determine if it existed
or needed to be
19
CA 03027248 2018-12-10
WO 2018/022542
PCT/US2017/043588
developed. It was discovered that laser sources at these frequencies did not
exist and needed to
be developed at the request of the Applicant. Interferences from hydrocarbons
other than CH4
were also studied. Coupling with the full scan from a Fourier Transform
Infrared Spectrometer
(FTIR), the interference influence of other gases commonly found in the sample
matrix on the
selected wavelength was derived.
[0061] To
achieve better separation between adjacent absorption lines, the gas sensor
was
run at 0.1 atm pressure to narrow the absorbance bands without substantially
changing the peak
height of the bands. There were two major constraints on selecting the right
wavelength for H25
measurement: (1) strength of the absorption of H2 5 ; (2) strength of the
adjacent CH4 absorption
line and (3) spacing between the two lines. In FIG. 5, the visual
representation from the merit
scores show the distortion effects from nearby peaks and the sensitivity of
the peaks based on the
absorptivity coefficient for that peak (slope of the function for peak area
vs. concentration from
the calibration curve for that peak) for each individual peak in relation to
the noise level of the
baseline at that peak frequency of the target compound H25 as represented in
FIG. 4. FIG. 4
illustrates absorptivity coefficient examples for different peaks selected for
quantification (this is
the sensitivity data and correspond to the circles in FIG. 5). A larger slope
value indicates a
more sensitive peak.
[0062] FIG.
5 shows the comparison between different H25 absorption lines. The circles
above the peaks are noise levels at each line, which is inversely proportional
to the absorption
strength of the line and proportional to the noise from the source and
electronics given a specific
observation time. The squares above the peaks are merit scores of the line,
which evaluate the
influence (distortion) of the interference from the adjacent absorption lines
from other gases
found in the sample matrix. In FIG. 5, a lower score for each symbol is more
desirable ¨ the
CA 03027248 2018-12-10
WO 2018/022542 PCT/US2017/043588
desire is to have low squares and circles. The following gases, CH4, H20 and
CO2 were
considered for distortion calculations. In this graph, there are two candidate
lines having both
the low noise and low interference for successful H2S detection and
quantification: 5070 cm'
and 5092 cm'. These two lines are the selected bands for this illustrative
embodiment. The same
scoring system was used to explore the full range in the near to mid IR range.
These two lines
were the best candidates for selection and development of hardware.
[0063] In FIG. 6, the region that contains the two selected peaks is
represented by the box in
part of the NIR region considered for this illustrative embodiment. The entire
MID and NIR
spectral regions comprising 650-7000 cm' were considered in this study. The
boxed area is
where low squares and circles are present. Hundreds of peaks represented in
just the 300 cm'
window of the NIR region can be seen. Identifying wavelength ranges is very
complex because
it would not be possible to just pick a region or wave number by visually
searching for a
candidate peak. The entire MIR and NIR EM spectrum comprising over a thousand
candidate
peaks was considered. From these simulations, the two best candidate peaks
were identified.
Hardware was then developed for these target peaks.
[0064] In FIG. 7, the box containing the two candidate peaks was zoomed in
further in the
inset to demonstrate the box region identified still contained a large number
of candidate peaks.
When overlaid with the three interferences modeled and identified as a "mixed
spectrum", a
visual identification of these two candidate peaks would be impossible to
identify among the vast
number of interfering species absorption bands. FIG. 7 shows a region of
candidate peaks
identified by the models in relation to a subset of the NIR spectrum showing
both target
compound peaks (bottom spectrum) and a mixture of interfering peaks in one
spectrum (top
21
CA 03027248 2018-12-10
WO 2018/022542 PCT/US2017/043588
spectrum). In the inset, the top spectrum is for the target compound and the
bottom spectra are
interferents.
[0065] In FIG. 8, further zooming in of the window depicted in FIG. 7,
identified as
containing the two target peaks of Band 1 for successful H2S identification
and quantification in
a hydrocarbon rich sample matrix such as pipeline gas, demonstrates the model
was successful in
its selection of two peaks out of over a thousand other candidate peaks for
development of this
illustrative embodiment. Band 1 is the 5066-5076 cm' (1970 to 1974 nm). Band 2
(also shown
in FIG. 7) is the 5086-5097 cm' (1962-1966) nm wavelength range, which also
confirmed that
the model was successful. Visual determination of these two bands would have
been nearly
impossible to perform without the use of this dual factor model and the
further simulation
verification using surrogate absorption bands from a laser used in this study.
[0066] In certain embodiments, the output frequency of the light source 120
is varied so it is
repeatedly scanned across the wavelength range at a rate of 1 Hz to 1 KHz,
where the output
frequency of the light source 120 is varied and ultimately sampled by the
electronics with a
resolution of between 0.01 and 0.0001 cm'. The ability to scan across an
absorbance feature
using a narrow band TDL (or QCL) with an ultra-high (0.001 cm' or better)
resolution, allows
the user to then be able to obtain information on the spectral absorbance peak
of the compound.
These features may then be used with their interference peaks in powerful
chemometrics models
to further improve limits of detection (LOD).
[0067] The transfer optics 128 are configured to reflect a portion of the
light 126 to detector
132 and another portion of the light 134 to the sample cell 116. The light 126
reflected by the
transfer optics 128 is directed to a first detector 132 where it is measured
by the detector. The
detector 132 is therefore used to detect spectral properties (e.g., intensity,
spectral content) of the
22
CA 03027248 2018-12-10
WO 2018/022542 PCT/US2017/043588
light that is emitted by the TDL package 120, but which is not passed through
a sample gas in the
cell 116. The use of two detectors (132 and 152) results in the ability to
subtract out the
reference channel baseline signature (not subjected to the sample gas matrix)
from the sample
gas baseline to reduce the noise level of the measurement and improve the LOD
of H2S gas
concentration in the sample matrix.
[0068] The light 134 that enters the sample cell 116 passes through a lens
138 in the body of
the sample cell 116. Generally, the goal of this type of sample cell is to
improve detection
sensitivity by increasing the total optical path length that light travels
through a small sample
volume. A longer path length results in greater detection sensitivity.
Focusing mirrors are used
in the sample cell to redirect the light at each reflection point, resulting
in the light beam being
restricted to a predefined space along a controlled path until it exits the
sample cell. The output
of the cell is the input of an optical detector, which detects specific
changes in the properties of
the light that occur during interaction with the sample in the cell. After the
light 134 passes into
the sample cell 116, the light 134 is reflected back and forth within the cell
116 between a field
mirror 136 and two objective mirrors 140 opposite the field mirror 136.
Optical cells in which
light is reflected back and forth multiple times are often referred to as
multi-pass cells. White
cells and Herriott cells are two examples of multi-pass cells used in
spectroscopy applications
such as this one. In certain embodiments, the cell 116 and mirrors 136 and 140
are configured to
reflect the light back and forth multiple times until the light travels a
sufficient distance to
interact with the sample in the cell 116 to achieve the desired measurement
sensitivity. In certain
embodiments, the cell 116 and mirrors 136 and 140 are configured so the light
travels 10.2
meters before exiting the cell 116 via lens 142.
23
CA 03027248 2018-12-10
WO 2018/022542 PCT/US2017/043588
[0069] Light 144 exiting the cell 116 passes to a set of transfer optics
148, which direct the
light 144 to a second detector 152. The detector 152 is therefore used to
detect spectral
properties (e.g., intensity, spectral content) of light that is emitted by the
TDL package 120, but
which passes through the sample in the cell 116. The detectors 132 and 152
convert the received
light into signals 160 and 164, respectively, which correspond to the spectral
properties of the
light measured by the detectors. For example, the signals 160 and 164 may be
voltage signals
proportional to the spectral properties of the received light. In certain
embodiments, the
detectors 132 and 152 are non-liquid nitrogen cooled detectors responsive to
the target
compound region of interest that is based on a semiconductor technology
selected from the
group: mercury cadmium telluride (MCT), deuterated triglycine sulfate (DTGS),
Indium
Arsenide, Indium Antinomide, Indium Gallium Arsenide, or other diode or
semiconductor type
material.
[0070] The detectors 132 and 152 output the signals 160 and 164,
respectively, to a
processing module 156. The processing module 156 (e.g., a computer processor
or analog
electronics) synchronizes the wavelength scanning of TDL 120, and the detector
signal
acquisition, which generates absorption spectra of the sample gas in the
sample cell 116. The
synchronization allows one to align, in the time domain, the measurement of
the detector signal
to the driving of the laser so it is possible to assign the correct
wavenumbers more accurately to
the spectrum generated by the detector. The processing module 156 also
conducts the
chemometrics analysis on the absorption spectra either in the time domain or
frequency domain
(by demodulation) to differentiate different components in the gas mixture.
[0071] In certain embodiments, the pressure in the sample cell 116 is
reduced by a pump 168
to a desired level as measured by a pressure transducer 172. The pump 168 can
be, for example,
24
CA 03027248 2018-12-10
WO 2018/022542 PCT/US2017/043588
a vacuum pump that is used to lower the pressure in the cell 116. In certain
embodiments, the
pressure in the sample cell 116 is lowered below ambient air pressure (i.e.,
below 1 atmosphere
at sea level) to improve the sensitivity of the system 100 to detect the
substances (e.g., H2S) in
the sample cell. In certain embodiments, the pressure is lowered to, for
example, as much as
1/20 atmosphere or lower, to slightly less than 1 atmosphere. In some
embodiments, the pressure
will be maintained at 1 atm. The operational pressure will depend on the
presence of interfering
species peaks where lower pressure is required to narrow the absorbance peak
full width-half
height so that the target gas H2S absorbance or modulated peak is resolved
from any other peaks.
Reducing the gas pressure reduces the spectral linewidth of all gases in the
sample. By reducing
the pressure of natural gas in the sample cell, the system 100 reduces the
interference of the
natural gas and increases the sensitivity and accuracy of the system in
measuring H2S in the
sample cell 116. The bypass 180 is used to allow the sample gas, which has
been measured for
H2S concentration, to come to ambient pressure so that additional moisture
peaks may be
measured at 1 atm. A three-way valve 190 is used to release the vacuum in the
system or allow
the system to come to ambient pressure. Device 194 is an alternative pressure
source that can be
used to alter the pressure within the system.
[0072] FIG. 2 is a schematic illustration of a TDL package 200, according
to an illustrative
embodiment. The package 200 includes a laser waveguide 204 and a packaging
substrate 208.
The packaging substrate 208 is operatively coupled to the laser waveguide 204
to control the
temperature of the laser waveguide 204. The package 200 also includes a
controller 216 that is
used to control the temperature of the packaging substrate 208. The controller
216 receives a
temperature from the packaging substrate 208 and outputs a current signal to
the packaging
substrate 208 to control or, for example, maintain the packaging substrate 208
at a desired
CA 03027248 2018-12-10
WO 2018/022542 PCT/US2017/043588
temperature in order to stabilize the temperature of the laser waveguide 204.
Controller 212 is
coupled to the laser waveguide 204 to control the current supplied to the
laser waveguide 204.
The frequency of the light 216 output by the TDL package 200 is controlled by
changing the
temperature of the laser diode, which is a function of both packaging
substrate 208 temperature
and current supplied by controller 212. In certain embodiments, tuning of the
laser waveguide is
performed by changing the temperature of an optical grating in the laser
waveguide 204 which
changes the frequency that is being emitted by the semiconductor device.
[0073] When using the tunable diode laser spectroscopy (TDLS), a common
problem for
long term stability is the emission wavelength drift from the diode laser. For
example, the
measurement accuracy is compromised without the correction of the drift. A
widely used
method to line-lock the TDL and avoid drift is to install a separate
wavelength standard in the
optical path. For example, an etalone or a reference gas cell, which provides
a wavelength
modulation that is stable enough to measure the drift from the diode laser,
can be installed as a
separate wavelength standard in the optical path. The measurement result can
either be feedback
to the laser control to compensate the drift, or input to the spectroscopy
processing to correct the
x axis shift in the spectrum. However, the separate optical path with the
wavelength standard
complicates the system, decreases the robustness, and increases the cost of
the system.
[0074] To avoid the drawbacks caused by adding a separate optical path with
a wavelength
standard to the system, a methane absorption peak was used to line-lock (or
frequency load lock)
the emission of a DFB-TDL for measuring H2S in natural gas background (FIG.
9). Such a
system that uses a different background spectrum as a parasitical way to line-
lock is not common
in laser-based spectroscopy for natural gas, for example.
26
CA 03027248 2018-12-10
WO 2018/022542 PCT/US2017/043588
[0075] FIG. 9 shows an example of absorption features within the tuning
range of the laser.
The red curve is the methane absorption peak. The two blue peaks are the
selected absorption
features used for H2S measurement. The y axis is in the unit of absorbance.
The x axis is
wavelength in a unit related to the laser tuning position. If the emission of
the TDL is stable, the
red peak centers at about 10, and the two blue peaks center about 52 and 108,
respectively.
When the laser drifts, the relationship between the actual emission wavelength
and the laser
tuning position changes. Laser drift causes peak positions to shift from where
the peak positions
are expected to be, thereby causing errors in spectrum processing. As
described herein, the red
peak of FIG. 9 is from methane, which exists in the natural gas background. In
the provided
system, the laser pump current was varied to compensate for any drift from the
laser, and lock
the red peak to be at a value of about 10 at all times. Therefore, the H2S
peaks can be line-
locked (or frequency load locked) at about 52 and about 108. This setup
reduces noise.
[0076] In this application, including the definitions below, the term
'module' or the term
'controller' may be replaced with the term 'circuit.' The term 'module' may
refer to, be part of,
or include: an Application Specific Integrated Circuit (ASIC); a digital,
analog, or mixed
analog/digital discrete circuit; a digital, analog, or mixed analog/digital
integrated circuit; a
combinational logic circuit; a field programmable gate array (FPGA); a
processor circuit (shared,
dedicated, or group) that executes code; a memory circuit (shared, dedicated,
or group) that
stores code executed by the processor circuit; other suitable hardware
components that provide
the described functionality; or a combination of some or all of the above,
such as in a system-on-
chip.
[0077] The term code, as used above, may include software, firmware, and/or
microcode,
and may refer to programs, routines, functions, classes, data structures,
and/or objects. The term
27
CA 03027248 2018-12-10
WO 2018/022542 PCT/US2017/043588
shared processor circuit encompasses a single processor circuit that executes
some or all code
from multiple modules. The term group processor circuit encompasses a
processor circuit that,
in combination with additional processor circuits, executes some or all code
from one or more
modules. References to multiple processor circuits encompass multiple
processor circuits on
discrete dies, multiple processor circuits on a single die, multiple cores of
a single processor
circuit, multiple threads of a single processor circuit, or a combination of
the above. The term
shared memory circuit encompasses a single memory circuit that stores some or
all code from
multiple modules. The term group memory circuit encompasses a memory circuit
that, in
combination with additional memories, stores some or all code from one or more
modules.
[0078] The term memory circuit is a subset of the term computer-readable
medium. The
term computer-readable medium, as used herein, does not encompass transitory
electrical or
electromagnetic signals propagating through a medium (such as on a carrier
wave); the term
computer-readable medium may therefore be considered tangible and non-
transitory. Non-
limiting examples of a non-transitory, tangible computer-readable medium are
nonvolatile
memory circuits (such as a flash memory circuit, an erasable programmable read-
only memory
circuit, or a mask read-only memory circuit), volatile memory circuits (such
as a static random
access memory circuit or a dynamic random access memory circuit), magnetic
storage media
(such as an analog or digital magnetic tape or a hard disk drive), and optical
storage media (such
as a CD, a DVD, or a Blu-ray Disc).
[0079] The apparatuses and methods described in this application may be
partially or fully
implemented by a special purpose computer created by configuring a general
purpose computer
to execute one or more particular functions embodied in computer programs. The
functional
28
CA 03027248 2018-12-10
WO 2018/022542 PCT/US2017/043588
blocks and flowchart elements described above serve as software
specifications, which can be
translated into the computer programs by the routine work of a skilled
technician or programmer.
[0080] FIG. 10 shows an illustrative network environment 1000 for use in
the systems
described herein. In brief overview, referring now to FIG. 10, a block diagram
of an exemplary
cloud computing environment 1000 is shown and described. The cloud computing
environment
1000 may include one or more resource providers 1002a, 1002b, 1002c
(collectively, 1002).
Each resource provider 1002 may include computing resources. In some
implementations,
computing resources may include any hardware and/or software used to process
data. For
example, computing resources may include hardware and/or software capable of
executing
algorithms, computer programs, and/or computer applications. In some
implementations,
exemplary computing resources may include application servers and/or databases
with storage
and retrieval capabilities. Each resource provider 1002 may be connected to
any other resource
provider 1002 in the cloud computing environment 1000. In some
implementations, the resource
providers 1002 may be connected over a computer network 1008. Each resource
provider 1002
may be connected to one or more computing device 1004a, 1004b, 1004c
(collectively, 1004),
over the computer network 1008.
[0081] The cloud computing environment 1000 may include a resource manager
1006. The
resource manager 1006 may be connected to the resource providers 1002 and the
computing
devices 1004 over the computer network 1008. In some implementations, the
resource manager
1006 may facilitate the provision of computing resources by one or more
resource providers
1002 to one or more computing devices 1004. The resource manager 1006 may
receive a request
for a computing resource from a particular computing device 1004. The resource
manager 1006
may identify one or more resource providers 1002 capable of providing the
computing resource
29
CA 03027248 2018-12-10
WO 2018/022542 PCT/US2017/043588
requested by the computing device 1004. The resource manager 1006 may select a
resource
provider 1002 to provide the computing resource. The resource manager 1006 may
facilitate a
connection between the resource provider 1002 and a particular computing
device 1004. In
some implementations, the resource manager 1006 may establish a connection
between a
particular resource provider 1002 and a particular computing device 1004. In
some
implementations, the resource manager 1006 may redirect a particular computing
device 1004 to
a particular resource provider 1002 with the requested computing resource.
[0082] FIG. 11 shows an example of a computing device 1100 and a mobile
computing
device 1150 that can be used in the methods and systems described in this
disclosure. The
computing device 1100 is intended to represent various forms of digital
computers, such as
laptops, desktops, workstations, personal digital assistants, servers, blade
servers, mainframes,
and other appropriate computers. The mobile computing device 1150 is intended
to represent
various forms of mobile devices, such as personal digital assistants, cellular
telephones, smart-
phones, and other similar computing devices. The components shown here, their
connections
and relationships, and their functions, are meant to be examples only, and are
not meant to be
limiting.
[0083] The computing device 1100 includes a processor 1102, a memory 1104,
a storage
device 1106, a high-speed interface 1108 connecting to the memory 1104 and
multiple high-
speed expansion ports 1110, and a low-speed interface 1112 connecting to a low-
speed
expansion port 1114 and the storage device 1106. Each of the processor 1102,
the memory
1104, the storage device 1106, the high-speed interface 1108, the high-speed
expansion ports
1110, and the low-speed interface 1112, are interconnected using various
busses, and may be
mounted on a common motherboard or in other manners as appropriate. The
processor 1102 can
CA 03027248 2018-12-10
WO 2018/022542 PCT/US2017/043588
process instructions for execution within the computing device 1100, including
instructions
stored in the memory 1104 or on the storage device 1106 to display graphical
information for a
GUI on an external input/output device, such as a display 1116 coupled to the
high-speed
interface 1108. In other implementations, multiple processors and/or multiple
buses may be
used, as appropriate, along with multiple memories and types of memory. Also,
multiple
computing devices may be connected, with each device providing portions of the
necessary
operations (e.g., as a server bank, a group of blade servers, or a multi-
processor system).
[0084] The memory 1104 stores information within the computing device 1100.
In some
implementations, the memory 1104 is a volatile memory unit or units. In some
implementations,
the memory 1104 is a non-volatile memory unit or units. The memory 1104 may
also be another
form of computer-readable medium, such as a magnetic or optical disk.
[0085] The storage device 1106 is capable of providing mass storage for the
computing
device 1100. In some implementations, the storage device 1106 may be or
contain a computer-
readable medium, such as a floppy disk device, a hard disk device, an optical
disk device, or a
tape device, a flash memory or other similar solid state memory device, or an
array of devices,
including devices in a storage area network or other configurations.
Instructions can be stored in
an information carrier. The instructions, when executed by one or more
processing devices (for
example, processor 1102), perform one or more methods, such as those described
above. The
instructions can also be stored by one or more storage devices such as
computer- or machine-
readable mediums (for example, the memory 1104, the storage device 1106, or
memory on the
processor 1102).
[0086] The high-speed interface 1108 manages bandwidth-intensive operations
for the
computing device 1100, while the low-speed interface 1112 manages lower
bandwidth-intensive
31
CA 03027248 2018-12-10
WO 2018/022542 PCT/US2017/043588
operations. Such allocation of functions is an example only. In some
implementations, the high-
speed interface 1108 is coupled to the memory 1104, the display 1116 (e.g.,
through a graphics
processor or accelerator), and to the high-speed expansion ports 1110, which
may accept various
expansion cards (not shown). In the implementation, the low-speed interface
1112 is coupled to
the storage device 1106 and the low-speed expansion port 1114. The low-speed
expansion port
1114, which may include various communication ports (e.g., USB, Bluetoothg,
Ethernet,
wireless Ethernet) may be coupled to one or more input/output devices, such as
a keyboard, a
pointing device, a scanner, or a networking device such as a switch or router,
e.g., through a
network adapter.
[0087] The computing device 1100 may be implemented in a number of
different forms, as
shown in the figure. For example, it may be implemented as a standard server
1120, or multiple
times in a group of such servers. In addition, it may be implemented in a
personal computer such
as a laptop computer 1122. It may also be implemented as part of a rack server
system 1124.
Alternatively, components from the computing device 1100 may be combined with
other
components in a mobile device (not shown), such as a mobile computing device
1150. Each of
such devices may contain one or more of the computing device 1100 and the
mobile computing
device 1150, and an entire system may be made up of multiple computing devices
communicating with each other.
[0088] The mobile computing device 1150 includes a processor 1152, a memory
1164, an
input/output device such as a display 1154, a communication interface 1166,
and a transceiver
1168, among other components. The mobile computing device 1150 may also be
provided with
a storage device, such as a micro-drive or other device, to provide additional
storage. Each of
the processor 1152, the memory 1164, the display 1154, the communication
interface 1166, and
32
CA 03027248 2018-12-10
WO 2018/022542 PCT/US2017/043588
the transceiver 1168, are interconnected using various buses, and several of
the components may
be mounted on a common motherboard or in other manners as appropriate.
[0089] The processor 1152 can execute instructions within the mobile
computing device
1150, including instructions stored in the memory 1164. The processor 1152 may
be
implemented as a chipset of chips that include separate and multiple analog
and digital
processors. The processor 1152 may provide, for example, for coordination of
the other
components of the mobile computing device 1150, such as control of user
interfaces,
applications run by the mobile computing device 1150, and wireless
communication by the
mobile computing device 1150.
[0090] The processor 1152 may communicate with a user through a control
interface 1158
and a display interface 1156 coupled to the display 1154. The display 1154 may
be, for example,
a TFT (Thin-Film-Transistor Liquid Crystal Display) display or an OLED
(Organic Light
Emitting Diode) display, or other appropriate display technology. The display
interface 1156
may comprise appropriate circuitry for driving the display 1154 to present
graphical and other
information to a user. The control interface 1158 may receive commands from a
user and
convert them for submission to the processor 1152. In addition, an external
interface 1162 may
provide communication with the processor 1152, so as to enable near area
communication of the
mobile computing device 1150 with other devices. The external interface 1162
may provide, for
example, for wired communication in some implementations, or for wireless
communication in
other implementations, and multiple interfaces may also be used.
[0091] The memory 1164 stores information within the mobile computing
device 1150. The
memory 1164 can be implemented as one or more of a computer-readable medium or
media, a
volatile memory unit or units, or a non-volatile memory unit or units. An
expansion memory
33
CA 03027248 2018-12-10
WO 2018/022542 PCT/US2017/043588
1174 may also be provided and connected to the mobile computing device 1150
through an
expansion interface 1172, which may include, for example, a SIMM (Single In
Line Memory
Module) card interface. The expansion memory 1174 may provide extra storage
space for the
mobile computing device 1150, or may also store applications or other
information for the
mobile computing device 1150. Specifically, the expansion memory 1174 may
include
instructions to carry out or supplement the processes described above, and may
include secure
information also. Thus, for example, the expansion memory 1174 may be provided
as a security
module for the mobile computing device 1150, and may be programmed with
instructions that
permit secure use of the mobile computing device 1150. In addition, secure
applications may be
provided via the SIMM cards, along with additional information, such as
placing identifying
information on the SIMM card in a non-hackable manner.
[0092] The memory may include, for example, flash memory and/or NVRAM
memory (non-
volatile random access memory), as discussed below. In some implementations,
instructions are
stored in an information carrier and, when executed by one or more processing
devices (for
example, processor 1152), perform one or more methods, such as those described
above. The
instructions can also be stored by one or more storage devices, such as one or
more computer- or
machine-readable mediums (for example, the memory 1164, the expansion memory
1174, or
memory on the processor 1152). In some implementations, the instructions can
be received in a
propagated signal, for example, over the transceiver 1168 or the external
interface 1162.
[0093] The mobile computing device 1150 may communicate wirelessly through
the
communication interface 1166, which may include digital signal processing
circuitry where
necessary. The communication interface 1166 may provide for communications
under various
modes or protocols, such as GSM voice calls (Global System for Mobile
communications), SMS
34
CA 03027248 2018-12-10
WO 2018/022542 PCT/US2017/043588
(Short Message Service), EMS (Enhanced Messaging Service), or MMS messaging
(Multimedia
Messaging Service), CDMA (code division multiple access), TDMA (time division
multiple
access), PDC (Personal Digital Cellular), WCDMA (Wideband Code Division
Multiple Access),
CDMA2000, or GPRS (General Packet Radio Service), among others. Such
communication
may occur, for example, through the transceiver 1168 using a radio-frequency.
In addition,
short-range communication may occur, such as using a Bluetoothg, Wi-FiTM, or
other such
transceiver (not shown). In addition, a GPS (Global Positioning System)
receiver module 1170
may provide additional navigation- and location-related wireless data to the
mobile computing
device 1150, which may be used as appropriate by applications running on the
mobile computing
device 1150.
[0094] The mobile computing device 1150 may also communicate audibly using
an audio
codec 1160, which may receive spoken information from a user and convert it to
usable digital
information. The audio codec 1160 may likewise generate audible sound for a
user, such as
through a speaker, e.g., in a handset of the mobile computing device 1150.
Such sound may
include sound from voice telephone calls, may include recorded sound (e.g.,
voice messages,
music files, etc.) and may also include sound generated by applications
operating on the mobile
computing device 1150.
[0095] The mobile computing device 1150 may be implemented in a number of
different
forms, as shown in the figure. For example, it may be implemented as a
cellular telephone 1180.
It may also be implemented as part of a smart-phone 1182, personal digital
assistant, or other
similar mobile device.
[0096] Various implementations of the systems and techniques described here
can be
realized in digital electronic circuitry, integrated circuitry, specially
designed ASICs (application
CA 03027248 2018-12-10
WO 2018/022542 PCT/US2017/043588
specific integrated circuits), computer hardware, firmware, software, and/or
combinations
thereof. These various implementations can include implementation in one or
more computer
programs that are executable and/or interpretable on a programmable system
including at least
one programmable processor, which may be special or general purpose, coupled
to receive data
and instructions from, and to transmit data and instructions to, a storage
system, at least one
input device, and at least one output device.
[0097] These computer programs (also known as programs, software, software
applications
or code) include machine instructions for a programmable processor, and can be
implemented in
a high-level procedural and/or object-oriented programming language, and/or in
assembly/machine language. As used herein, the terms machine-readable medium
and
computer-readable medium refer to any computer program product, apparatus
and/or device
(e.g., magnetic discs, optical disks, memory, Programmable Logic Devices
(PLDs)) used to
provide machine instructions and/or data to a programmable processor,
including a machine-
readable medium that receives machine instructions as a machine-readable
signal. The term
machine-readable signal refers to any signal used to provide machine
instructions and/or data to
a programmable processor.
[0098] To provide for interaction with a user, the systems and techniques
described here can
be implemented on a computer having a display device (e.g., a CRT (cathode ray
tube) or LCD
(liquid crystal display) monitor) for displaying information to the user and a
keyboard and a
pointing device (e.g., a mouse or a trackball) by which the user can provide
input to the
computer. Other kinds of devices can be used to provide for interaction with a
user as well; for
example, feedback provided to the user can be any form of sensory feedback
(e.g., visual
36
CA 03027248 2018-12-10
WO 2018/022542 PCT/US2017/043588
feedback, auditory feedback, or tactile feedback); and input from the user can
be received in any
form, including acoustic, speech, or tactile input.
[0099] The systems and techniques described here can be implemented in a
computing
system that includes a back end component (e.g., as a data server), or that
includes a middleware
component (e.g., an application server), or that includes a front end
component (e.g., a client
computer having a graphical user interface or a Web browser through which a
user can interact
with an implementation of the systems and techniques described here), or any
combination of
such back end, middleware, or front end components. The components of the
system can be
interconnected by any form or medium of digital data communication (e.g., a
communication
network). Examples of communication networks include a local area network
(LAN), a wide
area network (WAN), and the Internet.
[0100] The computing system can include clients and servers. A client and
server are
generally remote from each other and typically interact through a
communication network. The
relationship of client and server arises by virtue of computer programs
running on the respective
computers and having a client-server relationship to each other.
[0101] While the description includes specific embodiments, it should be
understood by
those skilled in the art that various changes in form and detail may be made
therein without
departing from the spirit and scope of the invention as defined by the
appended claims.
Equivalents
[0102] While the invention has been particularly shown and described with
reference to
specific preferred embodiments, it should be understood by those skilled in
the art that various
changes in form and detail may be made therein without departing from the
spirit and scope of
37
CA 03027248 2018-12-10
WO 2018/022542 PCT/US2017/043588
the invention as defined by the appended claims. The relevant teachings of all
the references,
patents and patent applications cited herein are incorporated herein by
reference in their entirety.
38