Note: Descriptions are shown in the official language in which they were submitted.
CA 03027424 2018-12-11
WO 2018/013913 PCT/US2017/042121
SYSTEMS AND METHODS FOR DETERMINING, TRACKING, AND PREDICTING
COMMON INFECTIOUS ILLNESS OUTBREAKS
CROSS-REFERENCE TO RELATED APPLICATION
[00011 The present application claims priority to United States
Provisional Patent
Application Serial No. 62/362,608, filed July 15, 2016 and entitled "Systems
and Methods
for Determining, Tracking, and Predicting Common Illness Outbreaks," the
entire contents of
which is incorporated herein by reference.
TECHNICAL FIELD
[0002] The present specification generally relates systems and methods
for monitoring
common infectious illness diagnoses and, more specifically, to systems and
methods for
determining, tracking, and predicting a common infectious illness outbreak.
BACKGROUND
[0003] Common infectious illnesses can be a nuisance in the sense that
they disrupt home
schedules and cause individuals to miss school and/or work. In addition,
common infectious
illnesses can exacerbate serious illnesses or other health problems. As such,
individuals may
desire to avoid contracting such common infectious illnesses and may go to
certain lengths to
avoid coming into contact with others that have the illness or are exhibiting
symptoms
thereof.
[0004] Because common infectious illnesses are typically non-life
threatening and can be
very prevalent at times, public health authorities generally do not focus
their efforts on
tracking such illnesses and such illnesses are generally not officially
reported. Rather, public
health authorities tend to focus on more debilitating diseases and illnesses
that can result in
mortality, birth defects, serious injury, and/or the like. Systems and methods
that arc related
to tracking common infectious illness generally access self-reporting data,
such as social
network data and/or patient complaint data, which can be unreliable because an
individual
may report that he/she has a particular illness when in fact he/she does not
have that illness or
has a different illness. In addition, it may be unreliable to track a location
of a person having
a particular illness via self-reporting data.
1
CA 03027424 2018-12-11
WO 2018/013913 PCT/US2017/042121
[0005] Accordingly, a need exists for systems and methods that determine,
track, and
predict common infectious illnesses using reliable data, such as medical
coding and/or
insurance databases.
SUMMARY
[0006] In an embodiment, a computer-based method of tracking a common
infectious
illness and disseminating information regarding the common infectious illness
to a plurality
of users via one or more of a mobile device and a user computing device
includes receiving,
by a processing device, data from one or more electronic sources; determining,
by the
processing device, the common infectious illness from the data; determining,
by the
processing device, one or more of a location and a frequency of the common
infectious
illness from the data; and plotting, by the processing device, information
relating to the
common infectious illness on a map. The information includes a current
severity of the
common infectious illness in a particular area and predicted trend of the
severity of the
common infectious illness. The method further includes providing, by the
processing device,
.. the map to the plurality of users.
[0007] In another embodiment, a system for tracking a common infectious
illness and
disseminating information regarding the common infectious illness to a
plurality of users via
one or more of a mobile device and a user computing device includes a
processing device and
a non-transitory, processor-readable storage medium. The non-transitory,
processor readable
storage medium includes one or more programming instructions thereon that,
when executed,
cause the processing device to receive data from one or more electronic
sources; determine
the common infectious illness from the data; determine one or more of a
location and a
frequency of the common infectious illness from the data; and plot information
relating to the
common infectious illness on a map. The information comprises a current
severity of the
common infectious illness in a particular area and predicted trend of the
severity of the
common infectious illness. The programming instructions further cause the
processing
device to provide the map to the plurality of users.
[0008] In yet another embodiment, a computer-based method of tracking a
plurality of
common infectious illnesses and disseminating information regarding each
common
infectious illness from the plurality of common infectious illnesses to a
plurality of users via
one or more of a mobile device and a user computing device includes receiving,
by a
processing device, data from one or more electronic sources; determining, by
the processing
device, each common infectious illness from the data; determining, by the
processing device,
2
CA 03027424 2018-12-11
WO 2018/013913 PCT/US2017/042121
one or more of a location and a frequency of each common infectious illness
from the data;
and plotting, by the processing device, information relating to each common
infectious illness
on a map. The information includes a current severity of each common
infectious illness in a
particular area and predicted trend of the severity of each common infectious
illness. The
computer-based method further includes providing, by the processing device,
the map to the
plurality of users.
[0009] These and additional features provided by the embodiments
described herein will
be more fully understood in view of the following detailed description, in
conjunction with
the drawings.
BRIEF DESCRIPTION OF THE DRAWINGS
[0010] The embodiments set forth in the drawings are illustrative and
exemplary in nature
and not intended to limit the subject matter defined by the claims. The
following detailed
description of the illustrative embodiments can be understood when read in
conjunction with
the following drawings, where like structure is indicated with like reference
numerals and in
which:
[0011] FIG. 1 schematically depicts an illustrative computing network
according to one
or more embodiments shown and described herein;
[0012] FIG. 2A schematically depicts a block diagram of illustrative
hardware of a
computing network according to one or more embodiments shown and described
herein;
[0013] FIG. 2B schematically depicts a block diagram of software modules
contained
within a memory of a computing device according to one or more embodiments
shown and
described herein;
[0014] FIG. 2C schematically depicts a block diagram of various data
contained within a
data storage component of a computing device according to one or more
embodiments shown
and described herein;
[0015] FIG. 3 depicts a flow diagram of an illustrative method of
tracking and predicting
common infectious illness outbreaks according to one or more embodiments shown
and
described herein;
[0016] FIG. 4 depicts a flow diagram of an illustrative method of
determining a location
and frequency of an illness from received data according to one or more
embodiments shown
and described herein;
[0017] FIG. 5 depicts a screen shot of an illustrative user interface
containing a map
according to one or more embodiments shown and described herein;
3
CA 03027424 2018-12-11
WO 2018/013913 PCT/US2017/042121
[0018] FIG. 6 depicts a screen shot of an illustrative user interface
containing a
description of a common infectious illness according to one or more
embodiments shown and
described herein;
[0019] FIG. 7 depicts a screen shot of an illustrative user interface
containing a chart of
historical trends according to one or more embodiments shown and described
herein;
[0020] FIG. 8 depicts a screen shot of an illustrative user interface
containing forecast
trends according to one or more embodiments shown and described herein; and
[0021] FIG. 9 depicts a screen shot of an illustrative user interface
containing age group
trends according to one or more embodiments shown and described herein.
DETAILED DESCRIPTION
[0022] The embodiments described herein are generally directed to systems
and methods
that obtain data from medical, insurance, and/or public health related
sources, determine
common infectious illness information from the data, plot the common
infectious illness
information on a map, and predict an outbreak of the common infectious illness
based on the
plots on the map. The data may be collected over a period of time such that
movement in the
plots can be observed (e.g., certain areas are seeing an increase in a
particular illness over a
period of time). The systems and methods described herein can also be used to
present the
mapped information to one or more users (e.g., via a website, a mobile app
and/or the like) so
as to notify the one or more users of a predicted outbreak. In addition, the
systems and
methods described herein can provide the one or more users in an area where an
outbreak
currently exists or is predicted to exist with information on preventing
contraction of the
common infectious illness, treatment options, medical staff contact
information, and/or the
like.
[00231 As used herein, the term "common infectious illness" generally
refers to illnesses
that are frequently contracted by members of a population in a developed
country. While
such illnesses can be life threatening at least to a certain subset of the
population, in general
such illnesses are viewed more as a nuisance than a life threatening disease.
That is, in
general, an average member of the population can and does recover from the
illness after
being treated and/or after a certain period of time has elapsed. Such common
infectious
illnesses are generally contagious and can spread between individuals of a
population.
Illustrative examples of such common infectious illnesses include, but are not
limited to, the
common cold, bronchitis, bronchiolitis, gastroenteritis, mononucleosis, an ear
infection,
Lyme disease, otitis media (i.e., middle ear infection), acute sinusitis
(i.e., sinus infection),
4
CA 03027424 2018-12-11
WO 2018/013913 PCT/US2017/042121
streptococcal pharyngitis (i.e., strep throat), tonsillitis, upper respiratory
infections such as
laryngotracheobronchitis (i.e., croup), influenza (including type A flu and
type B flu),
pneumonia, or the like, conjunctivitis, methicillin-resistant staphylococcus
aureus (MRSA)
infections, respiratory syncytial virus (RSV), and the like.
[00241 FIG. I depicts an illustrative computing network that depicts
components for a
system that obtains, tracks, and predicts common infectious illness outbreaks
according to
embodiments shown and described herein. As illustrated in FIG. 1, a computer
network 100
may include a wide area network (WAN), such as the Internet, a local area
network (LAN), a
mobile communications network, a public service telephone network (PSTN), a
personal area
network (PAN), a metropolitan area network (MAN), a virtual private network
(VPN), and/or
another network. The computer network 100 may generally be configured to
electronically
connect one or more computing devices and/or components thereof. Illustrative
computing
devices may include, but are not limited to, a user computing device 200, a
mobile computing
device 125, and a server computing device 150.
[0025] The mobile computing device 125 and the user computing device 200
may each
generally be used as an interface between a user and the other components
connected to the
computer network 100, and/or various other components communicatively coupled
to the
mobile computing device 125 and/or the user computing device 200 (such as
components
communicatively coupled via one or more networks to the mobile computing
device 125
and/or the user computing device 200), whether or not specifically described
herein. Thus,
the mobile computing device 125 and/or the user computing device 200 may be
used to
perform one or more user-facing functions, such as receiving one or more
inputs from a user
or providing information to the user. Additionally, in the event that the
server computing
device 150 requires oversight, updating, or correction, the mobile computing
device 125
and/or the user computing device 200 may be configured to provide the desired
oversight,
updating, and/or correction. The mobile computing device 125 and/or the user
computing
device 200 may also be used to input additional data into a data storage
portion of the server
computing device 150. Illustrative examples of the mobile computing device 125
and/or the
user computing device 200 include a smartphone, a tablet, a personal computer,
an Internet-
.. connected user device (such as a smart watch, a fitness band, a personal
assistant device, and
the like), an Internet-connected consumer electronic device, and the like. In
some
embodiments, the mobile computing device 125 and/or the user computing device
200 may
be a generic device that can be loaded with a software program, module, and/or
the like to
provide the functionality described herein. In other embodiments, the mobile
computing
5
CA 03027424 2018-12-11
WO 2018/013913 PCT/US2017/042121
device 125 and/or the user computing device 200 may be a specialized device
that is
particularly designed and configured to provide the functionality described
herein.
[0026] The server computing device 150 may receive electronic data and/or
the like from
one or more sources (e.g., the mobile computing device 125, the user computing
device 200,
and/or one or more databases), direct operation of one or more other devices
(e.g., the mobile
computing device 125 and/or the user computing device 200), contain data
relating to
common infectious illnesses, contain mapping data, generate plots on a map
based on
information generated from the common infectious illness data, contain medical
provider
information, contain information regarding treatment of common infectious
illnesses, contain
information regarding prevention against common infectious illnesses, and/or
the like.
[0027] It should be understood that while the user computing device 200
is depicted as a
personal computer, the mobile computing device 125 as a smartphone, and the
server
computing device 150 is depicted as a server, these are nonlimiting examples.
More
specifically, in some embodiments, any type of computing device (e.g., mobile
computing
device, personal computer, server, etc.) may be used for any of these
components.
Additionally, while each of these computing devices is illustrated in FIG. 1
as a single piece
of hardware, this is also merely an example. More specifically, each of the
user computing
device 200, the mobile computing device 125, and the server computing device
150 may
represent a plurality of computers, servers, databases, mobile devices,
components, and/or the
like.
[0028] In addition, while the present disclosure generally relates to
computing devices,
the present disclosure is not limited to such. For example, various electronic
devices that
may not be referred to as computing devices but are capable of providing
functionality
similar to the computing devices described herein, may be used. Illustrative
examples of
electronic devices include, for example, certain electronic medical equipment,
Internet-
connected electronic devices (such as certain communications devices), and/or
the like may
be used.
[0029] In some embodiments, the computer network 100 may further include
one or more
medical devices 175. Such medical devices 175 may directly obtain information
from
subjects, such as information related to an illness or lack thereof, and
provide such
information as data to be used as described herein. Illustrative examples of
such medical
devices 175 include, but are not limited to, blood pressure monitoring
devices, thermometers,
pulse oximeters, heart rate monitors, laboratory analysis equipment (e.g.,
equipment that
6
CA 03027424 2018-12-11
WO 2018/013913 PCT/US2017/042121
receives a biological sample or the like from a subject, conducts testing,
and/or determines
whether the subject has a particular infection or the like from the sample)
and/or the like.
[0030] It should be understood that while the embodiments depicted herein
refer to a
network of computing devices, the present disclosure is not solely limited to
such a network.
For example, in some embodiments, the various processes described herein may
be
completed by a single computing device, such as a non-networked computing
device or a
networked computing device that does not use the network to complete the
various processes
described herein.
[0031] In some embodiments, the network of computing devices may be a
specialized
network of devices that is particularly configured to provide the
functionality described
herein. Such a specialized network, by eliminating unnecessary components or
functionality,
may be able to operate more quickly and/or efficiently to determine an illness
outbreak, map
the illness outbreak, and notify certain individuals to take preventative
action, relative to a
generic computer network that allows connection between connected devices.
Moreover,
such functionality, despite being wholly within one or more computing devices,
provides real
world results that have not been observed before. More specifically, users of
the devices
described herein are able to be aware of common infectious illness outbreaks
to react
accordingly, whereas otherwise such users would not be aware of illness
outbreaks and may
not take the necessary precautions to prevent further spread of disease.
[0032] Illustrative hardware components of the user computing device 200,
the mobile
computing device 125, and/or the server computing device 150 are depicted in
FIG. 2A. A
bus 201 may interconnect the various components. A processing device 205, such
as a
computer processing unit (CPU), may be the central processing unit of the
computing device,
performing calculations and logic operations required to execute a program.
The processing
device 205, alone or in conjunction with one or more of the other elements
disclosed in FIG.
2A, is an illustrative processing device, computing device, processor, or
combination thereof,
as such terms are used within this disclosure. Memory 210, such as read only
memory
(ROM) and random access memory (RAM), may constitute an illustrative memory
device
(i.e., a non-transitory processor-readable storage medium). Such memory 210
may include
one or more programming instructions thereon that, when executed by the
processing device
205, cause the processing device 205 to complete various processes, such as
the processes
described herein. Optionally, the program instructions may be stored on a
tangible computer-
readable medium such as a compact disc, a digital disk, flash memory, a memory
card, a USB
7
CA 03027424 2018-12-11
WO 2018/013913 PCT/US2017/042121
drive, an optical disc storage medium, such as a Blu-ray "4 disc, and/or other
non-transitory
processor-readable storage media.
[0033] In some embodiments, the program instructions contained on the
memory 210
may be embodied as a plurality of software modules, where each module provides
programming instructions for completing one or more tasks. For example, as
shown in FIG.
2B, the memory 210 may contain operating logic 212, evaluation logic 214,
mapping logic
216, and/or reporting logic 218. The operating logic 212 may include an
operating system
and/or other software for managing components of a computing device. The
evaluation logic
214 may include one or more software modules for obtaining data, generating
common
infectious illness information from the obtained data, and/or predicting
outbreaks of common
infectious illnesses. The mapping logic 216 may include one or more software
modules for
evaluating the common infectious illness information, plotting the information
on a map,
and/or predicting outbreaks of common infectious illnesses. The reporting
logic 218 may
contain one or more software modules for reporting outbreak information to one
or more
users.
[0034] Referring again to FIG. 2A, a storage device 250, which may
generally be a
storage medium that is separate from the memory 210, may contain one or more
data
repositories for storing data that is received as a result of reporting, data
containing
information that is received from medical devices, data that is generated as a
result of
determining and/or predicting a common infectious illness outbreak, data that
is generated
relating to mapping a common infectious illness outbreak, information
regarding users that
receive and/or wish to receive information regarding common infectious illness
outbreaks,
and/or the like. The storage device 250 may be any physical storage medium,
including, but
not limited to, a hard disk drive (HDD), memory, removable storage, and/or the
like. While
the storage device 250 is depicted as a local device, it should be understood
that the storage
device 250 may be a remote storage device, such as, for example, a server
computing device
or the like.
[0035] Illustrative data that may be contained within the storage device
250 is depicted in
FIG. 2C. As shown in FIG. 2C, the storage device 250 may include, for example,
public
health data 252, diagnosis data 254, mapping data 256, and/or reporting data
258. Public
health data 252 may include, for example, data that is obtained from or stored
by public
health authorities, particularly data relating to common infectious illnesses.
For example,
public health data 252 may include data that is stored in a database or the
like maintained by
local health authorities (e.g., city and/or county departments of health),
state health
8
CA 03027424 2018-12-11
WO 2018/013913 PCT/US2017/042121
authorities, the Centers for Disease Control (CDC), the World Health
Organization (WHO),
or the like. As such, the public health data 252 may be stored in a data
storage device 250
that is separate from other data storage devices containing other data as
described herein.
Diagnosis data 254 may include, for example, data relating to one or more
medical diagnoses,
particularly diagnoses of common infectious illnesses. For example, diagnosis
data 254 may
include data that is stored in a database or the like maintained by a medical
professional, a
medical group, a health insurance carrier, and/or the like. In another
example, diagnosis data
254 may also include data that is received directly from medical devices, such
as the medical
devices described herein. In some embodiments, the diagnosis data 254 may be
stored in a
data storage device 250 that is separate from other data storage devices
containing other data
as described herein. Mapping data 256 may include, for example, data generated
as the result
of plotting information relating to common infectious illnesses to maps for
the purposes of
predicting outbreaks and informing individuals, as described in greater detail
herein.
Reporting data 258 may include, for example, contact information, personal
information,
desired settings information, and/or the like from users of the systems
described herein such
that users that desire to receive the various information described herein are
adequately
provided with relevant information.
[00361 Referring again to FIG. 2A, an optional user interface 220 may
permit information
from the bus 201 to be displayed on a display 225 portion of the computing
device in audio,
visual, graphic, or alphanumeric format. Moreover, the user interface 220 may
also include
one or more inputs 230 that allow for transmission to and receipt of data from
input devices
such as a keyboard, a mouse, a joystick, a touch screen, a remote control, a
pointing device, a
video input device, an audio input device, a haptic feedback device, and/or
the like. Such a
user interface 220 may be used, for example, to allow a user to interact with
the computing
device or any component thereof.
[00371 A system interface 235 may generally provide the computing device
with an
ability to interface with one or more of the components of the computer
network 100 (FIG.
1). Communication with such components may occur using various communication
ports
(not shown). An illustrative communication port may be attached to a
communications
network, such as the Internet, an intranet, a local network, a direct
connection, and/or the like.
[00381 A communications interface 245 may generally provide the computing
device
with an ability to interface with one or more external components, such as,
for example, an
external computing device, a remote server, and/or the like. Communication
with external
devices may occur using various communication ports (not shown). An
illustrative
9
CA 03027424 2018-12-11
WO 2018/013913 PCT/US2017/042121
communication port may be attached to a communications network, such as the
Internet, an
intranet, a local network, a direct connection, and/or the like.
[0039] It should be understood that the components illustrated in FIGS.
2A-2C are
merely illustrative and are not intended to limit the scope of this
disclosure. More
specifically, while the components in FIGS. 2A-2C are illustrated as residing
within the
server computing device 150, the mobile computing device 125, or the user
computing device
200, these are nonlimiting examples. In some embodiments, one or more of the
components
may reside external to the server computing device 150, the mobile computing
device 125,
and/or the user computing device 200. Similarly, one or more of the components
may be
embodied in other computing devices not specifically described herein.
[0040] Referring now to FIG. 3, a method of tracking and predicting
common infectious
illnesses is described. Such a method may be completed by one or more devices
and/or
systems, such as, for example, the devices and/or systems described herein.
[0041] At step 305, data may be received. The data may be received from
any database
that includes health related data, particularly data relating to common
infectious illnesses. In
some embodiments, the data may be received from a cloud based health data
provider, a data
source, a data analyst, and/or the like.
[0042] In some embodiments, such databases may include databases that are
maintained
by medical personnel (e.g., hospital network and/or doctor's office databases)
and/or medical
insurance carrier databases. However, the present disclosure is not limited to
such, and the
data may be received from other databases. The data may generally be received
by accessing
the databases and obtaining the data therefrom. In some embodiments, data may
be received
from various medical devices, such as, for example, the medical devices 175
described herein
with respect to FIG. 1. The data may be received directly from the various
medical devices
or may be passed through the one or more databases before being received.
[0043] In some embodiments, the data may be received continuously. In
other
embodiments, the data may be received at various intervals. For example, the
data may be
received as a compilation of information that is provided, for example, on a
daily basis, a
weekly basis, a biweekly basis, a monthly basis, and/or the like. In some
embodiments, data
may be automatically pushed such that it is received as described with respect
to step 305. In
other embodiments, the data may be received in response to a request to obtain
the data. That
is, a computing device (such as, for example, the server computing device 150
depicted in
FIG. 1) may transmit a request to an external source (e.g., a remote database,
the medical
device 175 depicted in FIG. 1, and/or the like), where the request includes a
request for
CA 03027424 2018-12-11
WO 2018/013913 PCT/US2017/042121
particular data held by the source, and the source provides the particular
data in response to
the request.
[0044] The data that is received according to step 305 generally relates
to common
infectious illness diagnoses. That is, the data may include information
regarding a common
infectious illness diagnosis, the type of illness, the severity of illness,
the onset of the illness,
the date of diagnosis, the treatment provided, medications prescribed, and/or
the like. In
some embodiments, the data may contain the actual diagnosis made by medical
personnel. In
other embodiments, the data may not provide the actual diagnosis, but may be
data that was
used by medical personnel to make the diagnosis. The data may be provided in
the aggregate
and may not contain any patient identifying information, so as to protect
patients' privacy.
That is, the data may contain information about each diagnosis that was made,
how it was
made (i.e., data relating to testing that was completed, etc.), and/or the
like, but may not
contain any personally identifying information, such as a subject's name,
birthdate, social
security number, address, and/or the like. In addition, the data may not
contain information
that could potentially be used to identify a particular individual (i.e.,
specific demographic
information about the subject, together with the subject's zip code or the
like that could
potentially be used to identify the subject). An illustrative example of the
data includes ICD-
10 code data, such as ICD-10 code data that is transmitted from medical
personnel to health
insurance providers, medical billing companies, public health organizations,
and/or the like.
ICD-10 generally refers to the 10th revision of the International Statistical
Classification of
Diseases and Related Health Problems (ICD), which is a medical classification
list provided
by the World Health Organization (WHO). The ICD-10 contains codes for
diseases, signs,
symptoms, abnormal findings, complaints, social circumstances, and external
causes of injury
or diseases. ICD-10, as used herein, includes various sub-classifications
and/or various
national modifications, such as, for example, the U.S. ICD-10 Clinical
Modification (ICD-10-
CM), and the U.S. ICD-10 Procedure Coding System (ICD-10-PCS). Other details
of the
ICD-10 codes, as well as modifications thereof, should generally be
understood. Use of ICD-
10 code data for the purposes of predicting common infectious illness
outbreaks as described
herein may be advantageous over use of other types of medical coding data,
such as ICD-9
data, because it is more robust and more accurate for the purposes of
determining outbreaks.
It should be understood that ICD-10 code data is merely one illustrative
example, and other
data, including data now known or later developed, may also be used without
departing from
the scope of the present disclosure.
11
CA 03027424 2018-12-11
WO 2018/013913 PCT/US2017/042121
[0045] At step 310, the common infectious illness may be determined from
the data.
Determining the common infectious illness may include analyzing the data and
extracting a
diagnosis from the data (e.g., a diagnosis made by medical personnel and
provided with the
data). For example, the data may contain ICD-10 code J00, which is the code
for acute
nasopharyngitis, which is also referred to as the common cold. As such,
determining at step
310 may include analyzing the data to discover code J00 and using a lookup
table or the like
(e.g., accessing a supplemental database) to extract/determine the
corresponding diagnosis
(acute nasopharyngitis). If ICD-10 codes for other diagnoses that are not
related to common
infectious illnesses (e.g., code F03, which is the code for unspecified
dementia) are
discovered, such codes may be ignored. In such instances, the data may be
further analyzed
for other codes related specifically to common infectious illnesses.
[0046] Once the common infectious illness has been determined, the
location and
frequency of the illness may be determined at step 315. Such a determination
may generally
include analyzing additional information contained within the data that
relates to location
(e.g., location of medical personnel where the diagnosis was made),
determining from the
data the number of times the illness has been diagnosed, determining the
location of the
medical facility at which the illness was diagnosed, determining the location
(e.g., zip code)
of the subject that was diagnosed (if available), and/or the like. FIG. 4
provides additional
detail regarding the determination of location and frequency. For example, at
step 410, the
data that was received may be normalized.
[0047] Normalizing the data may include projecting to correct for delays
in receiving the
data. That is, as described herein, data may be received periodically, which
may result in
data that encompasses a particular time period (e.g., data encompassing 3
days' worth of
diagnoses), and receipt may be delayed (e.g., data may be received 7-9 days
after it is
generated). As such, it may be necessary to project total cases for a given
week based on the
received data, and update the determination once the data corresponding to the
remainder of
the week is received.
[0048] In some embodiments, normalizing the data may include adjusting
the number of
cases to cases per 100,000 people such that the cases can be compared
nationally. For
example, if 10 cases of the common cold are reported in a given week for a
population of
1,000 individuals, this may be adjusted to correspond to the number of cases
that likely
would be present in a population of 100,000 individuals (i.e., 10,000 cases).
In addition, the
number of cases may be adjusted based on particular age ranges of subjects
(e.g., 0-1 years
old, 2-4 years old, 5-12 years old, 13-17 years old, 18-22 years old, 23-54
years old, 55+
12
1
CA 03027424 2018-12-11
WO 2018/013913 PCT/US2017/042121
years old). Such information may be based on data received from other
databases, such as,
for example, U.S. census data. While a population of 100,000 individuals is
used herein, it
should be understood that such a number is merely illustrative, and
normalizing may include
adjusting the number of cases as appropriate without departing from the scope
of the present
disclosure.
[00491 In some embodiments, the data may be normalized to account for
incubation
periods of common infectious illnesses such that, when the data is reported as
described in
greater detail herein, it reflects current illness levels rather than
historical illness levels. It
should be understood that particular infectious illnesses may have an
incubation period in
which a subject has the disease, but is not exhibiting any symptoms. For
example, the
common cold may have an incubation period of about 24-72 hours. In another
example,
mononucleosis may have an incubation period of about 4-6 weeks. As such, data
smoothing
may be used to account for these incubation periods to ensure that the
diagnosis information
corresponds to when an individual is actually infected. For example, current
risks may be
calculated from data received from more than the previous week, such as from
the previous
two weeks, the previous three weeks, the previous 4 weeks, and/or the like.
[00501 Similar to the incubation period, in some embodiments, the data
may be
normalized to account for periods wherein an individual is infectious (i.e.,
contagious) with a
common infectious illness such that, when the data is reported as described in
greater detail
herein, it accurately reflects current illness levels. It should be understood
that an infectious
individual may be contagious (i.e., able to spread the disease to others), but
may not
necessarily be exhibiting any symptoms. As such, data smoothing may be used to
account
for these infectious periods to ensure that the diagnosis information
corresponds to when an
individual is actually infected.
[0051] At step 420, the various locations of the common infectious
illnesses may be
determined. Such a determination may include projecting a patient location
based on the
location of the medical facility (e.g., a doctor's office or the like). That
is, as described
herein, the data that is received may include location data corresponding to
the medical
facility where the diagnosis was made. In some embodiments, the received data
may specify
a general area of the location, which may be based on, for example, a postal
code or the like.
For example, in the United States, the data may specify a ZIP code, such as a
9 digit ZIP
code, a 5 digit ZIP code, or may provide the first 3 digits of a 9 or 5 digit
ZIP code. Since the
first three digits in a 5 or 9 digit ZIP code in the United States may refer
to a relatively large
geographical area (e.g., a large metropolitan area, a region of a particular
state, or the like),
13
CA 03027424 2018-12-11
WO 2018/013913 PCT/US2017/042121
and subjects may travel out of their home ZIP code to see medical personnel,
it may be
necessary to make a series of assumptions to ensure the location data is
correctly determined.
Such assumptions may be based on doctor per population numbers in particular
ZIP codes.
For example, if a median number of medical service providers in a particular
zip code is 50
out of 100 and a particular ZIP code has about 60 or greater, such a ZIP code
may be
assumed to receive subjects from an area outside the ZIP code. In contrast, if
a particular ZIP
code has about 40 or less, such a ZIP code may be assumed to send subjects to
an area
outside the ZIP code. If the above two ZIP codes are adjacent to one another,
they may each
be adjusted to be closer to the median. As such, particular cases may be moved
to ZIP codes
of surrounding areas based on a typical distance traveled by subjects to see
medical
personnel. For example, if a typical distance that a subject will travel to
visit medical
personnel is about a 20 mile radius from the subject's home, then the cases
may be moved to
ZIP codes of surrounding areas that are within 20 miles of where the case was
reported.
Therefore, the cases per ZIP code may be normalized in accordance with a
particular medical
personnel density. Such distribution may also be based on obtained data
relating to
population density (i.e., subjects may travel less in more population dense
areas than subjects
that are in less population dense areas.
[0052] In some embodiments, to ensure that mapping (as described in
greater detail
herein) accurately reflects the received data, it may be necessary to
implement one or more
mapping classification techniques to establish one or more thresholds at step
430. Such a
mapping classification technique may generally be used to compare current data
with
historical data to determine severity of the common infectious illness, as
described in greater
detail herein. In addition, such a mapping classification technique may be
completed for each
established area (e.g., each area containing a particular ZIP code, a grouping
of ZIP codes, a
quantile, or the like). One example of a mapping classification technique may
be a Jenks
natural break classification technique. The Jenks natural breaks
classification technique,
which may also be referred to as the Jenks optimization method, is a data
clustering method
designed to determine the best arrangement of values into different classes.
This may be
completed by seeking to minimize each class's average deviation from a class
mean, while
maximizing each class's deviation from the means of the other groups. That is,
the technique
seeks to reduce the variance within classes and maximize the variance between
classes. The
Jenks natural breaks classification technique is only one illustrative
technique. Other
classification techniques should generally be understood and are included
within the scope of
14
CA 03027424 2018-12-11
WO 2018/013913 PCT/US2017/042121
the present disclosure. As a result of applying the classification technique,
the data may be
grouped based on the one or more established thresholds at step 440.
[0053] Referring again to FIG. 3, the various determinations as described
above with
respect to steps 310 and 315 may be completed for each common infectious
illness that is
obtained from the received data. As such, a determination may be made at step
320 as to
whether additional common infectious illnesses are present in the data. If so,
the process may
return to step 310 and may repeat steps 310-320 as many times as needed to
ensure all
common infectious illnesses are accounted for. Once all of the common
infectious illnesses
have been determined and a location/frequency have been determined, the
process may
proceed to step 325.
[0054] At step 325, additional information may be received, such as
supplemental
information that may be useful in predicting an outbreak. Such additional
information is not
limited by this disclosure. A nonlimiting example of additional information
may include
information obtained from public health sources. The additional information
may allow for a
more accurate plotting of the information on a map, as described herein.
[0055] Once all of the information has been determined, the illness
information may be
plotted on a map at step 330. The plots may be based on the various
determinations
described herein with respect to steps 310 and 315, as well as steps 410-440
(FIG. 4).
Plotting the information on a map may allow a user viewing the map to
determine locations
where the illness is occurring, as well as an intensity of the illness (e.g.,
a particular area that
contains 10 cases of the same illness has a higher intensity than a particular
area that contains
1 case of an illness).
[0056] At step 335, an analysis input may be received. Such an analysis
input may
generally include a predictive analysis of a common infectious illness
outbreak based on the
data that was received, the information that was obtained therefrom, and the
information
plotted on the map. The analysis may be a result of a computer process that is
specifically
configured to provide a prediction of an outbreak of a common infectious
illness, or may be
an input that is received from an individual, such as an epidemiology expert,
a medical
professional, and/or the like. In embodiments where a computer process is
used, any
predictive analytics algorithm may be implemented. It should generally be
understood that
predictive analytics is an area of statistics that deals with extracting
information from data
and using it to predict trends and behavior patterns. The core of predictive
analytics relies on
capturing relationships between explanatory variables and the predicted
variables from past
11
CA 03027424 2018-12-11
WO 2018/013913 PCT/US2017/042121
occurrences, and exploiting them to predict the unknown outcome. As such, the
type of
predictive analytics algorithm that is used is not limited by this disclosure.
[0057] In some embodiments, as described herein, an accurate prediction,
forecasting,
and reporting of common infectious illness outbreaks may be based on historic
data such that
trends can be determined and analyzed. As such, the systems and methods
described herein
may be particularly configured to periodically obtain data over a period of
time. For
example, data may be obtained on a daily basis, a weekly basis, a monthly
basis, or the like.
As such, a determination is made at step 340 as to whether additional data is
needed to
accurately generate a forecast of a common infectious illness outbreak. If
additional data is
needed (e.g., because the data was last collected before a period of time has
elapsed), the
process may return to step 305 such that additional data is received.
[0058] If sufficient data has been collected to generate a forecast, the
forecast may be
generated at step 345. Generating the forecast may include comparing the
forecast to a
moving average. For example, forecasts may be seasonal forecasts, weekly
forecasts, and/or
the like. A seasonal forecast may be completed, for example, by generating an
8 week
moving average for a particular area, and then comparing the moving average to
the current
week. If the current week is greater than the 8 week moving average, it may be
indicative of
an increasing severity period. For shorter term forecasts (e.g., a 1 week
forecast), severity
increases of a particular percentage may be evaluated and compared to a past
time period,
such as, for example, the previous week, the same time period in the previous
year, and/or the
like.
[0059] The generated forecast may be published (i.e., reported) at step
350. As such, a
user viewing the generated and published/reported forecast should be able to
see what type of
common infectious illness outbreak is occurring in a particular area, is
predicted to occur, the
intensity of the outbreak, whether the outbreak is moving in or out of an
area, and/or the like.
The information may be provided to the users via any user interface, such as
the user
interface described herein. As such, a user may access a website, a mobile
app, or the like to
obtain information regarding the prediction and/or the forecast.
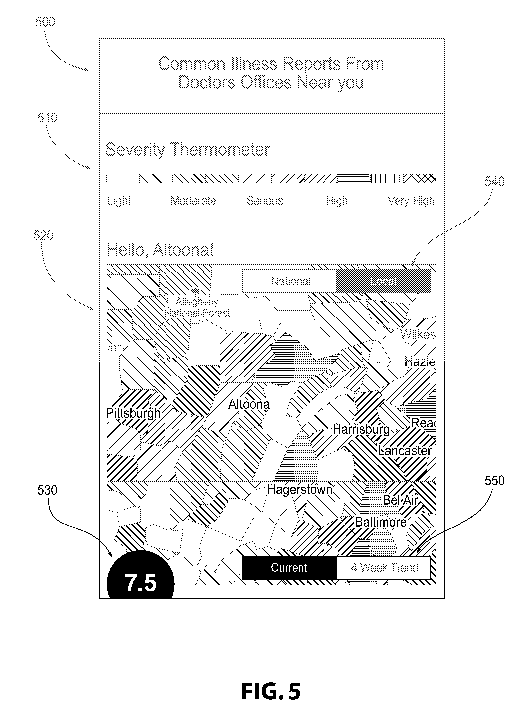
[0060] For example, as shown in FIG. 5, an illustrative map user
interface 500 may
include a map 520 that is shaded, colored, or the like to correspond to a
severity of a
particular common infectious illness, as indicated by a severity thermometer
legend 510. The
map user interface 500 may allow a user to zoom in/out on the map to show
national or local
details at selection box 540, pan the map to move to a different area, select
current severity or
previous trend at selection box 550. While selection box 550 depicts current
and 4 week
16
CA 03027424 2018-12-11
WO 2018/013913 PCT/US2017/042121
trends, this is merely illustrative. Other time periods for trends may be used
without
departing from the scope of the present disclosure, such as, for example, a 1
week trend, a 2
week trend, a 3 week trend, a 5 week trend, a 6 week trend, a 7 week trend, an
8 week trend,
or the like. In addition, if a user selects a particular area on the map 520,
it may provide a
severity level 530 of the selected area. The severity level 530 may be a
numerical indicator
that provides the user with the frequency of cases. For example, the severity
level may rank
the frequency of cases on a scale of 1 to 10, where 10 is the most severe
frequency (i.e., the
most amount of cases).
[0061] Other information that may be provided to a user may include a
description user
interface 600, as shown in FIG. 6. Such a description user interface 600 may
provide general
information about a particular common infectious illness, including how common
it is
relative to other illnesses, other common infectious illnesses, and/or the
like, various quick
facts about the illness, various symptoms of the illness, and/or the like.
[0062] In addition, a user may also be provided with a historical trends
user interface 700
.. as shown in FIG. 7. The historical trends may show information such as, for
example, how
severe a particular common infectious illness was over the course of past
weeks. Such
information may potentially be useful to a user in determining whether an
illness is on the
rise (i.e., becoming more severe), when an illness is decreasing (i.e.,
becoming less severe),
when an illness severity is remaining flat, and/or the like. Severity may
generally be based
.. on historical trends, such as, for example, based on a previous period of
time (e.g., a previous
week, previous two weeks, previous season), a comparison to the same time
period in a
previous year, and/or the like. While the historical trends user interface 700
depicted in FIG.
7 is a bar chart, this is merely illustrative. Other charts that may convey
the same or similar
information to a user may also be used without departing from the scope of the
present
disclosure. In addition, the historical trends user interface 700 may allow a
user to specify a
particular area for which to observe a change in trend. For example, the user
may select a
region having a radius of about 7.5 miles, a radius of about 15 miles, or the
like. In some
embodiments, the user may select particular regions, particular groups of
regions, particular
countries, and/or the like.
[0063] As mentioned above, historical trends may also be presented in other
manners.
For example, a forecast trends user interface 800 may display a current
forecast for various
common infectious illnesses, the current severity level of the illness for a
given area (as
indicated by the numbers in FIG. 8), whether the illness severity is on the
rise or decreasing
(as indicated by the upwards and downwards pointing arrows), and/or the like.
While the
17
CA 03027424 2018-12-11
WO 2018/013913 PCT/US2017/042121
common cold, ear infections, Lyme disease, pneumonia, influenza, and
methicillin resistant
staphylococcus aureus (MRSA) infections are shown in FIG. 8, these are merely
illustrative.
As such, other common infectious diseases may also be displayed without
departing from the
scope of the present disclosure. In some embodiments, the forecast trends user
interface 800
may be user adjustable such that a user can specify which common infectious
illnesses he/she
wishes to view.
[0064] The bottom of FIG. 8 and FIG. 9 depict an age group trend user
interface 900 that
can be used by a user to determine various trends for particular age groups.
While infants (0-
1 years old), toddlers (2-4 years old), school age children (5-12 years old),
teens (13-17 years
old), college age adults (18-22 years old), adults (23-54 years old), and
older adults (55+
years old) are depicted, these are merely illustrative. Other age ranges or
categorizations
based on age may also be used without departing from the scope of the present
disclosure.
[0065] It should be understood that the various user interfaces depicted
in FIGS. 5-9 are
merely illustrative, and other user interfaces that depict data in a different
manner are also
included within the scope of the present disclosure.
[0066] It should now be understood that the embodiments described herein
are generally
directed to systems and methods that obtain data from various health related
sources,
determine common infectious illness information from the data, determine a
location and/or a
frequency of the common infectious illnesses, plot the common infectious
illness information
on a map, and predict an outbreak of the common infectious illness based on
the plots on the
map. The data may be collected over a period of time such that movement in the
plots can be
observed (e.g., certain areas are seeing an increase in a particular illness
over a period of
time). As a result, users viewing the collected data as plotted in a chart, a
map, or the like,
can determine a potential for contracting a common infectious illness and take
necessary
steps to prevent contraction of the illness.
[0067] It is noted that the terms "substantially" and "about" may be
utilized herein to
represent the inherent degree of uncertainty that may be attributed to any
quantitative
comparison, value, measurement, or other representation. These terms arc also
utilized
herein to represent the degree by which a quantitative representation may vary
from a stated
reference without resulting in a change in the basic function of the subject
matter at issue.
While particular embodiments have been illustrated and described herein, it
should be
understood that various other changes and modifications may be made without
departing
from the spirit and scope of the claimed subject matter. Moreover, although
various aspects
of the claimed subject matter have been described herein, such aspects need
not be utilized in
18
CA 03027424 2018-12-11
WO 2018/013913 PCT/US2017/042121
combination. It is therefore intended that the appended claims cover all such
changes and
modifications that are within the scope of the claimed subject matter.
19