Note: Descriptions are shown in the official language in which they were submitted.
CA 03045768 2019-05-31
WO 2018/104894
PCT/IB2017/057711
- 1 -
STIMULUS AND EYE TRACKING SYSTEM
FIELD OF THE INVENTION
The invention generally relates to a system and method for stimulus & eye
tracking,
useful particularly but not exclusively for the determination of the presence
or
strength of optokinetic nystagnnus.
BACKGROUND
Accurate evaluation of visual function in young children in particular is
challenging.
There are few methods available for the direct assessment of perceptual
aspects of
vision such as visual acuity, motion perception, and stereopsis and/or which
are
particularly suitable for use by health care providers who do not have
extensive
training in paediatric ophthalmology, optometry and/or visual
electrophysiology.
Optokinetic nystagnnus (OKN) is the phenomena of involuntary eye movement
triggered by a continuously moving pattern or stimulus, and can be used to
evaluate
visual function. OKN is the repetition of an eye moving to smoothly pursue a
feature in
a visual stimulus followed by a resetting event (saccade) where the eye fixes
on a new
feature of the stimulus. Figure 1(b) shows a graph of eye displacement over
time
showing a saw tooth OKN profile that is characteristic of OKN eye movement.
The
presence or absence of OKN is an objective indication of visual performance
and can
also be useful for assessing neurological disorders. Early detection of a
vision problem
in a person's life is also known to significantly improve the outcome of
proceeding
treatment. The strength of OKN may also be assessed as a useful indicator of
visual
dysfunction i.e. OKN is present but weak.
In the use of video-oculography techniques for eye tracking and determination
of
OKN, a visual stimulus is displayed to the subject, and video of the subject's
eye(s) is
image processed to detect for OKN. International patent application
publication
W02014/168492 discloses a method of extracting eye velocity information from
video
using an optical flow algorithm. The displayed visual stimulus to elicit OKN
may consist
of high contrast drifting patterns having modifiable properties including
contrast,
frequency or coherence. Manipulating these parameters allows measurement of
the
threshold at which OKN is no longer present, or drops below a predetermined
threshold for OKN strength. This threshold is a measure of visual performance.
Random dot kinennatogranns consisting of mixtures of solid randomly and
coherently
CA 03045768 2019-05-31
WO 2018/104894
PCT/IB2017/057711
- 2 -
moving dots have been used for global motion perception assessment based on
OKN
responses.
SUMMARY OF THE INVENTION
In one broad aspect the invention consists in a method for stimulus and eye
tracking,
useful for the determination of the presence or strength of optokinetic
nystagnnus
(OKN), which comprises:
= providing a visual stimulus effective to elicit OKN in front of the
eye(s) of a
subject by:
o displaying on a display and varying the visibility (as perceived by the
subject) of at least one visual stimulus element, or
o displaying a series of at least one visual stimulus element so that a later
displayed element has different visibility (as perceived by the subject)
relative to an earlier displayed element,
= recording video of the subjects eye(s) viewing the stimulus, and
= image processing the video to detect for OKN.
In one broad aspect the invention consists in an eye tracking system which
comprises:
= a display arranged to display and vary the visibility (as perceived by
the
subject) of at least one visual stimulus element or a series of at least one
visual stimulus elements so that a later displayed element has different
visibility (as perceived by the subject) relative to an earlier displayed
element,
= a camera arranged to record video of the subjects eye(s) viewing the
stimulus,
and
= an image processing system arranged to image process the video to detect the
presence or strength of OKN.
In at least some embodiments varying the visibility of the visual stimulus
element(s)
comprises causing the visual stimulus element(s) to vanish (as perceived by
the
subject).
In at least some embodiments at least one visual stimulus element
progressively
vanishes (as perceived by the subject) on the display, or a later displayed
element
progressively vanishes (as perceived by the subject) relative to an earlier
displayed
element. In other embodiments varying the visibility of the visual stimulus
element(s)
comprises causing the visual stimulus element(s) to increase in visibility or
appear (as
perceived by the subject). In at least some embodiments at least one visual
stimulus
CA 03045768 2019-05-31
WO 2018/104894
PCT/IB2017/057711
- 3 -
element progressively appears (as perceived by the subject) on the display, or
a later
displayed element progressively appears (as perceived by the subject) relative
to an
earlier displayed element.
For example varying the visibility of the visual stimulus element(s) or
causing the
visual stimulus element(s) to vanish may comprise reducing or increasing
intensity
(optionally including luminescent intensity), contrast (optionally including
luminance
contrast, chromatic contrast, motion contrast or orientation contrast), size
and/or
width (spatial frequency) of the visual stimulus element(s) or visual stimulus
element
boundaries.
In at least some embodiments a spatial content, speed, temporal frequency
(flicker),
chromatic properties (colour), disparity (3D depth), and rotation or
rotational speed of
the stimulus (if not rotationally symmetric) of the visual stimulus are
varied.
In at least some embodiments the visual stimulus element or elements comprise
a
perimeter that is darker than a background and a centre that is lighter than
the
background, and/or a perimeter that is lighter than a background and a centre
that is
darker than the background. In at least some embodiments the visual stimulus
element or elements comprise:
= a perimeter having a perimeter boundary that is darker than a background
and
a centre having a centre boundary that is lighter than the background, and/or
= a perimeter having a perimeter boundary that is lighter than a background
and
a centre having a centre boundary that is darker than the background.
In these embodiments, when the boundary lines cannot be resolved they merge
together and become indistinguishable from the background. The visual stimulus
element is perceived by the subject to vanish or disappear. Alternatively the
boundary
lines emerge and become distinguishable from the background. The visual
stimulus
element is perceived by the subject to appear.
In at least some embodiments the visual stimulus elements comprise circle(s)
and/or
ellipse(s).
In at least some embodiments the visual stimulus element(s) may move across
the
display and progressively vanish as they move across the display. In other
CA 03045768 2019-05-31
WO 2018/104894
PCT/IB2017/057711
- 4 -
embodiments the visual stimulus element(s) may move across the display and
progressively appear as they move across the display.
In embodiments in which providing the visual stimulus comprises displaying a
series of
at least one visual stimulus element so that a later displayed element
progressively
vanishes (as perceived by the subject) relative to an earlier displayed
element, again
the visual stimulus element(s) may move across the display and also may
progressively vanish as they move across the display. in embodiments in which
providing the visual stimulus comprises displaying a series of at least one
visual
stimulus element so that a later displayed element progressively appears (as
perceived by the subject) relative to an earlier displayed element, again the
visual
stimulus element(s) may move across the display and also may progressively
appear
as they move across the display.
In at least some embodiments the visual stimulus element(s) comprise(s) a
series of
multiple visual stimulus elements.
In at least some embodiments the visual stimulus element(s) comprise(s) upper
and
lower visual stimulus elements.
In at least some embodiments multiple visual stimulus element(s) move across
the
display at the same or different speeds.
In at least some embodiments visual stimulus elements move across the display
in
different directions.
In at least some embodiments visual characteristics of one or more visual
stimulus
elements alters while visual characteristics of one or more other visual
stimulus
elements does not.
As used herein the term "and/or" means "and" or "or", or both.
As used herein "(s)" following a noun means the plural and/or singular forms
of the
noun.
The term "comprising" as used in this specification means "consisting at least
in part
of". When interpreting statements in this specification which include that
term, the
CA 03045768 2019-05-31
WO 2018/104894
PCT/IB2017/057711
- 5 -
features, prefaced by that term in each statement or claim, all need to be
present but
other features can also be present. Related terms such as "comprise" and
"comprised" are to be interpreted in the same manner.
BRIEF DESCRIPTION OF THE DRAWINGS
The invention will now be described by way of example only and with reference
to the
drawings in which:
Figure 1 shows a picture of an eye; Figure 1(a) illustrates the region of an
eye
typically monitored for change in displacement; Figure 1(b) shows a graph of
eye
displacement over time exhibiting a saw tooth profile characteristic of
healthy eye
movement. Figure 1(c) shows a graph of eye velocity derived from the eye
displacement signal.
Figure 2 shows an example where consecutive image frames are transformed into
an
estimate of pixel velocity; Figure 2(a) is an example image of an eye received
from a
camera; Figure 2(b) shows an example of pixel velocity vectors provided by an
optical
flow algorithm; Figure 2(c) is an example of a graph of the regional velocity
average
of the optical flow velocity vectors.
Figure 3(a) shows a single circle or ellipse stimulus of an embodiment of the
invention
and Figure 3(b) shows an embodiment of a visual stimulus which comprises
multiple
circles and/or ellipses moving across the display in series from left to right
or vice
versa and in upper and lower rows.
Figure 4 illustrates an embodiment of a vanishing circle or ellipse stimulus
shown as
an intensity profile; shown on the right is the appearance of the vanishing
optotype as
it appears in a localized part of the screen.
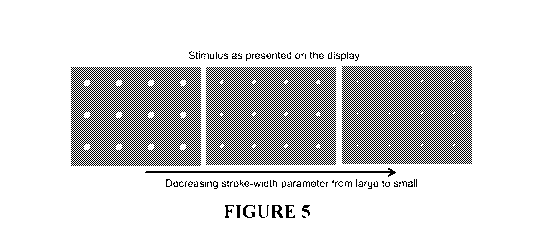
Figure 5 shows an embodiment of a visual stimulus which comprises multiple
disk
visual stimulus elements moving across a display in series from left to right
in three
rows, at three stroke-width stimulus levels, with the stroke-width decreasing
from
high to low.
Figure 6 shows the expected perception of the observer possessing refractive
error, of
the stimulus of Figure 5.
CA 03045768 2019-05-31
WO 2018/104894
PCT/IB2017/057711
- 6 -
Figure 7 shows an overview of the components of a system including a camera,
screen
and a computational device.
Figure 8 is a flow chart of steps in video processing for OKN detection or
assessment
in one form.
Figure 9 is a flow chart of steps in video processing for OKN detection or
assessment
in another form.
Figures 10(a) and 10(b) are Bland-Altman plots referred to in the subsequent
description of experimental work.
Figure 11 is referred to in the subsequent description of experimental work
and
shows a correlation obtained between the visual acuity measured using a gold-
standard ETDRS chart versus the visual acuity determined by OKN for trial
participants
not wearing their usual optical correction (henceforth referred to as being
uncorrected). A rescaling of the OKN data has been applied.
Figure 12 is referred to in the subsequent description of experimental work
and
shows a correlation with visual acuity as determined by OKN (vertical axis)
and the
ETDRS chart (horizontal axis) for blurring of two trial participants. No
rescaling of the
OKN has been applied in this case.
Figure 13 is referred to in the subsequent description of experimental work
and
shows a correlation with visual acuity as determined by OKN (vertical axis)
and the
ETDRS chart (horizontal axis) for blurring of two participants, using a larger
alpha
parameter. No rescaling of the OKN has been applied in this case.
DETAILED DESCRIPTION
Stimulus and eye tracking
As stated in the method of the invention the visibility of the visual stimulus
is varied to
enable an evaluation of visual function or make other assessment(s) as
referred to
subsequently, via OKN. Visibility of the stimuli can be varied by for example
the
visibility of the stimuli gradually decreasing across a number of trials until
the OKN
ceases or falls below an OKN strength criterion (descending method of limits).
The
visibility of the stimuli can be gradually increased from a non-visible level
(i.e. the
CA 03045768 2019-05-31
WO 2018/104894
PCT/IB2017/057711
- 7 -
stimuli are in the 'vanished' state for the observer) to the point at which
OKN begins
or increases in strength above a strength criterion (increasing method of
limits). The
visibility of the stimuli can be varied following an adaptive staircase
algorithm that
varies the visibility of the stinnului over a series of trials according to
the patient's OKN
responses and provides an estimated threshold level of stimulus visibility
(staircase
method). The stimuli can be presented multiple times at a range of
visibilities in a
predetermined, pseudo-randomized or randomized order. An appropriate function
can
then be fit to the resulting data that enables the calculation of a threshold
visibility
(method of constant stimuli). The tester may adjust the stimulus visibility
directly
using, for example, a dial or touch pad, until the observer's OKN stops or
falls below a
strength criterion (tester-controlled method of adjustment).
Visual stimulus element(s) may move on the display and their visibility vary
as they
move, or may be stationary on the display as they vanish. In at least some
embodiments the visual stimulus elements comprise circle(s) and/or ellipse(s).
Moving
visual stimulus elements may move across the display from left to right, from
top to
bottom, or diagonally across the display. Moving visual stimulus elements may
move
at the same or different speeds.
A single stationary or moving visual stimulus element or a series of multiple
visual
stimulus elements may be displayed and vary in visibility. The visual stimulus
element(s) may be displayed as a single row or column of static or moving
visual
stimulus element(s) or upper and lower rows or more rows, or two or more
adjacent
columns, of visual stimulus elements, for example.
The visual stimulus element(s) may vary in visibility or vanish by reducing in
intensity
(optionally including luminescent intensity), contrast (optionally including
luminance
contrast, chromatic contrast, motion contrast or orientation contrast), size
and/or
width (spatial frequency) of the stimulus element boundaries. In at least some
embodiments visual characteristics of one or more visual stimulus elements
alters
while visual characteristics of one or more other visual stimulus elements
does not.
Figure 3(a) shows a single circle or ellipse stimulus of an embodiment of the
invention
and Figure 3(b) shows an embodiment of a visual stimulus which comprises
multiple
circles and/or ellipses (visual stimulus elements) moving across the display
in series
from left to right or vice versa and in upper and lower rows. All stimulus
elements in
upper and lower (or all if more than two rows) may move across the display in
the
CA 03045768 2019-05-31
WO 2018/104894
PCT/IB2017/057711
- 8 -
same direction for example from left to right, at the same or different
speeds.
Alternatively stimulus elements may move in different directions, and for
example
stimulus elements in an upper row may move across the display in one direction
while
stimulus elements in another row such as a lower row may move across the
display in
an opposite direction, at the same or different speeds. Stimulus elements may
move
from top to bottom of a display or vice versa. Stimulus elements may move
diagonally
across a display.
In a preferred form a vanishing optotype stimulus (visual stimulus element)
comprises
a perimeter that is darker than a background and a centre that is lighter than
the
background, and/or a perimeter that is lighter than a background and a centre
that is
darker than the background. In at least some embodiments the perimeter has an
outer diameter or transverse dimension OD = aSW and thickness SW(1-a)/2
wherein
SW is a diameter or transverse dimension of the centre and a is in the range 1-
5 or
more preferably 1 to 3.
A single vanishing disk stimulus element is shown by itself in Figure 4(a),
and as part
of an array in Figure 3(b) where it has been over-layed on a background.
Figure 3 on
the right hand side shows a vanishing stimulus element ¨ as it vanishes
reduces from
3.0 to 0. Figure 4 on the right hand side shows the vanishing stimulus element
with a
initially = 3.0, and then also at a = 2.0 and at a = 1.4.
The diameter or transverse dimension (the stimulus element may not be
circular) SW
may be regarded as the stroke-width of the stimulus element, specified in
logMAR.
This centre is surrounded by a perimeter or annulus which may be of constant
thickness SW(1-a)/2, the stated formulae resulting from considering the
central disk
(width diameter SW) as overlaying the surrounding outer disk with diameter OD
=
aSW. The stimulus shown to the observer may be an array of such vanishing
disks
that cover the screen. The horizontal and/or vertical centre-to-centre spacing
DS may
be for example in the range 1 to 10 or more preferably 2 to 6 x the diameter
or
transverse dimension SW of the stimulus element, and the entire array drifts
across
the screen either leftwards or rightwards at a constant angular velocity for
the entirety
of the duration of a presentation.
In the examples shown in Figure 4 the initial or starting intensity SI of the
centre is
lower than that PI of the perimeter. The background intensity BI is between
that of
the perimeter and centre. For example BI may initially be about half of PI.
Another
CA 03045768 2019-05-31
WO 2018/104894
PCT/IB2017/057711
- 9 -
possible intensity profile is shown in Figure 4. As stated, in the three
specific examples
on the right hand side of Figure 4 a = 1.4, a = 2.0 and a = 3Ø In each case
SI = 1.0,
PI =0.45, and BI = 0.5. Where the perimeter is darker than the centre then for
example PI may be between 0 to 0.5 of maximum intensity, SI between 0.5 to 1.0
of
maximum intensity, and BI between 0.4 to 0.6 and typically about 0.5 of
maximum
intensity. Example ratios are SI/PI/BI of 0.9/0.45/0.5 and 0.75/0.45/0.5.
Alternatively instead of reducing or increasing in intensity or luminescent
intensity, the
contrasting perimeter may reduce in size and/or vanish or increase in size and
appear
(as perceived by the subject), as the circle(s) and/or ellipse(s) move across
the
display. The centre may remain substantially constant. Figure 4A shows a
single circle
or ellipse stimulus of an embodiment of the invention and Figure 4B shows an
embodiment of a visual stimulus which comprises multiple circles and/or
ellipses
(visual stimulus elements) moving across the display in series from left to
right or vice
versa and in upper and lower rows. In one option some stimulus elements, such
as
stimulus elements in one row, may be caused to vanish or appear as they move
while
other stimulus elements, such as stimulus elements in another row, do not.
This may
enable assessment of a direction that OKN goes in, which may allow for the
assessment of discrimination between visible stimuli ¨ known as the just
noticeable
difference.
Figure 5 shows an embodiment of a visual stimulus which comprises multiple
disk
visual stimulus elements moving across a display in series from left to right
in three
rows, at three stroke-width stimulus levels, with the stroke-width decreasing
from
high to low (going from left to right). The aim of visual acuity testing is to
determine
the stroke-width value at which the observer cannot detect the presence of the
presented field.
Figure 6 shows the expected perception of the observer possessing refractive
error.
In this case the perception of the stimuli presented in Figure 5 is now
degraded in all
cases. The perception by the observer is that the disks are visible but
progressively
more difficult to detect as the stroke-width parameter is reduced. In this
example, it is
seen that the field of disks has vanished completely at the smallest stroke-
width
parameter setting (the right-most panel of Figure 5). The threshold of
detectability
has been passed, and the subject's OKN response has disappeared (as indicated
by
"OKN absent" on the right-most panel of Figure 6). In both figures it is noted
that the
field of disks would be moving in a fashion (for example, drifting
continuously either
CA 03045768 2019-05-31
WO 2018/104894
PCT/IB2017/057711
- 10 -
leftward or rightward) designed to induce a robust OKN response in the
presence of a
detectable stimulus pattern.
In addition, a spatial content, speed, temporal frequency (flicker), chromatic
properties (colour), disparity (3D depth), and rotation or rotational speed of
the
stimulus (if not rotationally symmetric) of the visual stimulus may be varied
as the
circle(s) and/or ellipse(s) move across the display.
The visual stimulus to elicit OKN may be displayed on a VDU of any suitable
size and
resolution for example an LED or LCD display. The display may be placed at a
distance of approximately about 0.5 to 6m from the subject's eyes for example.
Video
footage is collected using a digital camera (RBG or infrared), preferably
located
proximate the display to present a clear line of sight to view the eyes.
To improve the attention of young test subjects, the visual stimulus video may
be
interspersed with a video segment that appeals to children, such as a cartoon.
A
cartoon or other kind of animated video is displayed for a period of time
adequate to
gain the attention of a young subject before the visual stimulus video is
displayed for
a period of time adequate to acquire OKN data. The cartoon can be displayed
when
attention wanes or alternatively when the OKN video has finished. The cartoon
may be
switched to and from the display automatically by a control device or manually
by an
operator.
Video image processing is used to detect whether or not the stimulus has
elicited OKN,
or the strength of OKN, in a subject's eye. The stimulus parameters at the
threshold
where OKN is no longer detected or OKN falls below a particular strength
provides an
indication of visual performance. A clinician may review the information
determined
from the eye movement. Alternatively, a statistical analysis process may be
applied to
the extracted information to determine the presence or absence of OKN.
The video processing to detect OKN may be of recorded video footage or in real
time.
Some embodiments further comprise a visual stimulus arranged in front of the
eye,
the stimulus operable to elicit optokinetic nystagnnus.
CA 03045768 2019-05-31
WO 2018/104894
PCT/IB2017/057711
- 11 -
Some embodiments further comprise comparing the average velocity information
to
known optokinetic nystagnnus velocity information to make a determination of
the
health of an eye in response to the stimulus.
The system may be implemented as a dedicated instrument, in portable or
handheld
device having both a camera and a computational power, such as a smart phone,
tablet or laptop device, for example. Figure 5 shows an overview of the
components of
the system including the camera 60 for recording the eye footage, a screen 70
for
displaying the stimulus and a computational device 80.
Image processing and OKN detection
Video processing for OKN detection or assessment may comprise extracting eye
velocity and/or displacement information from video, using for example an
optical flow
algorithm or a point tracking algorithm. The video footage is used to make an
estimate of the velocity and/or displacement, of an eye as a subject watches
the
visual stimulus, such as determining a velocity and/or displacement estimate
of pixels
inside the coarse determination of a linnbal region and/or pupil region of an
eye by
application of an image processing algorithm known as optical flow and/or
point
tracking. In preferred embodiments, a Lucas-Kanade optical flow algorithm
and/or a
Kanade-Lucas-Tonnasi (KLT) or other point tracking algorithm may be used. The
velocity and/or displacement estimate provided by the optical flow and/or
point
tracking algorithm is an average of the pixel velocities and/or displacement
in the
coarsely determined linnbal and/or pupil region. Heuristic analysis and/or
template
matching algorithm may be applied to the displacement and/or velocity estimate
to
determine the presence and direction of OKN. The velocity and/or displacement
estimate information may also be manually compared to healthy eye velocity
and/or
displacement information, and in particular the velocity threshold at which
OKN is no
longer present, or drops below a predetermined threshold for OKN strength, to
make a
comparative judgement of the function of the eye and/or the visual pathway.
The
velocity and/or displacement estimation may also be used to track the
direction of a
person's gaze. The direction of the gaze may be used to judge behavioural
characteristics of a person including information such as what visual stimulus
gains
their attention. In some embodiments the optical flow and/or KLT algorithm is
applied
to determine pixel velocity and/or displacement information between
consecutive
frames of a length of video footage corresponding to several reset events.
CA 03045768 2019-05-31
WO 2018/104894
PCT/IB2017/057711
- 12 -
The method of determining OKN according to various embodiments is conducted
according to the following steps. A video sequence containing footage of the
eye is
recorded while the eye watches a stimulus. In some embodiments, the video
footage
is reduced to grey scale to reduce computation complexity. An optical flow
and/or
point tracking image processing algorithm is applied to the video footage to
determine
pixel velocity and/or displacement information from sequential frames. The
velocity
and/or displacement information is determined from a limited region of the eye
and
that region is the linnbus and/or pupil and/or linnbal edge portion of the
eye. The
region is a coarse estimate of the linnbal and/or pupil region of the eye
determined by
an edge detection and/or thresholding algorithm. The image processing
algorithm
outputs optical flow and/or point tracking information represented by pixel
velocity
and/or displacement information in determined the linnbus and/or pupil region
of the
eye over two consecutive frames in the video footage. The pixel velocity
and/or
displacement information, including the speed, displacement and direction, can
be
directly assessed to determine the presence and direction of OKN.
One example of the steps of the process is shown in Figure 8 where the
transformation of two consecutive image frames into an estimate of pixel
velocity is
shown. In a first step 10, consecutive video frames I(t) and I(t + 1) are
taken from
high definition colour video footage and reduced to gray scale. In a second
step 20, a
coarse determination of the linnbal region of the eye is determined by an edge
detection process applied to the video footage to determine an edge map. The
edge
map represents a determination of the location of the linnbus portion of the
eye and
therefore the area of the video footage from which optical flow information is
to be
determined. The edge map does not need to be precisely determined for the
optical
flow information to be useful. The process is robust to variation in the
linnbal edge
maps obtained throughout frames in the video footage. The edge detection is
ideally
performed by application of a Prewitt operator with hysteresis thresholding.
However,
those skilled in the art will recognise other edge detection strategies or
operators
could be used to determine the linnbal region. Connected regions under a
certain
weight and regions connected to the image border are removed. In a third step
30,
which may be processed concurrently or before the second step 20, an optical
flow
estimation process determines pixel velocity information from spatial and
temporal
changes in pixel intensity. As shown in Figure 1(c), a linnbal region should
exhibit a
velocity spike during a rapid resetting event of an eye (saccade) and smooth
or
constant velocity changes during other periods when a stimulus is being
observed.
CA 03045768 2019-05-31
WO 2018/104894
PCT/IB2017/057711
- 13 -
Figure 2 shows the optical flow process in greater detail. Figure 2(a) shows
an image
or single frame of a piece of video footage showing an eye. Figure 2(b) shows
a
number of vectors indicating the magnitude and direction of pixel travel
between
consecutive frames. Figure 2(c) is a graph of the average velocity of the
pixel vectors
of Figure 2(b) for a number of consecutive frames.
In the fourth step 40 of Figure 8, the linnbal region information provided by
the edge
detection process 20 is combined with the pixel velocity information provided
by the
optical flow process 30 to produce a masked velocity field. The masked
velocity field
represents velocity information only within the detected linnbal region. In a
fifth step
50, the velocity information from the masked velocity field is averaged to
produce a
velocity value for a given pair of consecutive frames in the video footage.
The process
of figure 6 is performed on as many consecutive frames in the video footage as
desired such that a graph of velocity is provided as a function of time. The
graph can
then be analysed to determine OKN information.
Further information is given in international patent application publication
W02014/168492 the entire contents of which are incorporated herein by
reference.
Another example of the steps of the process is shown in Figure 9 where the
transformation of two consecutive image frames into an estimate of pixel
displacement and velocity is shown. In a first step 10, consecutive video
frames I(t)
and I(t + 1) are taken from high definition colour and or infrared video
footage and
reduced to gray scale. In a second step 20, a coarse determination of the
pupil region
and pupil centre of the eye is determined by a thresholding algorithm and
morphological operations applied to the video frame. The KLT algorithm
estimates the
new location of pupil centre in video frame I(t+1) based on changes in pixel
intensity.
By extracting pupil centre in two consecutive frames, displacement and
velocity signal
of pupil/eye can be determined.
These techniques are substantially robust against the error induced by head
movements seen in normal adult fixations, eye blinks, reflections and other
error
inducing factors. Further, these techniques may be combined with head
stabilisation
for use with young children or subjects who would not tolerate head mounted
equipment. These techniques are therefore video-oculography techniques readily
applicable to infants or young children who would otherwise be unable to be
assessed.
These techniques may be implemented with standard 'off the shelf video
equipment
CA 03045768 2019-05-31
WO 2018/104894
PCT/IB2017/057711
- 14 -
thereby avoiding the need for expensive supporting hardware. The velocity and
displacement information graphs resulting from the above described techniques
can be
analysed directly by a trained clinical professional and/or further processed
by an OKN
detection process that will now be described.
OKN strength can be determined by the following. Peaks not indicative of OKN
are
rejected, for example, by comparing them to a threshold and discarding those
peaks
below the threshold. An average of the heights of the surviving peaks is
determined
and scaled by an appropriate normalization value l'"v. A low value will result
if peaks
are weak or equally distributed between positive and negative. Conversely, if
peaks
are consistently positive or negative, the measure will scale with the average
height,
and the sign will correlate with the direction of the reset event.
A more detailed explanation of the process step for detection of OKN from the
obtained velocity information is given in international patent application
publication
W02014/168492.
Furthermore, a template matching algorithm is used to determine presence and
direction of OKN from displacement signal. Dynamic time warping (dtw)
algorithm is
used to find the sawtooth pattern in the displacement signal. Two sawtooth
templates
are applied to detect both left and right direction OKN.
Optionally head trajectory information is used to improve the eye velocity
and/ or
displacement information, by offsetting head trajectory information against
the eye
tracking information to substantially remove eye velocity and/ or displacement
information caused by head movement. For example, data relating to the
velocity and/
or displacement of head movement can be offset against data relating to eye
movement so error caused by non-zero head velocity and/ or displacement is
substantially reduced or removed from the eye velocity and/ or displacement
information.
As stated the system and method of the invention are useful for assessing the
presence or strength of optokinetic nystagnnus, the presence or absence of
which is an
objective indication of visual performance and can also be useful for
assessing
neurological disorders. The invention may be useful also for assessing any one
or
more of the presence or absence or quality of colour vision, depth perception
(stereopsis), motion perception, traumatic brain injury, dyslexia, concussion,
contrast
CA 03045768 2019-05-31
WO 2018/104894
PCT/IB2017/057711
- 15 -
sensitivity, ADHD, dizziness/balance, fatigue, cognitive function,
neurological disorder,
multiple sclerosis, child development disorder, anything that interferes with
the visual
pathways of the brain, mental health disorder, anxiety, depression, sensory
processing
disorder, or neurodegenerative disorder such as Parkinson's and/or Alzheimer's
Disease.
Experimental
We tested the ability of a vanishing disk based stimulus to estimate visual
acuity as
determined by an ETDRS visual acuity chart. We found a better test-retest
reliability
for the testing based on OKN versus than that of the visual acuity chart. We
found a
robust correlation (R2 = 0.9) between the ETDRS and OKN visual acuity data,
across a
cohort of adults with uncorrected refractive errors (in the right eye only).
The line of
best fit after recalibration yielded "fitted" minimum sensitivity of the test
(c) which
was -0.01 logMAR, whilst the agreement with the visual acuity (m) was 1.04
logMAR
by OKN method/ logMAR by VA chart. A second experiment was conducted in which
blurring was used to test the range from 0.0 to 0.5 logMAR. Two stimulus
parameter
settings were tested, giving good linear fitting results of R2 =0.76 and 0.86
respectively. The fitted line coefficients were (m = 0.62, c = 0.05) and (m =
0.50, c =
0.21). The thinner stimulus had the best fitted minimum sensitivity and
improved
agreement with the visual acuity chart overall, whilst the thicker stimulus
had the
worst sensitivity (c = 0.21) and the lowest agreement (m = 0.50) overall.
Overall we
found a linear relationship between visual acuity using OKN and ETDRS, and
furthermore we were able to manipulate the optokinetic response, by only
adjusting
the alpha parameter.
Experiment One: Visual acuity testing with refractive error
Method
Participants: Healthy participants (N = 18, Average age = 29 +6 years) were
recruited through the School of Optometry and Vision Science.
Baseline visual acuity by ETDRS VA chart: Because it was expected that the
eyes
performance for a particular individual would be correlated, only data for
right eyes
was included for analysis in this experiment. Participants were instructed to
stand
3 metres from the ETDRS-type VA chart (AT-20P Mednnont Acuity Tester, Mednnont
Pty Ltd, Australia) and to read letters starting from larger letters at higher
logMAR levels (maximum size logMAR 1.3) down to smaller letters at lower
logMAR
levels (minimum size logMAR -0.3) in 0.1 logMAR decrements (5 letters per
logMAR
CA 03045768 2019-05-31
WO 2018/104894
PCT/IB2017/057711
- 16 -
level). The scoring was done by recording firstly the smallest complete line
read,
followed by deducting an extra 0.02 logMAR for every letter read correctly
from the
smaller partially read lines. A smaller logMAR score corresponded to smaller
resolvable
detail and better VA. The duration of VA measurement by ETDRS chart
was approximately 15 minutes per participant per testing session.
Data collection and analysis of OKN data: Vanishing disk stimulus arrays (0 =
2,
SI = 0.75, PI = 0.45) were used for this experiment. Array patterns were shown
over
5 seconds trials during which they drifted in a randomly determined direction
(leftwards or rightwards, with a constant speed of 5 degrees/second). The
stroke
width (SW) parameter varied in 0.1 logMAR steps over the range of 1.0 to 0.0
logMAR
with stimulus having stroke-width set in accordance with the design of
standard
ETDRS visual acuity (VA) charts. A total of 11 levels (1.0 to 0.0 logMAR in
steps of 0.1
logMAR) were tested in descending order. Each logMAR level was presented five
times
to match the number of letters on each line of the ETDRS chart. Henceforth an
OKN
'line' refers to five trials of the same logMAR value. This allows for common
terminology between the ETDRS chart and the OKN measure. Each OKN stimulus
presentation was randomized to drift rightwards or leftwards. The total
experiment
therefore consisted of 55 trials each lasting 5 seconds. All participants were
tested
with the ETDRS Chart and OKN stimulus and then re-tested on a different day.
VA scoring by OKN: An experienced observer performed the following steps to
determine the best OKN by subjective observation. Starting from the videos
with the
largest disk stimulus (logMAR 1.0), the observer reviewed videos so as to find
the
lowest line where the participant obtained OKN in all five videos (for a
particular
logMAR). This defined the initial base line. For each video after the initial
baseline
videos (continuing in descending logMAR) the baseline logMAR was reduced by
0.02
logMAR if OKN was judged to have been observed in it. For practical purposes
this
continued until no OKN was observed in all five trials belonging to a line
(thereby
defining the "bottom line"). The final VA reported was the baseline with 0.02
subtracted for all videos showing OKN.
VA recalibration of OKN: The OKN visual acuity data was calibrated to assess
whether thresholds for a particular OKN logMAR could match the ETDRS chart
equivalent. A linear fit derived from the raw experimental data (VA by ETDRS
chart
versus VA by OKN) was used to rescale the visual acuity by OKN data. This
involved
CA 03045768 2019-05-31
WO 2018/104894
PCT/IB2017/057711
- 17 -
adding the difference between the fitted line and the required line (the line
of slope 1
passing through the origin) at a particular VA by chart value to the raw VA by
OKN.
Results
Figure 11 contains Bland-Altman plots for the ETDRS visual acuity chart and
the visual
acuity as determined by OKN, for the test session and the retest session
showing the
test and the retest results. The mean difference for the ETDRS chart was 0.059
and
the limits of agreement were 0.12 and 0.24 respectively (1.960 = 0.18). The
mean
difference of the OKN based chart was 0.056 and the limits of agreement were -
0.036
¨ 0.15 (1.960 = 0.09). The results indicated a better test-retest performance
for the
OKN based method than the chart. Figure 12 shows the correlation obtained
between
the visual acuity chart obtained by ETDRS chart versus the visual acuity
determined
by OKN for uncorrected participants (applied to right eyes, pooled over both
the test
and retest data). The results indicate good agreement between the two VA
measures
(a high R-squared coefficient of 0.90) and agreement with the line of best
correlation,
with an estimate slope of 1.04 and y-intercept c = -0.01.
Experiment Two: Added Blur Protocol
The range of uncorrected visual acuities found for the ETDRS chart in
experiment one
was 0.32 to 1.40 (median = 0.88, IQR = [0.61, 1.18]). However, we were
interested
in assessing performance for a lower range of logMARs 0.0 to 0.3 because of
its
clinical significance. Therefore we sought to repeat the protocols described
in
experiment one, for observers who were intentionally blurred to produce visual
acuities inclusive of this range. We tested also the effect of changing the
parameter,
so the experiments were repeated for a = 2 and a = 3.
Method
Participants: Healthy participants (N=2, Average age = 30) who were part of
the
research team participated. A baseline refractive correction was determined by
subjective refraction. Visual acuity deficit (blurring) in the right eye was
then
simulated in the two observers by adding plus powered trial lenses to the
baseline
correction, in +0.25D steps, whilst covering the eye not being tested. The
blurring
end-point was the highest dioptric power of plus lenses required to reduce
visual
acuity to logMAR 0.6. Visual acuity at each blurring step was measured by
ETDRS VA
chart (AT-20P Mednnont Acuity Tester, Mednnont Pty Ltd, Australia) as
described in
experiment one.
CA 03045768 2019-05-31
WO 2018/104894
PCT/IB2017/057711
- 18 -
The protocol described by experiment one was repeated here except in addition
to the
optotype (0 = 2, SI = 0.75, PI = 0.45) we also tested a second optotype (0 =
3, SI =
0.75, PI = 0.45). This has been denoted thin and thick in the graphs but would
be
renamed in the future. Furthermore, there was no recalibration as performed in
the
presentation of data from experiment one.
Results
The correlations for VA by OKN vs VA by chart for stimuli with a = 2 and a = 3
are
shown in Figures 12 and 13. Calibration was not applied as in experiment one,
so
comparison across the two could be made. Nevertheless, the raw (uncalibrated)
linear
fitting results were good (R2 =0.76 and 0.86 respectively). The slopes of the
fitted
lines were comparable (m = 0.62 for a = 2, versus m = 0.50 for a = 3) with the
difference equivalent to a 0.12 logMAR difference in VA by OKN across a change
of 1
logMAR in VA by chart. The main difference was that thicker stimulus results
were
shifted vertically along the vertical axis, with a minimum sensitivity of c =
0.21
logMAR (versus c= 0.05 logMAR for a = 2). As a result, it was observed that
the fitted
line, and therefore the data, was shifted so as to cross the line of best
correlation (i.e.,
the position where the best agreement with the VA chart occurs) at a higher VA
by
chart threshold. In Figure 11 this occurred at 0.12 logMAR, whilst in Figure
12 this
occurred at 0.41 logMAR. This observation suggests that the stinnulii have a
"best"
operating point, that can be modified by appropriate selection of the a
parameter.
Experiment 3: Adult Clinical Trial
Purpose: The purpose of this study was to assess the level of agreement
between the
Objective Acuity OKN system and stimulus compared with standard letter chart
measurements of monocular visual acuity in a group of adults. Measurements
were
made with no refractive correction and with full correction for refractive
error. These
measurements were made using an automated ETDRS Visual Acuity Chart and the
OKN Visual Acuity System.
Subjects: 93 participants were recruited with the clinical site being the
Southern
College of Optometry, Memphis, USA.
Stimuli: Moving stimuli were presented on a 27 inch DELL 52716DG LED monitor,
placed 3 meters away from the subject to elicit OKN. The stimuli was patterned
disk
shaped circles, consist of a bright inner circle and a darker outer ring.
Other controlled
CA 03045768 2019-05-31
WO 2018/104894
PCT/IB2017/057711
- 19 -
parameters include disk size, space, and moving speed. The table below
explains the
characteristics of each stimulus at each level:
= . . ::::,
,.=::.:,.. ,=,==:,i-=,=:=.'w,=Ã:..i.,-,wi7i,.:
Fixation 2
Disk Disk presentation 1 (from left) 0.75 0.45 0.5 1 5
Disk 2:1 Left 1
Fixation 2
Disk Disk presentation 2 (from right) 0.75 0.45 0.5 0.9
5 Disk 2:1 Right 1
Fixation 2
Disk Disk presentation 3 (from left) 0.75 0.45 0.5 0.8
5 Disk 2:1 Left 1
Fixation 2
Disk Disk presentation 4 (from right) 0.75 0.45 0.5 0.7
5 Disk 2:1 Right 1
Fixation 2
Disk Disk presentation 5 (from left) 0.75 0.45 0.5 0.6
5 Disk 2:1 Left 1
Fixation 2
Disk Disk presentation 6 (from right) 0.75 0.45 0.5 0.5
5 Disk 2:1 Right 1
Fixation 2
Disk Disk presentation 7 (from left) 0.75 0.45 0.5 0.4
5 Disk 2:1 Left 1
Fixation 2
Disk Disk presentation 8 (from right) 0.75 0.45 0.5 0.3
5 Disk 2:1 Right 1
Fixation 2
Disk Disk presentation 9 (from left) 0.75 0.45 0.5 0.2
5 Disk 2:1 Left 1
Fixation 2
Disk Disk presentation 10 (from right) 0.75 0.45 0.5
0.1 5 Disk 2:1 Right 1
Fixation 2
Disk Disk presentation 11 (from left) 0.75 0.45 0.5 0 5
Disk 2:1 left 1
Test Procedure: OKN Test: For the OKN part of the trial participants viewed 11
different levels of the stimulus from 3.0 m. Five trials of each stimulus
level were
used, with each stimulus lasting 6 sec. Each stimulus level represented a
logMAR
level. The logMAR levels tested were from 1 - 0 logMAR. Adult eye movements
were
recorded using an IDS UI-3140CP infrared camera with a resolution of 1280 x
1024
pixels. There were 100 participants who wore glasses or contact lenses
normally.
These participants were tested without their glasses. There were 30
participants were
tested that had normal eyesight and did not wear glasses.
ETDRS Visual Acuity Chart: Adult visual acuity was tested by qualified
optometrist
at 3 meters distance with an automated ETDRS visual acuity chart. The ETDRS
results
were collected separately from OKN, to make sure that the OKN analysis was
masked
from the ETDRS results. An independent statistician analysed the data.
Data Analysis: Each video was analysed offline using automated head and eye
tracking algorithms to extract eye movement data. The presence or absence of
OKN in
CA 03045768 2019-05-31
WO 2018/104894
PCT/IB2017/057711
- 20 -
each trial was determined using an OKN detection algorithm, with present
indicating a
positive result.
The method used to detect visual acuity was:
Step 1: Find the lowest line with at least three OKNs, as the initial
baseline. Then find
the lowest line with at least two OKNs as bottom line. If the initial baseline
and the
bottom line are within two lines, initial baseline=final baseline. If the
difference is
more than three lines, keep looking for the lowest line with at least two OKNs
as the
baseline.
Step 2: Visual Acuity Score = final baseline ¨ N x 0.02, N = Number of OKNs
below
the final baseline.
Results:
There was a significant positive correlation between the measurements made
with the
OKN Visual Acuity System and those made with the ETDRS chart (Pearson
correlation
coefficient 0.787, p<.0001). This indicates that the OKN-based measures are
well
correlated with the ETDRS measures and that the OKN Visual Acuity System can
effectively assess visual acuity.
Experiment 4: Children's clinical trial:
Subjects: Children aged between 3-7 years were recruited from four clinical
sites
(Auckland University, Auckland, New Zealand, Texas, USA, and Melbourne,
Australia).
Stimuli: Moving stimuli was presented on a 27 inch DELL 52716DG LED monitor,
placed 1.5 meters away from children to elicit OKN. The stimuli were patterned
disk
shaped circles, consisting of a bright inner circle and a darker outer ring.
Other
controlled parameters included disk size, space, and moving speed. The tables
below
explain the characteristics of each stimulus at each age group:
3-4 Year Old
Dis k DI s k pres entati on 1 0.9 0.45 0.7 0.4 7 is k2:1
Left 2
Dis k DI s k pres entati on 2 0.9 0.45 0.7 0.4 7 is k2:1
Right 2
Dis k DI s k pres entati on 3 0.9 0.45 0.7 0.4 7 is k2:1
Left 2
Dis k DI s k pres entati on 4 0.9 0.45 0.7 0.4 7 is k2:1
Right 2
Dis k DI s k pres entati on 5 015 0.45 0.7 0.7 7 is k2:1
Left 2
Dis k DI s k pres entati on 6 075 0.45 0.7 0.7 7 is k2:1
Right 2
CA 03045768 2019-05-31
WO 2018/104894
PCT/IB2017/057711
- 21 -
4-5 Year Old
Disk Disk presentation 1 0,9 0,45 0,7 0,3 7
Disk_21 Left 2
Disk Disk pros entation 2 0,9 0,45 0,7 0,3 7
Disk_21 Right 2
Disk Disk pros entation 3 0,9 0,45 0,7 0,3 7
Disk_21 Left 2
Disk Disk pros entation 4 0,9 0,45 0,7 0,3 7
Disk_21 Right 2
Disk Disk pros entation 5 0,75 0,45 0,7 0,7 7
Disk_21 Left 2
Disk Disk pros entation 6 0,75 0,45 0,7 0,7 7
Disk_21 Right 2
5-7 Year Old
, . . , . ...
Disk Disk presentation 1 0,9 0,15 0,7 0,2 7 Disk_2:1
Left 2
Disk Disk presentation 2 0,9 0,15 0,7 0,2 7 Disk_2:1
Right 2
Disk Disk presentation 3 0,9 0,15 0,7 0,2 7 Disk_2:1
Left 2
Disk Disk presentation 1 0,9 0,15 0,7 02 7 Disk_2:1
Right 2
Disk Disk presentation 5 0,75 0,15 0,7 0,7 7 Disk_2:1
Left 2
Disk Disk presentation 6 0,75 0,15 0,7 0,7 7 Disk_2:1
Right 2
Chart-based visual acuity was assessed using a clinical-trial-standard
electronic visual
acuity system displaying H, 0, T and V optotypes. Optotypes were presented
individually with crowding bars at 3 meters and optotype size was controlled
by a
staircase algorithm (see Moke PS, Turpin AH, Beck RW, et al. Connputeried
method of
visual acuity testing: Adaptation of the annblyopia treatment study visual
acuity
testing protocol. Am 3 Ophthalnnol. 2001;132:903-9).
Test Procedure: Each eye observed four age-specific OKN stimulus
presentations/trials that tested the cut-off logMAR visual acuity for referral
from a
vision screening provided by the American Association for Pediatric
Ophthalmology
and Strabismus (3-4 year-olds observe 0.4 logMAR; 4-5 years, 0.3 logMAR; and 5-
7
years, 0.2 logMAR) and two 0.7 logMAR trials. Each trial lasted 7 seconds,
with a 2-
second acceleration and 5-seconds of uniform motion. For better attention,
stimuli
were integrated into an animation of the child's selection. The practitioner
triggered
presentation of each stimulus when they judged that the child was looking at
the
CA 03045768 2019-05-31
WO 2018/104894
PCT/IB2017/057711
- 22 -
screen. The duration between two consecutive trials was 4-10 seconds.
Participants
were allocated alternately to a HOTV-first stream or an OKN-first stream. For
the
HOTV-first stream, the right eye was tested first, while for the OKN-first
stream, the
left eye was tested first.
Data Analysis: Eye movements were recorded using an IDS UI-3140CP infrared
camera with a resolution of 1280 x 1024 pixels. Each video was first analysed
objectively using eye tracking software, producing an objective
velocity/displacement
signal. Then a trained observer watched the videos offline and subjectively
graded
each. The combination of objective and subjective analysis enabled each trial
to be
designated OKN present or OKN absent. If any age-specific OKN trials generated
an
OKN present result, the child passed the screening. If not, they failed. For
the HOTV
test, children passed if they reached the age specific visual acuity cut off
and failed if
they did not. The sensitivity and specificity of each test were calculated
with reference
to a gold-standard paediatric eye examination conducted by a qualified
clinician which
identified whether the child had a vision problem or not.
Results:
23 participants (46 eyes) were analysed. The OKN Visual Acuity System had a
specificity and sensitivity for detecting a vision problem of 83.33% and
62.5%. This
compared favourably to the HOTV test which had a specificity of 100% and a
sensitivity of 31.25%. These results indicate that the OKN Visual Acuity
System
performs as well as, or better than, the current gold standard HOTV test for
vision
problem screening in preschool and school-age children.