Note: Descriptions are shown in the official language in which they were submitted.
CA 03056414 2019-09-12
WO 2018/170412
PCT/US2018/022888
BIOCHIP HAVING MICROCHANNEL PROVIDED WITH CAPTURING AGENT
FOR PERFORMING CYTOLOGICAL ANALYSIS
RELATED APPLICATIONS
[0001] This application claims the benefit of U.S. Provisional Appin.
Serial No.
62/596,630, filed December 8, 2017, U.S Provisional Appin. Serial No.
62/570,380, filed
October 10, 2017, and U.S. Provisional Appin. Serial No. 62/472,437, filed
March 16, 2017,
the subject matter of which are incorporated by reference herein.
GOVERNMENT FUNDING
[0002] This invention was made with government support under Grant
Nos. RES511023, awarded by The National Institutes of Health. The United
States
government has certain rights to the invention.
FIELD OF THE INVENTION
[0003] This application is related to biochips, and particularly relates to
biochips having
at least one microchannel provided with an agent for capturing cells of
interest within a fluid
sample delivered to the microchannel in order to perform cytological analysis.
BACKGROUND
[0004] About 3 million people worldwide suffer from sickle cell disease
(SCD), mostly
in Africa, India, and the Middle East, with an estimated 100,000 affected in
the U.S.,
according to the Centers for Disease Control, and Prevention. SCD affects 1 in
375 African
American newborns born in the U.S.
[0005] The World Health Organization (WHO) has declared SCD a public health
priority. The greatest burden of SCD is in low-income countries, especially in
Africa. An
estimated 50-80% of the babies born with SCD in Africa die before the age of
5,i.e., more
than 600 babies die every day, due to lack of diagnosis. Very few infants are
screened in
Africa because of the high cost and level of skill needed to run traditional
tests. Current
methods are too costly and take too much time ¨ 2-6 weeks ¨ to enable
equitable and timely
diagnosis. It is estimated by the WHO that 70% of SCD-related deaths are
preventable with
simple, cost-efficient interventions, such as early point-of-care (POC)
diagnosis by newborn
screening, followed by treatment and care. Early diagnosis through newborn
screening,
followed by simple interventions, has dramatically reduced the SCD-related
mortality in the
CA 03056414 2019-09-12
WO 2018/170412
PCT/US2018/022888
-2-
US. These strategies, however, have not been widely available in Africa and
other third
world countries due to limited resources.
[0006] Moreover, the initiation of vaso-occlusive crisis (VOC) events in
SCD is a
multicellular paradigm, likely triggered by aberrant adhesive interactions
between red blood
cells (RBCs) and microvascular bed, and further mediated by impaired RBC
biophysical
properties. In most cases, these events are followed by or simultaneous with
the activation of
other microcirculatory components, including white blood cells (WBCs),
platelets, and
endothelial cells. The interplay between these components, including the
collective adhesive
events, takes place under a wide spectrum of shear rates determined by the
unique
geometrical and morphological features of the human microvasculature, as well
as by the
local changes in the vascular dimensions upon cell-endothelium interactions.
The flow
conditions may dynamically and continuously change even within the same branch
of the
microvessel during this entire process.
SUMMARY
[0007] This application describes a microfluidic device in the form of a
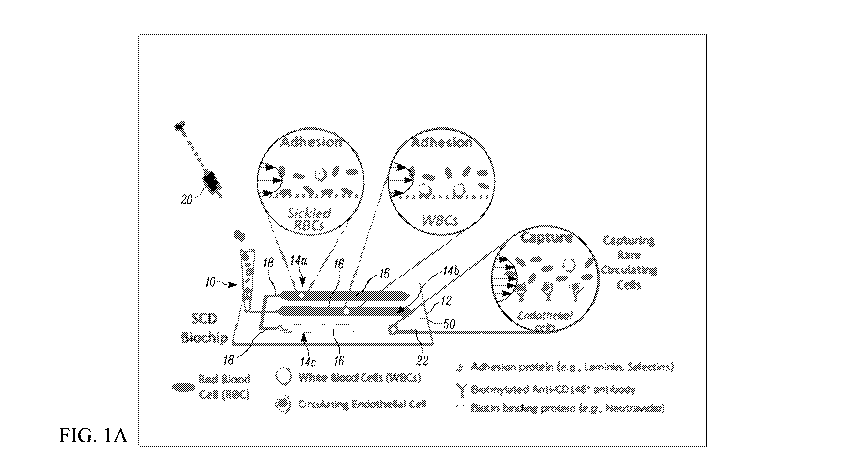
biochip having
microchannels provided on or functionalized with a capturing agent for
capturing cells of
interest to be analyzed from a fluid sample obtained from a subject. In one
example, the
microfluidic device includes a housing including at least one microchannel
that defines at
least one cell adhesion region. The at least one cell adhesion region includes
at least one
capturing agent that adheres or captures to a cell of interest in a fluid
sample when the fluid
sample containing the cells is passed through the at least one microchannel.
The microfluidic
device can also include an imaging system for measuring the morphology and/or
quantity of
the cells of interest adhered by the at least one capturing agent to the at
least one
microchannel when the fluid sample is passed therethrough.
[0008] When the fluid sample is blood, the cells of interest can be, for
example, red
blood cells (RBCs). The capturing agents can include, for example, bioaffinity
ligands such
as fibronectin (FN), laminin (LN), and thrombospondin (TSP) for detecting
hemoglobin
phenotypes. When the fluid sample is synovial fluid, the cells of interest can
be white blood
cells (WBCs). The capturing agents can include, for example, antibodies, such
as CD4+,
CD8+, and CD66b+, for detecting joint disease. In each case, the biochip is
compact and
requires a very small fluid sample from the subject, e. g. , on the
microscale.
CA 03056414 2019-09-12
WO 2018/170412
PCT/US2018/022888
-3-
[0009] The imaging system detects and measures the morphology and/or
quantity of
captured cells of interest within each microchannel. The imaging system can be
a lens-based
imaging system or a lensless/mobile imaging system, e.g., cellular phone
camera. The
imaging system can use software to analyze the images of the microchannels and
can provide
real-time feedback to the subject of the results of the image
acquisition/analysis. These
results, in turn, can be readily transmitted to a primary care provider and/or
stored in a
medical record database.
[0010] The microchannels in the biochip can have a constant or variable
width along
their length. Varying the microchannel width provides continuously changing
shear rates
(shear gradient) along its length. Providing a shear gradient along the flow
direction allows
for the investigation of shear-dependent adhesion of cells at a single flow
rate. The
microchannel geometry can be configured such that both the mean flow velocity
and shear
stress decrease along the flow direction while the flow rate is constant.
[0011] The microfluidic device can simulate physiologically relevant shear
gradients of
microcirculatory blood flow at a constant single volumetric flow rate. Using
this system,
shear-dependent adhesion and deformability of, for example, RBCs from patients
with SCD
can be investigated using vascular endothelial protein functionalized
microchannels. It was
shown that shear dependent adhesion of RBCs exhibits a heterogeneous behavior
based on
adhesion type and cell deformability in a microfluidic flow model, which
correlates clinically
with inflammatory markers and iron overload in patients with SCD. This
revealed the
complex dynamic interactions between RBC-mediated microcirculatory occlusion
and
clinical outcomes in SCD. These interactions may also be relevant to other
microcirculatory
disorders.
[0012] The microfluidic device can be used with a micro-gas exchanger
fluidly
connected to the at least one microchannel for varying the oxygen content of
the fluid sample
containing the cells. The micro-gas exchanger can include a gas-permeable
inner tube
inserted within a gas-impermeable outer tube. Fluid, such as blood or synovial
fluid,
containing the cells of interest can be delivered through the inner tube such
that the fluid
exchanges gases through the permeable tubing wall with a control gas, e.g., 5%
CO2 and 95%
N2, between the tubes. The oxygen content of the fluid exiting the micro-gas
exchanger is
controlled to thereby control the oxygen content of the fluid delivered to the
microchannel.
CA 03056414 2019-09-12
WO 2018/170412
PCT/US2018/022888
-4-
BRIEF DESCRIPTION OF THE FIGURES
[0013] Figs. 1A-B illustrate an example microfluidic biochip that evaluates
cellular,
membrane and adhesive interactions.
[0014] Fig. 2A illustrates an example biochip with a microchannel
configured to
provide a shear gradient at a single flow rate.
[0015] Fig. 2B is a schematic view of the human microvasculature system,
with
characteristic shear rates determined by the vessel geometry and local flow
conditions.
[0016] Figs. 2C-2D illustrate an imaging system for evaluating cell
adhesion within the
microfluidic biochip.
[0017] Fig. 3 illustrates another example microfluidic device for capturing
WBCs from
synovial fluid samples.
[0018] Figs. 4A-4C illustrate an imaging system for evaluating RBC adhesion
and
deformability in physiological flow conditions.
[0019] Figs. 5A-5B are images showing the aspect ratio (AR) and flow of
healthy and
sickle RBCs presented under no flow, flow, and detachment conditions.
[0020] Figs. 6A-6D show data related to HbS-containing, non-deformable RBC
detachment at relatively higher flow velocity, shear stress, and drag force as
compared with
HbA and HbS-containing deformable RBCs.
[0021] Figs. 7A-7L are images showing the determination of cell adhesion
sites based
on analysis of projected cell outlines at flow initiation for HbA- and HbS-
containing RBCs.
[0022] Figs. 8A-8B show data related to the AR and deformability of healthy
and sickle
RBCs presented under no flow, flow, and detachment conditions.
[0023] Figs. 9A-9F are images and data showing variations in RBC adhesion
in FN-
and LN-functionalized microchannels amongst SCD hemoglobin phenotypes.
[0024] Figs. 10A-10B show data related to RBC adhesion in HbSS subjects
with low
HbF and high HbF.
[0025] Figs. 11A-11H show data related to the association between RBC
adhesion and
lactate dehydrogenase (LDH), platelet counts (plts), and reticulocyte counts
(retics) in HbSS.
[0026] Figs. 12A-12G show data related to heterogeneity in adhered RBCs in
FN
functionalized microchannels and its association with serum LDH levels.
CA 03056414 2019-09-12
WO 2018/170412
PCT/US2018/022888
-5-
[0027] Figs. 13A-13D are images and cellular analysis for quantifying
captured WBC
subpopulations from synovial fluid.
[0028] Figs. 14A-14C are images and data showing the specificity of WBCs
captured in
the microfluidic device of Fig. 12A.
[0029] Figs. 15A-15D illustrate the effect of PBS dilution on cell capture
efficiency in
synovial fluid samples.
[0030] Figs. 16A-16C show data related to the effect of flow rate on cell
capture
efficiency in synovial fluid samples.
[0031] Figs. 17A-17D show data related to the effect of hyaluronidase
enzyme on
synovial fluid viscosity and cell capture efficiency.
[0032] Figs. 18A-18D show data comparing cytometer cell counts and
fluorescent
activated cell sorting (FACS) cell counts for synovial samples.
[0033] Figs. 19A-19C illustrate another example microfluidic device for
measuring
RBC adhesion under physiological flow and hypoxic conditions
[0034] Figs. 20A-20C illustrate a micro-gas exchanger system using a model
finger and
pulse-oximeter.
[0035] Figs. 21A-21C illustrate computational modeling of flow in the micro-
gas
exchanger of Figs. 20A-20C.
[0036] Figs. 22A-22B are images showing deoxygenation of adhered RBCs in
blood
samples from HbSS and HbAA subjects.
[0037] Figs. 23A-23C are images and data showing heterogeneity in RBC
adhesion
response to hypoxia.
[0038] Figs. 24A-24B show data related to heterogeneity in analyzed SCD
subjects
based on changes in the number of adhered RBCs in response to hypoxia.
[0039] Figs. 25A-26D show data related to RBC adhesion responsiveness to
hypoxia
over different clinical phenotypes.
[0040] Figs. 26A-26D show data related to RBC adhesion responsiveness to
hypoxia
over different clinical phenotypes.
[0041] Fig. 27 shows data related to SCD subject RBC adhesion
responsiveness to
hypoxia over different ages.
[0042] Figs. 28A-28D show data related to SCD subject RBC adhesion
responsiveness
to hypoxia over different clinical phenotypes.
CA 03056414 2019-09-12
WO 2018/170412
PCT/US2018/022888
-6-
[0043] Fig. 29 shows data reflecting the effect of anti-BCAM antibody on
RBC
adhesion in normoxic and hypoxic conditions for responsive and non-responsive
patient
populations.
[0044] Figs. 30A-30B are images and data showing the quantification of
fluorescently
labeled LN and FN immobilized in shear-gradient microchannels.
[0045] Fig. 30C is a graph showing flow velocity and shear rate contours on
in a
microchannel having a variable width.
[0046] Figs. 31A-31C are images and data showing shear adhesion of RBCs in
a
variable width microchannel.
[0047] Fig. 32A is a graph reflecting average shear-dependent adhesion
curves in LN
functionalized microchannels.
[0048] Figs. 32B-32C show data related to adherent deformable and non-
deformable
cell numbers in LN- and FN-functionalized shear gradient microchannels.
[0049] Fig. 33 is a graph showing adherent RBC counts across different
shear rates,
illustrating the defined parameters herein.
[0050] Figs. 34A-34C show data related to the adhesion of deformable and
non-
deformable sickle RBCs to LN- and FN-functionalized microchannels.
[0051] Figs. 35A-35C show data related to patient-specific, shear-dependent
adhesion
curves in LN-functionalized microchannels.
[0052] Figs. 36A-36C show data related to patient-specific, normalized,
shear-
dependent adhesion curves in LN-functionalized microchannels.
[0053] Figs. 37A-37C show data related to the shear dependence of sickle
RBCs to LN
and clinical parameters.
[0054] Figs. 38A-38E show a microfluidic device having a mobile imaging
system and
cell adhesion metrics associated with the mobile imaging system.
[0055] Figs. 39A-39C show data comparing the mobile imaging system to
conventional
microscope counts.
[0056] Figs. 40A-40D show images related to using the mobile imaging system
with a
cellular application.
[0057] Other objects and advantages and a fuller understanding of the
invention will be
had from the following detailed description and the accompanying drawings.
CA 03056414 2019-09-12
WO 2018/170412
PCT/US2018/022888
-7-
DETAILED DESCRIPTION
[0058] This application is related to biochips, and particularly relates to
microfluidic
biochip devices having at least one microchannel provided on or functionalized
with an agent
for capturing cells of interest within a fluid sample from a subject delivered
to the
microchannel in order to perform cytological analysis.
Definitions
[0059] To facilitate the understanding of this invention, a number of terms
are defined
below. Terms defined herein have meanings as commonly understood by a person
of
ordinary skill in the areas relevant to the present invention. Terms such as
"a", "an", and
"the" are not intended to refer to only a singular entity but also plural
entities and also
includes the general class of which a specific example may be used for
illustration. The
terminology herein is used to describe specific aspects of the invention, but
their usage does
not delimit the invention, except as outlined in the claims.
[0060] The term "microchannels" as used herein refer to pathways through a
medium,
e.g., silicon, that allow for movement of liquids and gasses. Microchannels
can therefore
connect other components, i.e., keep components in liquid communication."
While it is not
intended that the present application be limited by precise dimensions of the
channels,
illustrative ranges for channels are as follows: the channels can be between
0.35 and 100 um
in depth (e.g., 50 um) and between 50 and 1000 um in width (e.g., 400 um). The
channel
length can be between 4 mm and 100 mm (e.g., about 27 mm).
[0061] The term "microfabricated", "micromachined", and/or
"micromanufactured" as
used herein means to build, construct, assemble or create a device on a small
scale,
e.g., where components have micron size dimensions or microscale.
[0062] The term "polymer" as used herein refers to a substance formed from
two or
more molecules of the same substance. Example polymers are gels, crosslinked
gels, and
polyacrylamide gels. Polymers may also be linear polymers in which the
molecules align
predominately in chains parallel or nearly parallel to each other. In a non-
linear polymer, the
parallel alignment of molecules is not required.
[0063] The term "lensless or mobile imaging system" as used herein refers
to an optical
configuration that collects an image based upon electronic signals as opposed
to light waves.
CA 03056414 2019-09-12
WO 2018/170412
PCT/US2018/022888
-8-
For example, a lensless image may be formed by excitation of a charged coupled
device
(CCD) sensor by emissions from a light emitting diode.
[0064] The term "charge-coupled device (CCD)" as used herein refers to a
device for
the movement of electrical charge, usually from within the device to an area
where the charge
can be manipulated, for example, a conversion into a digital value. A CCD
provides digital
imaging when using a CCD image sensor where pixels are represented by p-doped
MOS
capacitors.
[0065] The term "symptom" as used herein refers to any subjective or
objective
evidence of disease or physical disturbance observed by the patient. For
example, subjective
evidence is usually based upon patient self-reporting and may include, but is
not limited to,
pain, headache, visual disturbances, nausea, and/or vomiting. Alternatively,
objective
evidence is usually a result of medical testing including, but not limited to,
body temperature,
complete blood count, lipid panels, thyroid panels, blood pressure, heart
rate,
electrocardiogram, tissue, and/or body imaging scans.
[0066] The term "disease" or "medical condition", as used herein, refers to
any
impairment of the normal state of the living animal or plant body or one of
its parts that
interrupts or modifies the performance of the vital functions. Typically
manifested by
distinguishing signs and symptoms, it is usually a response to: i)
environmental factors (as
malnutrition, industrial hazards or climate); ii) specific infective agents
(as worms, bacteria or
viruses); iii) inherent defects of the organism (as genetic anomalies); and/or
iv) combinations
of these factors.
[0067] The term "patient" or "subject" as used herein is a human or animal
and need
not be hospitalized. For example, out-patients, persons in nursing homes are
"patients." A
patient may comprise any age of a human or non-human animal and therefore
includes both
adult and juveniles, i.e., children. It is not intended that the term
"patient" connote a need for
medical treatment and, thus, a patient may voluntarily or involuntarily be
part of
experimentation whether clinical or in support of basic science studies.
[0068] The term "derived from" as used herein refers to the source of a
compound or
sample. In one respect, a compound or sample may be derived from an organism
or
particular species.
CA 03056414 2019-09-12
WO 2018/170412
PCT/US2018/022888
-9-
[0069] The term "antibody" as used herein refers to immunoglobulin evoked
in animals
by an immunogen (antigen). It is desired that the antibody demonstrates
specificity to
epitopes contained in the immunogen.
[0070] The terms "specific binding" or "specifically binding" as used
herein when used
in reference to the interaction of an antibody and a protein or peptide means
that the
interaction is dependent upon the presence of a particular structure, e.g., an
antigenic
determinant or epitope, on a protein. In other words, an antibody is
recognizing and binding
to a specific protein structure rather than to proteins in general. For
example, if an antibody
is specific for epitope "A", the presence of a protein containing epitope A
(or free, unlabeled
A) in a reaction containing labeled "A" and the antibody will reduce the
amount of labeled A
bound to the antibody.
[0071] The term "functionalized" or "chemically functionalized" as used
herein means
the addition of functional groups onto the surface of a material by chemical
reaction(s). As
will be readily appreciated by a person skilled in the art, functionalization
can be employed
for surface modification of materials in order to achieve desired surface
properties, such as
biocompatibility, wettability, and so on. Similarly, the term
"biofunctionalization,"
"biofunctionalized," or the like, as used herein, means modification of the
surface of a
material to have desired biological function, which will he readily
appreciated by a person of
skill in the related art, such as bioengineering.
[0072] The term "sample" as used herein is used in its broadest sense and
includes
environmental and biological samples. Environmental samples include material
from the
environment such as soil and water. Biological samples may be animal,
including, human,
fluid, e.g., blood, plasma, and serum; solid, e.g., stool; tissue; liquid
foods, e.g., milk; and
solid foods, e.g., vegetables. A biological sample may comprise a cell, tissue
extract, body
fluid, chromosomes or extrachromosomal elements isolated from a cell, genomic
DNA (in
solution or bound to a solid support such as for Southern blot analysis), RNA
(in solution or
bound to a solid support such as for Northern blot analysis), cDNA (in
solution or bound to a
solid support) and the like.
[0073] The terms "bioaffinity ligand", "binding component", "molecule of
interest",
"agent of interest", "ligand" or "receptor" as used herein may be any of a
large number of
different molecules, biological cells or aggregates, and the terms are used
interchangeably.
Each binding component may be immobilized on a solid substrate and binds to an
analyte
CA 03056414 2019-09-12
WO 2018/170412
PCT/US2018/022888
-10-
being detected. Proteins, polypeptides, peptides, nucleic acids (nucleotides,
oligonucleotides
and polynucleotides), antibodies, ligands, saccharides, polysaccharides,
microorganisms such
as bacteria, fungi, and viruses, receptors, antibiotics, test compounds
(particularly those
produced by combinatorial chemistry), plant and animal cells organdies or
fractions of each
and other biological entities may each be a binding component. Each, in turn,
also may be
considered as analytes if same bind to a binding component on a microfluidic
biochip.
[0074] The terms "bind" or "adhere" as used herein include any physical
attachment or
close association, which may be permanent or temporary. Generally, an
interaction of
hydrogen bonding, hydrophobic forces, van der Waals forces, covalent and ionic
bonding
etc., facilitates physical attachment between the molecule of interest and the
analyte being
measuring. The "binding" interaction may be brief as in the situation where
binding causes a
chemical reaction to occur. That is typical when the binding component is an
enzyme and the
analyte is a substrate for the enzyme. Reactions resulting from contact
between the binding
agent and the analyte are also within the definition of binding for the
purposes of this
application.
[0075] The term, "substrate" as used herein refers to surfaces as well as
solid phases
which may include a microchannel. In some cases, the substrate is solid and
may comprise
PDMS. A substrate may also include components including, but not limited to,
glass, silicon,
quartz, plastic or any other composition capable of supporting
photolithography.
[0076] The term, "photolithography", "optical lithography" or "UV
lithography" as
used herein refers to a process used in microfabrication to pattern parts of a
thin film or the
bulk of a substrate. It uses light to transfer a geometric pattern from a
photomask to a light-
sensitive chemical "photoresist" or simply "resist," on the substrate. A
series of chemical
treatments then either engraves the exposure pattern into or enables
deposition of a new
material in the desired pattern upon, the material underneath the photo
resist. For example, in
complex integrated circuits, a modern CMOS wafer will go through the
photolithographic
cycle up to 50 times.
Microfluidic Biochip
[0077] Examples described herein relate to a microfluidic biochip device
and system
and an analytic method for simultaneous interrogation of cell deformability
and adhesion to a
microvasculature-mimicking surface at a single cell level. In some examples,
the
CA 03056414 2019-09-12
WO 2018/170412
PCT/US2018/022888
-11-
microfluidic biochip device or system can quantify membrane, cellular, and
adhesive
properties of red blood cells (RBCs) and white blood cells (WBCs) of a
subject. This can be
used, for example, to monitor disease severity, upcoming pain crisis,
treatment response, and
treatment effectiveness in a clinically meaningful way. In one example, the
cells are derived
from the whole blood of patients being screened and/or monitored for SCD
progression.
[0078] The microfluidic device includes a housing and at least one
microchannel that
defines at least one cell adhesion region. Each microchannel can have a
constant width or a
width that continuously changes in a direction of the fluid sample flow
through the
microchannel. The at least one cell adhesion region is functionalized with at
least one
capturing agent that captures or adheres a cell of interest to a surface of
the microchannel
when a sample fluid containing cells is passed through the at least one
microchannel. If the
housing includes multiple microchannels, each microchannel can be
functionalized with a
different capturing agent to adhere different cells of interest thereto. In
any case, each
microchannel is configured to receive and provide cell adhesion analysis of a
microvolume
fluid sample.
[0079] In some embodiments, the capturing agent can be a bioaffinity
ligand, such as
fibronectin (FN), laminin (LN), thrombospondin (TSP), selectin, von Willebrand
Factor
(vWF) or a C146 antibody. FN is an adhesive glycoprotein found in the
extracellular matrix
and in plasma as a linker molecule. FN has been shown to promote abnormal RBC
and WBC
(particularly neutrophil) adhesion to the endothelial wall in SCD. In contrast
with FN, LN is
embedded inside the sub-endothelial layer and has been implicated in sickle
RBC adhesion to
the vascular wall. Under normal conditions, LN is not in contact with flowing
blood. In
SCD, however, the endothelial lining cracks, thereby allowing sub-endothelial
matrix
proteins ¨ including LN ¨ to interact with circulating cells. Regardless of
the bioaffinity
ligand chosen, an imaging system of the microfluidic device measures the
quantity of cells
adhered to the at least one bioaffinity ligand within each microchannel when
the fluid sample
is passed therethrough.
[0080] In another example, the microfluidic device further includes a micro-
gas
exchanger fluidly connected to the at least one microchannel for varying the
oxygen content
of the fluid sample containing the cells. The micro-gas exchanger can include
a gas-
permeable inner tube inserted within a gas-impermeable outer tube. Fluid, such
as blood or
synovial fluid, containing the cells of interest is delivered through the
inner tube such that the
CA 03056414 2019-09-12
WO 2018/170412
PCT/US2018/022888
-12-
fluid exchanges gases through the permeable tubing wall with a control gas,
e.g., 5% CO2 and
95% N2, between the tubes. The oxygen content of the fluid exiting the micro-
gas exchanger
is controlled to thereby control the oxygen content of the fluid delivered to
the microchannel.
[0081] By way of example, the micro-gas exchanger can include concentric
inner and
outer tubes. The inner tube has a gas-permeable wall defining a central
passage extending the
entire length of the inner tube. The outer tube has a gas impermeable wall
defining a central
passage extending the entire length of the outer tube. An annular space is
formed between the
tubes. The central passage receives the fluid sample and is in fluid
communication with one
or more inlet ports of the microfluidic device. Each inlet port can be fluidly
connected to the
same micro-gas exchanger or a different micro-gas exchanger to specifically
tailor the fluid
delivered to each microchannel. An outlet tube is connected to each outlet
port of the micro-
gas exchanger. A controlled gas flow takes place in the annular space between
the concentric
tubes and fluid flows inside the inner tube. When the fluid sample is blood,
deoxygenation of
the sample occurs due to gas diffusion (5% CO2 and 95% N2) through the inner
gas-
permeable wall.
[0082] Fig. 1A illustrates an example microfluidic biochip device 10 for
measuring
cellular, membrane, and adhesive interactions. The microfluidic device 10
includes a
housing 12 defining at least one channel 14 ¨ here a plurality of channels 14a-
14c ¨ that each
includes a cell adhesion or adherence region 16. Each channel 14a-14c is
fluidly connected
to an inlet port 18 at one end and an outlet port (not shown) at another end.
Although Fig. 1A
depicts three channels 14a-14c, the microfluidic device 10 can include more or
fewer than
three channels. The size of each channel 14a-14c should be large enough to
prevent clogging
of the channels when a fluid sample 20, e.g., blood, synovial fluid or a
solution containing
cells to be analyzed, is passed through the channels.
[0083] Referring to Fig. 1B, the microfluidic biochip 10 can include a
multilayer
structure formed of a base layer 30, an intermediate layer 40, and a cover
layer 50. The
channels 14a-14c are formed in the intermediate layer 40. A first end of each
channel 14a-
14c is aligned with a corresponding inlet port 18. A second end of each
channel is aligned
with a corresponding outlet port 22. This creates a flow channel from an inlet
port 18 to the
corresponding outlet port 22 via the channel 14. The channels 14a-14c can also
extend
slightly beyond their respective inlet 18 and outlet ports 22 (not shown). The
channels 14a-
14c are sized to accept volumes, e.g., pL or mL, of the sample 20 containing
cells to be
CA 03056414 2019-09-12
WO 2018/170412
PCT/US2018/022888
-13-
adhered or captured in the respective regions 16 (See Fig. 1A). The channels
14a-14c may be
further sized and shaped to affect adherence or capturing of the cells from
the sample 20.
[0084] The base layer 30 provides structural support to the cell adherence
region 16 and
is formed of a sufficiently rigid material, such as poly(rnethyl mediacrylate)
(PMMA) or
glass. The base layer 30 can have a suitable thickness, for example of about
0.1 mm to about
2 mm, or about 1.6 mm, determined by manufacturing and assembly restrictions.
[0085] The cover layer 50 contains the inlet ports 18 and outlet ports 22
used to feed
the sample 20 in/out of the channel 14. The cover layer 50 thickness can be
about 1 mm to
about 10 mm, for example, about 3.6 mm, and is determined by the integration
and assembly
requirements. The inlet and outlet port 18, 22 diameters can be about 0.3 mm
to about 3 mm,
for example about lmm. The lower size limit is determined by the manufacturing
restrictions. The upper size limit is determined by the desired flow
conditions of sample 20
through the channel 14. In another example (not shown), a laser cutter can be
used to cut a
larger piece of PMMA into a desired size for the microfluidic device 10 and to
cut holes for
the inlet ports 18 and the outlet ports 22.
[0086] The intermediate layer 40 can be formed of a material that adheres
to both the
base layer 30 and the cover layer 50. Each channel 14 can be formed, for
example, by laser
cutting polygons, such as rectangular sections, in the intermediate layer 40,
which can itself
be laser cut to the desired size, e.g., the size of the base layer 30. The
height or depth of each
channel 14 can be determined by the thickness of the intermediate layer 40,
which is
discussed in greater detail below.
[0087] The intermediate layer 40 is adhered to the base layer 30 after each
channel 14 is
cut in the intermediate layer. The cover layer 50, which can have the same
lateral dimensions
as the base layer 30 and the intermediate layer 40, can be adhered onto the
exposed side of
the intermediate layer 40, thereby enclosing each channel 14. In the examples
depicted in
Figs. 1A and 2B, the microfluidic device 10 is oriented such that the cover
layer 50 is on top.
Alternatively, the microfluidic device 10 can be oriented such that the cover
layer 50 is on the
bottom (not shown).
[0088] Fig. 2B illustrates another example microfluidic biochip device 10'.
The
microfluidic device 10' includes a housing 12 defining a single channel 14
having cell
adhesion or adherence regions 16. The channel 14 is fluidly connected to an
inlet port 18 at
one end and an outlet port 22 at another end. Although Fig. 2B depicts only
one channel 14,
CA 03056414 2019-09-12
WO 2018/170412
PCT/US2018/022888
-14-
the microfluidic device 10' can include multiple channels. The channel 14
receives a sample
20 from a patient. The channel 14 can have a length L of about 45-50 mm, a
depth of about
50-57 pm ( 1 pm), and a width W that varies along the length L from about 4
mm (at the
inlet end) to about 16 mm (closer to the outlet end).
[0089] The geometry of the channel 14 in the microfluidic device 10' is
such that, when
fluid is introduced into the channel 14, shear stress in the fluid flow along
the longitudinal
axis of the channel varies linearly along the channel length L. In one
example, the shape of
the channel 14 is such that the shear stress in the fluid flow along the axis
of the chamber
decreases linearly along the channel length L. To this end, the channel 14 can
have a tapered,
triangular, trapezoidal and/or diamond-shaped configuration. This allows for
cell adhesion
analysis over a range of shear stresses in a single experiment. Consequently,
the
configuration of the channel 14 allows for the study of the effect of flow
conditions on the
attachment of cells of interest, e. g. , RBCs, to the surface of the channel
defining the cell
adhesion region 16.
[0090] In some examples, the microfluidic device 10, 10' geometry and
dimensions are
determined to accommodate a uniform, laminar flow condition for the fluid
sample 20, which
determines capture efficiency and flow rate. In such examples, the channel 14
width W can
vary from about 1 mm to about 15 mm. The minimum width W is determined by the
diameters of the inlet and outlet port 18, 22. The upper limit width W is
determined by the
flow characteristics of fluid sample 20 in a confined channel 14. The channel
14 length L can
be about 4 mm to about 100 mm. The lower channel 14 length L dimension is
determined by
the flow characteristics of the fluid sample 20 in a confined channel. The
upper limit length L
is determined by cell capture efficiency. The channel 14 height/depth can be
about 10 pin to
about 500 m, for example, about 50 m, which is determined by fluid mechanics
laws and
constraints and flow characteristics of the fluid sample 20 in a confined
channel. In any case,
the channel(s) 14 in either device 10, 10' can be a microchannel sized to
receive and capable
of testing a fluid sample 20 on the 1.iL scale in volume.
[0091] In each microfluidic device 10, 10' each cell adherence regions 16
can include a
surface on which is provided a layer or coating of the at least one capturing
agent. The at
least one capturing agent can be, for example, a bioaffinity ligand. The same
or different
bioaffinity ligand 16 can be provided in each channel 14. The bioaffinity
ligand can include,
for example, at least one of FN, LN, TSP, selectins, von Willebrand Factor or
a C146
CA 03056414 2019-09-12
WO 2018/170412
PCT/US2018/022888
-15-
antibody. The bioaffinity ligand can be adhered to, functionalized or
chemically
functionalized to the cell adhesion region 16 of each channel 14. The
bioaffinity ligands may
be functionalized to the cell adhesion region 16 covalently or non-covalently.
A linker can be
used to provide covalent attachment of a bioaffinity ligand to the cell
adhesion region 16. The
linker can be a linker that can be used to link a variety of entities.
[0092] In some examples, the linker may be a homo-bifunctional linker or a
hetero-
bifunctional linker, depending upon the nature of the molecules to be
conjugated. Homo-
bifunctional linkers have two identical reactive groups. Hetero-bifunctional
linkers have two
different reactive groups. Various types of commercially available linkers are
reactive with
one or more of the following groups: primary amines, secondary amines,
sulphydryls,
carboxyls, carbonyls and carbohydrates. Examples of amine-specific linkers are
bis(sulfosuccinimidyl) suberate, bis[2-
(succinimidooxycarbonyloxy)ethyllsulfone,
disuccinimidyl suberate, disuccinimidyl tartarate, dimethyl adipimate 2HC1,
dimethyl
pimelimidate 2HC1, dimethyl suberimidate HC1, ethylene glycolbis-[succinimidy1-
[succinatell, dithiolbis(succinimidyl propionate), and 3,3'-
dithiobis(sulfosuccinimidylpropionate). Linkers reactive with sulfhydryl
groups include
bismaleimidohexane, 1,4-di-[3'-(2'-pyridyldithio)-propionamidollbutane, 1-[p-
azidosalicylamido1-4-kodoacetamidolbutane, and N-[4-(p-
azidosalicylamido)buty11-3'-[2'-
pyridyldithiolpropionamide. Linkers preferentially reactive with carbohydrates
include
azidobenzoyl hydrazine. Linkers preferentially reactive with carboxyl groups
include 44p-
azidosalicylamidolbutylamine.
[0093] Heterobifunctional linkers that react with amines and sulfhydryls
include N-
succinimidy1-3-[2-pyridyldithio]propionate, succinimidy1[4-
iodoacetyllaminobenzoate,
succinimidyl 4-[N-maleimidomethylicyclohexane-1-carboxylate, m-
maleimidobenzoyl-N-
hydroxysuccinimide ester, sulfosuccinimidyl 64342-
pyridyldithiolpropionamidolhexanoate,
and sulfosuccinimidyl 4-[N-maleimidomethylicyclohexane-1-carboxylate.
Heterobifunctional
linkers that react with carboxyl and amine groups include 1-ethy1-343-
dimethylaminopropyll-carbodiimide hydrochloride. Heterobifunctional linkers
that react with
carbohydrates and sulfhydryls include 44N-maleimidomethyll-cyclohexane-1-
carboxylhydrazide HC1, 4-(4-N-maleimidopheny1)-butyric acid hydrazide.2HC1,
and 342-
pyridyldithiolpropionyl hydrazide.
CA 03056414 2019-09-12
WO 2018/170412
PCT/US2018/022888
-16-
[0094] Alternatively, the bioaffinity ligands may be non-covalently coated
onto the cell
adhesion region 16. Non-covalent deposition of the bioaffinity ligand to the
cell adhesion
region 16 may involve the use of a polymer matrix. The polymer may be
naturally occurring
or non-naturally occurring and may be of any type including but not limited to
nucleic acid,
e.g., DNA, RNA, PNA, LNA, and the like or mimics, derivatives or combinations
thereof,
amino acid, e.g., peptides, proteins (native or denatured), and the like or
mimics, derivatives
or combinations thereof, lipids, polysaccharides, and functionalized block
copolymers. The
bioaffinity ligand may be adsorbed onto and/or entrapped within the polymer
matrix.
Alternatively, the bioaffinity ligand may be covalently conjugated or
crosslinked to the
polymer, e.g., it may be "grafted" onto a functionalized polymer.
[0095] An example of a suitable peptide polymer is poly-lysine, e.g., poly-
L-lysine.
Examples of other polymers include block copolymers that comprise polyethylene
glycol
(PEG), polyamides, polycarbonates, polyalkylenes, polyalkylene glycols,
polyalkylene
oxides, polyalkylene terepthalates, polyvinyl alcohols, polyvinyl ethers,
polyvinyl esters,
polyvinyl halides, polyvinylpyrrolidone, polyglycolides, polysiloxanes,
polyurethanes, alkyl
cellulose, hydroxyalkyl celluloses, cellulose ethers, cellulose esters,
nitrocelluloses, polymers
of acrylic and methacrylic esters, methyl cellulose, ethyl cellulose,
hydroxypropyl cellulose,
hydroxypropyl methyl cellulose, hydroxybutyl methyl cellulose, cellulose
acetate, cellulose
propionate, cellulose acetate butyrate, cellulose acetate phthalate,
carboxylethyl cellulose,
cellulose triacetate, cellulose sulphate sodium salt, poly(methyl
methacrylate), poly(ethyl
methacrylate), poly(butylmethacrylate), poly(isobutyl methacrylate),
poly(hexylmethacrylate), poly(isodecyl methacrylate), poly(lauryl
methacrylate), poly(phenyl
methacrylate), poly(methyl acrylate), poly(isopropyl acrylate), poly(isobutyl
acrylate),
poly(octadecyl acrylate), polyethylene, polypropylene, poly(ethylene glycol),
poly(ethylene
oxide), poly(ethylene terephthalate), poly(vinyl alcohols), polyvinyl acetate,
polyvinyl
chloride, polystyrene, polyhyaluronic acids, casein, gelatin, glutin,
polyanhydrides,
polyacrylic acid, alginate, chitosan, poly(methyl methacrylates), poly(ethyl
methacrylates),
poly(butylmethacrylate), poly(isobutyl methacrylate), poly(hexylmethacrylate),
poly(isodecyl
methacrylate), poly(lauryl methacrylate), poly(phenyl methacrylate),
poly(methyl acrylate),
poly(isopropyl acrylate), poly(isobutyl acrylate), and poly(octadecyl
acrylate), poly(lactide-
glycolide), copolyoxalates, polycaprolactones, polyesteramides,
polyorthoesters,
polyhydroxybutyric acid, polyanhydrides, poly(styrene-b-isobutylene-b-styrene)
(SIBS)
CA 03056414 2019-09-12
WO 2018/170412
PCT/US2018/022888
-17-
block copolymer, ethylene vinyl acetate, poly(meth)acrylic acid, polymers of
lactic acid and
glycolic acid, polyanhydrides, poly(ortho)esters, polyurethanes, poly(butic
acid), poly(valeric
acid), and poly(lactide-cocaprolactone), and natural polymers such as alginate
and other
polysaccharides including dextran and cellulose, collagen, albumin and other
hydrophilic
proteins, zein and other prolamines and hydrophobic proteins, copolymers and
mixtures
thereof, and chemical derivatives thereof including substitutions and/or
additions of chemical
groups, for example, alkyl, alkylene, hydroxylations, oxidations, and other
modifications
routinely made by those skilled in the art.
[0096] In some examples, each channel 14 can include multiple, separate
cell adhesion
regions 16 functionalized with at least one bioaffinity ligand. At least two
or at least three of
the channels 14 can include different bioaffinity ligands. In other examples,
the plurality of
channels 14 can include the same bioaffinity ligands.
[0097] In still other examples, at least one channel 14 can include at
least two different
bioaffinity ligands functionalized on the cell adhesion region 16. The
different bioffinity
ligands can be located at different positions within the cell adhesion region
16 of each
channel 14. For example, at least one of LN, selectin, von Willebrand Factor,
thrombospondin, and the C146 antibody can be localized at different positions
along the
length L of the at least one channel 14.
[0098] In some examples, a fluid sample 20, which includes at least one
blood cell from
a subject is introduced into each channel 14. The capturing agent or
bioaffinity ligand can
bind cells of interest in the fluid sample to a surface or wall(s) of the
microchannel along the
cell adhesion region 16. The quantity of blood cells bound to the microchannel
walls by the
capturing agent can be imaged using an imaging system 60 (see Fig. 4A). The
imaging
system 60 can determine, for example, the aspect ratio (AR) of the blood cells
as well as
quantify membrane, cellular and adhesive properties of the blood cells to
monitor disease
severity, upcoming pain crisis, treatment response, and treatment
effectiveness of a subject in
a clinically meaningful way.
[0099] In some examples, the imaging system 60 can be a lens-based imaging
system
or a lensless/mobile imaging system. For example, the lensless imaging system
60 can be a
CCD sensor and a light emitting diode. In some examples, a mobile imaging and
quantification algorithm can be integrated into or with the microfluidic
device 10, 10'. The
CA 03056414 2019-09-12
WO 2018/170412
PCT/US2018/022888
-18-
algorithm can achieve reliable and repeatable test results for data collected
in all resource
settings of the microfluidic device 10, 10'.
[00100] In other examples, the microfluidic device 10, 10' can be
configured to
cooperate with a cellular phone having imaging capabilities. In such a case,
the cellular
phone can be provided with or capable of obtaining image analysis
algorithms/software, e.g.,
via an online application. Referring to Figs. 2C-2D, in such a construction an
optical
attachment member 100 connects the microfluidic device 10 to a cellular phone
110. The
optical attachment member 100 includes a first slot 102 for receiving the
microfluidic device
and a second slot 104 for receiving the cellular phone 110.
[00101] An optical tunnel 120 extends through the optical attachment member
100 to the
first slot 102. The optical tunnel 120 receives a lens 122, a diffuser (not
shown), an LED
holder 124, and an LED 126. In use, the LED 126 provides light to the optical
tunnel 120.
The light passes through the diffuser, which polarizes the light and back-
illuminates the blood
sample 20 within the microfluidic device 10. Light and the silhouettes of
adhered RBCs are
collected on the lens 122 within the optical tunnel 120 and sent to the lens
and CMOS sensor
of the cellular phone 110 camera.
[00102] Images can be recreated by the cellular phone 110 camera software
and loaded
into a custom phone application that identifies adhered RBCs, quantifies the
number of
adhered RBCs in the image, and displays the results. The optical attachment
member 100 can
include, for example, a battery for powering the LED 126 and other components
of the
optical attachment member, if necessary. In any case, the imaging system 140
in this example
includes the optical attachment member 100 for connecting the microfluidic
device 10 and
the cellular phone 110 as well as the application on the cellular phone for
performing the
cytological analysis.
[00103] The cells of interest can be blood cells obtained from the subject
and the
imaging system 60, 140 can quantify the adhered cells in each respective
channel 14 to
monitor the health of a subject from which the cells are obtained. In other
examples, the
imaging system 60, 140 can quantify the adhered cells in each respective
channel 14 to
monitor the progression of a disease, such as SCD, of a subject from which the
cells are
obtained. In still other examples, the imaging system 60, 140 can quantify the
adhered cells in
each channel 14 to measure the efficacy of a therapeutic treatment
administered to a subject
from which the cells are obtained.
CA 03056414 2019-09-12
WO 2018/170412
PCT/US2018/022888
-19-
[00104] It can be expected that a microfluidic device 10, 10' platform
disclosed herein is
applicable to the study of single cell heterogeneity of adherent cells within
subjects in larger
clinically diverse populations and may provide important insights into complex
disease
phenotypes other than SCD. For example, abnormal RBC adhesion to microvascular
surfaces
has previously been implicated in other multi-system diseases, such as 13-
thalassemia,
diabetes mellitus, hereditary spherocytosis, polycythemia vera, and malaria.
[00105] By way of example, referring back to Fig. 2B, sickled RBC adherence
to blood
vessel walls has been shown to take place in post-capillary venules. To this
end, this
application contemplates a microfluidic SCD biochip including at least one
microchannel
having a width W of approximately 60 pm, a depth of about 50 pm, and fluid
flow velocities
within a range of approximately 1-13 mm/sec ¨ similar to that reported for
post-capillary
venules. No study, however, to date has analyzed HbS-containing RBC adhesion
and
deformability using whole blood at the microvasculature scale of ¨ 60 pm. That
said, the data
presented herein demonstrates heterogeneity in HbS-containing RBC adhesion and
deformability measured at a single cell level in SCD blood samples examined in
microfluidic
channels mimicking a microvasculature.
[00106] In one example, the microfluidic biochip 10, 10' can be used in an
SCD testing
method utilizing pathophysiologic correlates, including but not limited to,
analyses of
adhesion and membrane properties in HbSS and HbSC, at baseline and during vaso-
occlusive
crises, with treatment, and in the presence of end-organ damage. The SCD
testing method
described herein can be completed in less than ten minutes. In some examples,
the SCD
testing method provides a highly specific analyses of CMA properties in RBCs,
WBCs,
circulating hematopoietic precursor cells and circulating endothelial cells.
In one example,
the SCD testing method is performed using a portable, high efficiency,
microfluidic biochip
and a miniscule blood sample (<15 pL). The SCD testing method can provide a
sophisticated
and clinically relevant strategy with which patient blood samples may be
serially examined
for cellular/membrane/adhesive properties during SCD disease progression.
[00107] In some examples, the microfluidic device 10, 10' can accurately
quantitate
cellular interactions and membrane properties using a single drop of blood.
The biochip and
method may validate insights about mechanisms of disease in SCD and may reveal
correlations between disease heterogeneity and acute and/or chronic SCD
complications.
CA 03056414 2019-09-12
WO 2018/170412
PCT/US2018/022888
-20-
[00108] The microfluidic device 10, 10' can also evaluate membrane and
cellular
abnormalities by interrogating a number of recognized abnormalities in a range
of clinical
phenotypes. To date, these phenotypes are discussed in various correlative SCD
studies
ranging between clinical reports, testing results, interventions, and/or chart
reviews.
[00109] The examples described herein have advantages because existing
conventional
methods cannot assess longitudinal and large-scale SCD clinical correlations
with cellular,
membrane, and adhesive properties. To this end, this application contemplates
a method for
using an SCD biochip for examining cellular properties and interactions. These
cellular
properties and interactions include, but are not limited to, RBC cellular and
adhesive
properties, WBC cellular and adhesive properties, circulating endothelial
characteristics and
hematopoietic precursor cell characteristics. For example, a microfluidic
biochip can include
a plurality of microchannels that are functionalized with lignin, selectins,
avidin and/or
biotinylated antibodies to BCAM/LU, CD11b, CD34, and/or CD146. A method is
contemplated for correlating SCD biochip function in heterogeneous SCD
populations,
including but not limited to, HbSS and HbSC over a range of ages, and in those
with acute
and chronic complications and compared with normal HbAA controls.
[00110] A simple test for adhesion would allow exploration of its role in
chronic
complications in SCD, in addition to during crisis. Selectins may be tested
using microfluidic
biochips as an adhesive surface, in place of cultured endothelial cells.
Endothelial selectins
are believed to mediate leukocyte adhesion and rolling on the endothelial
surface. For
example, in experimental models of SCD, P-selectin is widely expressed on
vascular
endothelium and endothelial E-selectin is important for vascular occlusion.
This application
contemplates a microfluidic SCD biochip including at least one microchannel
provided with
at least one immobilized P-selectin and/or E-selectin adhesion.
[00111] It is expected that SCD samples show greater WBC adherence to
selectins,
compared with HbAA controls. Examination of SCD samples, at baseline and with
crisis,
may evaluate changes with disease activity. For example, MAC-1, LFA-1, and VLA-
4
expression may be measured by FACS on selectin-captured blood WBCs, as
compared with
unmanipulated WBCs on an SCB microfluidic biochip from the same sample.
[00112] It is possible that immobilized selectins may interact with RBCs.
If this hinders
analysis of WBC interactions, RBCs may be lysed prior to analysis. RBC
adherence may be
variable between patients and therefore informative, and can be quantified if
so. Of note,
CA 03056414 2019-09-12
WO 2018/170412
PCT/US2018/022888
-21-
conventional in vitro measures of WBC adherence entail endothelial cell
culture, which is
avoided by use of a microfluidic biochip system.
[00113] The SCD microfluidic biochip can include a CD1lb for isolating an
activated
WBC. The activated WBC can be a monocyte, which has been recognized as major
inflammatory mediators of endothelial activation in SCD. The microfluidic
biochip can also
include a microchannel coated with CD146 antibodies to quantitate mature
circulating
endothelial cells.
[00114] The microfluidic SCD biochip can also include vWF or thrombomodulin
to
quantitate CECs by image analysis. Although isolation of rare CECs is
technically
challenging, these cells have been identified by FACS in unmanipulated blood
using a
CD146 marker. Biophysical probing of individual cells in a microfluidic
biochip described
herein necessitates accurate control, measurement, and estimation of flow
velocities in close
vicinity to the adhered cells. These measured and estimated values allow
theoretical
calculations about flow in the microfluidic channels. Validation of the
accuracy of these
predicted flow velocities in comparison with measured local flow velocities
may be
performed through particle image tracking around the adhered cells and using
the non-
adhered flowing cells as free flowing particles with which to measure the
local flow
velocities.
[00115] In another example, the microfluidic device described herein can be
configured
to receive synovial fluid samples from a subject and capture and quantify WBC
subpopulations in order to diagnose a condition and/or disease in the subject.
[00116] As shown in Fig. 3, a microfluidic device formed as a synovial chip
100 is
constructed similar to the microfluidic device described above. The synovial
chip is designed
for simultaneous isolation and analysis of multiple specific WBC
subpopulations found in
synovial fluid. Consequently, components in the synovial chip 100 similar to
the components
in the microchannel biochip 10 are given reference numbers 100 greater than
the
corresponding reference number related to the biochip. The microchannels of
the synovial
chip 100 are provided with an antibody as the capturing agent and receive
synovial fluid
containing cells of interest, which the antibodies capture. More specifically,
the synovial chip
100 allows for the capture of WBC subpopulations from synovial fluid samples
120 in
serially connected microchannels 114a-114c via functionalized antibodies
specific to each
CA 03056414 2019-09-12
WO 2018/170412
PCT/US2018/022888
-22-
targeted cell type. The antibody solution can include at least one of anti-
human CD4+, CD8+,
and CD66b+. The synovial fluid can be diluted with a hyaluronidase enzyme.
[00117] Prior to synovial fluid sample processing, the inlets and outlets
118, 120 can be
connected in series via biomedical grade silicon tubing 160 and 162,
respectively. This serial
connection allows a single sample 120 to enter the synovial chip 100 at a
single location (as
indicated by the right arrow in Fig. 3) and individually pass through all
three microchannels
114a-114c in a back-and-forth manner before exiting the synovial chip (as
indicated by the
left arrow in Fig. 3). Different targeted WBCs within the sample 120 can be
captured within
each successive microchannel 114 in the series.
[00118] Normal (healthy) synovial fluid contains very few cells. In the
case of a joint
disease, however, such as arthritis and prosthetic knee infection, cell
numbers have shown to
increase ¨ especially WBC subpopulations. With musculoskeletal diseases
contributing
substantially to healthcare costs that are already rising at an unsustainable
rate, the need for
diagnostic improvement in the field of orthopedics is very apparent.
[00119] Research pertaining to normal and diseased states in synovial fluid
are
emerging. For example, CD4+ T-cell-derived microparticles have recently been
proposed as
markers of rheumatoid arthritis in native joints. Likewise, percentages of
CD4+ and CD8+ T
cells have been correlated with disease activity in rheumatoid arthritis. The
expression of
synovial neutrophil surface proteins, including CD66 family, have been shown
to increase in
inflammatory arthropath. Interestingly, CD4+ T-cell phenotypes derived from
synovial fluid
of failed metal on metal total hip arthroplasties differs from normal
expression in peripheral
blood. These findings suggest that WBC expression and differentiation in
synovial fluid
could be used to detect prosthetic malfunction in prosthetic joints.
[00120] CD8+ T cells have been demonstrated in response to infection in
native joints.
The current 5-part WBC differential used in the clinic detects general numbers
of neutrophils,
lymphocytes, monocytes, eosinophils, and basophils with no indication of
specific
phenotypes and was initially intended for analysis of peripheral blood counts.
The studies
included herein describe how WBC surface markers are detected in the synovial
fluid of
native and prosthetic joints and analyzed on a microfluidic lab-on-a-chip
platform. Normal
counts and distributions of these ratios in normal and diseased states still
remain to be
clarified.
CA 03056414 2019-09-12
WO 2018/170412
PCT/US2018/022888
-23-
[00121] Currently, hospital on-site testing of synovial fluid is limited to
traditional
methods such as gram stain/culture, cell count/differential, and crystal
examination. The
down side of these tests are low accuracy with gram stains, long duration of
cultures,
variations in cell counts among disease states, borderline values of cell
counts, and lack of
sensitivity in crystal examination. While current studies are valuable, they
also lack the
instantaneous point-of-care results that would be extremely valuable in
critical disease states
such as infection or inflammatory disease.
EXAMPLES
Example 1
[00122] This example describes a microfluidic device having a
functionalized
microchannel that can be used to isolate and analyze RBCs.
Microfluidic Biochip Fabrication
[00123] The microfluidic device was constructed as shown in Figs. 1A and
1B. PMMA
cover layers were prepared by cutting an inlet and outlet port (0.61 mm in
diameter and 26
mm apart) using a VersaLASER system (Universal Laser Systems Inc., Scottsdale,
AZ).
Double sided adhesive (DSA) film (iTapestore, Scotch Plains, NJ) acted as the
intermediate
layer and was cut to fit the size of the PMMA part. 28x4 mm microchannels 50
pin deep
were formed along the length of the DSA. DSA was then attached to the PMMA
cover layer
to position the inlet and outlet ports between the DSA film outline. A Gold
Seal glass slide
acted as the base layer and was assembled with the PMMA¨DSA structure to form
a biochip
having a microfluidic channel.
Surface Chemistry
[00124] GMBS stock solution was prepared by solving 25 mg of GMBS in 0.25
mL
DMSO. The stock solution was diluted with ethanol to obtain 0.28% v/v GMBS
working
solution. FN was diluted with PBS to create a (1:10) FN working solution. BSA
solution was
prepared by solving 3 mg of lyophilized BSA in 1 mL PBS.
[00125] The microchannels were washed with 30 pL of PBS and ethanol after
assembly.
Next, 20 pL of cross-linker agent GMBS working solution was injected into the
microchannels twice and incubated for 15 min at room temperature. Following
GMBS
incubation, the microchannels were washed twice with 30 pL of ethanol and PBS.
Next, 20
CA 03056414 2019-09-12
WO 2018/170412
PCT/US2018/022888
-24-
pL of FN solution was injected into the microchannels and incubated for 1.5
hours at room
temperature. The surface was then passivated by injecting 30 pL of BSA
solution incubated
overnight at 4 C, thereby forming a FN functionalized glass surface. The
microchannels were
rinsed with PBS before processing blood samples.
Blood Processing
[00126] Discarded, de-identified patient blood samples were obtained from
University
Hospital's Hematology and Oncology Division under institutional review board
(IRB)
approval. Blood samples were collected into EDTA-containing purple cap
Vacutainer tubes.
Before being used in experiments, the blood samples were aliquoted into sealed
microtubes
and sealed syringes to minimize exposure to ambient air. Blood flow through
the
microchannels and following FCSB flow steps were applied using New Era NE-300
syringe
pump system (Farmingdale, NY). Blood samples were kept sealed and upright in 1
mL
disposable syringes before and during injection into the microchannels. The
blood was then
introduced into the microchannels at 28.5 pL/min until the channel was filled.
15 pL of blood
sample was then injected at a flow rate of 2.85 pL/min. Next, the syringe was
changed and
120 pL of FCSB at a flow rate of 10 pL/min was introduced into the
microchannel to remove
the non-adhered cells.
Microfluidic Channel Visualization and Image Processing
[00127] A fluorescent microscopy camera (EXi Blue EXI-BLU-R-F-M-14-C) and
an
Olympus IX83 inverted, fluorescent motorized microscope with Olympus Cell
Sense live-cell
imaging and analysis software were used to obtain real-time microscopic
recordings in this
study. Olympus (20x/0.45 ph2 and 40x/0.75 ph3) long working distance objective
lenses
were utilized for phase contrast imaging of single RBCs adhered in the
microchannels (see
Fig. 4A). During real-time microscope imaging and high resolution video
recording at 7 fps
rate, controlled fluid flow with stepwise increments was applied until RBC
detachment from
the microchannel surface was observed. Videos were converted to single frame
images for
further processing and analysis. The cell dimensions were analyzed by using
Adobe
Photoshop software (San Jose, CA).
[00128] Fig. 4B is a diagrammatic depiction of flowing and adhered RBCs on
a FN
functionalized surface in the presence of 3D laminar flow velocity profile in
the microfluidic
CA 03056414 2019-09-12
WO 2018/170412
PCT/US2018/022888
-25-
biochip. The resulting data showed an adhesion of a morphologically
heterogeneous RBC
population in blood samples from subjects with HbS (Fig. 4C). This adhesion
was not
observed when testing HbA blood samples (data not shown). Adhered RBCs
included mildly
sickled (Fig. 4C(i)), moderately sickled (Fig. 4C(ii)), and highly sickled
(Fig. 4C(iii)) cell
morphologies within the same field from a single HbS-containing blood sample.
The scale
bar represents 5 pm length
[00129] Adhered RBCs were analyzed in terms of biophysical properties in
flow in the
recorded images (Fig. 5A at 1.5 ms camera exposure time) to determine local
flow velocities.
Healthy and sickle RBCs at no flow, flow, and detachment conditions are shown
in Fig. 5B.
Flow velocities that resulted in detachment of RBCs in different experimental
groups are
noted below each column. White dashed lines denote the initial positions of
RBCs at no flow
condition. Scale bar represents 5 pm length.
[00130] The aspect ratio (AR) of cells in each frame is provided at the
lower left of the
images. When free flowing RBCs were imaged at relatively long camera exposure
times, they
appeared as straight lines due to motion blur (Fig. 5A) ¨ also known as
streaking. The streak
length was proportional to the flowing particle velocity. Local flow
velocities (Vp) for
flowing cells were determined by using Equation 1:
Vp = (Li, - dp)/tp (1)
where Lp is the streaking line length, dp is the average cell size, and tp is
the
camera exposure duration. Then, a correlation was analyzed between the
measured local flow
velocity and the predicted mean flow velocity (v.) determined by the
volumetric flow rate
(Q) and the dimensions of the microchannels (width: wc, and height: k) using
Equation 2:
v. = Q/( x (2)
[00131] The data show in Fig. 6B that measured local flow velocities
display a
significant correlation with the predicted flow velocities (Pearson
correlation coefficient of
0.94, p<0.001, n=9, R2=0.88). Hence, a mean theoretical flow velocity was used
in
determining the shear stress (Fig. 6C) and drag force levels (Fig. 6D) for
detachment of HbA
and HbS-containing RBCs.
[00132] The relative positions of adhered RBCs and flow velocities were
also
determined for the adhered RBCs. Adhered RBCs were positioned in the mid-
region of the
CA 03056414 2019-09-12
WO 2018/170412 PCT/US2018/022888
-26-
microchannels where the flow velocity was uniform across the channel. The data
show: i) up
to 4.3 times greater flow velocity (Fig. 6A); ii) 4.3 times greater shear
stress (Fig. 6C); and
iii) 4.1 times greater drag force (Fig. 6D) was required to detach non-
deformable HbS-
containing RBCs as compared to HbS-containing deformable RBCs (p<0.05, one way
ANOVA with Fisher's post-hoc test).
[00133] In contrast, HbA-containing RBCs and deformable HbS-containing RBCs
did
not differ in terms of flow velocity, shear stress, and drag force at
detachment (p<0.05, one
way ANOVA with Fisher's post-hoc test). These results confirm that HbS-
containing RBCs
are heterogeneous in terms of their adhesion strength to FN.
[00134] Referring to Figs. 7A-7L, the motion of adhered RBCs at flow
initiation was
evaluated using consecutive high resolution microscopic images taken over 0.28
seconds in
order to analyze sites of adhesion in HbA, HbS deformable, and HbS non-
deformable RBCs.
Outlines of individual RBCs in three consecutive frames taken over 0.28
seconds were
projected to reflect the motion of the cells in response to the initiation of
fluid flow for: HbA-
containing RBCs (Figs. 7A-7D); HbS-containing deformable RBCs (Figs. 7E-7H);
and HbS-
containing non-deformable RBCs (Figs. 71-7L).
[00135] The data demonstrated that HbA and HbS deformable cells displayed
rotational
motion in response to fluid flow direction, indicating a single adhesion pivot
point (see Figs.
7D and 7H). On the other hand, HbS non-deformable cells did not display a
rotational motion
in response to fluid flow direction, implying multiple adhesion sites (see
Fig. 7L).
Importantly, these observations suggested that the higher adhesion strength of
HbS non-
deformable cells may be due to a greater number of adhesion sites.
Data Analysis
[00136] The flow velocity of the adhered RBCs was calculated using
Equations 3 and 4
describing pressure-driven flow in a rectangular channel:
Eta, (3.3 2;') = _______________________ cos- cos; ¨)
2o
(
- 2 n=1 3 _______________ 3),5¨ fc:st'2t 112
4 3 12h
Q = ¨w a. ,
t-anh w =i)
7.5 = 3,5_ P' ,1/4
CA 03056414 2019-09-12
WO 2018/170412
PCT/US2018/022888
-27-
where x, y and z are the principal axes, h and w are the microchannel height
and
width, n is the fluid viscosity dp/dx is the pressure change along the x axis,
and Q is the
volumetric flow rate (see Table 1).
Table 1
Value
Measured RBC Width 4.47-8 (uM)
HBA 6.73-8 (uM)
HbS deformable 4.8-7.84 um
HbS non-deformable 4.47-7.36 um
RBC Thickness 2.25 um
Microchannel Heights 50 um
Microchannel Width 4 mm
Buffer Density 993 Kg/m3
Buffer Viscosity 0.001 Pa-d
[00137] The shear stress (7) on the adhesion surface is calculated using
Equation 5:
T = 6nQ/wh2 (5)
Results of these calculations are shown in Fig. 6B.
[00138] The drag force applied TO the adhered RBCs was calculated using
Equation 6:
,
= CdA
(6)
where Fd is the drag force, p is the fluid density, Cd is the drag
coefficient, and
A is the reference area. Cd is calculated as 13.6/Re, where Re is the Reynolds
number,
according to the circular disk parallel to flow assumption of cells at low
Reynolds number
flow. Reference area A was calculated by using the typical RBC thickness and
the measured
RBC width at detachment. The results of these calculations are shown in Fig.
6C.
Statistical Analysis
[00139] The cell AR change with respect to no flow condition was used as a
measure of
deformability, in which a greater change in cell AR translated to more
deformability and
CA 03056414 2019-09-12
WO 2018/170412
PCT/US2018/022888
-28-
hence, less stiffness. Flow velocities were increased in a step-wise manner.
Cell
deformability for each RBC was assessed at a maximal flow velocity just prior
to detachment
from the microchannel in a time-lapse experiment. This analysis provided a
maximum
deformation estimate of an adhered cell.
[00140] Referring to Figs. 8A-8B, HbA-containing RBCs at no-flow show
significantly
greater cell aspect ratios, e.g., circularity, than HbS-containing RBCs
(p<0.05). The AR of
HbA RBCs continuously decreased in the presence of flow (p<0.05), which
implied higher
deformability. HbS non-deformable cells conserved their initial AR from no
flow all the way
through detachment (p<0.05).
[00141] The HbS deformable RBCs displayed a significantly greater cell AR
at no-flow
and significantly greater deformability at detachment compared with HbS non-
deformable
RBCs (p<0.05). The deformability of HbA-containing RBCs was significantly
greater than
HbS-containing RBCs in all flow conditions (p<0.05). The deformability of both
HbA and
HbS-containing deformable RBCs was significantly different when measured
during flow
and when measured at detachment (p<0.05). However, under these same
conditions, HbS
nondeformable RBCs did not display any significant difference in deformability
during this
interval (p<0.05). While adhered to the FN-functionalized surface that
mimicked features of
the normal blood stream in SCD, HbS-containing RBCs were heterogeneous in AR
and in
deformability (Fig. 8C).
[00142] Data obtained in this study was reported as mean standard error
of the mean.
Flow rate (Fig. 6A), shear stress (Fig. 6B), drag forces (Fig. 6C), cell
aspect ratio (Fig. 8A),
and aspect ratio change (deformability) (Fig. 8B), were statistically assessed
(Minitab 16
software, Minitab Inc., State College, PA) using Analysis of Variance (ANOVA)
with
Fisher's post hoc test for multiple comparisons (n=3-6 blood samples per
group). Statistical
significance was set at 95% confidence level for all tests (p<0.05). Error
bars in figures
represent the standard error of the mean.
Comparison with LN Functionalized Microchannels
[00143] In another biochip construction, the microfluidic channels were
composed of a
glass surface functionalized with LN, a PMMA layer, and sandwiched 50 um thick
DSA tape
that defined the height and shape of the microchannels. LN is sub-endothelial
and binds to an
important RBC surface protein from the immunoglobulin superfamily, BCAM/LU,
which is
CA 03056414 2019-09-12
WO 2018/170412
PCT/US2018/022888
-29-
phosphorylated during beta-adrenergic stimulation. The FN and LN-coated
microchannels
from the respective biochip constructions were each imaged and compared to one
another
following cell adhesion testing.
[00144] The number of adhered RBCs was quantified inside the FN or LN
immobilized
microfluidic channels. We observed abnormal adhesion of RBCs in blood samples
from
subjects with SCD. On the other hand, adhesion of RBCs in blood samples from
normal
subjects was negligible (not shown). High resolution phase-contrast images of
an FN and LN
coated microchannel surface inside the SCD-Biochip revealed heterogeneous
sickle
morphologies of adhered RBCs. A range of RBC adhesion was observed in patients
with
various clinical phenotypes.
Data Clustering
[00145] Figs. 9A-9B are high resolution images of the microchannels
functionalized
with FN and LN, respectively. The relationship between the individual
components of the
complete blood count and the number of adhered RBCs was analyzed using K-means
clustering method. The patients with HbSS were clustered into two groups using
K-means
and the resultant groups were evaluated for differences in disease severity.
Single
components of complete blood counts as well as multiple components were used
in K-means
clustering to identify the two sub-groups.
[00146] Once the sub-groups were identified, the difference between the
numbers of
adhered RBCs between these groups was tested for statistical significance
using one way
ANOVA test. The testing level (alpha) were set as 0.05 (two-sided). The K-
means clustering
was performed using Matlab (The MathWorks, Inc, Natick, MA).
[00147] 2 =
We analyzed the number of adhered RBCs per unit area (32 mm ) FN and LN
functionalized microchannels in blood samples from subjects with HbAA,
compound
heterozygous HbSC or HbSr3+-thalassemia (HbSC/513+) or homozygous HbSS, using
high
resolution images from microfluidic channels (see Figs. 9A-9B). Among blood
samples with
different hemoglobin phenotypes, the number of adhered RBCs was significantly
higher in
HbSS > HbSC/513+ > HbAA blood samples in FN (P=0.023 and P=0.002 in Fig. 9C,
respectively) and LN (P=0.024 and P=0.011 in Fig. 9D, respectively).
Furthermore,
HbSC/513+ blood samples displayed a significantly higher number of adhered
RBCs than
HbAA blood samples in both FN (P=0.002) and LN (P=0.027) functionalized
microchannels.
CA 03056414 2019-09-12
WO 2018/170412
PCT/US2018/022888
-30-
[00148] Next, we plotted receiver operating-characteristic (ROC) curves to
assess the
SCD-biochip's ability to accurately determine hemoglobin phenotypes through
adhesion (see
Figs. 9E-9F). For selected thresholds of adhered RBC numbers, we observed a
0.93 true-
positive rate and 0.00 false-positive rate for differentiating between HbSS
and HbAA
phenotypes. The area under the curve for differentiating between HbSS and HbAA
was more
than 0.85 both for FN and LN. These results demonstrated the ability of the
SCD biochip to
discriminate amongst hemoglobin phenotypes through cellular adhesion. These
data may
further support the role that abnormal cellular adhesion plays in accounting
for SCD
phenotypes, in which HbSS is more hemolytic and HbSC less so.
[00149] In addition to the area under the curve, sensitivity, specificity,
positive and
negative likelihood ratios, and positive and negative predictive values were
calculated as
follows: Sensitivity was calculated as # true positives / (# true positives +
# false negatives),
specificity as # true negatives / (# true negatives + # false positives).
Positive likelihood ratio
was defined as sensitivity / (1-specificity). Negative likelihood ratio was (1-
sensitivity) /
specificity. Positive predictive value was # true positives / (# true
positives + # false
positives), and negative predictive value was # true negatives / (# true
negatives + # false
negatives).
Statistical Analysis
[00150] Because of the ameliorative role of HbF in SCD, we investigated RBC
adhesion
in HbSS blood samples with low (<8%) and high (>8%) HbF levels. When compared,
the
number of adhered RBCs was significantly higher in blood samples from subjects
with low
HbF than high HbF levels in both FN (P=0.015, Fig. 10A) and LN (P=0.022, Fig.
10B)
functionalized microchannels. These findings established the base ground for
the SCD
biochip as an in vitro adhesion assay for functional phenotypes of SCD as well
as the impact
on these phenotypes of novel therapies.
[00151] ROC curves displayed a true-positive rate (sensitivity) and a false-
positive rate
(1-specificity) for differentiation between SS-AA, SC-AA, and SS-SC hemoglobin
phenotypes based on the adhesion of RBCs on FN- and LN-functionalized
microchannels.
Defined thresholds for adhered RBC numbers on the ROC are as shown (0=9, o=9,
and 0=30
for FN; 0=16, o=16, and 0=170 for LN). The ROC were strongest in
discriminating between
AA and SS or SC, compared with discrimination between SS and SC.
CA 03056414 2019-09-12
WO 2018/170412
PCT/US2018/022888
-31-
[00152] We utilized
K-means clustering analysis to identify sub-groups among HbSS
patients based on single components of the standard of care blood test results
and hemoglobin
testing results. As shown in Figs. 11A-11H, we analyzed RBC adhesion to FN and
LN
functionalized microchannels in HbSS blood samples from patients with various
clinical
phenotypes, including high and low lactate dehydrogenase (LDH), platelet
counts (pits), and
retics (retics). Samples from recently transfused subjects are shown with
triangle markers.
RBCs in blood samples from patients with high pits (>320 109/L) showed
significantly higher
adhesion to FN functionalized microchannels (P=0.046) than patients with low
pits (<320
109/L) (Fig. 11A). We observed a significantly higher number of adhered RBCs
to both FN
(P=0.0003) and LN (P=0.003) functionalized microchannels in blood samples from
patients
with high LDH levels (>500 u/L) compared to patients with low LDH levels (<500
u/l) (Figs.
11B and 11C).
[00153] We also
observed significantly higher RBC adhesion to LN functionalized
microchannels (P=0.014) in blood samples from patients with high retics (>320
109/L)
compared to patients with low retics (<320 109/L) (Fig. 11D). Levels of HbS
varied due to
recent transfusions (HbA >= 10%) or due to increased levels of HbF. High
levels of HbS
were associated with increased LDH levels (group 1 relative to group 2, Fig.
11E). RBC
adherence to FN was significantly greater in blood samples with higher LDH and
higher HbS
levels (group 1 compared with group 2, Fig. 11F).
[00154] High levels
of LDH were associated with elevated retics (group 1 relative to
group 2, Fig. 11G). In univariate models, we observed significantly greater
adhesion to LN in
HbSS blood samples with higher LDH and higher retics (group 1 compared to
group 2, Fig.
11H), independent of HbS.
[00155] These results show clinical associations between RBC adhesion to FN
or LN
and LDH, platelet counts or retics. Nonetheless, heterogeneity was present in
all analyses, for
example, low adhesion in some patients with a high LDH or elevated retics.
This was also
seen in a subset of chronically transfused patients. The converse was less
ambiguous, for
example, low adhesion was present in most patients with a low LDH.
[00156] We also
analyzed the heterogeneity of adhered RBCs in FN functionalized
microchannels. The morphology and number of adhered RBCs in HbSS blood samples
were
quantified after controlled detachment of cells at step-wise increased flow
velocities of
0.8 mm/s, 3.3 mm/s, and 41.7 mm/s (Figs. 12A-12C). Based on morphological
CA 03056414 2019-09-12
WO 2018/170412
PCT/US2018/022888
-32-
characterization, adhered RBCs were categorized as deformable (biconcave shape
shown in
Fig. 12D) and non-deformable (without biconcave shape shown in Fig. 12E) RBCs.
The scale
bars represent a length of 5 um.
[00157] Referring to Fig. 12F, the percentages of deformable and non-
deformable
RBCs of total adhered RBCs at 0.8 mm/s flow velocity were calculated.
Deformable and non-
deformable RBC percentages were not significantly different at 0.8 mm/s
(P=0.266). On the
other hand, the percentage of non-deformable RBCs was significantly higher
than the
percentage of non-deformable RBCs at 41.7 mm/s (P=0.047). A statistically
significant
correlation was observed between the percentage of adhered non-deformable RBCs
and LDH
at 0.8 mm/s (Pearson correlation coefficient of 0.79, n=21 samples). Moreover,
the
percentage of deformable RBCs was significantly lower at 3.3 mm/s and 41.7
mm/s
compared to 0.8 mm/s (P=0.001 and P<0.001, respectively). Also, the percentage
of
deformable RBCs was significantly lower at 41.7 mm/s than 3.3 mm/s (P<0.001).
[00158] However, the only significant difference in the percentage of non-
deformable
RBCs were observed between 0.8 mm/s and 41.7 mm/s (P=0.003). Furthermore, we
observed
a significant association between adhered non-deformable RBCs (%) and serum
LDH levels
in our subjects (Pearson correlation coefficient of 0.74, p<0.0001 in Fig.
12G). These results
indicated a morphological and qualitative heterogeneity in adhered RBCs and an
association
between hemolysis and adherent non-deformable RBCs.
[00159] In this example, we identified a unique adherent nondeformable RBC
population, significantly correlated with serum LDH levels, which reflects a
functional
outcome in terms of both deformability and adhesion of RBCs and is a
pathophysiologically
plausible source for active hemolysis in SCD.
[00160] The new SCD biochip platform, introduced here, has the potential to
informatively interrogate leukocyte adhesion, leukocyte activation, and RBC
adhesion to
other endothelial surface proteins, which we will incorporate in future
studies.
Example 2
[00161] In this example, we designed and tested a disposable microfluidic
device to
capture and quantify three WBC subpopulations (CD4+, CD8+, and CD66b+ cells)
simultaneously from synovial fluid aspirates. To this end, WBCs in a synovial
fluid sample
were isolated and analyzed by a microfluidic device.
CA 03056414 2019-09-12
WO 2018/170412
PCT/US2018/022888
-33-
Methods
Synovial chip fabrication
[00162] The synovial chip was constructed as shown in Fig. 3. The synovial
chip was
assembled using a glass slide 130 (adhesion coating: APTES, 3-Aminopropyl
Triethoxysilane, Electron Microscopy Sciences, Hatfield, PA), a 50 pm thick
DSA film 140
(iTapestore, Scotch Plains, NJ) with three channel 114a-114c cut outs defining
the channel
shape and height/depth, and a biomedical grade PMMA substrate 150 encompassing
inlets
and outlets 118, 122. Channel cut outs in the DSA 140 along with inlets and
outlets 118, 122
in the PMMA substrates 150 were fabricated using VersaLaser CO2 laser
micromachining
system (Universal Laser Systems Inc., Scottsdale, AZ). Microchannels 114a-114c
were
assembled by sandwiching the DSA film 140 between the slide 130 and the PMMA
substrate
150, creating three microchannels of 10 pL volume.
Surface chemistry
[00163] The cell adhesion surfaces 116 of each microchannel 114a-114c was
functionalized with antibodies against specific cell membrane antigens for
isolating of WBC
subpopulations. After assembly, the microchannels 114a-114c were flushed with
PBS
followed by ethanol and incubated with N-gamma-Maleimidobutyryl-oxysuccinimide
ester
(GMBS, 0.28% v/v in ethanol) for 15 minutes at room temperature. Incubation is
desirable to
make sure sufficient electrostatic interaction has occurred between negatively
charged
residues of GMBS molecule and positively charged APTES coating of glass
slides.
[00164] The microchannels 114a-114c were flushed again with ethanol and PBS
in order
to remove any remaining GMBS solution not adhered to the cell adhesion
surfaces 116.
Following PBS, 20 4, of NeutrAvidin (1 mg/mL in PBS) solution was injected
into each
microchannel 114a-114c and incubated overnight at 4 C. Overnight incubation is
desirable to
make sure that covalent interactions between GMBS and NeutrAvidin occur,
allowing GMBS
to serve as an anchor for NeutrAvidin to the cell adhesion surfaces 116.
Following
incubation, the microchannels 114a-114c were flushed with PBS in order to
remove any
remaining non-bound NeutrAvidin.
[00165] In order to functionalize each cell adhesion surface 116 for
isolation of specific
WBC subpopulations from the synovial fluid, biotinylated anti-human CD4+ (i),
CD8+ (ii),
and CD66b+ (iii) antibody solutions were injected into different microchannels
114a-114c
CA 03056414 2019-09-12
WO 2018/170412
PCT/US2018/022888
-34-
and incubated for 1 hour at 4 C. The microchannels 114a-114c were then washed
with PBS
once more to clear any non-bound antibody.
Synovial Fluid Processing and Data collection
[00166] 19 synovial fluid aspirates were obtained from 17 anonymous patient
donors
from the Louis Stokes Veterans Affairs Medical Center in Cleveland, Ohio or
from an
outside source (Anatomy Gift Registry Inc., Hanover, MD) under IRB approval.
The
samples underwent aspiration to rule out infection of prosthetic knee joints.
All of the
subjects had negative cultures and none of them went on to develop
periprosthetic infections.
Blood samples of healthy donors were obtained from Research Blood Components
(Boston,
MA) under IRB approval. Samples were collected in Ethylenediaminetetraacetic
acid
(EDTA)-coated vacutainer tubes.
[00167] The synovial fluid aspirates were spiked with blood in order to
inoculate
aspirates with WBCs to obtain clinically relevant cell concentrations to
simulate diseased
conditions. This approach also allowed the robustness of the synovial chip 100
to be
evaluated for clinical cases where hemorrhaging may be present in the joint,
which populates
synovial fluid with an excess of RBCs.
[00168] Synovial fluid samples 120 were either diluted with PBS or treated
with
lyophilized hyaluronidase enzymatic powder (Sigma-Aldrich, St Louis, MO) in
order to
reduce viscosity. Lyophilized hyaluronidase enzyme powder was dissolved into
synovial
fluid samples at a concentration of 0.5 mg/mL, vortexed, and incubated for 15
minutes at
room temperature.
[00169] Afterwards, samples 120 were loaded into 1 mL disposable syringes
and
connected to the inlet tubing of the synovial chip 100. Synovial fluid samples
120 of 100 pL
were injected into the microchannels 114a-114c via the tubing 160, 162 using a
New Era NE-
1000 syringe pump system at 10 pL/min. The microchannels 114a-114c were then
washed
with 200 pL PBS at 10 pL/min to remove non-captured cells. Following the PBS
wash,
fluorescent anti-human CD4+, CD8+, and CD66b+ antibody solutions were injected
into
microchannels 114a-114c for fluorescent labeling of captured WBC
subpopulations.
[00170] Referring to Figs. 13A-13D, phase contrast and fluorescent images
of the
microchannels 114a-114c with captured WBC subpopulations were obtained via an
automated, inverted, fluorescent microscope (Olympus IX83, Tokyo, Japan).
Microscope
CA 03056414 2019-09-12
WO 2018/170412
PCT/US2018/022888
-35-
images were acquired using an Olympus long working distance objective lens
(20x,
numerical aperture, NA=0.45). Viscosity of both plain synovial fluid and then
enzyme treated
synovial fluid (1 cm3) were measured using a rotational viscometer (MCR501,
Anton Paar,
Ostfildem, Germany).
[00171] 2 i The number of captured
WBCs per unit area (22 mm ) n cell adhesion surfaces
116 functionalized with CD4+ (Fig. 13B), CD8+ (Fig. 13C), and CD66b+ (Fig.
13D)
antibodies were quantified using high resolution phase contrast images of the
microchannels
114a-114c. Food coloring was mixed into the synovial fluid sample 120 for
visualization.
Scale bars in Figs. 13B-13D and insets represent lengths of 50 um and 10 um,
respectively.
Flow Cytometry Analysis
[00172] Synovial fluid samples 120 processed in the synovial chip 100 were
analyzed in
parallel with flow cytometry to evaluate efficiency of the developed
microfluidic platform.
Synovial samples 120 were fluorescently labeled for CD4+, CD8+, and CD66b+
WBCs
using the same fluorescent antibodies described above for on-chip staining of
the same cell
subtypes. Flow cytometry was carried out using a Guava EasyCyte Flow Cytometer
(Merck
Millipore, Billerica, MA) at Case Comprehensive Cancer Research Center at Case
Western
Reserve University.
Data Analysis and Statistics
[00173] Acquired phase contrast and fluorescent images were processed using
Adobe
Photoshop (San Jose, CA) to quantify the number of captured WBCs in each
microchannel
114a-114c. Phase and fluorescent microscopy images were compared to calculate
cell
capture specificity. The rest of the data analyses was performed based on cell
counts
obtained from phase contrast images of the microchannels 114a-114c. Data
obtained in this
study was reported as mean standard error of the mean. Capture efficiency in
the synovial
chip 100 for samples 120 diluted with PBS and treated with hyaluronidase
enzyme were
statistically compared (Minitab 16 software, Minitab Inc., State College, PA)
using ANOVA.
All regression analyses were performed in Minitab 16 software. Statistical
significance was
set at 95% confidence level (p< 0.05) for all tests.
CA 03056414 2019-09-12
WO 2018/170412
PCT/US2018/022888
-36-
Results
[00174] We assessed capture specificity of the synovial chip 100 by
comparing phase
contrast (all captured cells shown in Fig. 14A) and fluorescent images (cells
labeled for a
certain subpopulation shown in Fig. 14B) of microchannels 114a-114c after
processing
synovial fluid samples 120. The CD8+ cells were captured on cell adhesion
surfaces 116 via
immobilized anti-CD8+ antibodies. The capture specificity of the CD8+ cells
was assessed
by staining captured cells in microchannels 114a-114c with FITC conjugated
CD8+
antibodies. The specificity was determined based on cell counts in phase
contrast and
fluorescent images of the sampling area. The presence of RBCs in synovial
aspirates did not
interfere with the capture and quantification of target WBC subpopulations. We
observed a
capture specificity of around 90% for CD4+, CD8+, and CD66b+ WBCs captured
from
synovial fluid samples (Fig. 14C). Error bars indicate a standard error of the
mean.
Effect of Synovial Fluid Viscosity on Capture Efficiency
[00175] Synovial fluid is known to have high viscosity caused by high
hyaluronic acid
content. This may pose challenges for microfluidic processing due to high
shear stresses and
high pressure drops in microchannels. Shear stress on microchannel surfaces
affects cell
capture efficiency when processing bodily fluids, such as blood. Furthermore,
high viscosity
adds practical difficulties in terms of handling and loading the synovial
samples into syringes.
To overcome the challenge of processing high viscosity synovial aspirates in
microchannels,
we tested diluting synovial samples 120 with PBS and by treating synovial
samples with
hyaluronidase enzyme.
[00176] The dilution of synovial fluid with PBS can reduce shear stress on
the channel
surfaces and, thus, improve CD8+ cell capture efficiency. We diluted synovial
aspirates with
PBS at ratios from 1:2 to 1:10 (Figs. 15A-15C), and observed a statistically
significant
correlation (R2=0.92, p<0.05) between the dilution ratio and CD8+ WBC capture
efficiency,
assessed in comparison to cell capture from whole blood (Fig. 15D). Even
though the cell
capture efficiency was significantly improved (>30%) with increased PBS
dilution, it
saturated over a dilution ratio of 1:8.
[00177] This approach also caused an increase in sample volumes to be
processed in the
order of the corresponding dilution rate. Such increase in the sample volume
caused a
dramatic increase in sample processing time, which could limit the feasibility
of the system at
CA 03056414 2019-09-12
WO 2018/170412
PCT/US2018/022888
-37-
the POC. In order to improve sample processing time, we analyzed cell capture
efficiency for
1:10 diluted synovial fluid samples processed at different flow rates, namely,
10 uL (Fig.
16A) and 20 uL/min (Fig. 16B). However, there was no statistically significant
correlation
between cell capture efficiency, assessed in comparison to cell capture from
whole blood, and
synovial sample processing flow rates (PCC = 0.23, p<0.05, Fig. 16C).
[00178] To overcome these shortcomings, we utilized hyaluronidase enzyme
(0.5
mg/mL, Sigma Aldrich) to digest hyaluronic acid content in synovial fluid,
thereby
decreasing the viscosity of the synovial fluid samples. Hyaluronic acid is one
of the main
components contributing to the high viscosity that is observed in synovial
fluid.
Hyaluronidase enzyme has been commonly used to digest hyaluronic acid and has
shown to
improve performance of cellular, protein, and crystal analyses.
[00179] We measured the viscosity of both hyaluronidase enzyme treated and
plain
synovial fluid using a rheometer. CD8+ WBC capture after processing a synovial
fluid
sample diluted 1:10 with PBS (Fig. 17A) and mixed with hyaluronidase enzyme
(Figs. 17B).
Hyaluronidase enzyme treatment decreased the viscosity of synovial fluid
dramatically, more
than 15 fold at 0.1 s-1 and 60 fold at 1 s-1 shear rate (Fig. 17C). The
increase in the number of
captured cells suggests that enzymatic degradation of hyaluronic acid does not
damage cell
surface antigens that are necessary for capture. Furthermore, the downward
slope of the plain
synovial fluid line with increasing shear rate indicates Non-Newtonian
behavior of synovial
fluid.
[00180] Overall, hyaluronidase enzyme treatment significantly improved cell
capture
efficiency, assessed in comparison to cell capture from whole blood, to over
60% (more than
3-fold increase) compared to samples diluted with PBS (Fig. 17D, one-way ANOVA
test
p<0.05, n=3), which also decreased the processing time by 10-fold in the
synovial chip 100.
Microfluidic Processing
[00181] We correlated the number of captured CD4+, CD8+, and CD66b+ cells
in the
synovial chip 100 with FACS cell counts for these same cell types and also
total cytometer
WBC counts. The number of captured cells in the synovial chip 100 showed
statistically
significant correlation with total cytometer WBC counts (Fig. 18A, Pearson
correlation
coefficient, PCC=0.76, p=0.001, Spearman's rho, rs=0.46, n=15), FACS counts
for CD4+
CA 03056414 2019-09-12
WO 2018/170412
PCT/US2018/022888
-38-
(Fig. 18B, PCC=0.74, p<0.001, rs=0.78, n=19), CD8+ counts (Fig. 18C, PCC=0.59,
p=0.013,
rs=0.93, n=17), and CD66b+ counts (Fig. 18D, PCC=0.71, p=0.001, rs=0.58,
n=17).
Example 3
[00182] In this study, a microfluidic system 200 (Figs. 19A-19C) having a
microfluidic
device and at least one micro-gas exchanger was used to adjust the oxygen
tension in the
blood sample prior to introduction thereof into the microchannels 14a-14c.
Blood
deoxygenated at the micro-gas exchanger during flow, sickling RBCs, and
reached the
microchannels 14a-14c with RBCs adhering to the functionalized cell adhesion
surfaces. The
micro-gas exchanger allowed for easy adaptation to portable POC microfluidic
systems.
[00183] The microfluidic device integrated with a micro-gas exchanger
described herein
allows interrogation and manipulation of biological fluid at a single-cell
level while being
clinically feasible, cost and labor efficient, and easily implementable. The
developed
microfluidic platforms eliminate the intricate microchannel design and
configuration required
in PDMS based systems by controlling the oxygen tension of the biological
fluid before it
reaches the microchannel. We utilized the microfluidic platform to analyze the
adhesion of
RBCs in blood samples of patients with SCD where oxygen tension control is
desirable.
Blood collection
[00184] Blood samples from SCD and normal subjects were attained with the
standard
laboratory procedures approved by the institutional review board (IRB). All
clinical
information such as medical history and treatment course was obtained after
the patients were
informed and consented.
[00185] Upon collection, the samples were treated with an anticoagulant,
EDTA
(Ethylenediaminetetraacetic acid), in vacutainer tubes and were stored at 4 C.
All the
experiments were performed within 24 hours of venipuncture, using whole blood
samples
without dilution. Clinical data such as hemoglobin phenotype (%), complete
blood counts
(including white blood cell (WBC) (109/L), RBC (1012/L), absolute neutrophil
count (ANC)
(106/L), and plts (109/L)) retics (109/L), and plasma LDH (IU/L) were received
from the
Adult Sickle Cell Clinic at University Hospitals Case Medical Center in
Cleveland. High-
performance liquid chromatography (HPLC) was conducted to identify the
proportion of
CA 03056414 2019-09-12
WO 2018/170412
PCT/US2018/022888
-39-
HbS, HbF, HbA, and HbA2 with the Bio-Rad Variant II Instrument (Bio-Rad,
Montreal, QC,
Canada) at the Core Laboratory of University Hospitals Case Medical Center.
[00186] For anti-BCAM blocking experiments, whole blood samples were
treated with
the antibody of basal cell adhesion molecule, a Lutheran blood group
glycoprotein (BCAM:
CD239 Antibody, Novus Biologicals), by adding BCAM antibody to the whole
blood. 50 pL
of BCAM antibody (0.5 mg/mL in PBS) was added to 300 pL of blood samples and
were
incubated at room temperature for 15 minutes.
System Preparation and Operation
[00187] The system 200 was comprised of two main components: the
microfluidic
device 10 previously described, and at least one micro-gas exchanger 210
(Figs. 19A-19C).
To mimic a blood vessel wall, the 50 pm depth microchannels 14a-14c were
functionalized
with N-g-Maleimidobutyryloxy succinimide ester (GMBS: 0.28% v/v). Endothelium
associated proteins FN (FN: 1:10 dilution with PBS, Sigma Aldrich) and LN (LN:
1:10
dilution with PBS, Sigma Aldrich) were immobilized on the cell adhesion
channel surfaces
16. After 1.5 hours of incubation at room temperature with either protein, the
microchannels
14a-14c were flushed with bovine serum albumin solution (BSA: 20 mg/mi) and
incubated
overnight at 4 C to prevent non-specific binding events.
[00188] The micro-gas exchanger 210 includes concentric inner and outer
tubes 212,
216. The inner tube 212 has a gas-permeable wall 214 defining a central
passage 215
extending the entire length of the inner tube. The outer tube 216 has a gas
impermeable wall
218 defining a central passage extending the entire length of the outer tube.
An annular space
220 is formed between the tubes 212, 216. The central passage 215 receives the
blood
sample 20 and is in fluid communication with one or more inlet ports 18 of the
microfluidic
device 10. As shown, each inlet port 18 is fluidly connected to a different
micro-gas
exchanger 210 to specifically tailor the blood delivered to each microchannel
14a-14c. An
outlet tube 240 is connected to each outlet port 22. A controlled gas flow
takes place in the
annular space 220 and blood flows inside the inner tube 212. The deoxygenation
of blood
occurs due to gas diffusion (5% CO2 and 95% N2) through the inner gas-
permeable wall 214.
[00189] To setup the micro-gas exchanger 210, medical grade gas-permeable
silicone
tubing 212 (300 pm inner diameter (ID) x 640 pm outer diameter (OD), Silastic
Silicone
Laboratory Tubing, Dow Corning) was placed inside the impermeable tubing 216
(1600 pm
CA 03056414 2019-09-12
WO 2018/170412
PCT/US2018/022888
-40-
ID x 3200 pm OD, FEP tubing, Cole-Parmer). The gas permeability of the outer
FEP tubing
216 (0.59 Barrer for CO2; 1.4 Barrer for 02) and was less than 0.2% of the
inner silicone
tubing 212 (2000 Barrer for CO2; 800 Barrer for 02) for both CO2 and 02. Due
to this
construction, the blood sample could exchange gases through the permeable
inner tubing wall
214 with 5% CO2 and 95% N2 controlled gas inside the impermeable tubing
annular space
220 by diffusion.
[00190] The silicone tubing 212 was filled with PBS (Life Technologies)
before flowing
the blood therethrough. All possible points of leakage were sealed with an
epoxy glue (5
Minute Epoxy, Devcon) to ensure there was no gas diffusion inside the
microfluidic device
10.
[00191] The blood sample 20 was injected with the syringe pump (NE300, New
Era
Pump Systems) into the system 200 at 18.5 pL/min to fill the tubing passage
215 and the
microchannels 14a-14c, and at 1.85 pL/min to impose about 1 dyn/cm2 of shear
stress while
flowing in the functionalized microchannels. After flowing 15 pL of blood
through the
microchannels 14a-14c, flow cytometry staining buffer (FCSB, 1X) was inserted
to wash the
microchannels at 10 pL/min, which imposed 1 dyn/cm2 of shear stress, making
the adhered
RBCs visible through the inverted microscope (Olympus IX83) and microscopy
camera (EXi
Blue EXI-BLU-R-F-M-14-C) for high-resolution images. At least 180 pL of FCSB
was used
to wash the microchannels 14a-14c and the images were taken during buffer
flow. For the
entire procedure, the medium flowing in each microchannel 14a-14c was
deoxygenated by a
micro-gas exchanger 210 to achieve physiological flow and hypoxic conditions.
Computational Modeling and Experimental Validation
[00192] The gas diffusion of blood during flow within the micro-gas
exchanger 210 was
modeled using COMSOL (AltaSim Technologies, Columbus, OH). Two sets of
boundary
conditions were chosen to couple laminar flow and gas diffusion through the
permeable
tubing wall 214. To approximate the diffusion coefficient of CO2 and 02 for
blood, the
kinematic viscosity of blood was first calculated to be ¨0.054 Pa= s at room
temperature,
assuming 2% increase every 1 C drop. Then the Hagen-Poiseuille equation was
used to
approximate the pressure difference (AP) along the tubing. As blood was
assumed to be
Newtonian, the simulation result was used as a baseline reference for the
experimental setup
CA 03056414 2019-09-12
WO 2018/170412
PCT/US2018/022888
-41-
(Table 2). The flow of FCSB was also computationally modeled to analyze
adequate tubing
length and flow rates for constant deoxygenation of the microenvironment.
Table 2
Parameter Value
Inner Diameter 300 um
Outer Diameter 640 um
Length 250 mm
Flow Velocity 18.5 u]/min
Pressure Difference 3.75 cmHg
Initial 02 Concentration 8.17 mol/m3
Initial CO2 Concentration 0.01 mol/m3
Controlled 02 Concentration 0 mol/m3
Controlled CO2 Concentration 2.04 mol/m3
Permeability (02) 800 Barrer
Permeability (CO2) 2000 Barrer
Viscosity at room temperature 5.4 mPa.s
Diffusion Coefficient (02) 1.6E9 m2/s
Diffusion Coefficient (CO2) 6.0E-19 m2/s
[00193] After optimizing the setup parameters, such as tubing length, flow
rate, and
pressure difference, simulation results were validated by measuring the oxygen
saturation
level of blood (Sp02) with a finger pulse oximeter (OT-99, Clinical Guard)
using a model
finger. The model finger was fabricated by stacking lasercut PMMA sheets 50
with DSA
films 40 (Figs. 20A-20B). Specific geometries were chosen to prevent bubble
formation and
maximize sensing capabilities, thereby requiring ¨300 pL of blood.
[00194] The validation experiment setup was placed at temperature and gas
concentration controlled environments to test the in vitro measurements of the
finger pulse
oximeter (Fig. 20B). The pulse-oximeter measurements in the model finger were
either
performed without the micro-gas exchanger in room, oven, and cell culture
incubator
conditions (Fig. 20B(i)) or with the micro-gas exchanger in room and oven
conditions
(Fig. 20B(ii)). In the former case, the oven was set to 37 C and the incubator
was set to 37 C
CA 03056414 2019-09-12
WO 2018/170412
PCT/US2018/022888
-42-
and 5% CO2. In the latter case, the pulse-oximeter measurements were taken
with the micro-
gas exchanger at 95% N2 and 5% CO2 to control the gas concentration of the
blood. The oven
was set to 37 C.
[00195] Blood injected into the model finger using the micro-gas exchanger
resulted in a
Sp02 of 83% at room temperature, measured with the pulse oximeter. The results
from
computational and experimental analyses matched when the Sp02 values from
validation
experiments were converted to percent gas concentration using hemoglobin
oxygen
dissociation curve (Fig. 20C).
[00196] The pulse oximeter measurements in the model finger without the
micro-gas
exchanger resulted in blood oxygen saturation of 98%, 94%, and 91% for room,
oven, and
cell culture incubator conditions, respectively. All the values were
reasonable as their trends
were expected according to the Bohr Effect, which states that the oxygen
affinity of
hemoglobin is affected by pH level shifts caused by temperature and CO2 level
changes.
Image Processing and Quantification
[00197] Phase contrast images of the microfluidic channels were obtained
using an
Olympus long working distance objective lens (20x/0.45 ph2) and commercial
software
(cellSens Dimension, Olympus Life Science Solutions, Center Valley, PA). This
provided
mosaic patches of a designated area. Microchannel images were processed using
Adobe
Photoshop software (San Jose, CA) for the quantification of adhered RBCs per
unit area (32
mm2).
Statistical Analysis
[00198] RBC adhesion data was collected from 45 blood samples from 35
patients. One-
way ANOVA test was utilized with the minimum confidence level of 95% (p <
0.05) to
assess the statistically significant difference between related data sets,
such as the number of
adhered RBCs during hypoxia and normoxia (Microsoft Excel, Seattle, WA).
Individual
patients' clinical data such as LDH level, reticulocyte count, HbF level were
compared
between responsive and non-responsive groups. Bar graphs reported show mean
standard
error of the mean, and the dotted plots show mean lines with p-values from one-
way ANOVA
test.
CA 03056414 2019-09-12
WO 2018/170412
PCT/US2018/022888
-43-
Results
Microfluidic Platform integrated with the Micro-Gas Exchanger
[00199] Fig. 21A shows the axisymmetric cross-section of the micro-gas
exchanger
depicting gas concentration and fluid flow boundary conditions. The gas
diffusion rate
depends on the flow rate, gas concentration, and tubing length. The micro-gas
exchanger
length is specifically designed to allow CO2 and 02 equilibrium before blood
reaches the
microchannel. The micro-gas exchanger design was optimized by computational
analysis and
validated experimentally. Based on the computational analyses, the length of
the micro-gas
exchanger was designed to be 250 mm, which provides 5% CO2 and 7.5% 02
concentration
at the tubing outlet (see Figs. 21B-21C). The CO2 concentration of blood
started to increase
as blood flows through the permeable tubing and reached equilibrium at 5% in
250 mm. The
02 concentration of blood reached 7.5% in 250 mm through the micro-gas
exchanger tubing.
[00200] When blood samples from SCD subjects were injected into the
microchannels
14a-14c through the micro-gas exchanger tubing 212, we observed single adhered
RBCs on
functionalized microchannel surfaces 16. Adhered RBCs sickled and their AR
decreased
upon deoxygenation (hypoxic conditions) from normoxic conditions. Furthermore,
their
deformability, indicated by the change in the AR in response to an applied
flow shear stress
of 1 dyne/cm2, was decreased in hypoxic condition (Fig. 22A).
[00201] On the other hand, RBCs from healthy HbAA subjects preserved their
morphology and deformability in hypoxic condition (Fig. 22B). The micro-gas
exchanger
210 allowed continuous oxygenation-deoxygenation of adhered RBCs in the
microchannels
14a-14c, which revealed sickling and unsickling of reversible sickle RBCs and
accompanying
biophysical changes.
Heterogeneity in RBC Adhesion Response to Hypoxia
[00202] We analyzed the number of adhered RBCs in blood samples obtained
from 35
SCD patients in hypoxic and normoxic conditions using the microfluidic device
10 integrated
with the micro-gas exchanger 210. Blood samples from SCD patients showed
heterogeneity
in the increase of adhered RBCs between normoxic and hypoxic conditions (Figs.
23A-23C).
A responsive subpopulation of patients showed a larger change in adhesion
compared to the
non-responsive patients for both FN and LN experiments (Fig. 23A). Colored
dots indicate
CA 03056414 2019-09-12
WO 2018/170412
PCT/US2018/022888
-44-
adherent RBCs. We observed a statistically significant change in the number of
adhered
RBCs to LN compared to FN in response to hypoxia (Fig. 23B, p<0.05, one-way
ANOVA).
[00203] Next, we clustered SCD patient blood samples in two subpopulations
as
responsive and non-responsive based on the increase in the number of adhered
RBCs to FN
(N=17) and LN (N=24) in response to hypoxia (Fig. 23C).
Clinical Association with the Number of Adhered RBCs under Hypoxic Conditions
[00204] Referring to Figs. 24A-24B, blood samples from responsive SCD
patients
displayed a significantly greater change in the number of adhered RBCs to FN
(N=17) and
LN (N=26) in response to hypoxia compared to blood samples from non-responsive
SCD
subjects.
[00205] The responsive and non-responsive SCD patients displayed
statistically
significant differences in clinical phenotypes, including HbF percentages
(Fig. 25A), ferritin
levels (Fig. 25B), serum LDH levels (Fig. 25C), and retics (Fig. 25D). The non-
responsive
patient subpopulation showed significantly greater HbF values compared to
responsive
patient subpopulation (Fig. 25A, p<0.05, one-way ANOVA). All responsive
patients showed
less than 7% HbF. Moreover, the responsive patient subpopulation showed
significantly
greater ferritin levels, serum LDH levels, and retics than the non-responsive
patient
subpopulation (Figs. 25B-25D, p<0.05, one-way ANOVA).
[00206] We then compared transfused (>10% HbA) and non-transfused SCD
patients,
and observed that both 7 out of 8 subjects in the responsive subpopulation
were transfused,
whereas only 2 out of 15 subjects in the non-responsive subpopulation were
transfused (Figs.
25 and 26). Furthermore, the responsive patient subpopulation showed
significantly greater
WBC counts, greater neutrophil counts, and greater HbA percentage than the non-
responsive
patient subpopulation (Figs. 26A-26D, p<0.05). The responsive patients showed
significantly
lower HbS percentage in comparison to non-responsive patients (Figs. 26C-26D,
p<0.05).
[00207] The age distribution of responsive patients was significantly
younger (<35
years) than non-responsive patients (Fig. 27, p<0.05, one-way ANOVA). All the
patients in
the hypoxia responsive subpopulation (N=8) in LN were younger (<35 years). The
baseline
change in adhesion of RBCs to LN is shown in 16 subjects <35 and 10 subjects
>35 years of
age. 8/16 subjects <35 years old and 0/10 subjects >35 years old were
responsive to hypoxia.
CA 03056414 2019-09-12
WO 2018/170412
PCT/US2018/022888
-45-
The age distribution difference was statistically significant between
responsive and non-
responsive patients (p<0.05).
Role of BCAM/Lu Blocking Under Hypoxia
[00208] BCAM/Lu is indicated to be a critical adhesion receptor for LN,
which can be
phosphorylated with adrenergic stimulation. To test the role that BCAM/Lu
played in the
observed effect of hypoxia on adhesion, we analyzed RBC adhesion in hypoxic
and normoxic
conditions in whole blood samples treated with anti-BCAM antibody (R&D
Systems,
Minneapolis, MN) in parallel to untreated control samples.
[00209] In Figs. 28A, all the patients in hypoxia responsive subpopulation
(N=8)
displayed less than 7% fetal hemoglobin (HbF). The HbF percentage of the
responsive patient
subpopulation was significantly lower compared to non-responsive patient
subpopulation
(N=15). In Fig. 28B, the responsive patient subpopulation showed significantly
greater
ferritin levels in comparison to non-responsive patient subpopulation. The
hypoxia
responsive patient subpopulation displayed significantly greater retics (Fig.
28C) and serum
LDH (Fig. 28D) levels compared to non-responsive patient subpopulations.
[00210] As shown in Fig. 29, under normoxic conditions, the BCAM/Lu
blocking
decreased the number of adhered RBCs by 34% for responsive samples and 50% for
non-
responsive samples. Moreover, the BCAM/Lu blocking decreased number of adhered
RBCs
by 54% for non-responsive samples under hypoxic conditions. The change in the
number of
adhered RBCs was significantly lower in hypoxic conditions in comparison to
normoxic
conditions for responsive patient subpopulation. On the other hand, the change
in the number
of adhered RBCs was not significant between hypoxic and normoxic conditions
for non-
responsive patient subpopulation.
[00211] The percent decrease in the number of adhered RBCs were
significantly lower
in hypoxic conditions compared to normoxic conditions for the responsive
patient
subpopulation (N=4). On the other hand, there was no statistically significant
difference
between percent decrease in the number of adhered RBCs in hypoxic and normoxic
conditions for the non-responsive patient subpopulation (N=6).
[00212] This example showed the adhesion of RBCs to endothelium associated
proteins,
FN and LN, in a close microscale environment under physiologically relevant
flow and
hypoxic conditions. We showed significant associations between the responsive
patient
CA 03056414 2019-09-12
WO 2018/170412
PCT/US2018/022888
-46-
subpopulation and clinical phenotypes, including HbF levels, ferritin levels,
serum LDH
levels, and retics. Hydroxyurea (HU), the only approved drug for SCD, induces
production of
HbF in RBCs, which interferes with HbS polymerization. It has been shown that
HbF
induction, overall, alleviates the clinical outcomes of the SCD. In this
regard, it is plausible to
hypothesize SCD patient blood samples with low HbF levels would be more prone
to the
deleterious effects of hypoxia, as we showed in Fig. 28.
[00213] Furthermore, ferritin levels were shown to increase with iron
overload caused by
blood transfusion in SCD patients. In parallel to this observation, we found
greater serum
ferritin levels in the responsive subpopulation, of which 7 out of 8 patients
were transfused,
compared to non-responsive patients. However, increased ferritin levels were
also associated
with vaso-occlusive crisis in earlier reports
[00214] LDH and retics have been expressed as an indicator of intravascular
hemolysis,
which is a critical element in pathophysiology of SCD. Hemolysis of RBCs and
consequent
release of heme has a detrimental impact on endothelial activation. Free
hemoglobin and
arginase released from lysed RBCs scavenge nitric oxide (NO) and decrease its
bioactivity,
which is a critical regulator of vascular tone. Moreover, intravascular
hemolysis triggers an
erythropoietic response in bone marrow, which results in elevated
reticulocytes in blood.
Even though increased levels of soluble adhesion molecules, such as vascular
cell adhesion
molecule 1 (VCAM-1), intercellular adhesion molecule 1 (ICAM-1), P-selectin, E-
selectin,
and Von Willebrand factor (VWF), have been associated with elevated serum LDH
levels,
the direct relationship between the adhesion of RBCs and intravascular
hemolysis has yet to
be revealed in SCD. In this study, we identified a unique patient
subpopulation designated as
responsive, of whose blood samples show an increased number of adhered RBCs in
response
to hypoxia, with significantly greater serum LDH levels and retics compared to
other
analyzed subjects. Our responsive patient subpopulation overall shown a
hemolytic
phenotype, increased LDH and reticulocytosis, which is also indicated for
other debilitating
clinical complications in SCD patients, such as priapism.
[00215] We demonstrated effective oxygen tension control of blood samples
from SCD
patients and observed increased adhesion of RBCs under hypoxic conditions. By
comparing
the number of adhered RBCs between normoxic and hypoxic conditions, we
reported, for the
first time in the literature, that there is a heterogeneity in patients'
response to hypoxia. Our
CA 03056414 2019-09-12
WO 2018/170412
PCT/US2018/022888
-47-
results associated with the clinical phenotypes that responsive samples had
higher retics,
serum LDH levels, lower HbF levels, and higher ferritin levels.
Example 4
[00216] In this example, a microfluidic device having a microchannel with a
variable
width along its length was constructed, thereby creating a continuously
variable shear rate
gradient for fluid flow. Blood samples were injected into the microchannels
and various RBC
data was acquired on the variable shear rate gradient of the microchannels.
Materials and Methods
Blood collection
[00217] De-identified sickle blood samples were obtained from subjects with
homozygous (HbSS) SCD at University Hospitals CWRU (Cleveland, OH, Division of
Hematology and Oncology), under an Institutional Review Board approved
protocol.
Informed content documentation was acquired from all subjects. Initially,
blood was drawn
into Ethylenediaminetetraacetic acid (EDTA)-containing tubes and then
aliquoted in 1 mL
sealed micro centrifuge tubes while preventing blood exposure to ambient air.
[00218] A small portion of each sample was sent to the Core Laboratory of
University
Hospitals Cleveland Medical Center (UHCMC) for High Performance Liquid
Chromatography (HPLC) analysis with the Bio-Rad Variant II Instrument (Bio-
Rad,
Montreal, QC, Canada) to determine the hemoglobin proportions (HbA, HbS, HbF,
and
HbA2). Subject clinical data including WBC count (109/L), platelet count
(109/L), absolute
neutrophil count (ANC) (106/L), reticulocyte count (109/L), total hemoglobin
(g/dL), plasma
LDH (IU/L), and ferritin level (ug/L) were obtained from the Adult Sickle Cell
Clinic at
UHCMC in Cleveland, Ohio. All experiments in this study were conducted using
whole
blood samples within 24 hours following venipuncture without any dilution or
further
processing.
Materials
[00219] FN and LN stock solutions (1 mg/mL) were purchased from Sigma
Aldrich (St.
Louis, MO, USA). Prior to surface functionalization, both protein solutions
were diluted in
lx PBS (pH=7.4) to have a working concentration of 0.1 mg/mL. Bovine Serum
Albumin
(BSA) was purchased from Sigma Aldrich in a lyophilized powder form and
dissolved in lx
CA 03056414 2019-09-12
WO 2018/170412
PCT/US2018/022888
-48-
PBS at a concentration of 20 mg/mL. 4-Maleimidobutyric acid N-
hydroxysuccinimide ester
(GMBS) powder was purchased from ThermoFisher Scientific (Waltham, MA, USA).
Stock
solutions of recombinant ICAM-1 and VCAM-1 proteins were purchased from
Biolegend
(San Diego, CA) and diluted to a final concentration of 25 pg/mL prior to
perfusing into the
microchannels.
Microchannel fabrication
[00220] The microchannels were fabricated by assembling a DSA film on a
rectangular
PMMA piece and fixing the PMMA onto a functionalized microscope glass slide
(Gold Seal,
coated with APTES, 3-Aminopropyl Triethoxysilane, Electron Microscopy
Sciences,
Hatfield, PA) through the DSA. The adhesive film was micro-machined using a
laser cutting
system (VersaLaser) to define the microchannel walls. Two identical holes
(0.61 mm in
diameter) were drilled on the PMMA cap spaced 41mm from each other to form the
inlet and
outlet ports using VersaLaser. The microchannel height/depth was determined by
the DSA
thickness, which was approximately 50 pm and which mimicked the scale of
postcapillary
venules. The entire microchannel cross-section is shown in Fig. 30.
Surface functionalization
[00221] A cross-linker agent 4-Maleimidobutyric acid N-hydroxysuccinimide
ester
(GMBS) was used in order to covalently immobilize the endothelial proteins FN
and LN to
the microchannel surfaces. The stock GMBS solution was obtained by dissolving
25 mg of
GMBS in 0.25 mL of dimethyl sulfoxide (DMSO), and it was diluted with pure
ethanol to
have a final concentration of 0.28 % v/v GMBS solution. After assembly, the
microfluidic
devices were rinsed with PBS (1x) and 100% ethanol. Next, a 60 1 of GMBS
working
solution was perfused into the microchannels twice followed by 15-minute
incubation in
room temperature. The microchannels were then washed with 90 1 of ethanol and
PBS
twice. 60 1 of FN, LN, ICAM-1 or VCAM-1 working solutions (100 ug/mL for FN &
LN;
25 pg/mL for ICAM-1 & VCAM-1) were injected into the microchannels and
incubated for
1.5 hours at room temperature. In order to prevent non-specific binding, a 90
1 of BSA
solution was added into the microchannels, held at 4 C overnight.
[00222] We characterized the surface coverage of the immobilized proteins
¨LN and FN
¨ via fluorescent labeling. The functionalized microchannels were rinsed with
90 pL of PBS
CA 03056414 2019-09-12
WO 2018/170412
PCT/US2018/022888
-49-
twice to remove the unbound BSA solution following the overnight incubation.
Next,
fluorescently labeled antibody solutions against human LN and FN were loaded
into the
microchannels and incubated for 45 minutes. Thereafter, the microchannels were
rinsed with
PBS twice and the functionalized surface was imaged on an epiflourescent
microscope at
10X.
[00223] The same procedure was carried out with the control surface, which
was loaded
with PBS excluding LN and FN and incubated with BSA at 4 C overnight using
the
fluorescently labeled antibody solution against human LN. Fig. 30A illustrates
the protein
coverage in shear-gradient, non-functionalized, LN-functionalized, and FN-
functionalized
microchannels. The white rectangles indicate the regions along which RBC
analyses were
quantified. The quantification of fluorescent intensity, assumed to be
indicative of the amount
of immobilized protein, shows negligible background fluorescence on the
control surface and
reveals protein coverage over the functionalized surfaces (Fig. 30B).
Blood processing and data acquisition
[00224] The microchannels were placed on an Olympus IX83 inverted motorized
microscope stage for visualization following the assembly of inlet tubings.
Next, 300 ul of
blood in a 1 mL syringe was connected to a constant displacement syringe pump
(New Era
NE-300, Farmingdale, NY). Blood was perfused into the microchannels at a
constant flow
rate of 18.5 ul/min until they were completely filled. Afterwards, the flow
rate was decreased
to 1.85 ul/min, corresponding to an approximate shear stress of 1 dyne/cm2 at
the smallest
microchannel cross-section, and 45 ul of blood was injected at this flow rate.
[00225] In order to wash the non-adherent cells off the microchannel
surfaces, a new
syringe containing 1 mL of wash buffer containing 1% FBS and 0.09% Sodium
Azide was
connected to the device and the buffer was pumped at a constant rate of 40
ul/min
corresponding to a mean velocity of 200 mm/min at the smallest section of the
converging
cross-section. The buffer solution was allowed to perfuse until all non-
adherent cells were
completely cleared out of the microchannels. Next, the phase-contrast images
of the
microchannel surfaces with the adherent cells were recorded at 20X using the
Olympus Cell
Sense live imaging software. Post processing of recorded images and cell
counting were
performed using Adobe Photoshop CS5 (San Jose, CA, USA).
CA 03056414 2019-09-12
WO 2018/170412
PCT/US2018/022888
-50-
Results and Discussion
Computational analysis of the fluid flow in the shear gradient microchannel
[00226] Numerical simulations were performed by a commercially available
FEA
software package COMSOL 4.3 to characterize the velocity and shear rate
profiles in the
shear gradient microchannels using a 3D model. A structured mesh was created
with a total
number of 45120 hexahedral elements throughout the entire domain. The buffer
fluid was
modeled as Newtonian with a dynamic viscosity and density of 0.001 Pa.s and
993 kg/m3,
respectively. The inlet boundary condition was set to "Velocity Inlet" with a
calculated
average velocity of 26.7 mm/s from the volumetric flow rate and tubing
dimensions. The
outlet pressure was set to 0 as the buffer discharged to the atmospheric
pressure. The
Reynolds number inside the microchannel was computed using Equation 7 below:
Re= PQ11
(7)
where p is the fluid density, Q is the volumetric flow rate, h is the
characteristic length
(microchannel height), itt is the dynamic viscosity of the fluid, and A is the
cross-sectional
area. The Reynolds number at the inlet where the width of the microchannel is
4 mm was
approximately 0.2, indicating that the flow regime was predominantly in the
laminar region.
[00227] Fig. 30C illustrates a 2D representation of the velocity and shear
rate
distributions along the microchannel. In order to mimic the local flow
conditions in the
vicinity of the surface adherent cells, the numerical results were evaluated
on a plane that was
positioned 5 um above the bottom surface of the microchannel.
Total RBC adhesion depends on the change of shear rate gradient
[00228] We analyzed the shear-dependent adhesion characteristics of HbSS
RBCs to LN
and FN in a shear gradient environment. Based on the numerical simulations, we
chose a
rectangular region of interest (ROI) for experimental data analysis as shown
in Fig. 30C.
Next, we divided each ROI into 10 identical sub-regions and quantified the
mean shear rates
for individual sub-regions using COMSOL (Fig. 31A). Then, we correlated the
number of
adherent cells in each sub-region with the corresponding mean shear rate.
[00229] Figs. 31A-31B are visual representations of the adherent RBCs in LN
immobilized shear constant (straight rectangular microchannel) and shear
gradient (variable
width microchannel of the present invention) respectively for a single SCD
subject. The
CA 03056414 2019-09-12
WO 2018/170412
PCT/US2018/022888
-51-
shear constant microchannel was fabricated using the same technique described
above, but
with a constant width corresponding to the inlet width of the shear gradient
microchannel (w
= 4mm). Figs. 31A-31B utilize the ROIs defined earlier in Fig. 30. The red
dots illustrate the
individual adherent RBCs (not to scale). Fig. 31C shows the variation in the
number of
RBCs attached to LN within individual sub-regions. The adherent cells did not
change across
the shear constant microchannel and were substantially homogeneously
distributed along the
functionalized microchannel surface.
[00230] In the shear gradient microchannel, however, RBC adhesion was
enhanced at
low shear rates by greater than two-fold relative to the first shear rate
region. In the first two
sub-regions, where the mean shear rates did not differ significantly, the
adhesion rates were
comparable. We observed a more than a 1.5-fold increase in average RBC
adhesion
throughout the ROI in the shear gradient microchannel (Fig. 31C).
[00231] Fig. 32A shows the average adhesion curves for control (non-SCD,
healthy
individuals, HbAA) and HbSS samples in LN-functionalized microchannels. HbAA
samples
displayed negligible RBC adhesion to LN with no significant correlation
between shear rate
and number of adherent RBCs (n=6). HbSS RBCs adhered to LN with a shear-
dependent
profile showing a more than three-fold increase in average adherent RBC
numbers
throughout the ROI.
[00232] To ensure that the concentration of flowing cells did not
significantly change
across the width W of the microchannel from Region 1 to Region 10, we
developed a CI-D
model to evaluate the variation in RBC distribution within the ROI. We carried
out a
computational study of the 3D particle flow to simulate the motion of RBC-
sized spherical
particles through the shear-gradient microchannel. The 3D transient numerical
study for the
particle flow was performed using COMSOL 4.3 by introducing spherical
particles with a
diameter of 3 pm to simulate flowing RBCs.
[00233] The initial particle velocities were adjusted based on the flow
field at the inlet. A
total number of 2000 particles were released every 1 s for a total simulation
duration of 40
seconds, at which point the flow reached steady-state. The particle density
was set to
1.1 g/mL, simulating the average density of an individual RBC. In the
beginning, the
particles were more diluted further downstream due to the inlet continuously
receiving
particles. As the flow progressed, the particle concentration became more
consistent and
reached a steady state approximately 40 seconds after flow initiation. At
steady state, the
CA 03056414 2019-09-12
WO 2018/170412
PCT/US2018/022888
-52-
particle concentration was consistent throughout the sub-regions of the ROI,
with a 5.4% to
7.8% variation of the mean.
[00234] Figs. 32B-32C show distributions of surface adherent HbSS RBCs with
varying
shear rates from a single sample in LN and FN functionalized microchannels. To
assess the
extent to which individual RBC subpopulations responded to the shear rate
gradient, we fit
linear regression curves for both deformable and non-deformable RBC adhesion
data and
observed a significantly greater deformable RBC adhesion rate in LN
immobilized channels
in comparison to FN channels for the sample tested.
[00235] Moreover, the deformable RBC to LN adhesion was highly shear
dependent,
showing a more than three-fold increase in adhered cell numbers between region
1 and region
10. In order to quantify the shear dependent adhesion of individual samples,
the absolute
value of the slope of the curves was defined as the "RBC Shear Gradient
Microfluidic
Adhesion (SiGMA) index", in which a decreased SiGMA index suggests greater
adhesion
under higher shear rates. The linear regression curves and corresponding
regression equations
were generated in OriginLab (Northampton, MA) for all the samples tested.
Negative slopes
in Figs. 32B-32C indicated declining adhesion numbers with increasing shear
rate. A
graphical illustration of the SiGMA index is shown in Fig. 33.
Quantification of shear dependent adhesion rate in LN and FN channels
[00236] The calculated SiGMA indices for a group of SCD subjects are shown
in
Fig. 34A. Deformable RBC adhesion to LN was shear dependent, compared with non-
deformable RBC adhesion to LN, as well as deformable and non-deformable RBC
adhesion
to FN (p<0.01). The influence of shear rate may be minimized in relatively low-
adhesion
samples, where low absolute numbers of adherent RBCs negated the effect of
shear rate. We
therefore normalized the SiGMA indices based on RBC adhesion in the first sub-
region of the
entire field by computing the normalized adhesion numbers for each sub-region
and
generated normalized adhesion curves using Equation 8 below:
Number. Of d here zt RE zN subrp
Normalized Ad hesion Number = x 100 (8)
Ar-irrsthey ccf t-sc/h6, d RPC.z 1Ft sltz,-;Ift-P1
[00237] Next, we defined the slope of each normalized adhesion curve as
normalized
Shear Gradient Microfluidic Adhesion (nSiGMA) index. Equation 8 was used to
determine
the percent increase in RBC numbers in a specific sub-region compared to the
first sub-
CA 03056414 2019-09-12
WO 2018/170412
PCT/US2018/022888
-53-
region. Hence, the influence of total adhered cell numbers on SiGMA index
calculations was
negated, which allowed for a comparison from both low- and high-adhesion
samples.
[00238] Fig. 34B shows the difference in nSiGMA indices between HbSS RBC
adhesion
to LN or FN (p<0.01). Although the deformable cells displayed increased
nSiGMA, we did
not observe a significant correlation between the two RBC subpopulations.
Deformable and
non-deformable HbSS RBCs had different responses to changes in shear rate. The
calculated
SiGMA indices indicated that deformable RBCs were more shear dependent than
non-
deformable ones. In other words, deformable cells were more sensitive to
changes in shear
rate and could be removed to a significantly greater extent with increasing
shear rates.
However, this behavior might have been amplified due to the high number of
adherent RBCs
to LN.
[00239] nSiGMA indices revealed that adhesion of both deformable and non-
deformable
RBCs to LN was more shear dependent than adhesion to FN, as shown in Fig. 34B.
We did
not observe a significant difference between shear dependent responses by
deformable and
non-deformable RBCs. In general, FN-adherent RBCs did not respond to the shear
gradient
and maintained persistent attachment with an approximate nSiGMA value of 20
(Fig. 34B).
A high rate (elevated slope) of shear dependent adhesion implied a tendency of
adherent
RBCs to detach relatively easily at high shear sites in the microchannel.
Lower shear
dependency corresponded to more persistent RBC adhesion, which might not be
influenced
as much by elevated shear rates.
Adhesion threshold in FN microchannels revealed persistent RBC adhesion beyond
the
physiological limits
[00240] In addition to SiGMA and nSiGMA indices described herein, we
further
calculated the x-axis intercept of the regression curves obtained for each
sample, which was
defined as the adhesion threshold, as previously illustrated in Fig. 33. The
intercept point
represented the predicted shear rate required to remove all adherent RBCs
(deformable and
non-deformable) from LN or FN. Therefore, an increased adhesion threshold
implied that
adherent RBCs would persist at high shear rates.
[00241] As shown in Fig. 34C, the estimated mean adhesion threshold for
HbSS RBCs
adherent to LN was 351 s-1. All adhesion threshold values were within a
physiological shear
range of 121s-1 (minimum) and 952 s-1 (maximum), typical for post-capillary
venules. In
CA 03056414 2019-09-12
WO 2018/170412
PCT/US2018/022888
-54-
contrast, the mean adhesion threshold for FN adherent cells was 839 s-1. Our
data indicated
that more attachment-detachment events may take place in a LN functionalized
microchannel
for a given SCD subject, yet the physiological shear rates could prevent a
persistent RBC
attachment in the system. On the other hand, FN-adherent RBCs, despite fewer
absolute
attachments, may remain attached for longer periods of time when exposed to
physiological
shear rates.
Shear dependent RBC adhesion associates with clinical phenotype in SCD
[00242] We have observed a heterogeneous response of adherent RBCs to the
shear
gradient as indicated by several parameters, namely: SiGMA, nSiGMA, and
adhesion
threshold. This heterogeneity exists both at the individual SCD subject level
and in the
population. Therefore, we investigated potential associations between adhesion
data and
clinical phenotypes in SCD.
[00243] Figs. 35-36 illustrate the individual adhesion curves, from which
the adhesion
rates and normalized adhesion rates were calculated, for each SCD sample along
with a
control group (HbAA). In particular, Figs. 35A-35C show the subject adhesion
curves based
on raw adherent RBC numbers. Figs. 36A-36C show the adhesion curves based on
normalized adherent RBC numbers in LN-functionalized microchannels. We
separated the
subject population to two groups arbitrarily based on a nSiGMA index of 60.
The adherent
cell numbers represent the summation of both deformable and non-deformable
RBC. The
statistical analyses were carried out with Minitab 17 (Minitab, State College,
PA) software
package. The data were analyzed using ANOVA with Turkey's post hoc test for
multiple
comparisons and the p value for each dataset reported (see Figs. 37A-37C).
[00244] Subjects with low response to shear dependent adhesion to LN, i.e.,
less
reduction of adhesion with increasing shear rates, lower nSiGMA, displayed
elevated levels
of WBC, ANC, and ferritin (see Figs. 37A-37C having corresponding p values of
0.005,
0.006, and 0.007 respectively; one-way ANOVA) (see also Table 3 below).
CA 03056414 2019-09-12
WO 2018/170412 PCT/US2018/022888
-55-
Table 3 - Clinical phenotype of the study population based on their shear
dependent adhesion
characteristics
High shear dependent Low shear dependent
adhesion adhesion (nSiGMA>60) P--
Range
(nSiGMA>60) (Mean (Mean St. Err.) value*
St. Err.)
Age 33.9 4.57 30.4 1.89 21-61 0.488
Hgb (g/dL) 8.54 0.49 7.35 0.62 2.6-10.7 0.149
WBC (109/L) 7.6 0.56 13.9 1.37 5.2-21.9 0.005
ANC (106/L) 3898 479.4 7979 1215 2130-15930
0.006
Platelet Count 330.8 60.1 353.7 24.07 174-781 0.728
Reticulocyte 248.4 20.77 408.6 75.24 122-
813 0.055
Lactate 363.3 61.68 518 72.75 154-813 0.122
Ferri tin (ug/L) 784.5 219.62 3272.3 79L9 11-
8320 0.007
Hemoglobin S 73.48 6.69 59.96 6.45 27.2-91 0.190
Hemoglobin A 13.22 7.29 26.85 6.32 1.4-66.8 0.206
Hemoglobin F 7.05 1.95 3.89 1.34 0.7-18.1 0.240
A total of 20 blood samples (n) were obtained from 20 subjects (Male=10,
Female=10).
All subjects are homozygous MSS.
WBC: White blood cell count ANC: Absolute neutrophil count
* Computed based on ANOVA one-way test.
[00245] Inflammatory cells play a critical role in initiating vaso-
occlusive crises and
contribute to the pathophysiology of SCD in various ways. Here, we showed that
subjects
with high WBC counts exhibit lower shear dependent red cell adhesion
characteristics to LN,
with the implication that RBC attachment in these subjects is stronger and
resistant to high
shear rates for cell detachment (Fig. 37A). We also observed a similar
behavior with
absolute neutrophil counts (ANC) (Fig. 37B) in accordance with an earlier
study that reported
a correlation between peripheral neutrophil count and clinical severity of
SCD.
[00246] It has been reported that neutrophils are highly activated in
sickle cell subjects
particularly during vaso-occlusive events. Neutrophil activation in SCD could
be triggered by
various chemokines present in blood serum such as interleukin-8 (IL-8),
sickled RBC-
dependent IgG-enhanced as well as complement activation pathways, and
activated
CA 03056414 2019-09-12
WO 2018/170412
PCT/US2018/022888
-56-
endothelial line. It has previously been shown that activation of sickle RBCs
by IL-8 induced
RBC adhesion to the endothelium enhanced by FN.
[00247] Here, our findings indicate that ANCs may also play a role in
mediating the
adhesion strength of RBCs to LN, which could indicate a novel pathway for
neutrophils to
contribute to severity of the disease. Further studies are required to unearth
the mechanism
underlying the association between neutrophils and shear dependent RBC
adhesion.
[00248] SCD subjects on chronic and prolonged RBC transfusion therapy are
likely to
suffer from iron overload that can lead to serious complications and even
higher mortality
rates. Therefore, it is critical to accurately monitor the states of iron
overload of such
subjects. Serum Ferritin (SF) is one of the most common clinical tests in
determining iron
overload that provides adequately reliable results. In addition to the
clinical implications of
iron overload in SCD, we have shown that increased SF levels are inversely
proportional with
the shear dependent adhesion of RBCs to LN (Fig. 37C). Hence, it could be
speculated that
the presence of excessive intracellular iron levels helps enhance the adhesion
strength of
sickle RBCs to LN. Alternatively, RBCs from subjects with more severe disease
(requiring
transfusion) may exhibit higher nSiGMA indices.
[00249] Our preliminary findings ¨ from 3 subjects with SCD ¨ also suggest
shear-
dependent adhesion characteristics of sickle RBCs in LN, FN, ICAM-1, and VCAM-
1
functionalized microchannels.
[00250] This example examined the shear dependent adhesion of HbSS RBCs to
LN and
FN in a microfluidic platform in which the shear rate gradient was imposed
based on the
microchannel geometry along the flow direction. The shear gradient flow was
continuous and
driven by a single pump at a constant flow rate.
[00251] We found subject-specific and clinically relevant parameters: RBC
SiGMA
index, RBC nSiGMA index, and adhesion threshold (AT) values. These parameters
describe
the dynamic pathophysiology of SCD and the role of shear rate in vaso-
occlusion. We
observed a significant, subject-dependent variation of AT for FN-
functionalized
mircochannels as opposed to LN-functionalized microchannels. This could also
be attributed
to the high rate of persistently-adhered, non-deformable RBCs to FN. Moreover,
our findings
suggested a link between nSiGMA and subject clinical phenotypes of
inflammation and iron
overload ¨ with a lower nSiGMA being associated with a worse outcome.
CA 03056414 2019-09-12
WO 2018/170412
PCT/US2018/022888
-57-
Example 5
[00252] In this study, we showed the efficacy of using a point-of-care
(POC) device for
monitoring cellular adhesion in a specific subject and adhesion type.
Materials
[00253] The POC device included a Samsung Galaxy S4, 3D optical attachment,
microfluidic device, and custom application software. The 3D optical
attachment was
designed using a 3D modeling software and built by 3D printing. Optics
included an LED,
diffuser, and ball lens implemented to evenly illuminate the blood sample and
provide
magnified images of adhered cells to the Samsung camera.
Results and Discussion
[00254] Referring to Figs. 38A-38E, a microfluidic device 10 having
multiple
microchannels 14 was constructed as described in Example 1 and provided in the
optical
attachment member 100 of the imaging system 140 (Fig. 38A). The optical
attachment
member 100 was connected to a cellular phone 110 (Fig. 38B). The microchannels
14 were
functionalized with various endothelium proteins.
[00255] A blood sample 20 was delivered to the microchannels 14. The mobile
application on the cellular phone 110 cooperated with the LED 126 to take
images of the
adhered RBCs in the microchannels 14 (Fig. 38C). The images were automatically
processed
to quantify the RBC adhesion number for the subject for each endothelium
protein. More
specifically, image capturing and digital image processing were done by
utilizing the
OpenCV library for Android. An adaptive threshold was used to turn protential
cells white
and the background black.
[00256] Next, all white contours were identified and filled in with white
color.
Automated cell counting was then performed using the OpenCV simple blob
feature detector,
which labeled all properly sized objected in the image as cells. The POC
system sampled a
1 mm2 square of the whole microchannel and predicted the number of captured
cells in the
whole channel by applying a multiplication factor.
[00257] The adhered cell counts were also manually counted. The software
then
compared and correlated the manual count with the software count for all
adhesion types
(Fig. 38D). Example preliminary data collected from two subjects using the POC
device
CA 03056414 2019-09-12
WO 2018/170412
PCT/US2018/022888
-58-
related to LN-specific adhesion (Fig. 38E). The subjects were receiving anti-
adhesion
therapy and n = 3-9 measurements for each data point.
[00258] Figs. 39A-39C are additional correlations between counts of adhered
RBC
obtained by scanning microscope and those obtained using the mobile
application Cell Vision
150. The data was generated for LN-functionalized microchannels (Fig. 39A), FN-
functionalized microchannels (Fig. 39B), and TSP-functionalized microchannels
(Fig. 39C).
We observed variable correlation across the functionalized proteins. LN held
the highest
PCC of 0.96 (p<0.05) due to its highly homogenous adhesion. Relatively lower
PCCs were
observed for FN and TSP (both 0.81; p<0.05).
[00259] Figs. 40A-40D illustrate specifics of the mobile application 150 ¨
here called
CellVision. The mobile application 150 was accessible as an icon on the screen
of the
cellular phone 110 (Fig. 40A). Once the mobile application 150 was initiated,
the screen of
the cellular phone 110 became a live image feed of the microfluidic device 10
(Fig. 40B).
The subject was able to select a "TAKE IMAGE" icon on the screen to initiate
data
collection. Once the image was taken (Fig. 40C), the subject manually entered
their
identification number and the endothelium protein used to functionalize the
microchannels.
The subject then selected a "PROCESS" icon on the screen, which activated the
photo
algorithm used to quantify the adhered RBCs. A final still image identifying
the quantified
RBCs was presented to the subject on the cellular phone 110 screen (Fig. 40D)
as well as a
cell count of the adhered RBCs. The patient identifier and adhesion level was
automatically
saved and could be transmitted to electronic records.
[00260] From the above description of the invention, those skilled in the
art will perceive
improvements, changes and modifications. Such improvements, changes, and
modifications
are within the skill of the art and are intended to be covered by the appended
claims. All
patents and publications identified herein are incorporated by reference in
their entirety.