Note: Descriptions are shown in the official language in which they were submitted.
CA 03065235 2019-11-27
WO 2018/222138 PCT/SG2018/050267
- 1 -
EXPLOSIVES COMPOSITION
Field of the Invention
This disclosure relates in general to explosives compositions for use in
commercial
blasting operations, such as mining and quarrying applications. Aspects of the
present
disclosure are directed to emulsion explosives containing one or more of
grapheme oxide
(GO), partially reduced graphene oxide (prG0), and functionalized graphene
oxide (fG0).
Background of the Invention
The general thought in classical chemistry is that atoms and molecules are
extremely
small with the molar masses of less than 1000 g/mol, while in classical
physics, these
are macroscopic particles and can be understood in terms of physical
mechanics.
Fortunately, there are particles which reside between these extremes¨the
colloidal size
range of particles, whose small sizes and high surface-area-to-volume ratios
make the
properties of their surfaces very important and lead to some unique physical
properties.
A colloidal dispersion is a collection of particles, bubbles or droplets of
one phase with
molecular dimensions of up to several microns, dispersed in the second phase.
Colloids
are classified on the basis of whether they are solid or liquid, dispersed in
solid or liquid or
gas as sol, emulsion, foam, and aerosol.
Of all classes of colloids, emulsions are the most common. An emulsion is a
type of a
colloid in which both phases are in a liquid state. Emulsions are formed when
two
immiscible liquids are mixed and stabilised by a surfactant or emulsifier. The
dispersed
liquid in an emulsion exists as droplets in the continuous liquid of another
composition.
For any emulsion, stability is the factor that decides the performance as well
as the quality
of the emulsion. Stability accounts for physical and chemical changes over
time. For
an emulsion explosive, good rheological properties and high thermal
conductivity are
required, along with stability.
An emulsifier is a surfactant that adsorbs to the surface of emulsion
droplets; this
facilitates the formation of an emulsion containing smaller droplets, and the
stabilisation
CA 03065235 2019-11-27
WO 2018/222138 PCT/SG2018/050267
- 2 -
of the droplets. An emulsifier reduces the interfacial tension by forming a
protective
coating around the droplets during emulsification. This prevents the
disruption of
emulsion droplets; ultimately prevent it from aggregating and coalescence.
Emulsion can be classified based on volume percentage of internal phase or
internal
phase ratio (IPR) into three types namely, diluted, concentrated and highly
concentrated
emulsions. Highly concentrated emulsions are high internal phase emulsions
that have a
larger volume fraction of the dispersed phase in the continuous phase.
Emulsions have found applications in the making of diverse materials including
commercial explosives. Emulsion explosives are composed of a discontinuous
phase
containing an oxygen- supplying component and an organic fuel medium, forming
the
continuous phase; both the phases are emulsified in the presence of a suitable
emulsifier.
Owing to their significant industrial importance, considerable research has
been conducted
to date with a mind to developing new and/or improved emulsion explosives. An
opportunity therefore remains to continue with such research to develop new
and/or
improved emulsion explosives.
Summary of the Invention
The present invention provides a water-in-oil (W/O) emulsion explosive
comprising
graphene oxide.
The present invention also provides a thermal conductivity enhanced water-in-
oil (W/O)
emulsion explosive comprising a W/O emulsion explosive composition having a
thermal
conductivity enhancement agent incorporated therein, wherein the thermal
conductivity
enhancement agent comprises graphene oxide.
In one embodiment the graphene oxide provides the thermal conductivity
enhanced W/O
emulsion explosive with a thermal conductivity that is up to 15% greater than
that of the
W/O emulsion explosive in the absence of graphene oxide.
CA 03065235 2019-11-27
WO 2018/222138 PCT/SG2018/050267
- 3 -
In another embodiment the graphene oxide provides the graphene oxide provides
the
thermal conductivity enhanced W/O emulsion explosive with a thermal
conductivity that is
between 5 - 15% greater than that of the W/O emulsion explosive composition in
the
absence of graphene oxide.
In one embodiment the graphene oxide is incorporated into the W/O emulsion
explosive
composition as a surfactant, a surfactant-like component, or a surfactant
adjuvant.
In one embodiment the W/O emulsion explosive composition further comprises a
surfactant other than graphene oxide.
In another embodiment the W/O emulsion explosive exhibits an emulsion
stability of up to
days.
15 In one embodiment the graphene oxide comprises at least one of graphene
oxide per se, a
partially reduced form of graphene oxide, and a functionalized graphene oxide.
The W/O emulsion explosive in to which the graphene oxide is introduced
according to the
invention can advantageously be a conventional W/O emulsion explosive. As
described
20 herein, upon addition of the graphene oxide to a conventional W/O
emulsion explosive,
certain properties of the resulting W/O emulsion explosive are enhanced,
relative to the
conventional W/O emulsion explosive (i.e. absent the graphene oxide).
The graphene oxide may be graphene oxide per se (GO), a partially reduced form
of
graphene oxide (prG0), and/or a functionalized graphene oxide (fG0). Examples
of fG0
include amine or amide functionalized graphene oxide. For ease of reference
unless
otherwise stated, reference to "graphene oxide" is intended to embrace these
various
possibilities.
In other words, the present invention provides a water-in-oil (W/O) emulsion
explosive
comprising one or more of graphene oxide (GO), partially reduced graphene
oxide (prG0),
and functionalized graphene oxide (fG0).
CA 03065235 2019-11-27
WO 2018/222138 PCT/SG2018/050267
- 4 -
Similarly, the present invention also provides a thermal conductivity enhanced
water-in-oil
(W/O) emulsion explosive comprising a W/O emulsion explosive composition
having a
thermal conductivity enhancement agent incorporated therein, wherein the
thermal
conductivity enhancement agent comprises one or more of graphene oxide (GO),
partially
reduced graphene oxide (prG0), and functionalized graphene oxide (fG0).
The emulsion explosive comprises conventional components, namely aqueous
oxidizer salt
solution and fuel, and one skilled in the art will be familiar with the types
of salt solutions
and fuels that may be used. Such emulsion explosives are commonly known as
water-in-
oil (W/O) emulsion explosives. Embodiments can also rely on the use of
conventional
emulsifiers, and again one skilled in the art would understand the types of
reagents that
may be used in this regard.
The emulsion explosives in accordance with embodiments of the present
disclosure may
require sensitization before they are in a form that may be initiated. Hence,
embodiments
in accordance with the present disclosure encompass non-sensitized emulsion
explosives.
Sensitization may be achieved by using conventional techniques, including the
introduction of voids into the emulsion explosive. Thus, chemical gassing
agents may be
used to produce sensitizing gas bubbles in the emulsion explosive.
Sensitization may also
be achieved by inclusion of microballoons, typically glass or plastic
microballoons.
Without wishing to be limited by theory it is believed the graphene oxide may
function as a
surfactant (emulsifier), a surfactant-like component, or a surfactant adjuvant
in an
emulsion explosive composition or emulsion explosive, thereby aiding
stabilization of or
stabilizing the emulsion explosive. In some embodiments, the emulsion
explosive may
include graphene oxide as the only surfactant. In such embodiments the
graphene oxide
may be used in the form of a dispersion of graphene oxide in a polar
carrier/vehicle, for
example in water, for instance, deionized water. In that case the emulsion can
be formed
by mixing together an aqueous oxidizer salt solution, a fuel and the
dispersion of graphene
oxide in a polar carrier/vehicle. In such embodiments the amounts of aqueous
oxidizer salt
solution and fuel phase will be conventional. It has been found that emulsions
formed in
that way can exhibit suitable emulsion stability (e.g., for up to 20 days).
CA 03065235 2019-11-27
WO 2018/222138 PCT/SG2018/050267
- 5 -
For a given emulsion explosive under consideration, the amount of graphene
oxide (and
the amount of carrier/vehicle) may be determined experimentally, e.g., with
respect to
providing an emulsion explosive having suitable, intended, or desired emulsion
characteristics and/or explosive properties.
In other embodiments, an emulsion explosive may be prepared using a
conventional
emulsifier in combination with graphene oxide (e.g., dispersed in a polar
carrier/vehicle).
In that case, the relative proportions of the emulsifier and graphene oxide
may need to be
controlled or carefully controlled since with respect to certain relative
proportions, there
may be an interaction between them (e.g., competitive interaction) that can be
adverse with
regard to emulsion characteristics and stability. In such an embodiment, the
emulsion
explosive may be prepared by mixing the (conventional) emulsifier with the
fuel phase,
and by blending the fuel/emulsifier mixture with an aqueous oxidizer salt
solution and a
dispersion of graphene oxide.
In some embodiments it has been found the presence of graphene oxide can
provide
beneficial properties in a sensitized emulsion explosive; specifically, the
graphene oxide
may provide improved or enhanced thermal conductivity relative to a
conventional
emulsion explosive in which graphene oxide is not present. The improvement in
thermal
conductivity may be up to about 15% and possibly higher.
An improvement in thermal conductivity may provide beneficial detonation
characteristics
in a fully formulated (sensitized) emulsion explosive. For example, improved
velocity of
detonation (VoD) may be achieved without comprising density.
In one embodiment the thermal conductivity of a pre-existing or pre-formulated
emulsion
explosive may be improved by blending the emulsion explosive to include
graphene oxide.
The graphene oxide can be used in the form of a dispersion in a polar
carrier/vehicle.
Alternatively, the graphene oxide may be used in the form of powdered graphene
oxide.
The present invention also provides a sensitized emulsion explosive comprising
an
emulsion explosive and graphene oxide
CA 03065235 2019-11-27
WO 2018/222138 PCT/SG2018/050267
- 6 -
As disclosed herein, such a sensitized emulsion explosive can be sensitized by
conventional means.
The present invention further provides a method of blasting in which the
sensitized
emulsion explosive is provided in a blasthole or borehole and initiated. The
sensitized
emulsion explosive may be initiated using conventional initiation devices.
In one embodiment, a sensitized first emulsion explosive containing graphene
oxide can be
loaded into a blasthole in a non-random, sequenced, or programmably-defined
manner
(e.g., in accordance with stored program instruction sets executed by a
processing unit such
as a microprocessor or microcontroller) with respect to the loading of a
sensitized second
emulsion explosive that lacks graphene oxide into the same blasthole, such
that one or
more portions of the blasthole contain the sensitized first emulsion
explosive, and one or
.. more other portions of the blasthole contain the sensitized second emulsion
explosive.
The first and second sensitized emulsion explosives can be sensitized in the
same manner
(e.g., by way of the same sensitizing agent or agents), or in different
manners (e.g., by way
of different sensitizing agents), as will readily be understood by one of
ordinary skill in the
.. art. Moreover, in association with the sensitization of the first and/or
second emulsion
explosives by way of the introduction of sensitizing voids therein,
sensitizing voids may be
controllably introduced into the first and/or second emulsion explosives in a
manner that
respectively provides the first and/or second emulsion explosives with an
intended or target
density or density profile within the blasthole (e.g., a constant density
profile, or a varying
/ variable density profile, possibly depending upon or as a function of depth
within the
blasthole).
Without wishing to be limited by theory, while it has been found in a number
of
embodiments the graphene oxide may function as a surfactant (emulsifier), a
surfactant-
like component, or a surfactant adjuvant in an emulsion explosive composition
or emulsion
explosive, the exact function or functions of graphene oxide in such emulsions
is not
completely understood, and may vary depending upon embodiment details. For
example,
the addition and blending of powdered or particulate graphene oxide into pre-
formed or
CA 03065235 2019-11-27
WO 2018/222138 PCT/SG2018/050267
- 7 -
pre-formulated W/O emulsion explosive compositions (e.g., W/O emulsion
explosive
compositions that have been formulated such that all emulsification stage(s)
for their
preparation or manufacture are complete prior to the addition of the graphene
oxide) has
been found to provide surprising improvement in the VoD of such emulsion
explosive
.. compositions, even for small or very small amounts of added graphene oxide,
relative to
the W/O emulsion explosive compositions absent the graphene oxide. In such
case, the
addition of the graphene oxide into the pre-formulated W/O emulsion explosive
composition at least up to a graphene oxide weight percentage of 5% does not
appear to
interfere with the emulsion stability of the pre-formulated W/O emulsion
explosive
composition, which is emulsified by way of conventional surfactant
material(s). This, in
turn, can indicate that the graphene oxide need not or may not function solely
or to any
great extent as a surfactant (emulsifier), a surfactant-like component, or a
surfactant
adjuvant; the graphene oxide may in addition or outright function as one or
both of a
thermal conductivity agent and a chemical sensitizing agent or further
chemical sensitizing
agent.
The present invention therefore also provides use of graphene oxide to improve
one or
more properties of a W/O emulsion explosive, relative to the W/O emulsion
explosive
absent the graphene oxide.
Improved properties of the W/O emulsion explosive may, for example, include
improved
thermal conductivity and/or improved velocity of detonation.
The present invention further provides use of graphene oxide to improve
thermal
conductivity of a W/O emulsion explosive, relative to the W/O emulsion
explosive absent
the graphene oxide.
The present invention further provides use of graphene oxide to improve
velocity of
detonation of a W/O emulsion explosive, relative to the W/O emulsion explosive
absent
the graphene oxide.
The present invention also provides a method of improving one or more
properties of a
W/O emulsion explosive, the method comprising incorporating in the W/O
emulsion
CA 03065235 2019-11-27
WO 2018/222138 PCT/SG2018/050267
- 8 -
explosive graphene oxide, wherein said one or more improved properties is
relative to the
W/O emulsion explosive absent the graphene oxide.
The graphene oxide may be incorporated into the W/O emulsion explosive during
or as
part of an emulsification stage of preparing the W/O emulsion explosive.
Alternatively, the graphene oxide may be incorporated into the W/O emulsion
explosive
after an or after all emulsification stage(s) of preparing the W/O emulsion
explosive. In
that case, the graphene oxide may be described as being incorporated into a
pre-formed or
pre-formulated W/O emulsion explosive (e.g., the graphene oxide is an additive
to the pre-
formulated W/O emulsion explosive).
The present invention also provides a method of improving thermal conductivity
of a W/O
emulsion explosive, the method comprising incorporating in the W/O emulsion
explosive
graphene oxide, wherein said improved thermal conductivity is relative to the
W/O
emulsion explosive absent the graphene oxide.
The present invention further provides a method of improving velocity of
detonation of a
W/O emulsion explosive, the method comprising incorporating in the W/O
emulsion
explosive graphene oxide, wherein said improved velocity of detonation is
relative to the
W/O emulsion explosive absent the graphene oxide.
In one embodiment, the thermal conductivity of the W/O emulsion explosive may
be
improved by an amount of at least about 5%, or at least about 10%, or at least
about 15%,
or at least about 20%. For example, the thermal conductivity of the W/O
emulsion
explosive may be improved by an amount ranging from about 5% to about 25%, or
from
about 10% to about 20%.
In another embodiment, the velocity of detonation of the W/O emulsion
explosive may be
improved by an amount of at least about 5%, or at least about 10%, or at least
about 15%,
or at least about 20%. For example, the velocity of detonation of the W/O
emulsion
explosive may be improved by an amount ranging from about 5% to about 25%, or
from
about 10% to about 20%.
CA 03065235 2019-11-27
WO 2018/222138 PCT/SG2018/050267
- 9 -
The present invention can make use of graphene oxide having a wide range of
particle
sizes. For example, the average or median largest dimension of the graphene
oxide can
range from 0.1 m to about 5mm, for instance, in some embodiments about 0.5iLim
to about
5mm.
The present invention can be performed using varying amounts of graphene
oxide. For
example, the W/O emulsion explosive may comprise from about 0.007 wt% to about
5
wt% graphene oxide, for instance, in some embodiments about 0.1 wt% to about 1
wt%
grapheme oxide.
In certain embodiments in which the graphene oxide is incorporated into the
W/O
emulsion explosive during or as part of an emulsification stage of preparing
the W/O
emulsion explosive, it may be desirable to use graphene oxide in an amount of
from about
0.007 wt% to about 0.1 wt%
Where the graphene oxide is incorporated into the W/O emulsion explosive after
an
emulsification stage of preparing the W/O emulsion explosive, such as when
graphene
oxide is incorporated into a pre-formulated W/O emulsion explosive as an
additive thereto,
it may be desirable to use graphene oxide having an average or median largest
dimension
ranging up to about 5mm.
In certain embodiments in which the graphene oxide is incorporated into the
W/O
emulsion explosive after an emulsification stage of preparing the W/O emulsion
explosive,
it may be desirable to use graphene oxide in an amount of from about 0.1 wt%
to about 5
wt%.
Throughout this specification and the claims which follow, unless the context
requires
otherwise, the word "comprise", and variations such as "comprises" and
"comprising", will
be understood to imply the inclusion of a stated integer or step or group of
integers or steps
but not the exclusion of any other integer or step or group of integers or
steps.
CA 03065235 2019-11-27
WO 2018/222138 PCT/SG2018/050267
- 10 -
The reference in this specification to any prior publication (or information
derived from it),
or to any matter which is known, is not, and should not be taken as an
acknowledgment or
admission or any form of suggestion that prior publication (or information
derived from it)
or known matter forms part of the common general knowledge in the field of
endeavour to
which this specification relates.
Aspects and embodiments of the invention are described in more detail below.
Brief description of the Drawings
Certain embodiments of the invention where hereinafter be described with
reference to the
following non-limiting drawings in which:
Figure 1(a) shows deconvoluted Cis XPS spectra of pristine GO. The spectra was
fitted to different peak intensities corresponding to sp2 Carbon and Carboxyl
functional
group (-COOH) and values are consistent with literatures. (b) shows
deconvoluted Cis
spectra of partially reduced GO. The reduction in the intensities of carbonyl
functional
groups can be attributed to the partial thermal reduction of the pristine GO.
(c) shows
the FT1R spectra which re-confirms the partial reduction via reduced intensity
of the
carbonyl functional group at ¨1620 cm-1. (d) shows the Raman spectra of
Graphite, GO
and prGO. With oxidation, defect density increases leading a D- band
corresponding to
sp3 carbon and broader G-band shifting to higher frequencies as a consequence
of
amorphization. Partial thermal reduction induces rupturing of GO sheets at
high temp,
inducing disorder and broad G-band along with a shift in lower frequencies due
to
dominance of sp2 carbon;
Figure 2 shows contact angle of GO and prGO with the canola oil and water. (a)
GO and
oil (b) GO and water (c) prGO and Oil and (d) prGO and water;
Figure 3 (a) shows oil droplet inside water continuous phase with hydrophilic
GO at the
interface. (b) Water droplet inside oil continuous with less hydrophilic
partially reduced
GO at the interface. Hydrophilic groups wet the water phase while hydrophobic
domains
wet the oil phase. With less hydrophilicity, hydrophobic domains in reduced GO
will
wet the oil phase forming oil as the continuous phase;
CA 03065235 2019-11-27
WO 2018/222138 PCT/SG2018/050267
- 11 -
Figure 4 shows photographs of a GO dispersion, prGO dispersion and W/O
emulsion;
Figure 5 shows W/O emulsion with different graphene derivatives viz. pristine
GO,
partially reduced and fully reduced. The reduction of GO was varied and
controlled from
no reduction to partial to fully reduced GO. After the preparation confocal
imaging of the
same was immediately observed;
Figure 6 shows W/O emulsion with different graphene derivatives viz. pristine
GO,
partially reduced and fully reduced. The reduction of GO was varied and
controlled from
no reduction to partial to fully reduced GO. After the preparation confocal
imaging of the
same was immediately observed;
Figure 7 shows confocal imaging of w/o emulsion with different continuous
(oil)
phase volume fraction. The oil composition of emulsion was varied at the
synthesis step.
With decrease in the oil phase in the emulsion the water droplets will try to
approach
each other and ultimately collapse and coalesce, giving no emulsion at very
low oil
volume;
Figure 8 shows rheological properties of w/o emulsion. The emulsion was
analyzed for
(a) and (b) amplitude sweep, (c) and (d) frequency sweep. These properties
were
compared with that of an o/w emulsion prepared using pristine GO;
Figure 9 shows AC electrical conductivity of the prGO stabilized W/O emulsion
with time.
There is no change in the conductivity in the initial days of the synthesis.
From day 4 the
prGO coated water droplets starts settling with evolution of oil phase;
Figure 10 shows decay in normalized droplet size distribution of the W/O
emulsion
with time. The broader droplet size distribution shows that the coalescence is
the
prevailing mechanism in the destabilization of prGO stabilized W/O emulsion;
CA 03065235 2019-11-27
WO 2018/222138 PCT/SG2018/050267
- 12 -
Figure 11 shows evolution of Sauter mean diameter with time. Due to
coalescence, the
mean diameter of the prGO stabilized emulsion and the phases separate by the
20th day;
Figure 12 shows confocal microscopy images and corresponding droplet size
distribution
of the W/O emulsions synthesized using (a) 3.0 wt%, (b) 0.3 wt% and (c) 0.15
wt%
concentration of E-476 emulsifier. The GO concentration was kept constant at
0.007 wt%;
Figure 13 shows oscillatory shear measurements in the linear viscoelastic
regime (L-V-
E). Amplitude sweep (strain sweep) plots of emulsion with E-476 concentration
(a) 3.0
wt% (b) 0.3 wt% and (c) 0.15 wt%. Frequency dependence of elastic modulus of
emulsion with E-476 concentration 3.0 wt%, 0.3 wt% and 0.15 wt% is represented
in (d),
(e) and (f) respectively;
Figure 14 shows confocal microscopy images and corresponding droplet size
distribution
of the W/O emulsions with GO concentration (a) 0.007 wt%, (b) 0.014 wt%, (c)
0.025 wt%
and (d) 0.052 wt%. The E-476 concentration was kept constant at 3.0 wt%;
Figure 15 shows oscillatory shear measurements in the linear viscoelastic
regime (L-V-E).
Amplitude sweep (strain sweep) plots of emulsion with GO concentration (a)
0.007 wt%
(b) 0.014 wt%, (c) 0.025 wt% and (d) 0.052 wt%. Frequency dependence of
elastic
modulus of emulsion with E-476 concentration 0.007 wt% 0.014 wt%, 0.025 wt%
and
0.052 wt% is represented in (e), (f), (g) and (h) respectively;
Figure 16 shows confocal microscopy images and corresponding droplet size
distribution
of the W/O emulsions with (a) 25 wt%, (b) 30 wt% and (c) 35 wt% concentration
of
Ammonium sulphate salt. The GO concentration and the E-476 concentration was
kept
constant at 0.007 wt% and 3.0 wt% respectively;
Figure 17 shows flow properties of the emulsion with respect to (a) E-476
concentration
and (b) GO concentration;
Figure 18 shows thermal imaging of (a) W/O emulsion without GO and (b) W/O
emulsion
with GO;
CA 03065235 2019-11-27
WO 2018/222138 PCT/SG2018/050267
- 13 -
Figure 19 shows (a) variation in the thermal conductivity of the emulsion with
respect to the
increase in the GO concentration (b) Enhancement in the thermal conductivity
of the
emulsion with increase in the GO concentration;
Figure 20 shows FITR of the ethylene diamine functionalized GO;
Figure 21 shows pristine Oil, GO mixed in Oil and fG0 dispersion in Oil;
Figure 22 shows confocal microscopy images and corresponding droplet size
distribution
of the W/O emulsions with (a) No GO (b) 0.014 wt% GO and (c) 0.1 wt% fGO;
Figure 23 shows oscillatory shear measurements in the linear viscoelastic
regime (L-V-E).
Amplitude sweep (strain sweep) plots of emulsion with GO concentration (a) No
GO (b)
0.014 wt% GO and (c) 0.1 wt% fGO;
Figure 24 shows the percentage enhancement in the thermal conductivity of the
GO
incorporated W/O emulsion with respect to the increase in the GO
concentration. At very
low concentration of GO, the enhancement is of the order of 2% only. With
increase in the
concentration, the enhancement is greater or more significant. At high(er)
concentration,
the enhancement is about 7%, which is highest withmaximum GO concentration
that can be
used to prepare emulsion;
Figures 25(a), (b), and (c) show images of GO particles after pulse grinding.
Figure 26 shows a VoD trace from Example 4 of ANE Gold DC, with no GO, density
0.95g/cc;
Figure 27 shows a VoD trace from Example 4 of ANE Gold DC, with 0.25% w/w GO,
density 0.95g/cc; and
Figure 28 shows Differential Scanning Calorimetry (DSC) results from Example
5,
corresponding to a commercially available W/O emulsion explosive product
without GO
CA 03065235 2019-11-27
WO 2018/222138 PCT/SG2018/050267
- 14 -
incorporated and blended therein as an additive, and with GO incorporated and
blended
therein as an additive at 5 wt% GO.
Detailed description of the Invention
Overview of Graphene Oxide and Emulsions
With respect to emulsions, a surfactant has an amphiphilic nature. Graphene
oxide, which
can present as an oxidized single sheet of graphite, has oxygen containing
hydrophilic
edges and hydrophobic graphitic patches at its basal plane, making it an
amphiphile.
Graphene oxide can act as an emulsifier or surfactant and stabilize oil-water
emulsions.
In addition to stability, graphene oxide provides high thermal conductivity to
an emulsion
because of the presence of an oxygen group which increases phonon scattering.
As
disclosed herein, graphene oxide can be a useful surfactant in emulsion
explosives.
Partially oxidized graphene sheets possess hydrophilic surface groups such as
carboxylic
acid and epoxies, but also exhibit hydrophobicity from the remaining sp2
domains. These
nanosheets can be engineered to remain at the interface of
hydrophobic/hydrophilic
liquids like oil-water and exhibit surfactant-like properties and may lead to
the formation
of emulsions. How the microstructure of the emulsion evolves can depend upon
conditions
such as concentration of the graphene sheets, degree of oxidation, pH, ionic
concentration
and hydrophobicity of the oil phase. The evolution of the microstructure can
be indicated
by the rheological measurement of emulsion. The high thermal conductivity of
graphene
oxide can be useful emulsion explosives or emulsion explosive compositions,
e.g., in oil-
water emulsion explosive compositions, or other compositions where fluids are
useful or
used for heat exchange process.
The majority of industries that use emulsions, such as the food,
pharmaceutical, cosmetics,
petroleum product, and mining industries, utilize highly concentrated
emulsions in various
applications in a variety of applications or technical fields. Especially the
mining industries
use highly concentrated emulsions to a great extent. Keeping that in mind, a
highly
concentrated emulsion explosive composition having high thermal conductivity,
e.g.,
which can be provided by way of the use of graphene oxide as an emulsifier or
surfactant
therein, offers new possibilities in emulsion explosives applications,
including for purpose
of affecting, managing, or controlling heat exchange and associated processes.
CA 03065235 2019-11-27
WO 2018/222138 PCT/SG2018/050267
- 15 -
Use of graphene oxide as disclosed here can advantageously enhance the thermal
conductivity of emulsion explosives. Such use can also enhance emulsion
explosive
detonation performance as well as stabilize emulsion explosives.
The components or ingredients used in an emulsion explosive are mainly an oil
mixture
and water, with added oxidizer ammonium nitrate. Emulsifier is added along
with the oil
mixtures such as sorbitan mono oleate. The commonly used sources of hot spots
in
emulsion explosives are voids, which can include or be gas bubbles, glass
micro balloons
(GMB), and/or small hollow microspheres of resinous materials such as phenol-
formaldehyde and urea formaldehyde.
A drawback of using the voids is that the explosive density is reduced with
consequent
reduction in bulk energy. For instance, the condensed phase of most emulsion
explosive
premix, before gassing, has a density of about 1.4 g/cm3. However, in
practice, the
emulsion explosives produced for small diameter applications have densities
less than 1.1-
1.2 g/cm3 or a reduction of 15-20%.
The conveyance or transportation of an emulsion explosive composition across
significant
or long(er) distances, as well as the storage of an emulsion explosive
composition over a
significant period of time, requires long term stability of an oil-water
emulsion that forms
the basis of the emulsion explosive composition. Thus, a need exists for an
emulsifier or
surfactant that can stabilize the droplets for a significant, long, or very
long duration.
Graphene oxide, which has high aspect ratio and is an amphiphile with atomic
level
colloidal effect, adsorbs to the droplets in an emulsion explosive composition
at very low
concentration. Graphene oxide can enhance the stability of or make a stable
emulsion
explosive composition, which can last for months without any physical or
chemical
changes.
Another emulsion explosive composition parameter for which graphene oxide is
relevant is
the velocity of detonation (VOD). The typical VOD of emulsion explosives is
about 5
km/s, and it varies with the composition of the emulsion. The high thermal
conductivity of
graphene oxide can result in or generate high VOD due to high phonon transfer.
Hence,
CA 03065235 2019-11-27
WO 2018/222138 PCT/SG2018/050267
- 16 -
due to its high thermal conductivity, graphene oxide can be utilized to
generate or aid the
generation of hot spots via heat transfer from the hot reaction products to
the material in
the pre-reaction zone. The heat transferred by the graphene oxide heats up the
emulsion
explosive around the graphene oxide sheets, i.e. graphene oxide forms the hot
spots by a
heat conduction mechanism. Thus, the addition of graphene oxide can, in
effect, increase
the number of hot spots, which leads to enhanced detonation performance. Here,
the
effective number of hot spots can be increased without compromising the
density of the
system. This can improve the VOD of an emulsion explosive composition, with
less
reliance on void generated hot spots. Therefore, the graphene oxide (e.g.,
graphene oxide
sheets), if incorporated uniformly and efficiently into the emulsion matrix,
can improve the
detonation performance of emulsion explosives.
An emulsion is a class of colloids and can be defined as the dispersion of one
liquid into
another; both are immiscible when combined. In an emulsion, one liquid tends
to remain in
the other liquid in the form of droplets in presence of one or more (surface-
active agents)
surfactants. The liquid, which is in the form of droplets, is called the
dispersed phase (or
internal phase); the liquid in which it is dispersed is called the continuous
phase (or
external phase).
Emulsions are generally made up of two immiscible liquid phases for which the
surface
tension is nonzero. They involve other hydrophilic-like or lipophilic-like
fluids in the
presence of suitable surface-active species, each phase being possibly
composed of
numerous components.
Emulsions are generally formed when two immiscible liquids are subjected to
mechanical
energy such as when a high shear force is applied or when they are
ultrasonicated. When
an external force such as a high shear is applied to a two-phase liquid, one
phase fragments
in the form of droplets and gets dispersed into the other phase. Being a class
of colloids, an
emulsion also exhibits the same behaviour as that of a colloid; one is
Brownian motion of
dispersed droplets and another is coalescence which leads to emulsion
destruction.
Depending on the amount of droplets present, the volume fraction of droplets
ranges from
zero to almost one. The emulsion is then described as being 'dilute' or a
'highly
concentrated emulsion'. Similarly, if the emulsion is strongly diluted, the
droplets exhibit
CA 03065235 2019-11-27
WO 2018/222138 PCT/SG2018/050267
- 17 -
the Brownian motion; from then on the emulsion behaves as a viscous Newtonian
fluid. On
the other hand, if the emulsion is concentrated at, for example, 64% of
dispersed droplets
then the emulsion behaves as a visco-elastic solid.
An important parameter used to describe emulsions is the volume fraction, 0.
It is the ratio
of volume of the inner to the outer phase. For example, for spherical droplets
of radius 'a',
the volume fraction is given by the number density, 'n' times the spherical
volume, 0 = 47c
a3n/3. Many physical properties of emulsions can be characterised using volume
fraction 0.
The emulsion is stabilised or in other words the droplets are retained using a
third
component known as an emulsifying agent or emulsifier. An emulsifier can be a
surfactant
(surface-active reagent), macromolecules or a finely-divided solid. The
selection of the
emulsifier is of utmost importance for the formation of a stable emulsion. The
choice of
emulsifier affects the type of the emulsion formed, its long-term stability
and the rheology
of the emulsion.
Pickering emulsions are solid-stabilized emulsions where solid particles
minimize the
interfacial energies of two immiscible liquids by their amphiphilic nature.
Depending on
the amount of hydrophilic groups with respect hydrophobic groups, the emulsion
can be
oil-in-water or water- in-oil. This is characterized by the hydrophilic to
lipophilic (or
hydrophobic) balance measurement abbreviated as HLB. The HLB number is a
relative
percentage of hydrophilic to lipohilic (hydrophobic) groups in the surfactant
molecule, and
value of the HLB number is between 0 and 20. These are assigned first on a one-
dimensional scale of surfactant action after which, each surfactant is rated
according to this
scale.
Graphene oxide (GO), the oxygenated derivative of graphene, is predicted to
behave as a
surfactant stabilizing water, oil phases. This analysis is based on the fact
that GO is an
amphiphile with hydrophilic oxygen functionalized edges and hydrophobic
graphitic
patches on the basal plane. Until now, most reports have focused on producing
oil-in-water
(o/w) emulsion using graphene oxide (GO) as a surfactant. While there are a
few papers
which reports water-in-oil (w/o) emulsion using GO as a surfactant, the focus
of such
papers is on producing unique structured GO like hollow or nano spheres. The
preparation
CA 03065235 2019-11-27
WO 2018/222138 PCT/SG2018/050267
- 18 -
of w/o emulsion is based on alkaline dispersion medium of GO. Additionally,
there are
reports which mention the presence of double emulsions like w/o/w emulsions
along with
the o/w emulsions produced.
Fully oxidized graphene oxide is electrically insulating because of disrupted
sp2 bonding
networks. But in reality, graphene oxide conductivity varies from insulator to
semiconductor depending on the extent of oxidation and applied electric field.
The
electrical conductivity can be restored to greater amount by restoring it-
network, achieved
by reducing graphene oxide.
Graphene can be reduced chemically, thermally and electrochemically reduced
depending
on environment in which it is reduced to remove the oxygen functionality in
its structure.
Chemically, graphene oxide can be reduced by using strong reducing agents such
as
hydrazine monohydrate. Graphene oxide can also be reduced by heating it at
very high
temperature in inert atmosphere. The electrochemical reduction involves the
transfer of
reduced graphene on one of the electrodes while oxygen groups retain in the
electrolyte.
The electrochemical reduction yields high carbon- to-oxygen ratio which will
give high
electrical conductivity compared to other two methods. These days there are
several other
methods which are reported to reduce graphene oxide effectively like green tea
reduction,
biochemical reduction and many more.
The mechanical properties of graphene oxide are less pronounced compared to
pristine
graphene having good elastic properties and breaking strength. This is because
of the
presence of defects and distorted layers in graphene oxide assembly. These
defects and
graphite impurities direct the flow of stress transfer and breaking strength
decreases.
However, with possible functionalization and self assembly of graphene oxide
sheets can
improve the mechanical properties of graphene oxide to a greater extent.
The nanometer size of graphene oxide makes it optically transparent; however,
the
transparency decreases with the increase in number of stacks. A single layer
of graphene is
optically transparent with 97.7% constant transparency in the visible range.
On the other
hand, a single layer of graphene oxide is less transparent because of the
presence of oxygen
groups and defects causing light absorption.
CA 03065235 2019-11-27
WO 2018/222138 PCT/SG2018/050267
- 19 -
The presence of hydrophilic functional groups makes it a soft material and
allows its
dispersion into solvents like water. The dispersion of graphene oxide in water
acts as a
solvent to dissolve other carbon compounds not soluble in water by the
presence of
graphitic domain which makes 7C- bonding with other carbon materials. Also,
the high
aspect ratio of graphene oxide allows orientational ordering making it a
liquid crystal. The
amphiphile structure of graphene oxide not only allows further possibilities
for dissolving
carbonaceous material and compounding them but also allows it to act as a
surfactant to
stay at the interface of organic-inorganic liquid mixture.
The thermal conductivity of graphene oxide is higher compared to that of a
pure graphene.
The reason is the presence of defects and oxygen functional groups provides
extra phonons
for the transfer of thermal energy. The thermal conductivity of graphene oxide
is mostly
dominated by the phonon transport rather than electron transport as the
carrier density is
very low.
When thermal conductivity of graphene is compared, the in-plane thermal
conductivity of
graphene at room temperature is among the highest of any known material, about
2000-
4000 W m-1 K-1 for freely suspended samples. Functionalization of graphene
will introduce
more phonons and increase in thermal conductivity. This is the case when
thermal
conductivity of graphene oxide is considered in comparison to graphene.
In graphene oxide, the carrier density is very low as compared to graphene. As
a result, the
electronic contribution to thermal conductivity is negligible. So for graphene
oxide one can
say that the thermal conductivity is dominated by phonon transport, namely
diffusive
conduction rather than ballistic conduction for graphene.
A single layer graphene has high thermal conductivity than few layer graphene.
The
introduction of one or more layers will reduce the thermal conductivity
significantly and
sometimes approaches to that of bulk graphite. The effect of interlayer
spacing on thermal
conductivity is also pronounced. This combination of number of layers and
interlayer
spacing will decide the change in thermal conductivity.
CA 03065235 2019-11-27
WO 2018/222138 PCT/SG2018/050267
- 20 -
Increase in interlayer spacing and presence of oxygen groups enhances phonon
scattering.
The increase in thermal conductivity of graphene oxide can be attributed to
the increase in
the interlayer coupling due to covalent interactions provided by oxygen atoms.
Disclosed herein is the synthesis and properties of water-in-oil emulsions, in
particular
emulsion explosives or emulsion explosive compositions, using partially
reduced GO, and
the effects of parameters such as pH, temperature, and salt concentration on
the stability of
the emulsion explosive composition. Some embodiments of emulsion explosive
compositions in accordance with the present invention provide a highly
concentrated
emulsion having volume fraction of the aqueous phase greater than 0.74.
Characterizations
like XPS, FTIR and Raman were performed for the GO. Additionally, droplet size
analysis
through Confocal microscopy image processing was done to characterize the
emulsions
and determine their stability. In various embodiments, a W/O emulsion in
accordance with
the present disclosure is metastable, and can be stable for 10 - 20 days from
the day of its
formation. The de-stabilization pattern of representative W/O emulsions was
observed and
analyzed using time-dependent droplet size distribution. The de-stabilization
data was
fitted with Coalescence and Ostwald ripening models and further explained
using
Coalescence dynamics. Further, to improve the stability of the W/O emulsion,
PIBSA-
based emulsifier was used along with GO. Stability analysis of the W/O
emulsion
synthesized using the emulsifier and GO indicated enhanced stability with
finer droplet
size distribution and improved rheological properties in comparison to that of
the emulsion
with only GO. Particular embodiments in accordance with the present disclosure
also
exploited the good thermal properties of GO. An emulsion explosive composition
prepared
with GO in accordance with an embodiment of the present disclosure will have
better
thermal conductivity (e.g., by up to 13.5%, or between 2.5% - 13.5%, or
between 5% -
13.5%, or 7% up to 13.5% depending upon embodiment details) than an otherwise
equivalent emulsion explosive composition that lacks GO.
CA 03065235 2019-11-27
WO 2018/222138 PCT/SG2018/050267
- 21 -
Transient Stability of W/O Emulsion using Partially Reduced Graphene Oxide as
the
Emulsifier
Graphene Oxide (GO), the oxygen-derivatized Graphene, has been an interest of
study as a
surfactant from last few years. Variety of reports have studied on different
aspects of GO
as a surfactant, from parameter dependent stabilization with parameters like
pH, oil volume
fraction, salt concentration etc to the application of the GO stabilized
emulsion as a
template for hollow or porous microstructures.
Most of these reports were focused on the stabilization of an oil-in-water
(0/W) emulsion,
e.g., because GO being more hydrophilic disperses well in water. Following
Bancroft' s
rule (B.P. Binks, Modern Aspects of Emulsion Science, 1997), GO stabilizes oil
droplets in
the water continuous phase, making an 0/W emulsion. Out of these reports, the
studies
have been limited to the understanding microscopy, rheology and supercapacitor
properties
of the 0/W emulsion stabilized by GO.
There are very few reports on the preparation of water-in-oil (W/O) emulsion.
The
formation of hollow GO via W/O emulsion route has been reported. The
underlying
mechanism has been proposed as being the self-assembly of GO sheets due to the
flocculation at basic pH, preparation of hollow spheres for Li-ion
applications was the
main focus. A W/O emulsion has also been synthesized by functionalizing GO
using
CTAB. CTAB generates long hydrogen chain on GO, making it more hydrophobic and
it
disperses in oil making high internal phase emulsion (HIPE). However, in these
works the
focus was limited only to certain after applications of the synthesized W/O
emulsion. The
colloidal aspects of the W/O emulsion stabilized by GO, still remained
untouched viz. the
effect of parameters like oil phase volume fraction, GO concentration, and
extent of
oxidation in GO, on the maximum stable emulsion volume. In addition, there is
no
specific study to date on the stabilization of W/O emulsion by reduction of GO
and change
in the Hydrophilic-to-Lipophilic Balance (HLB).
In some embodiments the invention is directed to the synthesis and properties
of W/O
emulsion stabilized using partially reduced GO (prGO), and the effect(s) of
parameters like
prGO concentration, extent of reduction of GO, and oil phase volume fraction.
The W/O
emulsion stabilized by prGO attains its maximum stability by optimizing the
above
CA 03065235 2019-11-27
WO 2018/222138 PCT/SG2018/050267
- 22 -
parameters, and in various embodiments it destabilizes within 20 days,
indicating it is a
metastable emulsion. The cause of the metastability was carefully analyzed and
explained
using microscopy, rheology and electrical conductivity as settling followed by
coalescence.
Settling arises due to non-dispersion of prGO in oil which follows coalescence
by collision
of nearby droplets. The study results herein use a simple approach of partial
reduction to
stabilize W/O, and extends the effect of parameters on the emulsion stability,
both of
which are not previously studied.
Details relating to the stability of W/O emulsion prepared by using partially
reduced
Graphene Oxide are outlined in Example 1. With partial reduction, more
hydrophobic
domains exposed to the hydrocarbon Oil phase which changes the Hydrophillic-to-
Lipophillic Balance (HLB) and ultimately the wettability of the Graphene
Oxide. This
enables the synthesis of a W/O emulsion instead of 0/W emulsion by pristine
Graphene
Oxide. The stability was monitored with the change in the parameters like
extent of
reduction, concentration of Graphene Oxide and the continuous phase volume
fraction.
Further, the synthesized W/O emulsion is metastable in behavior with stability
to or until
days from the day of its synthesis. The instability mechanism was tested using
time
dependent electrical conductivity and droplet size distribution of confocal
imaging. The
non-dispersion of partially reduced Graphene Oxide in the Oil phase leads to
sedimentation
20 of prGO coated water droplets. The sedimentation is followed by the
Coalescence of the
droplets due to insufficient surface coverage because of compression.
Thermal Conductivity Enhancement of the W/O Emulsion by Graphene Oxide
Thermal conductivity enhancement by Graphene oxide (GO) incorporation in the
water-in-
oil (W/O) can be useful in applications or technologies that utilize or
require efficient heat
transfer like emulsion explosives. Herein, W/O emulsion is synthesized using
PIBSA-
based emulsifier (E-476) along with GO by dispersing GO in the aqueous phase
and
thermal conductivity of the resultant emulsion was explored and compared with
that of the
emulsion prepared without using the GO. It was found that GO being an
amphiphile
.. competes with the emulsifier E-476 to get to the water/oil interface. This
makes it
inhibit the emulsifier action, increase the refinement time, widens the
droplet size
distribution. The critical cross over point where elastic-to-viscous
transition occurs
decreases with increase in GO concentration and increases with the increase in
E-476
CA 03065235 2019-11-27
WO 2018/222138 PCT/SG2018/050267
-23 -
concentration. While the GO at the interface inhibits the emulsifier action,
it increases
the thermal conductivity of the emulsion. An emulsion with GO showed higher
thermal
conductivity than the emulsion without GO. This increase can be attributed to
the high
thermal conductivity of the GO. The thermal conductivity enhancement was
verified by IR
images from a thermal camera. The rise in thermal conductivity of the emulsion
can also
be attributed to the GO being at the interface.
As described in Example 2, highly concentrated W/O emulsions were prepared
with GO
and E-476 emulsifier. Stability as well as rheology of the emulsion were
examined using
confocal imaging and oscillatory measurements along with varying the E-476 and
GO
concentration. It was observed that GO and E-476 in the emulsion compete to go
to
interface and minimize the interfacial energy of the aqueous phase: fuel blend
system.
This makes the emulsification refining of droplets difficult leading to the
formation of
large droplets and introduces polydispersity. GO being an amphiphile, is a
strong
surfactant to stabilize water-oil interface. The inhibition action of GO
deteriorates the
rheological properties by making the emulsion flow at low stress-strain
values. This also
indicates the presence of the GO at the interface. Though GO affects the
stability and
the rheology, it performs well in increasing the thermal conductivity of the
emulsion. GO
at the interface enhances the thermal conductivity of the emulsion up to 7% at
the
maximum concentration of GO that can be employed in the emulsion.
Amine Functionalization of GO and Incorporation in Emulsion Explosive
Functionalization chemistry of the Graphene Oxide (GO) is widely known. A
variety of
reports have studied on different aspects of GO as a surfactant, from
parameter dependent
.. stabilization with parameters like pH, oil volume fraction, salt
concentration etc to the
application of the GO stabilized emulsion as a template for hollow or porous
microstructures.
Most of these reports were focused on the stabilization of an oil-in-water
(0/W) emulsion.
GO being more hydrophilic disperses well in water. Following Bancroft's rule,
GO
stabilizes oil drops in the water continuous phase making an 0/W emulsion. Out
of these,
studies have been limited to the understanding microscopy, rheology and
supercapacitor
properties of the 0/W emulsion stabilized by GO.
CA 03065235 2019-11-27
WO 2018/222138 PCT/SG2018/050267
- 24 -
There are very few reports on the preparation of water-in-oil (W/O) emulsion
using GO.
The formation of hollow GO via W/O emulsion route has been reported. The
underlying
mechanism has been proposed to be the self-assembly of GO sheets due to the
flocculation at basic pH, preparation of hollow spheres for Li-ion technology
was the
main focus. A W/O emulsion has also been synthesized by functionalizing GO
using
CTAB. CTAB generates long hydrogen chain on GO, making it more hydrophobic and
it
disperses in oil making high internal phase emulsion (HIPE). However, in these
works the
focus was limited only to certain after applications of the synthesized W/O
emulsion. The
colloidal aspects of the W/O emulsion stabilized by GO, is still untouched
viz, the
effect of parameters like oil phase volume fraction, GO concentration and
extent of
oxidation in GO, on the maximum stable emulsion volume. In addition, there has
been no
specific study on the stabilization of W/O emulsion by reduction of GO and
change the
Hydrophilic-to-Lipophilic Balance (HLB).
Some embodiments of the invention focus on the synthesis and properties of W/O
emulsion
stabilized using partially reduced GO (prGO), extending to effecting
parameters such as
prGO concentration, extent of reduction of GO and oil phase volume fraction.
The W/O
emulsion stabilized by prGO attains its maximum stability by optimizing the
above
parameters, and it destabilizes within 20 days indicating it is a metastable
emulsion. The
cause of the metastability was carefully analyzed and explained using
microscopy,
rheology and electrical conductivity as the settling followed by coalescence.
Settling
arises due to non-dispersion of prGO in oil which follows coalescence by
collision of
nearby droplets. Results disclosed herein use a simple approach of partial
reduction to
stabilize W/O and extend the effect of parameters on the emulsion stability,
both of which
have not been previously studied.
Highly concentrated W/O emulsions were prepared with fG0 and E-476 emulsifier
in
Example 3. Stability as well as rheology of the emulsion were examined using
confocal
imaging and oscillatory measurements along with varying the E-476 and fG0
concentration. It was observed that fG0 and E-476 in the emulsion competes to
go to
interface and minimize the interfacial energy of the aqueous phase: fuel blend
system.
This makes the emulsification refining of droplets difficult leading to the
formation of
CA 03065235 2019-11-27
WO 2018/222138 PCT/SG2018/050267
- 25 -
large droplets and introduces polydispersity. fG0 being an amphiphile, is a
strong
surfactant to stabilize water-oil interface. The inhibition action of fG0
deteriorates the
rheological properties by making the emulsion flow at low stress-strain
values. This also
indicates the presence of the fG0 at the interface. Though fG0 affects the
stability and
the rheology, it performs well in increasing the thermal conductivity of the
emulsion. fG0
at the interface enhances the thermal conductivity of the emulsion up to 13.5%
at the
maximum concentration of fG0 that can be employed in the emulsion.
The present invention will herein after be described with reference to the
following non-
limiting examples.
Examples
Example 1
Materials and methods
Canola oil was obtained from Orica Mining Services Pty. Ltd., Australia. Being
a
proprietary information, complete chemical structural information is not
provided by the
supplier. The graphite flakes was purchased from Sigma-Aldrich (99.95%
purity).
Synthesis of graphene oxide and partially reduced graphene oxide
GO was synthesized using Hummers' method. In this method, 2.0 gm of graphite
flakes (Sigma-Aldrich 99.95%) and 1.0 gm of the salt NaNO3 (Merck 98.5%) were
mixed
with 46 ml of concentrated H2504 (Merck 98%) in a 500 ml beaker and stirred on
ice
bath for 15 min. The temperature of the ice bath was maintained at 0 C. Then,
6.0 gm of
KMn04 (Merck 98.5%) was added maintaining the reaction temperature at 20 C
with
continuous stirring. The stirring was continued for 2 h at 35 C. The mixture
turned into
black gel type slurry eventually during the stirring. Exactly, 100 ml of DI
water (18.2
MX-cm) was slowly added leading to huge exothermic reaction and the
temperature rose to
98 C. The reaction temperature was kept at 98 C for 30 min. Now, the bath was
removed
and the mixture was allowed to cool to room temperature. After cooling, around
12 ml
of H202 (Merck 30% purified) was added until the color of the mixture changed
to
golden yellow and more of DI water was added. The mixture was centrifuged at
4000 rpm
CA 03065235 2019-11-27
WO 2018/222138 PCT/SG2018/050267
- 26 -
for 2 h and supernatants were decanted away. The residual material was washed
3-4
times with 10% HC1 to remove the metal ions and finally with DI water till it
attains a pH
value between around 5. The dispersion was filtered using whatmann filter and
solid was
dried in vacuum for 4h at 50 C and finally a brown colored GO powder was
produced.
Thermal reduction: As-synthesized GO was dispersed using a probe sonicator for
5
minutes and centrifuged at 12000 rpm for 15 min. The supernatants were
decanted away.
The GO dispersion was filtered in a vacuum filter using Cellulose Acetate
filter paper. The
filtrate along with the filter paper was placed in a petry dish containing
commercial grade
Acetone. Acetone dissolves the filter paper and GO filtrate in form of a paper
was
separated. This GO paper was placed on a Teflon sheet in a petry dish and
heated in a
vacuum oven at 300 C temp for 24 hours. For emulsion preparation, this GO
paper was
used.
Preparation of water-in-oil emulsion using graphene oxide
GO paper was dispersed in 8 ml DI water with a concentration of 1 mg/ml by
ultrasonicating for 30 min. The pH of GO emulsion is maintained at 6. This
dispersion
was heated to 65 C temp on a water bath. 2 ml of Canola oil is taken in a 100
ml beaker
and heated to 90 C temp on a hot plate. Hot Canola oil was stirred at 600 rpm
using a high
shear mixer and GO dispersion was added to it slowly. The addition was done in
such a
way that entire 8 ml of GO was fully added within 1 minute. The stirring was
continued
for next 2 minutes. Further, the shearing speed was increased to 1400 rpm and
the mixer
was stirred for next 2 minutes. At the end of the stirring, yellowish white
paste like
emulsion is obtained.
Characterization
The as-synthesized graphene oxide and partially reduced powder was dispersed
in DI
water and ultrasonicated for 30 minutes to get uniform dispersion. For Raman
spectroscopic analysis, XPS and FTIR (on KBr pellet); the dispersion was drop
casted
on a glass slide, heated at 50 C temperature in vacuum for 4 hours and was
used for the
analysis.
CA 03065235 2019-11-27
WO 2018/222138 PCT/SG2018/050267
- 27 -
Raman spectroscopic analysis
Raman spectroscopic analysis was performed using a HR 800 micro-Raman (HORMA
Jobin Yovon, France) on as received. The scanning range was from 1000 to 1800
cm-1
with incident laser excitation wavelength of 514 nm.
Fourier transform infrared spectroscopy (FTIR)
FTIR investigations were carried out on 3000 Hyperion Microscope with Vertex
80 FTIR
System. The samples were prepared by depositing the dispersion on KBr pellets
and
drying the pellets in vacuum.
X-ray photoelectron spectroscopy (XPS)
The XPS analysis was performed using Twin anode (MgKa/ZrLa) 300 W and
Microfocused monochromatic concentric hemispherical analyzer (CHA). The drop
casted samples of both graphene oxide and reduced graphene oxide were used to
obtain
the raw data which was further deconvoluted to fit different peaks
corresponding to
different functional groups.
Scanning electron microscopy in cryo-mode
The droplet fracture morphology was investigated using FEG-SEM (JSM-7600F) and
cryo
preparation system (PP3000T). The cryo preparation system features Variable
temperature
conduction cooled specimen stage (-185 C to 50 C) and Gas-cooled nitrogen cold
stage
assembly (-192 C to 50 C). About 2-3 drops of emulsion sample was placed on a
copper
crucible and was freezed using liquid nitrogen. The freezed sample was
introduced into
the SEM chamber and fractured using an attached knife in the chamber. Finally,
the
fractured sample was transferred to the cooled specimen stage to observe the
microstructure.
Transmission electron microscopy in cryo-mode
prGO encapsulation on the water droplets was investigated using JEM 2100 ultra
HRTEM,
a cryo mode facility with cryo specimen holder. The sample was prepared in
cryo mode.
For this, a drop of emulsion sample was cast on a holey carbon grid and was
plunge-
frozen using cryo plunger (Gatan Inc.). Frozen-hydrated specimens were
transferred to
CA 03065235 2019-11-27
WO 2018/222138 PCT/SG2018/050267
- 28 -
TEM via cryo transfer unit under liquid nitrogen. The frozen samples were
imaged
using a FEI Vitrobot equipped with a LaB6 filament operating at 200 kV.
Fluorescence imaging
The fluorescence imaging was carried out using Olympus IX 81 (combined with FV-
500)
confocal laser scanning microscope using the emulsion having prGO, mildly
functionalized with Fluorescein isothiocyanate (FITC). FITC was loaded on prGO
by
sonication of FITC solution (0.05wt%, 10 ml) in DI water with prGO dispersion
(0.5
mg/ml, 10 ml) followed by overnight stirring in dark. Unreacted FITC was
removed by
centrifugation at 6000 rpm for 2 hrs. The obtained FITC functionalized prGO
was
further used for W/O emulsion preparation. The sample preparation was done
using the
similar approach as of the confocal microscopy analysis. The images were taken
in the
fluorescence mode by setting the absorbance around 519 nm wavelength
corresponding to
the excitation wavelength of the FITC.
Confocal laser scanning microscopic analysis
Confocal micrographs were obtained using Olympus IX 81 (combined with FV-500)
confocal laser scanning microscope at magnification of 100X. A drop of the
emulsion was
placed on a glass slide and immediately covered with a covering slide to get a
thin layer
of emulsion between the glass slides. The samples could cool prior to
observing and
photographing under the microscope. A drop of type-F immersion oil (n=1.518 at
23 C) was applied on the lens to improve the resolution. The microscopic
analysis was
carried out at within 24 hours of emulsion preparation to prevent improper as
the de-
stabilization starts after preparation. The diameter of individual droplets in
the
.. emulsion samples were measured using the software ImageJ 1.47v (National
Institute
of Health, USA). The diameters of at least 100 droplets from each system were
measured
and the data were numerically processed to obtain droplet-size distribution.
Polarized light microscopic analysis
Polarized light micrographs were obtained using Leica Abrio imaging system
from CRI
Inc. The samples for imaging were prepared by placing minute droplet of the
emulsion
on the glass slide and covering with a cover slip. A little pressure is
applied to the cover
slip to squeeze the sample for uniform distribution of the sample and to
reduce the
CA 03065235 2019-11-27
WO 2018/222138 PCT/SG2018/050267
- 29 -
sample thickness in order to allow the light to transmit from opaque sample.
Before
imaging the sample, a background is taken.
State of oxidation of graphite and the partial reduction of graphene oxide
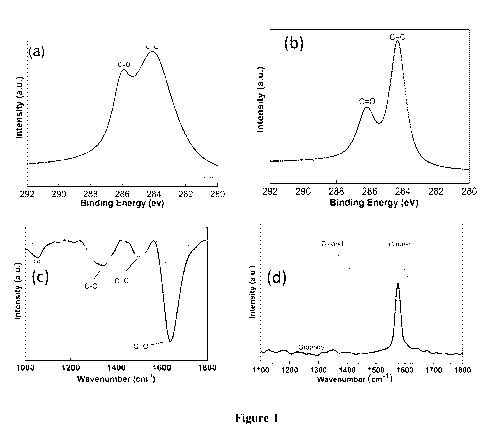
In Figure 1 (a) and (b), The XPS spectra were fitted to different peaks
corresponding to sp2
carbon (C=C) and carbonyl (C=0) functional groups. It can be observed that
there is a
decrease in the intensity of peak corresponding carbonyl functional group in
case of
partially reduced GO. This indicated that partial reduction has removed some
of the
carbonyl groups along with the hydroxyl groups (as can be depicted from FT1R)
giving
more sp2 carbon in the vicinity of interaction.
The reduction in carboxyl and carbonyl groups was confirmed by the FT1R
spectroscopy
as shown in Figure 1 (c). The thermal dissociation of oxygen groups is clearly
indicated in
the reduced transmitted intensity of C-0 groups which corresponds to ¨COOH and
¨
COOR groups. Also, the thermal reduction of GO will remove some of 0-H and ¨0-
bonds at the basal plane. This reduction will expose more aromatic islands at
the basal
plane indicated by the C=C bonds at the basal plane which can be confirmed
from the C=C
stretching at ¨1634 cm-1. Some hydrophilic groups at the edges are present as
indicated by
C-0 stretching at 1344 cm-1. In Figure 1 (d), the G band will shift to lower
frequency from
1593 cm-1 to 1581 cm-1. In reality, the complete reduction is exhibited in
form of higher
intensity of G band where intensity of D band decreases as compared to G band.
This is
because more sp2 carbon comes in the vicinity and interacts to give G band
intensity.
Herein, the partial reductions will not only expose the sp2 carbon but also
there is breaking
and rupturing of GO sheets leads to increase in more amorphous region and
hence the
higher intensity D band along with the G band shift.
Stabilization of oil-water phases using graphene oxide (oil-in-water) and
partially
reduced graphene oxide as surfactant (water-in-oil)
Figure 2 shows the contact angle of a GO and prGO films treated under
different solvents.
GO and prGO (thermally reduced GO sheets), were deposited onto a glass film by
drop-
casting. The contact angle of rGO was obtained as 43.9 , 25.3 , 24.0 and
115.3 for GO,
prGO. It is believed that the GO film has hydroxyl and carboxyl groups
attached to the
sheet edges, thus rendering GO relatively hydrophilic with a contact angle of
25.3 , which
CA 03065235 2019-11-27
WO 2018/222138 PCT/SG2018/050267
- 30 -
is attributed to the remaining oxygen content, as verified in the XPS and IR
data. Here we
hypothesized that a decrease in oxygen content would maximize hydrophobicity.
First, the
water contact angle is increased to 115.3 on the film of prGO from 25.0 of
the plain GO
film.
The partial reduction of GO gives more hydrophobic C=C bonds exposed to the
water and
oil interface, in comparison to that of hydrophilic C-0 and C=0 bonds. This
increases the
HLB value of graphene oxide and it falls in the HLB range for a water-in-oil
emulsion. This high HLB graphene oxide makes the oil to stay as continuous
phase
leading to w/o emulsion with graphene oxide encapsulating the waterphase.
As can be evident from the confocal images that pristine GO have fewer sheets
which are
more hydrophobic and can make water-in-oil emulsion. With partial reduction,
more GO
sheets are available with high HLB and makes entire volume of the water get
dispersed in
the oil continuous phase making a stable water-in-oil emulsion.
It is observed that the GO with its greater hydrophilicity wet the water
phase, get dispersed
and water makes the continuous phase. The oil droplets are stabilized in the
water with
their surface energy minimized by the GO at the interface. With increase in
HLB value,
hydrophobic domains wet the oil phase and oil forms the continuous phase
leaving water in
the form of droplets stabilized by some of the hydrophilic functional groups
on the GO
sheets. This transition from o/w to w/o is due to the change in HLB value
arises due to the
partial reduction of pristine GO.
As can be evident from the confocal images that pristine GO have fewer sheets
which are
more hydrophobic and can make water-in-oil emulsion. With partial reduction,
more GO
sheets are available with high HLB and makes entire volume of the water get
dispersed in
the oil continuous phase making a stable water-in-oil emulsion.
Moreover, with more reduction, the GO sheets will have less hydrophillicity to
stabilize
the water phase and emulsion will not form at all, leaving reduced GO sheets
at the bottom
of the vial.
CA 03065235 2019-11-27
WO 2018/222138 PCT/SG2018/050267
-31 -
As discussed before in confocal imaging, the change in HLB value will give the
water-in-
oil emulsion. The emulsion with pristine GO will hardly give a stable water-in-
oil
emulsion since GO sheets are highly hydrophillic having low HLB value
corresponding to
oil-in-water emulsion. The observed emulsion with pristine GO could be a due
to the few
less oxidized sheets taking part in emulsion formation.
An increase in reduction will lead to highly hydrophobic, unable to stabilize
the water
phase because of less or almost no hydrophillicity.
Also, it has been observed that the reduced GO sheets have low affinity to
water and are
found to be separated and some in the oil phase surrounding the water
droplets.
De-stabilization studies and coalescence dynamics of the W/O emulsion without
emulsifier
The dispersed water phase has low to high compression with high to low volume
fraction of
oil continuous. At high oil volume fraction, the water droplets are dispersed
uniformly
and are spherical in shape. With decrease in the continuous phase, the
droplets tend to
come closer and approaches adjacent to each other. At some volume fraction
when droplets
are almost touching each other, compression takes place. This compression will
lead to
droplet deformation and droplets are no longer spherical rather they take up
polygon shape
to be stable in the emulsion.
More and more compression due to lesser volume fraction, the droplets will be
compact.
With very less volume fraction of oil phase of around 10%, droplets start
breaking
and emulsion structure destructs and will no longer be stable.
The synthesized GO emulsion is stable up to 20 days from the day of its
production. The
pictures on the top gives the visual picture of how the emulsion is getting
destabilized. The
confocal images are taken on every 4th day from the day of emulsion formation
to
investigate the destabilization mechanism of the emulsion (Figure 6).
It is evident from the confocal imaging that the most prevailing de-
stabilization mechanisms
either Oswald ripening or Coalescence, details will be discussed in further
section. In this
CA 03065235 2019-11-27
WO 2018/222138 PCT/SG2018/050267
- 32 -
mechanism, the smaller droplets merge to form bigger droplets thereby
increasing the
volume of droplets. At the same time, bigger droplets combine to give a larger
mass of
droplet and eventually forming a separate phase. Physically, this can be seen
by the
appearance of water phase in the emulsion.
In general, highly concentrated emulsions are viscoelastic in nature and the
viscoelasticity is characterized by dynamic rheological measurements, where an
oscillatory shear is applied. It has been demonstrated that the typical
evolution of the storage
modulus (G') and loss modulus (G") of the freshly prepared neat emulsion with
respect to the
increase in strain amplitude at a constant frequency of 1 Hz.
It is also observed that elastic modulus is greater than the viscous modulus
in the
linear viscoelastic domain. The elastic-to-viscous transition (cross-over) of
water-in-oil
emulsion takes place at a lower value of Y* = 0.01 as compared to that of oil-
in-water
emulsion with Y* = 40.
With respect to oscillatory shear measurements at the linear viscoelastic
domain for the neat
emulsions, the elastic modulus is almost constant in a wide frequency range
covering
several orders of magnitude. In the high frequency region, the elastic modulus
drops
with increasing frequency. The wide plateau on the frequency dependence of
elastic
modulus is standard for ideal elastic materials, the elastic modulus of which
must be
independent of frequency. Hence, such kind of behavior reflects its solid like
nature.
Similar results have been reported in many earlier publications and the wide
plateau on
the frequency dependence reflects solid-like behavior highly concentrated
emulsions.
The water-in-oil emulsion shows a change in elastic modulus which can be
considered
more like a plastic behavior due to deformation, while the oil-in-water
emulsion shows
a wide plateau corresponding to elastic and solid-like region. The water-in-
oil emulsion
shows the plastic behavior rather than the elastic or solid-like behavior.
This is due to the
presence of large droplets and polydispersity which makes it deform easily at
higher angular
frequencies.
CA 03065235 2019-11-27
WO 2018/222138 PCT/SG2018/050267
- 33 -
The water-in-oil emulsion is shear thinning due to inter-droplet breakup at
higher frequencies.
This could be due to polydispersity and presence of large droplets. On the
other hand,
oil-in-water emulsion is shear thickening due to inter-droplet space and the
continuous phase.
The stability of the prGO stabilized W/O emulsions against coalescence and
phase
separation was monitored and assessed using AC electrical conductivity and
aging effect.
As shown in Figure 9, the emulsion is quite stable during first few days from
its
synthesis. This can be indicated by constant ' crAc' in the Figure. After few
days,
sedimentation of the emulsion and separation of the oil phase was observed in
prGO
stabilized emulsions as indicated by the decrease in the `crAc' due to
insulating oil phase.
Further, the sedimentation was followed by droplet break from day 8. An
increase in the
`GAC due to water phase separation indicates droplets break either by
Coalescence or
Ostwald ripening. This destabilization accelerates and the phases completely
separates by
20th day from the emulsion formation. The latter shows a sudden rise in the
`crAc' with
more and more water separates from the emulsion. This sedimentation of
droplets and
rapid separation of the water phase seen in the prGO stabilized emulsions
indicate two
likely possibilities: a) droplets are experiencing sedimentation due to a
density difference,
with or without any change in droplet size and b) the droplets are coalescing
due to
insufficient surface coverage arises due to compressed droplets in the
sedimentation.
The assessment of the second destabilization mechanism after sedimentation was
done using
time- dependent non-linear size distribution obtained from the confocal images
with
aging. The average droplet size distribution curve shows a non-linear rapid
decay in the
average population of the droplets. This rapid decay can be attributed to the
prevalence of
coalescence phenomena over the Ostwald ripening.
With surface layer thinning due to compression, droplets of similar sizes
coalesce to
form large drops. This fact gives rise to the wider distribution with time,
which can be
indicated by the widening of the distribution curve along with the decay in
the population
of smaller droplets in the same volume of the emulsion. This results clearly
indicates the
Coalescence to the prevailing destabilizing mechanism in the destabilization
of the
prGO stabilized W/O emulsion. Further, the sauter mean diameter curve in the
Figure
CA 03065235 2019-11-27
WO 2018/222138 PCT/SG2018/050267
- 34 -
11, supports the argument of Coalescence destabilization in the prGO
stabilized W/O
emulsion.
Example 2
Materials and methods
Canola oil and E 476 emulsifier were obtained from Orica Mining Services Pty.
Ltd.,
Australia. E476 is composed of ester, amide and salt components. Other
ingredients
for the emulsion preparation such as Ammonium Sulphate (M=132.14 g/mol,
Purity>
99.5%) was provided by Amresco Inc. GO was synthesized using Hummers' method
as
mentioned in earlier section.
Synthesis of the W/O emulsion with E-476
The W/O emulsion with E-476 was prepared with three different compositions
involving
aqueous phase and the fuel blend. The aqueous phase was a dispersion of GO in
DI water.
The fuel blend is the mixture of Canola oil and E-476. The total composition
of the
emulsion involved 90 wt% of the aqueous phase and 10 wt% of the fuel blend.
While the
aqueous phase was kept constant with 35% of the salt, the fuel blend was
varied as per the
variation in the emulsifier E-476 and the GO concentration. For the
preparation of 100 gms
of the W/O emulsion, GO was dispersed in required amount (of composition) in
DI water
and the emulsifier E-476 was dispersed in Canola oil such that total fuel
blend
composition becomes 10 wt% of the total emulsion.
For parameter dependent study, the composition was varied keeping the total
weight ratio
of the aqueous phase and fuel blend constant. Initially, the ratio of the
aqueous phase to
the fuel blend was kept constant for few samples of varying concentration of
GO,
emulsifier and the salt. Then, the ratio was changed with again varying the
concentration of
the ingredients as mentioned before. For example, for a 90:10 w/w ratio of
aqueous phase to
fuel blend, 0.007 wt% of GO was dispersed in 55 wt% of DI water and 1.5 wt% of
emulsifier E-476 was dispersed in 8.493 wt% of Canola oil.
Once the compositions were taken, aqueous phase was stirred and heated till 60
C temp
attained. Stirring is needed to avoid flocculation of GO. On the other hand,
the fuel blend
was heated to 60 C temp. The aqueous phase was then slowly added to the hot
fuel blend
CA 03065235 2019-11-27
WO 2018/222138 PCT/SG2018/050267
- 35 -
along with shearing at a rotational speed of 700 rpm using a Jiffy impeller of
Caframo
BDC1850 high shear mixer for 1 minute. The mixing continued for next 5 minutes
until
viscous brown colored coarse emulsion formed. In some cases, where GO
concentration
was more or the emulsifier E-476 was less, the stirring was continued until
residual
aqueous phase gets emulsified. Thereafter, the formed emulsion was refined for
next
minutes by mixing at a speed of 1400 rpm. All the prepared emulsions were
refined
for same time to maintain an equilibrium refining time.
Synthesis of the W/O emulsion with E-476 (without GO)
10 The W/O emulsion with E-476 was prepared with a same procedure as
described earlier.
Here, the aqueous phase was just the DI water. The composition varied slightly
on the
fuel blend side. The concentration of GO as taken earlier has been replaced by
an equal
amount of the Canola oil, rest all ingredients were in the same concentration
as mentioned
earlier.
Synthesis of the dummy emulsion explosive with E-476 and GO
This emulsion is same as earlier, the only difference is supersaturated
solution of salt with
35 wt% is used herein. As earlier, the GO dispersion was used and required
amount of salt
was added to it. The aqueous phase here was called the oxidizer solution. This
oxidizer
solution was heated to 70 C temp until the salt dissolves. Then, the
procedure of
emulsion preparation was followed as earlier.
Characterization
Rheological measurements
The rheological measurements were carried out at room temperature in Anton
Paar
modular compact rheometer (Physica MCR 301). The data were collected using a
parallel-
plate geometry (diameter 25mm) and the gap between the plates was lmm.
The experiments were carried out in the following deformation modes:
1. Amplitude sweep oscillations in the range of strains from 0.1 to 500% at
the
constant frequency of 1 Hz. The amplitude sweep method was used to ensure that
the
obtained values of dynamic elastic moduli in a linear regime of deformations.
CA 03065235 2019-11-27
WO 2018/222138 PCT/SG2018/050267
- 36 -
2. Frequency sweep: Oscillating regimes of deformations in the range of
frequencies
from 0.01 to 100 Hz.
Thermal imaging
The thermal imaging was done using FL1R-i7 thermal camera. About 1 gm of the
emulsion
sample was placed uniformly on a flat plate spatula and heated on a hot plate
at about 90 C
temp. Only two kind of samples were in this measurement to assess how fast the
heat is
transferred viz. emulsion with GO and the emulsion without GO.
Thermal conductivity measurements
The thermal conductivity of the emulsion was measured by using TCi C-Therm
thermal
conductivity analyzer at 60 C temp. A T-shaped TCi sensor was used for
measurement.
Before testing the emulsion sample, the sensor was first calibrated to room
temperature as
well as a standard sample. In this case, polymer sample was used to calibrate
the sensor.
.. This was done to ensure the sensor surface coated with ceramic is
functional and
unaffected by thermal shock of any previous measurements. For testing, a very
small
amount of the emulsion sample was smeared onto the sensor such that the
sensing area
(having electronic chip) is covered entirely by the sample. The sample coated
sensor was
kept inside a furnace to keep the temp uniform throughout the measurement.
Around 10
sampling values of the thermal conductivity were then recorded and averaged to
give
actual value of the thermal conductivity.
Effect of E-476 concentration on the droplet size distribution
The W/O emulsion was prepared with varying amount of emulsifier. Three
different
concentrations of E-476 was used to prepare the emulsion viz. 3 wt%, 0.3 wt%
and 0.15
wt%. The total weight of the emulsion prepared was 100 grams and the
composition of the
phases were kept constant. The aqueous phase which is GO dispersed water was
90% of
total emulsion while the oil phase which is Canola oil plus E-476 was 10% of
the total
emulsion.
Figure 12(a) indicates the finer droplet size and the relevant distribution.
At high
concentration of E-476, the emulsifier action prevails, stabilizing more and
more water
droplets giving finer droplets, higher stability with droplet size
distribution at lower
CA 03065235 2019-11-27
WO 2018/222138 PCT/SG2018/050267
- 37 -
average droplet diameter value (2-3 microns). Reducing the concentration of E-
476 to
about 0.3 wt%, refining not uniform leading formation of large size droplets
and
polydispersity increases as indicated in Figure 12(b).
The distribution shifts to large average droplet diameter with distribution
showing
increased population of large sized droplets. Further reduction in the E-476
as in Figure
12(c), lesser number of droplets taking part in refining leading to increase
in the number of
large sized droplets and polydispersity further increases as compared to that
of 0.3 wt%
emulsifier. The droplets size distribution accordingly will also shift to
higher average
droplet diameter with more number of large droplets. This polydispersity and
formation of
large droplets could be due the fact that with the decrease in the E-476
concentration, GO
concentration dominates. GO being a surfactant will compete with E-476 to go
to
interface, trying to reducing interfacial energy.
Effect of E-476 concentration on the rheological properties
Rheological properties of the W/O emulsion with varying amount of emulsifier
were
evaluated. Oscillatory measurements were done for all emulsions having three
different
concentrations of E- 476 viz. 3 w/w, 0.3 w/w and 0.15 w/w.
Being a highly concentrated emulsions the W/O here are viscoelastic in nature
and the
viscoelasticity is characterized by dynamic rheological measurements, where an
oscillatory
shear is applied. The amplitude sweep (strain sweep) plots of highly
concentrated
emulsions are shown in Figure 13 (a), (b) and (c). The plots demonstrates the
typical
evolution of the storage modulus (G') and loss modulus (G") at a constant
frequency of 1
Hz. The elastic-to-viscous transition (cross- over) for the emulsions takes
place at a
specific of the strain amplitude, represented as Y*. This cross-over point is
different for
the emulsions with different E-476 concentrations and is a point of discussion
in this
section as well as later sections of the oscillatory shear measurements.
For emulsion with E-476 concentration 3.0 wt% as represented in Figure 13(a),
the elastic
modulus and loss modulus are linear for a large amplitude of strain and is
independent of
the strain in an amplitude domain up to y =49%, the cross-over point y*. At
higher values
than y*, deformation starts and the moduli no longer remain constant. This
high value of
CA 03065235 2019-11-27
WO 2018/222138 PCT/SG2018/050267
- 38 -
elastic-to-viscous transition is indicative of the presence of the finer
droplet and
monodisperse droplet distribution which is in - sync our analysis in the
previous section.
With increase in the E-476 concentration, the deformation takes place at lower
strain
amplitude. For E-476 concentration equal to 0.3 wt%, the deformation occurs at
a strain
amplitude y =29.7%, lower than at 3.0 wt% as seen in Figure 13(b). This could
be
indicative of the formation of large droplets whose short-term relaxation and
droplet break-
up at lower strain leads to the deformation. This analysis is confirmation of
lower refinement
due to the prominence of GO with decrease in E-476 concentration. On further
reducing
the E-476 concentration to 0.15 wt% as in Figure 13(c), the deformation occurs
at an
strain amplitude y =22.6% indicative of the formation of more and more larger
droplets and
polydispersity with the decreased E-476 molecules for refinement.
Figure 13 (d), (e) and (f) shows the frequency dependence of the elastic
modulus at a
constant strain amplitude y = 0.1%. At high E-476 concentration of 3.0 wt%
(Figure
1 3 (d)), the elastic modulus is nearly constant for a wide frequency range
covering
several orders of magnitude, though at the high frequency region, the elastic
modulus
drops slightly with increasing frequency due to short-term relaxation caused
by droplet
deformation. The wide plateau on the frequency dependence of elastic modulus
is
standard for ideal elastic materials, the elastic modulus of which must be
independent of
frequency. Hence, such kind of behavior reflects its solid like nature.
Similar results
have been reported in many earlier publications and the wide plateau on the
dependence reflects solid-like behavior highly concentrated emulsions. With
decrease in
E-476 concentration to 0.3 wt% (Figure 13(e)), the elastic modulus no longer
remains
constant for a wide range of frequencies as compared to that at 3.0 wt% E-476.
The
elastic drop occurs at around the frequency 50 Hz which was at 100 Hz for 3.0
wt% E-
476. Further decreasing the E-476 concentration to 0.15 wt%, the drop occurs
at 10 Hz at
shown in Figure 4-2(f). Also, the elastic modulus is no longer remain constant
for a wide
frequency range even at lower frequencies. This can be attributed to the
lesser
refinement leading larger droplet size and polydispersity which makes
deformation easy
via droplet break-up. This results are in consistence with the microscopy and
droplet size
distribution analysis indicative of decrease in refinement with the decrease
in the E-476
concentration and prominence of GO at the interface.
CA 03065235 2019-11-27
WO 2018/222138 PCT/SG2018/050267
- 39 -
Effect of GO concentration on the droplet size distribution
The W/O emulsion was prepared with varying amount of the GO. Four different
concentrations of GO were used to prepare the emulsion viz. 0.007 wt%, 0.014
wt%,
0.025 wt% and 0.052 wt%. The total weight of the emulsion prepared was 100
grams and
the composition of the phases were kept constant. The fuel blend which is
mixture of E-
476 and Canola oil was kept constant at 10 wt% in which Canola oil constitutes
7 wt%
and E-476 constitutes 3 wt% in total emulsion volume.
Figure 14(a) indicates the finer droplet size and the relevant distribution.
At low
concentration of GO, the emulsifier action prevails, stabilizing more and more
water
droplets giving finer droplets, higher stability with droplet size
distribution at lower
average droplet diameter value (2-5 microns). Increasing the GO concentration
to about
0.007 wt%, refining not uniform leading formation of large size droplets and
polydispersity increases as indicated in Figure 1 4 (b). The distribution
shifts to large
average droplet diameter with distribution showing increased population of
large sized
droplets. Further increase in the GO concentration as in Figure 14(c), lesser
number of
droplets taking part in refining by E-476 leading to increase in the number of
large sized
droplets and polydispersity further increases as compared to that of 0.007 wt%
GO.
The droplets size distribution accordingly will also shift to higher average
droplet
diameter with more number of large droplets. The increase will not only hinder
the
refining of droplets but also makes the formation of emulsion difficult.
Result is that not
entire volume of water taken emulsified, there will be a very small volume of
aqueous
phase seen after the refinement. This occurs when the GO concentration
increased above
0.025 wt%. Also, this will leave some residual GO in the emulsion which can be
seen by
the blur image in the Figure 14(c) and Figure 14(d). Not all the GO could take
part in the
emulsification since there may be competition between GO sheets and E-476
molecules to
reach the interface. With the increase in the GO concentration, this
competition may lead
to barrier action by GO to the emulsifier making the refinement difficult. On
the other,
the E-476 may also acquire some of the interfaces leaving the GO sheets which
can be
seen in the blur image. This inhibition action by the GO could be attributed
to the strong
surfactant properties of the GO accounted for the amphiphilic nature of the
GO. This
somehow also indicates the presence of the GO at the interface. Figure 14(d)
shows
CA 03065235 2019-11-27
WO 2018/222138 PCT/SG2018/050267
- 40 -
larger sized droplets than all other compositions of GO and E-476
concentration
discussed in the previous and have high polydispersity. The droplet size
distribution shifts
to large droplets sizes.
Effect of GO concentration on the rheological properties
Rheological properties of the W/O emulsion with varying amount of GO were
evaluated in
the same way as described in the previous section. Oscillatory measurements
were
done for all emulsions having four different concentrations of GO viz. 0.007
wt%, 0.014
wt%, 0.025 wt% and 0.052 wt%.
For emulsion with GO concentration 0.007 wt% the elastic modulus and loss
modulus are
linear for a large amplitude of strain and is independent of the strain in an
amplitude
domain up to y =49%, the cross-over point y*. This high value of elastic-to-
viscous
transition is indicative of the presence of the finer droplet and monodisperse
droplet
distribution.
With increase in the GO concentration, the deformation takes place at lower
strain
amplitude. For GO concentration equal to 0.014 wt%, the deformation occurs at
a strain
amplitude y =22.7%, as seen in Figure 15(b). This analysis is confirmation of
lower
refinement due to the prominence of GO. On further increasing the GO
concentration to
0.025 wt% as in Figure 15(c), the deformation occurs at an strain amplitude y
=15.6%
indicative of the formation of more and more larger droplets due to barrier
action by the
GO. On further increase to 0.052 wt% GO (Figure 15(d)), the strain amplitude
lower to
y =14.7% which can be attributed to the inhibitory action by GO to E-476
molecule.
Figure 15 (e), (f), (g) and (h) shows the frequency dependence of the elastic
modulus at a
constant strain amplitude y = 0.1%. At low GO concentration of 0.007 wt%
(Figure 15(e)),
the elastic modulus is nearly constant for a wide frequency range covering
several orders
of magnitude, though at the high frequency region, the elastic modulus drops
slightly with
increasing frequency due to short- term relaxation caused by droplet
deformation. The
wide plateau on the frequency dependence of elastic modulus is standard for
ideal
elastic materials, the elastic modulus of which must be independent of
frequency. In
Figure 15(f), the elastic modulus plateau decrease to lower value indicative
of the
CA 03065235 2019-11-27
WO 2018/222138 PCT/SG2018/050267
- 41 -
formation of some large droplets in the emulsion. With increase in the GO
concentration to 0.025 wt% (Figure 1 5(g)), the elastic modulus no longer
remains
constant for a wide range of frequencies. The elastic modulus drop occurs at
around
the frequency 100 Hz. Further increasing the GO concentration to 0.052 wt% as
in
Figure 1 5 (h), the elastic modulus increases with increase in the frequency.
This can be
attributed to the loss in elastic behavior of the emulsion which may be due to
droplet
break-up and deformation occurs very low frequencies.
Effect of salt concentration on the droplet size distribution
Figure 16 shows confocal images and the corresponding droplet size
distribution of the
emulsion with varying concentration of the salt. The concentration of the GO
and E-476
are kept constant in order have finer droplets with monodisperse droplets size
distribution. As can be seen from Figure 16(a), though the emulsion has finer
droplets,
the flocculation of GO makes the emulsion refining difficult. The as-
synthesized GO is
electrostatically charged, addition of salt screens the charges on the edges
of the GO
sheets. This will agglomerate the GO in the oxidizer solution during emulsion
preparation. The GO agglomerates hinder the shearing action during mixing
step. Hence,
formation of new interfaces by water droplet break-up gets limited and lesser
droplets take
part in the emulsion formation resulting in the residual GO and crystallized
salt in the
emulsion. This can be seen in the confocal images. With the increase in the
salt
concentration, more and more GO agglomerates hinder the emulsification,
increasing the
droplet size and residual ingredients as shown in Figure 16(b). At very high
concentration
of 35 wt% (Figure 4-5(c)), the residual ingredients and large droplets
decreases the
emulsion volume to a large fraction out of total composition. Emulsion does
not form at
the salt concentration higher than 35 wt%.
Influence of GO at the interface of the E-476 emulsified W/O emulsion
Figure 17 shows the surfactant action of the GO at the interface of the W/O
emulsion. The
results are derived from oscillatory measurements of the emulsion. The cross-
over strain
amplitude was recorded and plotted against the (a) E-476 concentration and the
(b) GO
concentration. With the increase in the E-476 concentration, the elastic-to-
viscous
transition occurs at high strain amplitude. This could be due to the increase
in the E-476
molecules taking part in the emulsification and dominates over the GO sheets.
At low
CA 03065235 2019-11-27
WO 2018/222138 PCT/SG2018/050267
- 42 -
concentration, GO competes with E-476 in going to interface to minimize the
total
interfacial energy and acts as a barrier for emulsification. With the increase
in GO
concentration, more and more GO sheets would like to take part in minimizing
the
interfacial energy. Since GO is amphiphilic in nature, it acts as a strong
surfactant to
stabilize oil-water interfaces. In presence of another emulsifier in the same
oil-water
mixture, GO and the emulsifier individually trying to stabilize the interface
and inhibits
each other's action producing large droplets with polydispersity; leading to
deformation
at low stresses. Hence, on this basis it can be predicted that the GO is at
the interface of the
synthesized 90:10 W/O emulsion.
Thermal imaging of the neat W/O emulsion and GO incorporated W/O emulsion
The synthesized W/O emulsion without GO and the W/O emulsion with GO (0.014
wt%)
were imaged using thermal Infra-red camera. The images were taken on 90 C
temp heated
hot plate at every 5 minutes. As can be seen from the Figure 18, initially the
heating rate
of both the emulsion was constant. After 15 minutes, the emulsion (b) heats up
more
rapidly than the emulsion (a). This behavior continues for next 15 minutes
i.e. after 30
minutes from start of the heating. This indicates that rate of heat transfer
is higher in case of
emulsion (b) than emulsion (a). This can be attributed to the fact that
thermally conducting
GO at the interface of the W/O emulsion may enhances the thermal conductivity
of the
emulsion. This test motivates for further analysis and evaluation of thermal
conductivity
of the emulsion.
Thermal conductivity of the GO incorporated W/O emulsion
Thermal imaging by the IR camera predicts that there could have an enhancement
in the
thermal conductivity of the emulsion with GO at the interface. The W/O
emulsion with GO
were explored further for the determination of thermal conductivity at various
of GO
concentration. Table 1 shows the thermal conductivity of emulsions with
varying
concentration at the same emulsion composition. It can be clearly depicted
from the table
that there is an enhancement in the thermal conductivity of emulsion with the
increase in
the GO concentration. A mild increase in the thermal conductivity may be due
to very
low concentration of GO in the total emulsion. Higher concentration makes the
emulsion
formation difficult due to inhibition action as discussed earlier.
CA 03065235 2019-11-27
WO 2018/222138 PCT/SG2018/050267
-43 -
Table I Thermal conductivity of the emulsion with respect to the GO
concentration.
Emulsion composition has been kept constant with 35% of the (NH4)2SO4 salt.
GO Thermal conductivity::
C....:Pncentratio* 1111 Emulsion composition = =
= .f.,:eight cif* (Aqueous phase fuel blend
:.==
=
.===
..==
:.== .==
1.11.11.11.11.11.11.11.11.11.11.11.11.11.11.11.11.11.11.11.10........i.b.....11
.....14......1.11.11.11.11.11.11.11.11.11.11.11.11.11.11.11.11.11.11.11.1
0.025 90:10 0.40 0.003
= .=
.==
.===. : :
: .
: .
Figure 19(b) shows the percentage enhancement in the thermal conductivity of
the GO
incorporated W/O emulsion with respect to the increase in the GO
concentration. At very
low concentration of GO, the enhancement is of the order of 2% only. With
increase in the
concentration, the enhancement is more. At high concentration, the enhancement
is about
7%, which is highest with maximum GO concentration that can be used to prepare
emulsion.
Example 3
Materials and methods
Canola oil and E 476 emulsifier were obtained from Orica Mining Services Pty.
Ltd.,
Australia. E476 is composed of ester, amide and salt components. Other
ingredients
for the emulsion preparation such as Ammonium Sulphate (M=132.14 g/mol,
Purity>
99.5%) was provided by Amresco Inc. Salts such as Ammonium chloride, Sodium
aceate
and Thiourea were obtained from Merck Pvt. Ltd. GO was synthesized using
hummers'
method as mentioned in earlier section. Thionyl chloride and ethylene diamine
were
obtained from Merck Pty. Ltd.
Functionalization of GO
GO was functionalized using thionyl chloride and ethylene diamine. 1 gm of GO
was
dispersed in 50 gm of Thionyl chloride in presence of 1 ml DMF. It was stirred
for 24
CA 03065235 2019-11-27
WO 2018/222138 PCT/SG2018/050267
- 44 -
hours at 70 C temp. After the completion of the reaction the reaction mixture
was washed,
filtered and dried in vacuum oven for 6 hours. 0.5 gm of above chloride
functionalized
was mixed with 40 ml of Ethylene diamine and stirred for 6 hours at 60 C
temp. The
final reaction mixture was carefully washed, filtered and dried in oven. This
fG0 was
dispersed in the Canola oil along with E-476 for emulsion synthesis.
Synthesis of the W/O emulsion with E-476
The W/O emulsion with E-476 was prepared with three different compositions
involving
aqueous phase and the fuel blend. The aqueous phase was a dispersion of GO in
DI water.
The fuel blend is the mixture of Canola oil and E-476. The total composition
of the
emulsion involved 90 wt% of the aqueous phase and 10 wt% of the fuel blend.
While the
aqueous phase was kept constant with 35% of the salt, the fuel blend was
varied as per the
variation in the emulsifier E-476 and the GO concentration. For the
preparation of 100 gms
of the W/O emulsion, GO was dispersed in required amount (of composition) in
DI water
and the emulsifier E-476 was dispersed in Canola oil such that total fuel
blend
composition becomes 10 wt% of the total emulsion.
For parameter dependent study, the composition was varied keeping the total
weight ratio
of the aqueous phase and fuel blend constant. Initially, the ratio of the
aqueous phase to
the fuel blend was kept constant for few samples of varying concentration of
GO,
emulsifier and the salt. Then, the ratio was changed with again varying the
concentration of
the ingredients as mentioned before. For example, for a 90:10 w/w ratio of
aqueous phase to
fuel blend, 0.007 wt% of GO was dispersed in 55 wt% of DI water and 1.5 wt% of
emulsifier E-476 was dispersed in 8.493 wt% of Canola oil.
Once the compositions were taken, aqueous phase was stirred and heated till 60
C temp
attained. Stirring is needed to avoid flocculation of GO. On the other hand,
the fuel blend
was heated to 60 C temp. The aqueous phase was then slowly added to the hot
fuel blend
along with shearing at a rotational speed of 700 rpm using a Jiffy impeller of
Caframo
BDC1850 high shear mixer for 1 minute. The mixing continued for next 5 minutes
until
viscous brown colored coarse emulsion formed. In some cases, where GO
concentration
was more or the emulsifier E-476 was less, the stirring was continued until
residual
aqueous phase gets emulsified. Thereafter, the formed emulsion was refined for
next
CA 03065235 2019-11-27
WO 2018/222138 PCT/SG2018/050267
- 45 -
15 minutes by mixing at a speed of 1400 rpm. All the prepared emulsions were
refined
for same time to maintain an equilibrium refining time.
Synthesis of the dummy emulsion explosive with E-476 and fG0
This emulsion is the same as earlier, the difference is supersaturated
solution of salt with 35
wt% is used herein. As earlier, the GO dispersion was used and required amount
of salt was
added to it. The aqueous phase here was called the oxidizer solution. This
oxidizer
solution was heated to 70 C temp until the salt dissolves. Then, the
procedure of
emulsion preparation followed what was described earlier.
Characterization
Rheological measurements
The rheological measurements were carried out at room temperature in Anton
Paar
modular compact rheometer (Physica MCR 301). The data were collected using a
parallel-
plate geometry (diameter 25mm) and the gap between the plates was lmm.
The experiments were carried out in the following deformation modes:
1. Amplitude sweep oscillations in the range of strains from 0.1 to 500% at
the
constant frequency of 1 Hz. The amplitude sweep method was used to ensure that
the
obtained values of dynamic elastic moduli in a linear regime of deformations.
2. Frequency sweep: Oscillating regimes of deformations in the range of
frequencies
from 0.01 to 100 Hz.
Thermal imaging
The thermal imaging was done using FLIR-i7 thermal camera. About 1 gm of the
emulsion
sample was placed uniformly on a flat plate spatula and heated on a hot plate
at about 90 C
temp. Only two kind of samples were in this measurement to assess how fast the
heat is
transferred viz, emulsion with fG0 and the emulsion without GO.
Thermal conductivity measurements
The thermal conductivity of the emulsion was measured by using TCi C-Therm
thermal
conductivity analyzer at 60 C temp. A T-shaped TCi sensor was used for
measurement.
Before testing the emulsion sample, the sensor was first calibrated to room
temperature as
CA 03065235 2019-11-27
WO 2018/222138 PCT/SG2018/050267
- 46 -
well as a standard sample. In this case, polymer sample was used to calibrate
the sensor.
This has to be done to ensure the sensor surface coated with ceramic is
functional and
unaffected by thermal shock of any previous measurements. For testing, a very
small
amount of the emulsion sample was smeared onto the sensor such that the
sensing area
(having electronic chip) is covered entirely by the sample. The sample coated
sensor was
kept inside a furnace to keep the temp uniform throughout the measurement.
Around 10
sampling values of the thermal conductivity were then recorded and averaged to
give
actual value of the thermal conductivity.
Functionalization extent of the GO
The functionalization in GO in carboxyl and carbonyl groups was confirmed by
the
FT1R spectroscopy as shown in Figure 2 0 . The amide functionalization of
oxygen
groups is clearly indicated in the reduced transmitted intensity of C-0-NH2
groups which
corresponds to ¨COOH and ¨COOR groups. Also, the thermal reduction of GO will
remove some of 0-H and ¨0- bonds at the basal plane20From figure 10, it can be
seen that
the amide formation is indicated by peaks at 1546 cm-1 while presence of
primary amines
is indicated by shift at 3470 cm-1.The antisymmetric C-N peak and shoulder
between
1255-1465 cm-1 can be attributed to free amine group of EDA whose one amine
group
attached to carbonyl via amide linkage.
fG0 Dispersion in canola oil
GO and fG0 were dispersed in 5 ml canola oil with a concentration of 1 mg/ml
by
ultrasonicating for 30 min. The GO emulsion is maintained at 0.01 wt% fGO.
This
dispersion was heated to 65 C temp on a water bath. 2 ml of Canola oil is
taken in a vial
and heated to. Canola oil was stirred at 600 rpm using a high shear mixer and
GO
dispersion was added to it slowly. The addition was done in such a way that
entire 8 ml
of GO was fully added within 1 minute. The stirring was continued for next 2
minutes.
Further, the shearing speed was increased to 1400 rpm and the mixer was
stirred for next 2
minutes.
Microscopy and droplet size distribution with respect to GO and fG0
CA 03065235 2019-11-27
WO 2018/222138 PCT/SG2018/050267
- 47 -
Figure 22 shows confocal images and the corresponding droplet size
distribution of the
emulsion with varying concentration of the salt. The concentration of the GO
and E-476
are kept constant in order have finer droplets with monodisperse droplets size
distribution. As can be seen from Figure 22(a), though the emulsion has finer
droplets,
.. the flocculation of GO makes the emulsion refining difficult. The as-
synthesized GO is
electrostatically charged, addition of salt screens the charges on the edges
of the GO
sheets. This will agglomerate the GO in the oxidizer solution during emulsion
preparation. The GO agglomerates hinder the shearing action during mixing
step. Hence,
formation of new interfaces by water droplet break-up gets limited and lesser
droplets take
part in the emulsion formation resulting in the residual GO and crystallized
salt in the
emulsion. This can be seen in the confocal images. With the increase in the
salt
concentration, more and more GO agglomerates hinder the emulsification,
increasing the
droplet size and residual ingredients as shown in Figure 22(b). At very high
concentration
of 0.1 wt% fG0 (Figure 22(c)), the residual ingredients and large droplets
decreases
the emulsion volume to a large fraction out of total composition.
Rheological properties with respect to GO and fG0
Rheological properties of the W/O emulsion with varying amount of emulsifier
were
evaluated. Oscillatory measurements were done for all emulsions having three
different
.. concentrations of E- 476 viz. 3 w/w, 0.3 w/w and 0.15 w/w.
Being a highly concentrated emulsions the W/O here are viscoelastic in nature
and the
viscoelasticity is characterized by dynamic rheological measurements, where an
oscillatory
shear is applied. The amplitude sweep (strain sweep) plots of highly
concentrated
emulsions are shown in Figure 23 (a), (b) and (c). The plots demonstrates the
typical
evolution of the storage modulus (G') and loss modulus (G") at a constant
frequency of 1
Hz. The elastic-to-viscous transition (cross-over) for the emulsions takes
place at a specific
of the strain amplitude, represented as Y*. This cross-over point is different
for the
emulsions with different E-476 concentrations and is a point of discussion in
this section
.. as well as later sections of the oscillatory shear measurements.
For emulsion with E-476 concentration 3.0 wt% as represented in Figure 23(a),
the elastic
modulus and loss modulus are linear for a large amplitude of strain and is
independent of
CA 03065235 2019-11-27
WO 2018/222138 PCT/SG2018/050267
- 48 -
the strain in an amplitude domain up to y =49%, the cross-over point y*. At
higher values
than y*, deformation starts and the moduli no longer remain constant. This
high value of
elastic-to-viscous transition is indicative of the presence of the finer
droplet and
monodisperse droplet distribution which is in - sync our analysis in the
previous section.
With increase in the E-476 concentration, the deformation takes place at lower
strain
amplitude. For E-476 concentration equal to 0.3 wt%, the deformation occurs at
a strain
amplitude y =29.7%, lower than at 3.0 wt% as seen in Figure 23(b). This could
be
indicative of the formation of large droplets whose short-term relaxation and
droplet break-
up at lower strain leads to the deformation. This analysis is confirmation of
lower refinement
due to the prominence of GO with decrease in E-476 concentration. On further
reducing
the E-476 concentration to 0.15 wt% as in Figure 23(c), the deformation occurs
at a strain
amplitude y =22.6% indicative of the formation of more and more larger
droplets and
polydispersity with the decreased E-476 molecules for refinement.
CA 03065235 2019-11-27
WO 2018/222138 PCT/SG2018/050267
- 49 -
Thermal conductivity of the fG0 incorporated dummy emulsion explosive
Table 2 Thermal conductivity values of different emulsions with their
corresponding
ingredients and composition
Thermal
=
Thermal
== = Concentration Emulsion composition
conductivity conductivity
EtTliliSi011 With (WirnK)
(wt%) (aqueous oil) (WitTIK) by Th
I
: :
by Ta analyzer -
Imagingerma
= =
=
=
== = = = = = = = = = = = =
GO (aq. phase) 0,014 90:10 (36w1% salt) 0,39 0.40
==== ________________________________________________________________________
1G0 (oil phase) 0.01 90:10 (35wrio salt) 0.43 0.39
to MEgEWICEnn NR915.::6*(45wMSAMMUaaaaa03.5 037
mo (oil phase) 0.01 93.5:6.5 (>45wt% sail) 0.38 0.38
..............................................
..............................................................................
55. .........................................................................
555
...........................................
............................................................
.......................................
MEnn0..I$MEng MU9sTtll.A.W.W.40.t.t.)MMgMMOVMMMMMM9.39NnMll
fG0 (oil phase). 93 565 >4awto s.ft 044 42
The W/O emulsion with GO were explored further for the determination of
thermal
conductivity at various of fG0 concentration. Table 2 shows the thermal
conductivity of
emulsions with varying concentration at the same emulsion composition. It can
be clearly
seen from Table 2 that there is an enhancement in the thermal conductivity of
emulsion
with the increase in the fG0 concentration. A mild increase in the thermal
conductivity
may be due to very low concentration of fG0 in the total emulsion. Higher
concentration
makes the emulsion formation difficult due to inhibition action as discussed
earlier.
Example 4
VoD testing
Tests were conducted to measure VoD in a pre-formulated ammonium nitrate
emulsion
(ANE) explosive composition lacking graphene oxide (GO), and the pre-
formulated ANE
explosive composition into which graphene oxide (GO) was incorporated as an
additive.
All testing was performed in 40mm diameter cardboard tubes, 50cm in length
initiated
with a 25g booster.
RECTIFIED SHEET (RULE 91) ISA/AU
CA 03065235 2019-11-27
WO 2018/222138 PCT/SG2018/050267
- 50 -
The product tested was unsensitised ANE Gold DC (a commercially available
ammonium
nitrate emulsion explosive with an ammonium nitrate content of 80%, which can
be
obtained from Orica International Private Limited, Singapore) with and without
the
addition of GO. This commercially-available pre-formulated ANE explosive
composition
was selected for Example 4 because it is a representative "mid-range" ANE
explosive
composition with respect to its AN content. Individuals having ordinary skill
in the art will
readily understand that other emulsion explosive compositions can be used,
which may
have different AN content, yet which will show VoD results that are generally
similar,
similar, analogous, or comparable to the VoD results detailed below.
The GO was added in dry or powder form at 0.25% w/w directly to the pre-formed
or pre-
formulated emulsion explosive and mixed or blended therein until uniform. The
product
was then chemically sensitized by the addition of a conventional nitrite salt,
which in this
Example was sodium nitrite, thereby sensitising the product by way of the
formation of
nitrogen gas bubbles therein. Individuals having ordinary skill in the
relevant art will
understand that other types of nitrite salts (e.g., calcium nitrite) or other
types of
conventional chemical sensitizing agents could be used for sensitisation. The
final product
density prior to VoD testing was 1.00g/cc or 0.95g/cc. One test was also
performed with
the GO-containing product at a final density of 0.9g/cc, but this particular
commercially
available emulsion explosive product lacking GO was not able to be produced
down to that
density.
Prior to the incorporation of the GO into the product, the GO was pulse ground
(by way of
a conventional blade grinder) with four pulses of < lsec each with 2 second
interpulse
intervals, which "cut" the as-received GO into small enough pieces or
particles to allow
uniform mixing, whilst maintaining the chemical structure of the GO. Images of
the GO
particles after pulse grinding are provided in Figures 25(a) ¨ (c), where the
scale in Figure
25(b) is 100.0 m and the scale in Figure 25(c) is 10[1m.
VoD test data is presented in Table 3.
CA 03065235 2019-11-27
WO 2018/222138 PCT/SG2018/050267
- 51 -
Table 3: VoD test data
Product Density (g/cc) VoD - No GO (km/sec) VoD with GO (km/sec)
1.00 2.9 3.6
1.00 3.0 3.6
0.95 3.0 3.6
0.95 3.0 3.6
0.90 - 3.5
0.90 - 3.5
The VoD traces were all clean. An example of a VoD trace without GO and with
GO are
shown in Figures 26 and 27, respectively.
As indicated in Table 3, the tested products containing GO showed a VoD
improvement of
more than 15%, i.e., about 16.67%. This is a surprising result, given that the
inventors
named on this patent application were unaware of any other type of additive to
an emulsion
explosive that would be capable of providing a VoD increase of 15% or more at
such a
small weight percentage of additive.
Example 5
Differential Scanning Calorimetry (DSC) Measurements
Figure 28 shows Differential Scanning Calorimetry (DSC) measurements
corresponding to
another pre-formed or pre-formulated commercially available W/O emulsion
explosive
product, ANE Extra (also available from Orica International Private Limited,
Singapore),
without GO incorporated and blended therein as an additive, and with GO
incorporated and
blended therein as an additive at 5 wt% GO. As indicated in Figure 28, the
incorporation
of GO into a pre-formulated ANE explosive product significantly or
dramatically shifts the
ANE decomposition peak and changes the overall shape of the exotherm profile,
resulting
in a much higher ANE decomposition peak at a lower temperature than for the
pre-
formulated ANE explosive product that lacked GO therein. Additionally, a large
GO
reduction peak can be seen corresponding to temperatures significantly below
the shifted
ANE decomposition peak.
CA 03065235 2019-11-27
WO 2018/222138 PCT/SG2018/050267
- 52 -
It can be noted that from this and related DSC experiments, it was determined
that the
incorporation of GO the pre-formulated emulsion explosive at 5 wt% GO provided
the
most readily apparent or possibly optimal increase in energy of the system,
based on the
shape and size of the shifted ANE decomposition peak relative to the ANE
decomposition
peak for the pre-formulated emulsion explosive that lacked GO therein.