Note: Descriptions are shown in the official language in which they were submitted.
CA 03067870 2019-12-19
WO 2018/232521 PCT/CA2018/050764
1
MSIA SCANNING INSTRUMENT WITH INCREASED DYNAMIC RANGE
TECHNICAL FIELD
Embodiments herein relate to the fields of scanning microscope imaging of
large
specimens with particular emphasis on RGB brightfield imaging, as well as
fluorescence and
spectrally-resolved imaging. Applications may include imaging tissue
specimens, genetic
microarrays, protein arrays, tissue arrays, cells and cell populations,
biochips, arrays of
biomolecules, fluorescent nanoparticles, semiconductor materials and devices,
and many others.
DEFINITIONS
For the purposes of this document, a "macroscopic specimen" (or "large
microscope
specimen") is generally defined as one that is larger than the field of view
of a microscope, such
as a compound optical microscope containing a microscope objective that has
the same
Numerical Aperture (NA) as that of the scanner described in this document.
For the purposes of this document, "TDI" or "Time Delay and Integration" is
generally defined as a method and detectors used for scanning moving objects,
usually including
a CCD-based detector array in which typically charge is transferred from one
row of pixels in the
detector array to the next in synchronism with the motion of the real image of
the moving object.
As the object (and its image) moves, charge builds up and the result is charge
integration just as
if a longer exposure were used in a stationary imaging situation. When the
image (and integrated
charge) reaches the last row of the array, that line of pixels is read out.
One example of such a
camera is the DALSA Piranha TDI camera. CMOS TDI imagers have also been
developed.
CCD TDI imagers typically combine signal charges, while CMOS TDI imagers
typically
combine voltage signals.
For the purposes of this document the term "image acquisition" generally
includes the
steps necessary to acquire and produce a final image of the specimen, which
may include some
of but is not necessarily limited to the following: the steps of preview
scanning, instrument
focus, predicting and setting gain for imaging each fluorophore, image
adjustments including
demosaicing (where required), scan linearity adjustment, field flattening
(compensating for
fluorescence intensity variation caused by excitation intensity and detection
sensitivity changes
CA 03067870 2019-12-19
WO 2018/232521 PCT/CA2018/050764
2
across the field of view), correction of fluorescence signal in one channel
caused by overlap of
fluorescence from adjacent (in wavelength) channels when two or more
fluorophores are excited
simultaneously, dynamic range adjustment, butting or stitching together
adjacent image strips
(when necessary), storing, transmitting, assembling and viewing the final
image.
For the purposes of this document, a "frame grabber" generally includes any
electronic
device that captures individual, digital still frames from an analog video
signal or a digital video
stream or digital camera. It is often employed as a component of a computer
vision system, in
which video frames are captured in digital form and then displayed, stored or
transmitted in raw
or compressed digital form. This definition may include direct camera
connections via USB,
Ethernet, IEEE 1394 ("FireWire") and other interfaces that are now practical.
Moving Specimen Image Averaging ("MSIA") is generally defined as the method
and
technology for acquiring digital strip images (i.e., image strips) across a
large microscope
specimen by capturing sequential overlapping frame images of a moving
specimen, typically
where a new image frame is captured each time the specimen has moved a
distance that causes
the image of that specimen projected by the optics onto a two-dimensional
detector array to
move a distance equal to the distance between a small number of rows of
detectors in the
detector array (where this number is normally held constant while scanning
digital image strips),
image data from the new frame is translated (moved) in computer memory to
match the motion
of the optical image across the detector array, and is averaged with (or in
some cases may be
added to) the data previously stored to generate an image of a strip across
the specimen. In some
cases, such a procedure may be continued until the specimen has moved a
distance such that all
object points in that strip have been exposed a number of times equal to the
number of active
rows in the detector array (usually chosen by defining a "detector area of
interest" that has the
width of the detector but a smaller number of rows than the detector array
contains) divided by
the number of rows moved between each successive image capture (usually one
row). All pixels
in the image strip that results tend to have increased signal-to-noise ratio
(S/N) because of pixel
averaging, where the increased signal-to-noise ratio is equal to the square
root of the number of
times each pixel has been averaged to produce the final MSIA strip image, and
increased
dynamic range because of the reduction of noise caused by averaging
(especially in the dark
pixels).
CA 03067870 2019-12-19
WO 2018/232521 PCT/CA2018/050764
3
As used herein, the terms "frame image" and "image frame" are identical to one
another and are used interchangeably.
"Fluorescence" generally includes fluorescence from naturally-occurring
sources inside
the specimen and fluorescent dyes and markers (including for example quantum
dots) that may
be added to the specimen, as well as fluorescence from the substrate or a
layer above the
specimen.
"Spectral imaging" generally refers to the method and technology for acquiring
images
in which each pixel is represented by its spectrum.
"Hyperspectral imaging" generally refers to the method and technology for
acquiring
images in which each pixel is represented by a spectrum composed of narrow
spectral bands over
a continuous spectral range.
"Imaging spectroscopy" generally refers to the acquisition and processing of
hyperspectral images.
"Multispectral imaging" generally refers to the method and technology for
acquiring
multiple images of an object, each image representing a range of wavelengths.
For example,
each image could represent the emission range (or part of the emission range)
of a particular
fluorophore. In this case each pixel in the final multispectral image may not
contain a spectrum
of the fluorescence emitted by the specimen at that position, but contains
information about the
signal detected from each fluorophore at that pixel position.
For the purposes of this document, a "mosaic scan filter array" is generally
defined as a
mosaic filter array that is designed for high resolution imaging using MSIA
scanning, typically
where the resulting image has full colour information at each pixel position
and typically without
demosaicing or interpolation. In a mosaic scan filter array, each row of tiles
is typically
translated with respect to the next row of tiles in the same direction and
perpendicular to the scan
direction by one pixel position.
A "scan colour filter array" is generally defined as a colour filter array
comprised of a
repeat pattern of rows of different colour filters, where each row contains a
single colour, that has
been designed for MSIA scanning such that when used in MSIA scanning every
pixel position in
the final image contains full colour information, typically with no
interpolation required.
For the purposes of this document, "High Dynamic Range Scanning" ("HDR
Scanning") is generally defined as a method and apparatus for acquiring and
displaying scanned
CA 03067870 2019-12-19
WO 2018/232521 PCT/CA2018/050764
4
images that have a greater range of luminance levels than can be achieved with
a single exposure
using the scanner's image sensor, by combining two or more images, typically
with the same
dynamic range but with different exposures (and commonly including an
underexposed image
and an overexposed image)
For the purposes of this document, "Extended Dynamic Range Scanning" ("EDR
Scanning") is generally defined as a method and apparatus using MSIA for
acquiring and
displaying scanned images that have a higher dynamic range than the dynamic
range of the
image sensor used in the scanner.
For the purposes of this document, an "Increased Dynamic Range Image" ("IDR
Image") refers to an image generated by combining a plurality of images, each
image having
different effective exposures.
The method of rendering an HDR or EDR image for viewing on a standard monitor
or
printing device is called "tone mapping". This method reduces the overall
contrast of an HDR or
EDR image to facilitate display on devices or printouts with lower dynamic
range, and can be
applied to produce images with preserved local contrast (possibly useful in
brightfield imaging
of tissue specimens).
For the purposes of this document, exposure value ("EV") is typically defined
as an
exposure adjustment, where +1EV is equivalent to increasing the exposure time
of a first
(reference) image by a factor of 2, or increasing the detector gain by a
factor of 2, or increasing
the illumination intensity by a factor of 2. An exposure value of +2EV is
equivalent to
increasing the exposure time by a further factor of 2 (4 times the exposure
time of the reference
image), or increasing the detector gain by an additional factor of 2 (4 times
that of the detector
gain used for the reference image), or increasing the illumination intensity
by an additional factor
of 2. Similarly, -1EV is equivalent to reducing the exposure time of the first
(reference) image
by a factor of 1/2, or of multiplying the detector gain by a factor of 1/2, or
multiplying the
illumination intensity by a factor of 1/2, etc.
CA 03067870 2019-12-19
WO 2018/232521 PCT/CA2018/050764
SUMMARY OF VARIOUS EMBODIMENTS:
One or more embodiments as described herein may provide a scanning instrument
and
method of imaging whereby multiple strip images with different effective
exposure values
(images with different effective exposure times) are acquired in a single
scan. In some cases
these multiple strip images can be contained in data files having the same
number of bits of
dynamic range.
One or more embodiments as described herein may provide a scanning instrument
and
method of imaging whereby multiple strip images with different effective
exposure values
(images with different effective exposure times) but the same dynamic range
are typically
acquired in a single scan, and these strip images are combined to provide one
or more HDR
images of the specimen.
One or more embodiments as described herein may provide a scanning instrument
and
method of imaging whereby multiple strip images with different effective
exposure values
(images with different effective exposure times) are acquired in a single scan
so that exposure
does not have to be adjusted before each scan of a specimen is commenced. In
effect, this may
allow for automatic exposure adjustment, for example after the specimen has
been scanned (or in
some cases during the scan).
One or more embodiments as described herein may provide a scanning instrument
and
method of imaging whereby multiple strip images with different contrast
mechanisms, and with
different exposure values (images with different effective exposure times) are
acquired in a
single scan in which the exposure for each contrast mechanism does not have to
be adjusted
before each scan of the specimen is commenced.
One or more embodiments as described herein may provide a scanning instrument
and
method of imaging whereby MSIA scanning is used to produce an increased
dynamic range
(IDR) image of a large specimen, which could be an HDR or EDR image.
One or more embodiments as described herein may provide a scanning instrument
and
method of imaging whereby MSIA scanning is used to produce an DR brightfield
colour image
of a large specimen.
One or more embodiments as described herein may provide a scanning instrument
and
method of imaging whereby MSIA scanning is used to produce an EDR
multispectral (e.g.,
fluorescence or photoluminescence) image of a large specimen.
CA 03067870 2019-12-19
WO 2018/232521 PCT/CA2018/050764
6
One or more embodiments as described herein may provide a scanning instrument
and
method of imaging whereby MSIA scanning is used to produce an EDR
hyperspectral (e.g.
photoluminescence or spectrally-resolved fluorescence) image of a large
specimen.
BRIEF DESCRIPTION OF THE DIAGRAMS
Figure 1 shows a schematic view of an MSIA scanner.
Figure 2 is a schematic view of a 4000 column by 3000 row detector array with
a 256
row active area and having a 4 row repeat pattern in its colour filter array.
Figure 3 is a schematic view of a small area of an RGBW scanning colour filter
array
with a 4 row repeat pattern.
Figure 4 shows a schematic view of an MSIA scanner for brightfield and
fluorescence
imaging.
Figure 5 shows a schematic view of a 4000 x 3000 pixel monochrome detector
array in
which the active area has been chosen to include only the centre 4 rows of
pixels.
Figure 6 shows a schematic view of a multiple exposure brightfield MSIA
scanner.
Figure 7 shows data flow in a Data Manipulation and Image Store (DMIS).
Figure 8 is a schematic representation of a multiple exposure fluorescence
MSIA
scanner.
Figure 9 is a schematic representation of a multiple exposure MSIA scanner for
simultaneously imaging multiple fluorophores.
Figure 10 is a schematic view of the centre area of a scanning colour filter
array with
colour filters that are emission filters for five different fluorophores.
Figure 11 shows a schematic view of a multiple-exposure hyperspectral MSIA
scanner
for spectral imaging.
Figure 12 shows a schematic view of the centre area of a mosaic scan filter
array for
hyperspectral imaging.
Figure 13 is a schematic view of the centre area of a mosaic scan filter array
for
hyperspectral imaging comprised of one-row by six-column tiles.
Figure 14 is a schematic view of a multiple-exposure MSIA scanner for colour
brightfield imaging for EDR or UDR imaging.
CA 03067870 2019-12-19
WO 2018/232521 PCT/CA2018/050764
7
DESCRIPTION OF VARIOUS EMBODIMENTS
Figure 1 is a schematic representation of a Brightfield MSIA scanner. Light
from light
source 110 illuminates from beneath specimen 102, which is mounted on specimen
holder 101
on computer-controlled moving stage 105. The motion of stage 105 is controlled
by computer
106 through wired or wireless connection 107. Motion of the stage is in a
direction
perpendicular to rows in the detector array {i.e., data is read out from
adjacent rows in the
detector array, where the rows are usually along the long dimension of the
array}. Light from
the specimen is collected by microscope objective 115 which is held at a focus
position above
the specimen by piezo positioner 120 (or other focusing mechanism) and this
light from the
specimen is focused by tube lens 125 onto two-dimensional detector array 111
inside digital
camera 112. When used for brightfield imaging, detector array 111 may be a
monochrome
array; or a scan colour filter array, a mosaic colour filter array, a Bayer
filter or other colour filter
array may be incorporated into the sensor array, for instance during
manufacture of the 2D
detector.
Pixel data from the detector array 111 inside digital camera 112 is read out
by frame
grabber 150 and passed to computer 106 during the scan, where an image strip
is assembled for
each colour represented by the filters in the Repeat Pattern of the imaging
scan filter, as
described below. Image data for each exposure (i.e., each frame image) is
passed by the frame
grabber to the computer where it may be added to or averaged with data already
present in the
lengthening image strips in the Moving Specimen Image Averaging (MSIA)
process. Computer
106 also controls motion of scanning stage 105 and the action of the shutter
(usually an
electronic shutter) in digital camera 112.
Figure 2 shows a schematic view of a detector array that is (in this example)
4000
columns of pixels wide and 3000 rows of pixels long, where commonly the entire
area of the
detector array is covered with a scanning colour filter array with a pattern
of rows that is
repeated many times, and where the repeat pattern is typically small compared
to the number of
rows in the array. When used for MSIA scanning, it is common to choose an
active area of the
detector array that includes the entire width of the array, and a smaller
number of active rows
near the center of the array. One example is shown in Figure 2, where an
active area of 256
rows has been chosen in this 4000 x 3000 pixel array, and where the entire
surface of the array
CA 03067870 2019-12-19
WO 2018/232521 PCT/CA2018/050764
8
(or at least an area that is greater than the chosen active area) is covered
by a scan colour filter
array with a repeat pattern of 4 rows.
Using an active area that is smaller than the entire area of the array has the
advantage of
increasing the scan speed, since each frame image acquired during the MSIA
scan is only 256 x
4000 pixels in size (in this example), and many cameras have an increased
frame rate when using
a small active area like this one. For this example, assume that the pattern
of the scanning filter
array that has been fabricated on top of the pixels in the detector array is
repeated every 4 rows,
like the centre section of a scan colour filter array shown in Figure 3 {where
the colour filters in
the array are Red, Green, Blue, and White (clear)}.
In this particular example, when used for MSIA scanning with the active area
just
described, every pixel position in the repeat pattern will be exposed 64 times
during the scan, so
the Signal/Noise ratio in the final MSIA image strip is increased by MSIA
averaging by a factor
of the square root of 64 (i.e., a factor of 8). In this example, the repeat
pattern is 4 rows, and the
active area is 256 rows, but other active areas and colour filters with
different repeat patterns can
be used. Pixel data from the detector array 111 inside digital camera 112 is
read out by frame
grabber 150 and passed to computer 106 during the scan, where an image strip
is assembled for
each colour represented by the filters in the Repeat Pattern of the imaging
scan filter, as
described below.
Image data for each exposure is passed by the frame grabber to the computer
where it is
added to or averaged with data already present in the lengthening image strips
in the Moving
Specimen Image Averaging (MSIA) process. Computer 106 may also control motion
of
scanning stage 105 and the action of the shutter (usually an electronic
shutter) in digital camera
112.
An active area can also be defined in software as a Software Defined Active
Area
(SDAA) instead of being chosen in the detector array (in hardware). In MSIA
scanning, every
frame image is accessible to the computer, so an active area can be defined in
software after the
image frame has been acquired, and image data for pixels outside the SDAA can
simply be
discarded. This allows the software to choose an SDAA that is smaller than
that defined in the
detector array (in hardware), or to define and choose an SDAA even in frame
images acquired
using a digital camera that does not allow active areas to be defined in the
sensor.
CA 03067870 2019-12-19
WO 2018/232521 PCT/CA2018/050764
9
Several combinations of rows and repeat patterns work well for MSIA scanning.
Using
the previous example (i.e., 4 colour filters, and an active area of 256 rows),
an MSIA filter can
be designed with each colour occupying single rows for a repeat pattern of 4
rows (as shown in
Fig. 3), each colour occupying two adjacent rows for a repeat pattern of 8
rows, or occupying 4
adjacent rows for a repeat pattern of 16 rows, or 8 adjacent rows for a repeat
pattern of 32 rows,
or 16 adjacent rows for a repeat pattern of 64 rows, or 32 adjacent rows for a
repeat pattern of
128 rows, or 64 adjacent rows for a repeat pattern of 256 rows. In each case
every pixel in the
repeat pattern will be exposed 64 times during the scan when the active area
is 256 rows. In
addition, it is possible to arrange these four colours in several other ways ¨
for example as a
Bayer filter, or as a mosaic scan filter array. When an RGBW Bayer filter is
used for MSIA
scanning, image pixels in the scanned image do not contain full colour
information, and
interpolation of measured values in columns adjacent to positions where colour
information is
lacking may be used to fill in the missing values. When a mosaic scan filter
array is used, all
image pixels contain full colour information after MSIA scanning, and no
interpolation is
required.
Figure 4 shows a scanning microscope for fluorescence and brightfield MSIA
imaging.
A tissue specimen 400 (or other specimen to be imaged) is mounted on a
microscope slide 101
on a computer-controlled scanning stage 105. When used for fluorescence
imaging, a
fluorescence optical assembly 410 for epifluorescence illumination is mounted
in the microscope
as shown (or other epi-illumination light source is used), and illumination is
provided by light
source 415 instead of transmission light source 110. This optical assembly 410
is typically
comprised of a fluorescence light source 415, fluorescence excitation filter
420, dichroic
beamsplitter 421, and fluorescence emission filter 422. Excitation filter 420
transmits a narrow
band of wavelengths to excite a fluorophore in specimen 400, and dichroic
beamsplitter 421
reflects that beam of light downwards to be focused on the specimen 400 by
microscope
objective 115. Fluorescence emitted from the specimen is collected by the
microscope objective
and passes through dichroic beamsplitter 421 and then through emission filter
422 which passes
the band of emission wavelengths from the fluorophore in specimen 400. Light
in this emission
band is then focused on monochrome detector array 411 by microscope tube lens
125. Pixel data
from the detector array 411 inside digital camera 112 is read out by frame
grabber 150 and
passed to computer 106 during the scan, where an image strip is assembled for
the fluorophore
CA 03067870 2019-12-19
WO 2018/232521 PCT/CA2018/050764
being imaged in the specimen 400. Image data for each image frame is passed by
the frame
grabber to the computer where it is added to or averaged with data already
present in the
lengthening image strip for that fluorophore in the Moving Specimen Image
Averaging (MSIA)
process. Computer 106 also controls motion of scanning stage 105 and the
action of the shutter
(usually an electronic shutter) in digital camera 112.
When a different fluorophore is to be imaged in the specimen, typically a
different combination
of excitation filter 420, dichroic beamsplitter 421 and emission filter 422 is
chosen to match the
requirements of the new fluorophore. The combination of excitation filter,
beamsplitter and
emission filter that matches a particular fluorophore is often combined into a
"filter cube" that
can be replaced when imaging a different fluorophore.
In landscape photography, a photographer can change the exposure of a
photograph by
changing the shutter speed, by changing the detector gain (or film speed, when
film is used), or
by changing the size of the lens aperture to admit more or less light. He can
also use an external
flash to increase illumination of parts of the landscape.
In non-MSIA scanning microscopy, the exposure can be changed by changing the
shutter speed (but the amount of change is limited by motion of the specimen
relative to the
detector ¨ generally the shutter should be open only for the time it takes for
the optical image of
the specimen to move a distance that is less than approximately 1/10 of the
distance between
pixels on the detector array, so that the image does not show motion blur), by
changing the
detector gain, or by changing the illumination intensity. Normally the
microscopist cannot adjust
the lens aperture. It is important to get the exposure right before making the
scan, especially
when doing whole-slide imaging, where the scan time can be long, and where
hundreds of slides
are often scanned automatically without human intervention. Repeating the scan
to change
exposure may interrupt the scan procedure, and will waste time.
When a fluorescent specimen contains two fluorophores, one is often much
brighter than
the other, typically requiring an exposure change when the second fluorophore
is imaged. When
TDI is used for fluorescence scanning, it is common to use a single TDI
detector instead of
multiple detectors (one for each fluorescence wavelength) because the large
difference in
fluorescence intensity of different fluorophores requires that each one must
be scanned at a
different scan speed, which is required to change the exposure time during TDI
imaging.
CA 03067870 2019-12-19
WO 2018/232521 PCT/CA2018/050764
11
One feature of an MSIA scanner is that every frame image is normally
accessible to
the computer as the scan proceeds. This means that successive images can be
used to generate
the lengthening strip image in different ways. For example, this means that
pixel data in
overlapping image frames can be averaged (the usual procedure in MSIA imaging)
or the pixel
data can be added. It also means an MSIA scanner is bidirectional (whereas a
TDI-based
scanner is typically not). For instance, if a detector array with a 12-bit
dynamic range is used for
MSIA scanning, during the scan each 12-bit image is commonly averaged with
data already
existing in the lengthening strip image, resulting in a final image that has
the same dynamic
range (12 bits), but improved signal/noise ratio.
Figure 5 shows a schematic view of a 4000 x 3000 pixel monochrome detector
array in
which the active area has been chosen to include only the centre 4 rows of
pixels. This very
small active area was chosen for illustration only ¨ normally a larger active
area would be used.
Figure 6 shows a schematic view of a multiple exposure brightfield MSIA
scanner
according to a first embodiment. Light from light source 110 illuminates a
specimen 102 from
beneath, the specimen is mounted on specimen holder 101 on computer-controlled
scanning
stage 105. Biological specimens are normally covered by a thin transparent
cover slip (not
shown). The motion of scanning stage 105 is controlled by computer 606 through
wired or
wireless connection 107. Motion of the microscope stage is in a direction
perpendicular to rows
in the detector array {data is read out from adjacent rows in the detector
array, where the rows
are usually along the long dimension of the array, as shown in the example in
Figure 5}.
Computer 606 also controls motion of scanning stage 105 and the action of the
shutter (usually
an electronic shutter) in digital camera 612. Light from the specimen is
collected by microscope
objective 115 which is held at a focus position above the specimen by piezo
positioner 120 (or
other focusing mechanism) and this light from the specimen is focused by tube
lens 125 onto
two-dimensional monochrome detector array 611 inside digital camera 612. Pixel
data from the
active area of detector array 611 (the image frame) inside digital camera 612
is read out by frame
grabber 150 and passed to computer 606 during the scan. Computer 606 passes
the image frame
data to Data Manipulation and Image Store 607 after each frame has been
collected.
When previous scanners are used to scan a large number of slides, one problem
is to set
the proper exposure for every slide before scanning. The new multiple-exposure
MSIA scanner
described herein helps address that problem. For instance, when the MSIA
scanner described in
CA 03067870 2019-12-19
WO 2018/232521 PCT/CA2018/050764
12
Figure 6 is used with a monochrome detector with a small active area of only 4
rows like that
shown in Figure 5, pixel data for each image frame (in this simple example an
image frame
comprises 4 x 4000 pixels) is passed by computer 606 to Data Manipulation and
Image Store
(DMIS) 607, as shown in Figure 7.
The first image frame (frame 1) sent to the DMIS is shown at the top left of
Figure 7.
The four rows of data in frame 1 (each 4000 pixels long) are labelled 11, 12,
13, and 14, where
the first digit is the frame number, and the second digit is the row number
inside that frame.
Since there are four rows in the active area, and in this example a frame
image is acquired each
time the optical image of the specimen projected onto the detector array 611
moves a distance
equal to the distance between rows of pixels in the detector array, each
object point represented
by a pixel in the scan strip image will be exposed four times as the scan
proceeds. When used
for Moving Specimen Image Averaging, each of the four exposures of the same
object point (the
same image position in the lengthening strip image) are commonly averaged
together to give a
S/N increase equal to the square root of the number of exposures because of
data averaging (in
this case S/N increase is equal to 2 since every object position is exposed 4
times). The MSIA
image strip is shown as Strip 1, and the exposure is Eo for that strip. The
exposure is usually set
so that no (or very few) pixels in any one of the frame images are saturated,
which results in
what is normally considered to be the "proper" exposure for that strip image.
For this example
of a multiple exposure scanner, assume the camera 612 produces 12-bit images
that are
transferred to computer 606 by frame grabber 150. When four exposures of the
first line of
object positions in the strip to be imaged on the specimen are complete (as
shown in the fourth
line of Strip 1 in Figure 7), the average of these four exposures
414+23+32+41)/41 is stored as
the first row of data in Strip 1, a strip image 4000 pixels wide (where in the
previous formula 14,
23, 32, and 41 represent the pixel intensity of rows of pixels 14, 23, 32, and
41 in frames 1, 2, 3
and 4 respectively). Note that data in Strip 1 has the same dynamic range as
the detector array
does.
If the exposure for Strip 1 is too low, in an MSIA scanner it is possible to
add data from
subsequent exposures of the same object position instead of averaging
successive exposures
(averaging is the most common MSIA procedure), and this is shown in Strip 2,
where the pixel
intensity from the first two exposures is added together, and then averaged
with the sum of the
pixel intensities of exposures 3 and 4. Strip 2 is a strip image with twice
the exposure (Eo +
CA 03067870 2019-12-19
WO 2018/232521 PCT/CA2018/050764
13
lEV) of strip 1. Data for Strip 2 can be stored in a data file with twice the
dynamic range as for
Strip 1.
If the exposure for Strip 2 is still too low, the data from four exposures of
the same object
position can be added together as shown in Fig. 7 for Strip 3, which doubles
the exposure again.
Here Strip 2 has twice the exposure of Strip 1, and Strip 3 has four times the
exposure of Strip 1
(Eo + 2EV) and twice the exposure of Strip 2. Note that it is not necessary to
store the data for
Strips 1 and 2 ¨ all of the information necessary for calculating Strip 1 and
Strip 2 is available if
only Strip 3 is stored. The data in Strip 3 has twice the dynamic range as
that in Strip 2, and can
be stored in a data file with twice the dynamic range as that used for Strip
2.
It is notable that even in this simple example, three different exposures have
been
acquired in the same scan. In a more realistic example, if the active area on
the detector array
had been defined as 16 rows, two more exposures can be acquired (Eo + 3EV and
Eo + 4EV),
and the dynamic range of the data file required to store Strip 5 is 4 times as
large as for Strip 3.
For example, if a 12 bit detector array is used, and the base exposure Eo is
set so that none of the
pixels in the area of interest of the specimen are saturated (in transmission
imaging, the area
outside the specimen may be very bright and is often saturated), then a 16 bit
file can be used to
store Strip 5, and image strips for five different exposures can be calculated
from the data
acquired in a single MSIA scan stored in a single data file in the computer.
If a "perfect exposure" is one in which the maximum dynamic range of the data
acquired
from the specimen (or an area of interest inside the specimen) has only one
saturated pixel and
all other pixels are not saturated (other definitions of "perfect exposure"
are possible), then an
underexposure can be achieved by adjusting the illumination intensity and the
shutter speed and
gain of digital camera 612 (containing array detector 611) to make it certain
that there will be no
saturated pixels in the area of interest inside the specimen. For this
example, suppose a 12-bit
detector is used, the data will be stored in a 16-bit file in the Data
Manipulation and Image Store
607, 16 rows are included in the active area of the detector, and the final
result desired is a
perfectly exposed 12 bit image. The maximum pixel data value that can be
acquired by that
detector (a saturated pixel) is 4096 (12 bits), and when that pixel value is
added 16 times in the
MSIA process, the result is a value for that pixel of 65,536 stored in the 16-
bit data file in Data
Manipulation and Image Store 607. However, we have stipulated that the
exposure has been set
for what would normally be an underexposure, so let's assume that the maximum
pixel value that
CA 03067870 2019-12-19
WO 2018/232521 PCT/CA2018/050764
14
is collected by the detector is 2000 (less than half the value that would be
collected at saturation).
After this pixel has been exposed 16 times, this data value (or values close
to 2000 but slightly
different in different image frames because of noise) is added 16 times to the
data stored at that
pixel position in the 16-bit image store, resulting in a final value for that
pixel (the brightest pixel
in the image) of 32000. If the imaging requirement is a perfectly exposed 12-
bit image, where
the brightest pixel has a value of 4096, when the stored value of every pixel
in the 16-bit file is
multiplied by 4096/32000, the result is a "perfectly exposed" 12-bit image,
even though the
exposure for each frame image was set to an estimated value that would be
expected to
underexpose the image before scanning, and only one scan was made along this
strip across the
specimen. In addition to automatically achieving a so-called "perfect
exposure" in a single scan,
the final image also has increased S/N because of MSIA averaging.
In some embodiments, two optional additional steps during image acquisition
may
improve the resulting scanned image:
= First, when pixel data from a series of sequential exposures of the same
object
position are added to produce data for a pixel in the final scanned image
(which is
equivalent to a time exposure of that object position), fixed-pattern noise in
the
resulting strip image may be reduced by subtracting a dark-frame image from
each image frame when it is acquired. A dark-frame image is commonly acquired
in the dark using the same shutter speed that is used during scanning (if the
shutter speed is changed, a new dark-frame image is commonly acquired). In
order to better separate fixed-pattern noise from random noise, an average of
several exposures (each with the same shutter speed) is commonly used as a
dark
frame image. This procedure (subtracting a dark-frame image from each image
frame) is used to reduce the fixed-pattern noise from the detector that may
exist in
an image that is the sum of several exposures. However in MSIA imaging, each
pixel in the resulting strip image results from averaging (or adding) pixel
data
from different physical pixels in the sensor array, so the effect of fixed-
pattern
noise is already reduced.
= Second, when there is geometric distortion in the image projected by the
optics
onto the detector array, this may cause blurring of the MSIA scanned image,
especially when the active area is large (commonly more than 16 rows). This
CA 03067870 2019-12-19
WO 2018/232521 PCT/CA2018/050764
blurring can be reduced or eliminated by correcting the image frames as they
are
acquired from the detector using software that corrects for geometric
distortion.
= Note that when both of these optional steps are performed, dark-frame
image
subtraction is commonly performed before geometric distortion correction. If
dark-frame subtraction is performed after geometric distortion correction of
the
frame images, the dark-frame image should be corrected for distortion before
subtraction.
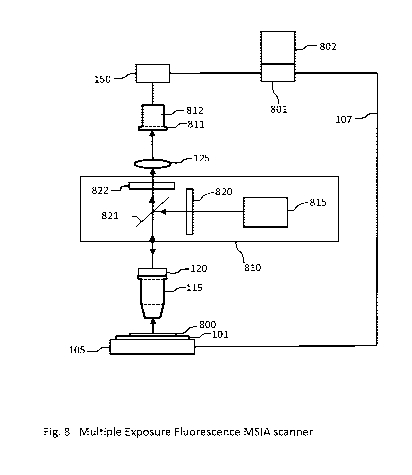
Figure 8 shows a schematic view of a multiple-exposure fluorescence MSIA
scanner
according to a second embodiment. Light from light source 815 passes through
fluorescence
excitation filter 820, is partially reflected by beamsplitter 821 and is
transmitted by microscope
objective 115 to illuminate specimen 800 from above (illumination from above
is called epi-
illumination ¨ several other arrangements to provide epi-illumination are
possible). In this
example, epifluorescence illumination and fluorescence emission filtering are
provided by
fluorescence optical assembly 810. Specimen 800 is mounted on specimen holder
101 on
computer-controlled scanning stage 105. The motion of scanning stage 105 is
controlled by
computer 801 through wired or wireless connection 107. Motion of the
microscope stage is in a
direction perpendicular to rows in the detector array {data is read out from
adjacent rows in the
detector array, where the rows are usually along the long dimension of the
array, as shown in the
example in Figure 5}. Computer 801 also controls motion of scanning stage 105
and the action
of the shutter (usually an electronic shutter) in digital camera 812.
Fluorescence from the
specimen is collected by microscope objective 115 which is held at a focus
position above the
specimen by piezo positioner 120 (or other focusing mechanism), passes through
beamsplitter
821 and fluorescence emission filter 822 (chosen to match the fluorescence
emission from the
particular fluorophore being imaged) and this fluorescence emission from the
specimen is
focused by tube lens 125 onto two-dimensional detector array 811 inside
digital camera 812.
Pixel data from the active area of detector array 811 (the image frame) inside
digital camera 812
is read out by frame grabber 150 and passed to computer 801 during the scan.
Computer 801
passes the image frame data to Data Manipulation and Image Store 802 after
each frame has
been collected.
CA 03067870 2019-12-19
WO 2018/232521 PCT/CA2018/050764
16
When a previous scanner was used to scan a fluorescent specimen containing
multiple
fluorophores, one issue is how much exposure change is necessary before
scanning to detect the
fluorescence from the next fluorophore. This is particularly problematic when
scanning a series
of slides, each containing different fluorophores. The new multiple-exposure
MSIA scanner
described herein tends to address this issue.
Consider the following example, which is one of many possibilities. When the
MSIA
scanner described in Figure 8 is used with a 12-bit monochrome detector with
an active area of
16 rows, pixel data for each image frame (in this example an image frame
comprises 16 x 4000
pixels) is passed by computer 801 to Data Manipulation and Image Store (DMIS)
802. Since
there are 16 rows in the active area, and in this example a frame image is
acquired each time the
optical image of the specimen moves a distance equal to the distance between
rows of pixels,
each object point represented by a pixel in the scan strip image will be
exposed 16 times as the
scan proceeds. The exposure for each frame image is set before starting to
scan the specimen to
a value that will underexpose even the brightest fluorophore. After each frame
image is
acquired, computer 801 passes the image frame data to DMIS 802, where the data
representing
each object position is added to the image pixel position for that object
position in the
lengthening strip image. Each object position is imaged 16 times (in this
example), and this 12-
bit data is added to a 16-bit strip image store. The resulting 16-bit strip
image can be dynamic-
range compressed to fill the dynamic range of an output image for display and
analysis.
When a second fluorophore is scanned, even if it is much weaker than the
first, it is likely
that the new stored 16-bit image strip for that fluorophore can also be
compressed to fill the
dynamic range of a 12-bit image, so that no change in exposure will be
necessary to scan the
second fluorophore (of course activation filter 820 and emission filter 822
may have to be
changed before the second fluorophore is scanned). If the difference in
brightness of the
fluorophores is larger than can be accommodated with a 16-row active area, an
active area that is
larger (e.g. 256 rows) can be used to increase the exposure of dim
fluorophores even more. In
this situation (256 rows) it may make sense to compress the pixel data for the
strip images of the
brightest fluorophores to 16 bits during scan so the strip images that are
stored by DMIS 802 are
a maximum of 16 bits in size, which gives ample dynamic range for further
processing and is a
good file size for digital storage and processing.
CA 03067870 2019-12-19
WO 2018/232521 PCT/CA2018/050764
17
When the number of rows in the active area of the detector is increased
(either in
hardware or using software to process that number of rows near the centre of
the frame image),
the two optional steps described earlier become more valuable. When using an
active area with
256 rows, for example, the blurring effect of geometric distortion on the
scanned image is
increased, making it more helpful to correct each frame image (or at least the
active area) for
geometric distortion. In some examples, dark-frame subtraction may also be
used.
Figure 9 shows a schematic view of a multiple-exposure multispectral MSIA
scanner
for simultaneously imaging multiple fluorophores according to a third
embodiment. Light
from fluorescence excitation light source 915 is partially reflected by
beamsplitter 921 and is
transmitted by microscope objective 115 to illuminate specimen 900 from above
(illumination of
the specimen from above is called epi-illumination ¨ several other
arrangements to provide epi-
illumination are possible). Beamsplitter 921 is typically a dichroic
beamsplitter chosen to reflect
light from the light source and transmit fluorescence emission from the
specimen. Fluorescent
specimen 900 (which may contain fluorescent dyes, quantum dots or other
sources of
fluorescence) is mounted on specimen holder 101 on computer-controlled
scanning stage 105.
The motion of scanning stage 105 is controlled by computer 901 through wired
or wireless
connection 107. Motion of the scanning stage is in a direction perpendicular
to rows in the
detector array {data is read out from adjacent rows in the detector array,
where the rows are
usually along the long dimension of the array, as shown in the example in
Figure 5}. Computer
901 also controls the action of the shutter (usually an electronic shutter) in
digital camera 912.
Fluorescence from the specimen is collected by microscope objective 115 which
is held at a
focus position above the specimen by piezo positioner 120 (or other focusing
mechanism), and
this fluorescence emission from the specimen is focused by tube lens 125 onto
two-dimensional
detector array 911 inside digital camera 912. Two-dimensional detector array
911 includes a
scanning colour filter array, one example of which is shown in Figure 10.
A scanning colour filter array for fluorescence imaging is typically made up
of a repeat
pattern of rows (that extend across substantially the width of the array) of
different colour filters,
where each colour filter transmits the emission range (or part of the emission
range) of a
particular fluorophore, and where all of the filters in a row have the same
colour. Scanning
colour filter arrays have been designed for MSIA scanning such that when used
in MSIA
scanning, every pixel position in the final image contains full colour
information, typically with
CA 03067870 2019-12-19
WO 2018/232521 PCT/CA2018/050764
18
no interpolation required.
Figure 10 is a schematic view of the centre area of a scanning colour filter
array with five
colour filters that are emission filters for five different fluorophores
(although five different
colour filters are used in this example, scan filters with a different number
of filters are common
and may be used). In this example, each row of filters is different from those
in adjacent rows,
and the five rows form a repeat pattern that is typically repeated across the
entire surface (or
substantially the entire surface) of the sensor array (at least across the
entire active area of the
array). (Note that in some examples of scanning colour filter arrays, the same
colour filters may
appear in sets of two, three or more rows.) For the present example, assume
that the repeat
pattern is repeated 16 times inside the active area, so that the active area
contains 80 rows, and
that detector array 911 is a 12-bit detector array. In this particular
example, every object position
is exposed 16 times for each of the five colours, and during each MSIA scan,
DMIS 902 stores
five strip images, each of 16 bit dynamic range, one for each of the five
fluorophores. As in the
previous example, this results in image strips with an exposure range of a
factor of five, but in
this embodiment an image strip for each of the five colours has been acquired
in a single
scan, and each image strip can be compressed to a smaller dynamic range,
resulting in five
different fluorescence image strips, each with an exposure value that is
appropriate for the
strength of the fluorescence displayed in that image strip.
In order to estimate how valuable this technique is for fluorescence
(multispectral)
imaging, assume that the illumination intensity, shutter speed and detector
gain are set so that in
the 16-bit image strip (or inside a specimen area of interest in this image
strip) for the brightest
fluorophore (which we will call F1), the maximum pixel intensity is 65,000
(this is the brightest
pixel in the image strip for Fl, and is the sum of 16 12-bit pixels that are
nearly saturated). In the
dynamic-range compressed 12-bit image strip for Fl, that same pixel can be
compressed to a
value of 4096 (the brightest pixel in a 12-bit image) by multiplying by
4096/65000, to become
the brightest pixel available in a 12-bit image. All other pixel values in
that 16-bit image strip
are then also multiplied by 4096/65000 to calculate their values in a 12-bit
image strip where the
maximum pixel value is 4096. Now assume that the brightest pixel in the 16-bit
image strip for
the weakest fluorophore (which we will call F2) is 5000. If the exposure of F2
had been set
perfectly in a 12-bit scan, that brightest pixel should have the value 4096.
Thus in DMIS 902 all
of the pixel values for F2 in the 12-bit image strip should be multiplied by
4096/5000, resulting
CA 03067870 2019-12-19
WO 2018/232521 PCT/CA2018/050764
19
in a 12-bit strip image for F2 that has full dynamic range, just as if it had
been acquired in a
single scan in which the illumination intensity, shutter speed and detector
gain had been set
perfectly to match the brightness of F2. When the 16-bit image strips are
compressed to 12 bits
for analysis and display, the resulting image strips for both the brightest
and the weakest
fluorophore and all of the others in between, will have a complete 12-bit
dynamic range. In
order to achieve this result with a non-MSIA scanner, the exposure of each of
the fluorophores
would have to be set perfectly and each fluorophore scanned separately. The
exposure for the
weakest fluorophore would have to be increased by a factor of approximately
16, normally by
increasing the exposure time by a factor of 16 (decreasing the shutter speed
by a factor of 16,
which normally means the scan speed must be reduced), or by increasing the
illumination
intensity, or a combination of increased illumination intensity and decreased
shutter speed, and
the scan would be repeated for each fluorophore with new exposure settings for
each scan.
If the range of brightness of the fluorophores being imaged is even greater
than a factor
of 16, the effective exposure time using MSIA can be increased even further by
increasing the
active area to increase the number of repeat patterns of the scan colour
filter array, without
changing the shutter speed of the camera, the illumination intensity, or the
scan speed. Using the
MSIA-based technique described herein, it is possible to image multiple
fluorophores
simultaneously, each with an effective exposure time that results in an image
with a good
range of brightness, and in a single scan. In addition, the fluorescence image
strips are
perfectly registered with each other because they were all acquired during the
same scan.
In addition to using a scanning colour filter array, it is also possible to
use a mosaic scan
filter array in detector array 911. A "mosaic scan filter array" is generally
defined as a mosaic
filter array that is designed for high resolution imaging using MSIA scanning,
typically where
the resulting image has full colour information at each pixel position and
typically without
demosaicing or interpolation. In a mosaic scan filter array, each row of tiles
is typically
translated with respect to the next row of tiles in the same direction and
perpendicular to the scan
direction by one pixel position.
A schematic presentation of the center area of an example mosaic scan filter
array for
hyperspectral imaging is shown in Fig. 13. This example uses six different
filters arranged in
one-row by six-column tiles, however tiles can be arranged generally with any
number of
CA 03067870 2019-12-19
WO 2018/232521 PCT/CA2018/050764
different filters positioned in a rectangular arrangement, where all tiles in
an array are typically
identical. For fluorescence imaging (multispectral imaging), the same design
can be used where
the filters Cl through C6 (which are fabricated for hyperspectral imaging) can
be replaced by a
series of fluorescence emission filters, Fl through F6 (when imaging six
different fluorophores).
In this example, the repeat pattern is 6 rows and is repeated across the
active area of the detector
array. In this example, each tile in the mosaic is a rectangle 1 pixel high by
6 pixels wide. If the
position of colour filters in the tiles is rearranged to form tiles 2 pixels
high by 3 pixels wide (a
base pattern 2 pixels high), or 3 pixels high by 2 pixels wide (a base pattern
3 pixels high), the
result after MSIA scanning is the same ¨ all six colours have been acquired
for every pixel
position in the final image strip when the image of the specimen has moved a
distance equal to
the repeat pattern across the surface of the detector array.
Mosaic scan filter arrays can be designed to include any number of
fluorophores, and can
also include additional filters for R,G,B and W(clear) imaging in MSIA scans
that are separate
from the fluorescence scan.
"Hyperspectral imaging" generally refers to the method and technology for
acquiring
images in which each pixel is represented by a spectrum composed of narrow
spectral bands over
a continuous spectral range. "Imaging spectroscopy" generally refers to the
acquisition and
processing of hyperspectral images. Many technologies for hyperspectral
imaging are based on
the use of a diffractive element, like a prism or diffraction grating, to
break up the light into its
spectrum. Imaging is commonly performed on a point-by-point basis, or a line-
by-line basis.
One of many applications of hyperspectral imaging is the use of
photoluminescence imaging to
map the optical and electronic properties of semiconductors.
Figure 11 shows a schematic view of a multiple-exposure hyperspectral MSIA
scanner for spectral imaging according to a fourth embodiment. Light from
light source
1115 is partially reflected by beamsplitter 1121 and is transmitted by
microscope objective 115 to
illuminate specimen 1100 from above (illumination of the specimen from above
is called epi-
illumination ¨ several other arrangements to provide epi-illumination are
possible). For this
example, assume specimen 1100 is a photoluminescent specimen, like a compound
semiconductor wafer. Beamsplitter 1121 is typically a dichroic beamsplitter
chosen to reflect
light from the light source and transmit light returning from the specimen.
Specimen 1100 is
CA 03067870 2019-12-19
WO 2018/232521 PCT/CA2018/050764
21
mounted on specimen holder 101 on computer-controlled scanning stage 105. The
motion of
scanning stage 105 is controlled by computer 1101 through wired or wireless
connection 107.
Motion of the microscope stage is in a direction perpendicular to rows in the
detector array {data
is read out from adjacent rows in the detector array, where the rows are
usually along the long
dimension of the array, as shown in the example in Figure 5}. Computer 1101
also controls the
action of the shutter (usually an electronic shutter) in digital camera 1112.
Photoluminescence
from the specimen is collected by microscope objective 115 which is held at a
focus position
above the specimen by piezo positioner 120 (or other focusing mechanism), and
this
photoluminescence emission from the specimen is focused by tube lens 125 onto
two-
dimensional detector array 1111 inside digital camera 1112. Two-dimensional
detector array
1111 includes a scanning colour filter array for hyperspectral imaging, one
example of which is
shown in Figure 12.
A scanning colour filter array for photoluminescence imaging is typically made
up of a
repeat pattern of rows (that extend across substantially the width of the
array) of different colour
filters, where all of the filters in a row have the same colour, where each
colour filter transmits a
narrow spectral band, where the narrow spectral bands transmitted by the
colour filters in the
array together transmit an entire spectrum of light from the specimen.
Scanning colour filter
arrays have been designed for MSIA scanning such that when used in MSIA
scanning, every
pixel position in the final image contains full colour information (in this
case a full spectrum),
typically with no interpolation required.
Figure 12 is a schematic view of the centre area of a scanning colour filter
array with
colour filters that transmit six adjacent narrow spectral bands that together
make up a spectrum.
In this example, each row of filters transmits a narrow spectral band that is
adjacent in
wavelength to those in adjacent rows, and the six rows form a repeat pattern
that is typically
repeated across the entire surface (or substantially the entire surface) of
the sensor array (at least
across the entire active area of the array). In this example the filter array
transmits a spectrum
containing six narrow spectral bands, however scanning colour filter arrays
can be made with
either fewer or more adjacent narrow spectral bands by decreasing or
increasing the number of
rows of filters in the repeat pattern. (Note that in some examples of scanning
colour filter arrays,
CA 03067870 2019-12-19
WO 2018/232521 PCT/CA2018/050764
22
the same colour filters may appear in sets of two, three or more rows.) For
the present example,
assume that the repeat pattern is repeated 16 times inside the active area, so
that the active area
contains 96 rows, and that detector array 1111 is a 12-bit detector array. In
this particular
example, every object position is exposed 16 times for each of the six
colours, and during each
MSIA scan, DMIS 1102 stores six strip images, each of 16 bit dynamic range,
one for each of the
six colour filters. In this embodiment an image strip for each of the six
colours in the
spectrum has been acquired in a single scan. These six image strips are
perfectly registered
with each other because they were all acquired during the same scan, and can
be assembled into
a single six-colour image strip by DMIS 1102, and these image strips can be
further combined
into a single six-colour image of the entire specimen (or the area of interest
in the specimen).
In order to estimate how valuable this technique is for hyperspectral imaging,
assume that
the illumination intensity, shutter speed and detector gain are set so that in
the 16-bit image strip
(or inside a specimen area of interest in this image strip) for the brightest
pixel in the brightest
narrow spectral band (which for this example we assume is Cl), the maximum
measured pixel
intensity P16max is 60,000 (this is the brightest pixel in the 16-bit image
strip for Cl in this
particular specimen), and is the MSIA sum of 16 12-bit pixels that are nearly
saturated. In the
compressed 12-bit image strip for Cl, that same pixel will have a value of
(60,000/65,536)*4096=3750. However if that pixel is the brightest in the
spectrum being
measured, in order to achieve the best dynamic range for the entire spectrum
when compressing
the spectrum to 12 bits for viewing or further analysis, it would be best to
compress the
maximum 16-bit measured pixel value (in this example the maximum measured
value was
60,000) to 4096, the largest value that can be viewed in a 12-bit image. This
can be
accomplished by multiplying all 16-bit pixel values, in all six MSIA image
strips, by 4096/3750.
Then all values in the 16-bit image strip for Cl (and for C2 to C6) can be
compressed to 12 bits
by multiplying the 16-bit pixel values P16 resulting from MSIA addition of 12-
bit values by
4096/P16max, where P16max is the largest 16-bit pixel value resulting from the
MSIA calculation.
Thus,
P12 = P16 * (4096/P16max),
where P12 is the pixel value after compression to 12-bits, where that
compression yields a full 12-
bit dynamic range for the contracted spectrum, P16 is the measured 16-bit
value for that pixel
after MSIA addition, and P16max is the maximum 16-bit pixel value measured
after MSIA
CA 03067870 2019-12-19
WO 2018/232521 PCT/CA2018/050764
23
addition in any of the 16-bit image strips, for any of the narrow spectral
bands.
In addition to using a scanning colour filter array, it is also possible to
use a mosaic scan
filter array in detector array 1111. A "mosaic scan filter array" is generally
defined as a mosaic
filter array that is designed for high resolution imaging using MSIA scanning,
typically where
the resulting image has full colour information at each pixel position and
typically without
demosaicing or interpolation. In a mosaic scan filter array, each row of tiles
is typically
translated with respect to the next row of tiles in the same direction and
perpendicular to the scan
direction by one pixel position. A schematic presentation of a mosaic scan
filter array for
hyperspectral imaging is shown in Fig. 13. In this example, the repeat pattern
is 6 rows and is
repeated across the active area of the detector array. In this example, each
tile in the mosaic is a
rectangle 1 pixel high by 6 pixels wide. If the position of colour filters in
the tiles is rearranged
to form tiles 2 pixels high by 3 pixels wide (a base pattern 2 pixels high),
or 3 pixels high by 2
pixels wide (a base pattern 3 pixels high), the result after MSIA scanning is
the same ¨ all six
colours have been acquired for every pixel position in the final image strip
when the image of the
specimen has moved a distance equal to the repeat pattern across the surface
of the detector
array. Mosaic scan filter arrays can be designed to include any number of
filters that define
narrow spectral bands, and can also include additional filters for R,G,B and
W(clear) imaging in
MSIA scans that are separate from the hyperspectral imaging scan.
When the number of rows in the active area of the detector is increased
(either in
hardware or using software to process only rows near the centre of the frame
image, for both
multispectral and hyperspectral imaging), the two optional steps described
earlier become more
important. When using an active area with 256 rows, for example, the effect of
geometric
distortion on the scanned image is increased, making it more important to
correct each frame
image (or at least the active area) for geometric distortion, and dark-frame
subtraction can also
be used if required to further reduce noise in the image.
CA 03067870 2019-12-19
WO 2018/232521 PCT/CA2018/050764
24
HIGH DYNAMIC RANGE (HDR) and IDR IMAGING
In digital photography, a scene often has a greater dynamic range than can be
captured by
the camera's sensor in a single exposure. One example is landscape photography
at sunset or
sunrise, where the sun is extremely bright, but where shadows can be very
dark. Commonly, the
photographer sets the exposure by adjusting the exposure time (shutter speed),
lens aperture and
detector gain to get the "best exposure" possible in the circumstances, but
the setting sun is
overexposed and shadow detail is lost in the dark areas of the picture. In
order to capture a larger
dynamic range, a technique known as HDR (High Dynamic Range) imaging has been
developed
to enable the capture of images with a dynamic range that is higher than that
of the camera's
sensor. This is accomplished by capturing a series of images of the same scene
using different
exposures and combining the series of images to produce a single image with a
larger dynamic
range, without moving the camera. Commonly, the different exposures are
accomplished by
changing the shutter speed from one exposure to the next, without moving the
camera.
Sometimes this is combined with changes in detector gain, but the lens
aperture is kept constant
to ensure that the depth of field is constant in the series of exposures.
Most commonly, a series of exposures are acquired in which the first image
frame has the
exposure that would be chosen by the photographer to best expose the image in
a single frame
(in the example above, most pixels in the image of the setting sun would be
saturated, and
shadows would be very dark with little detail). A second exposure is taken in
which the shutter
speed is half that used for the first exposure (half the exposure time),
reducing the exposure by a
factor of 2. In this second exposure, the sun and the area around it are not
as bright as in the first
exposure, and detail is increased in this part of the image. If the sun is
still overexposed, a third
exposure can be made using half the shutter speed of the second exposure,
adding even more
detail to the area of the image around the sun. In order to add detail to the
shadow areas, a fourth
exposure is made using a shutter speed that is twice that used in the first
exposure (double the
exposure time) which brightens the shadow areas in the image, adding detail to
the shadows. If
the shadows are still too dark, a fifth exposure can be made using an even
longer shutter speed
(twice the exposure time of the fourth exposure), brightening the shadows even
more. This is
equivalent to taking five exposures, where the first exposure is Eo, followed
by E0-1EV, E0-2EV,
E0+1EV and E0+2EV.
CA 03067870 2019-12-19
WO 2018/232521 PCT/CA2018/050764
Many digital photography cameras have been programmed to automatically expose
and
store a series of images with changes in exposure like those above. In digital
photography, the
series of images is commonly centered on the "best exposure" image. In many
cases, fewer
images can be recorded with 2EV steps between images, with good results when
the images are
combined to produce an HDR image. Software has been developed to combine a
series of
images with different exposure values to produce a single HDR image, to
control how the tones
are mapped to produce an image for viewing, and to compress the dynamic range
in the image
for storage and for viewing on an output device (i.e., a printer, computer
screen, etc.) or for
additional processing.
When using MSIA scanning, it has been discovered that it is also possible to
generate (in
some cases in a single scan) a series of strip images that have the same
dynamic range, but with
different effective exposures. Let's return for example to the multiple-
exposure brightfield
greyscale MSIA scanner shown in Fig. 6, and to the series of image strips
shown in Fig. 7. In
this example, the dynamic range of the detector array was 12 bits. In Fig. 7,
strip 1 is a 12-bit
image where the exposure was chosen to ensure that there are no saturated
pixels (or at least no
saturated pixels in the area of interest in the specimen). Strip 2 is a 13-bit
image where the
exposure has been increased by lEV, and Strip 3 is a 14-bit image where the
exposure has been
increased by 2EV (as compared to Strip 1).
One can now generate an HDR image using this image data, such as by using the
HDR
software that has been developed for photography. To do so, it is necessary in
this example to
change Strip 2 into a 12-bit image with +1EV in exposure, and Strip 3 into a
12-bit image with
+2EV. In an image with a 12-bit dynamic range, the maximum value for a pixel
is 4095. Strip 2
can be converted into a 12-bit image that has twice the effective exposure of
Strip 1, and was
generated by a detector array with a dynamic range of 12 bits, by replacing
every pixel value in
strip 2 that has a value larger than 4095 with the value 4095 (i.e., the value
for a saturated pixel).
In the same way, Strip 3 can be converted into a 12-bit image with four times
the effective
exposure of strip 1 by replacing every pixel value in strip 3 that is larger
than 4095 with the
value 4095.
Using this process, three strip images with three effective exposures have
been generated
that correspond to the images normally used for HDR imaging software that was
developed for
photographing stationary scenes. This type of software can therefore now be
used to combine the
CA 03067870 2019-12-19
WO 2018/232521 PCT/CA2018/050764
26
three strip images and to tone map the final strip image for viewing (i.e., on
a display screen).
Notably, a larger number of effective exposures can be made when there is a
large difference in
brightness in the specimen data.
One interesting and major advantage of MSIA imaging in some cases (when
performing
HDR imaging) is that (in some exemplary embodiments) all of the images with
different
effective exposure values can be generated from a single scan.
MSIA HDR imaging techniques are very useful when capturing colour images, like
those
obtained when scanning tissue or other biological specimens that have been
dyed. Figure 14
shows a schematic view of a multiple exposure brightfield MSIA scanner for EDR
or HDR
imaging according to a fifth embodiment. Light from white light source 1410
illuminates a
specimen 1402 from beneath, the specimen is mounted on specimen holder 101 on
computer-
controlled scanning stage 105. Biological specimens are normally covered by a
thin transparent
cover slip (not shown). The motion of scanning stage 105 is controlled by
computer 1406
through wired or wireless connection 107. Motion of the scanning stage is in a
direction
perpendicular to rows in the detector array {data is read out from adjacent
rows in the detector
array, where the rows are usually along the long dimension of the array, as
shown for example
in Figure 2}. Computer 1406 also controls motion of scanning stage 105 and the
action of the
shutter (usually an electronic shutter) in digital camera 1412. Light from the
specimen is
collected by microscope objective 115 which is held at a focus position above
the specimen by
piezo positioner 120 (or other focusing mechanism) and this light from the
specimen is focused
by tube lens 125 onto two-dimensional colour detector array 1411 inside
digital camera 1412.
In this example, which is one of many possibilities, colour detector array
1411 includes
an RGBW scan filter array, the centre of which is shown in Figure 3 that has
an active area of 64
rows that extends across the width of the array, and a 4 row repeat pattern.
In this MSIA
imaging example we will discard the data for the W pixels, and consider only
the R, G and B
pixel data. (The W pixels are commonly used in MSIA scanning as panchromatic
elements, and
can also be used with epi-illumination and separate emission filters for MSIA
fluorescence
scanning.) Pixel data from the active area of detector array 1411 (the image
frame) inside digital
camera 1412 is read out by frame grabber 150 and passed to computer 1406
during the scan.
CA 03067870 2019-12-19
WO 2018/232521 PCT/CA2018/050764
27
Computer 1406 passes the image frame data to Data Manipulation and Image Store
1407 after
each frame has been collected.
In this example, the active area on the detector array is defined as 64 rows,
so if an image
frame is acquired every time the optical image of the specimen moves a
distance equal to the
distance between adjacent rows in the detector, every object pixel position is
exposed 16 times
for each of the four colours (R, G, B and W) as the scan proceeds. Exposure
for each single
image frame is set by adjusting the illumination intensity and shutter speed
{where the shutter
speed should be fast enough so the shutter is open for a time that is less
than half the time it takes
for the scanned image to move a distance equal to the distance between rows of
pixels in the
detector array (1/10 of the time is better)}.
The exposure should be adjusted so that no (or very few) pixels in the image
frames
containing information about the area of interest in the specimen are
saturated. If we are using a
camera 1412 with a dynamic range of 12-bits (in this example), after 16
exposures are added
together in the MSIA scan, the largest possible value stored in the image
strip store for any one
colour is 4095*16=65,520. This is essentially a 16-bit image store for each
colour, and the three
colour image strips can be combined into an extended dynamic range (EDR) 48-
bit RGB colour
image strip. This extended dynamic range colour image strip can then be
compressed in
dynamic range and tone mapped to provide a final image strip for storage,
viewing or further
image processing.
On the other hand, the HDR methods that were developed for photography and
discussed
earlier can also be used in this situation. Since we are using a 12-bit
camera, we can define a
base exposure Eo as the exposure of a 12-bit image, and as before, the base
exposure should be
set so there are no saturated pixels in the area of interest in the specimen.
An image with a dynamic range of 12 bits and effective exposure Eo is
generated by
dividing all 16 bit pixel values for each colour in the 48-bit RGB colour
image strip by 16.
An image strip with an effective exposure E0+1EV can be generated by dividing
by 8,
one with an effective exposure E0+2EV can be generating by dividing by 4, one
with an effective
exposure E0+3EV can be generated by dividing by 2, and the original 48-bit
colour image strip
has an actual exposure of E0+4EV.
CA 03067870 2019-12-19
WO 2018/232521 PCT/CA2018/050764
28
In each of these five strip images, pixel values for each colour that are
larger than 4095
are replaced by 4095, resulting in a series of five strip images that each
have a dynamic range of
12 bits, but different effective exposures (which in this case differ by a
factor of 2).
Note that in addition to being able to generate all of these strip images
using a single
scan, the strip images benefit from noise reduction because of MSIA averaging.
These five strip
images can be loaded into an HDR imaging program to generate an HDR image,
which in turn
can then be tone mapped and compressed in dynamic range for viewing, storing
and further
computation.
In some cases, in order to increase the number of levels stored while reducing
the file
size, HDR images may be saved in floating-point format. When compressing HDR
images for
viewing, local tone-mapping algorithms may be used to increase local contrast
and detail in the
LDR image (one area where this may be useful is in tissue imaging). In other
applications,
global tone-mapping algorithms may be used to compress the colours in the HDR
image in a
linear way.
Generally speaking, according to some of the teachings herein, two or more
strip images
can be generated using MSIA-processed image data (particularly image data
taken from a single
scan), with each strip image having a different effective exposure. In
particular, the effective
exposure of each of these strip images can be varied by dividing or
multiplying the bit pixel
values for each image by a particular amount, such as by a positive integer.
For example, the 16
bit pixel values for a particular strip image can be divided by 16 to generate
a first strip image
having a first effective exposure, and can be divided by 8 to generate a
second strip image having
a second effective exposure.
A plurality of strip images with different effective exposures can then be
combined (i.e.,
using HDR software or other comparable techniques) to generate an image with
an increased
dynamic range (an DR image). In some cases, the combination can be done by
adding a
plurality of strip images together, by averaging a plurality of strip images
together, or by a
combination of adding and averaging a plurality of strip images together.
In some cases, n strip images with different effective exposures can be
generated by
dividing or multiplying the bit pixel values by n different integers, and then
combined to
generate an image of the specimen, such as an DR image.
CA 03067870 2019-12-19
WO 2018/232521 PCT/CA2018/050764
29
The number and effective exposures of the strip images can be selected in a
manner that
is generally more flexible than the exposure values typically associated with
HDR imaging. In
particular, in some cases the dynamic range of the DR image can be extended
beyond the
dynamic range that might be available using HDR imaging. Such teachings could
be used for
brightness balancing, for example, or for other applications.
For example, one such application is automatic exposure adjustment. In
particular, by
adding, averaging, and/or otherwise combining strip images having different
effective exposures,
the teachings herein lend themselves to provide automatic exposure adjustment
of a particular
specimen (e.g., after the specimen has been scanned). In particular, image
data of a specimen can
be captured generally using a detector that may be set to a certain exposure
setting (i.e., a normal
exposure setting for brightfield imaging, or for fluorescence imaging), and
generally without the
need to tinker or adjust the detector settings to accommodate very bright or
very dim specimens
(in some cases similar adjustments need not be made to shutter speed, etc.) By
using this image
data to generate multiple strip images with different effective exposures, the
resulting image of
the specimen (i.e., the DR image) that is generated can be "calibrated" or
"tuned" to desired
particular exposure levels. This can allow, for example, one image of a
specimen to provide high
levels of detail of very dim fluorescent artifacts. Moreover, in some cases a
different image of
the specimen can be generated using the same image data that shows artifacts
at a different level
of brightness. This flexibility can eliminate or at least reduce the need to
change the exposure of
the detector in order to detect artifacts of different brightness within a
particular specimen, and in
effect allows for automatically adjusting the exposure of the detector after
the specimen has been
scanned.