Note: Descriptions are shown in the official language in which they were submitted.
CA 03072107 2020-02-04
WO 2019/067213
PCT/US2018/050639
SYSTEMS AND METHODS FOR ESTIMATING RESERVOIR PRODUCTIVITY As A
FUNCTION OF DEPTH IN A SUBSURFACE VOLUME OF INTEREST
FIELD OF THE DISCLOSURE
[0001] The present disclosure relates to systems and methods for estimating
reservoir productivity as a function of depth in a subsurface volume of
interest.
SUMMARY
[0002] An aspect of the present disclosure relates to a method for
estimating
reservoir productivity as a function of depth in a subsurface volume of
interest. The
method may include obtaining, from the non-transient electronic storage,
subsurface
data and well data corresponding to a subsurface volume of interest. The
subsurface
data and the well data may include production parameter values for multiple
production parameters as a function of position in the subsurface volume of
interest,
thereby characterizing subsurface production features that affect the
reservoir
productivity. The method may include obtaining, from the non-transient
electronic
storage, a parameter model. The parameter model may have been conditioned by
training an initial parameter model using training data. The training data
includes (i)
the well data of one or more wells in the subsurface volume of interest and
(ii) the
production parameter values for corresponding multiple production parameters
affecting productivity of the one or more wells as a function of position in
the
subsurface volume of interest. The method may include using, with the one or
more
physical computer processors, the subsurface data and the well data to
generate
multiple production parameter maps. A given production parameter map may
represent the production parameter values for a given production parameter as
a
1
CA 03072107 2020-02-04
WO 2019/067213
PCT/US2018/050639
function of time and position in the subsurface volume of interest. The method
may
include applying, with the one or more physical computer processors, the
parameter
model to the multiple production parameter maps to generate refined production
parameter values. The method may include generating, with the one or more
physical computer processors, multiple refined production parameter graphs
from
the refined production parameter values wherein a given refined production
parameter graph specifies the refined production parameter values for a
corresponding production parameter as a function of well production. The
method
may include displaying, via the graphical user interface, the multiple refined
production parameter graphs. The method may include generating, with the one
or
more physical computer processors, one or more user input options to limit the
refined production parameter values corresponding to individual ones of the
multiple
refined production parameters. The method may include receiving, via the
graphical
user interface, the one or more user input options selected by a user to limit
the
refined production parameter values corresponding to the multiple refined
production
parameter graphs to generate limited production parameter values. The method
may
include generating, with the one or more physical computer processors, a
representation of estimated reservoir productivity as a function of depth in
the
subsurface volume of interest using visual effects to depict at least a
portion of the
limited production parameter values, based on the one or more user input
options
selected. The method may include displaying, via the graphical user interface,
the
representation.
[0003] An aspect of the present disclosure relates to a system configured
for
estimating reservoir productivity as a function of depth in a subsurface
volume of
interest. The system may include one or more hardware processors configured by
2
CA 03072107 2020-02-04
WO 2019/067213
PCT/US2018/050639
machine-readable instructions. The processor(s) may be configured to obtain,
from
the non-transient electronic storage, subsurface data and well data
corresponding to
a subsurface volume of interest. The subsurface data and the well data may
include
production parameter values for multiple production parameters as a function
of
position in the subsurface volume of interest, thereby characterizing
subsurface
production features that affect the reservoir productivity. The processor(s)
may be
configured to obtain, from the non-transient electronic storage, a parameter
model.
The parameter model may been conditioned by training an initial parameter
model
using training data. The training data may include (i) the well data of one or
more
wells in the subsurface volume of interest and (ii) the production parameter
values
for corresponding multiple production parameters affecting productivity of the
one or
more wells as a function of position in the subsurface volume of interest. The
processor(s) may be configured to use, with the one or more physical computer
processors, the subsurface data and the well data to generate multiple
production
parameter maps. A given production parameter map may represent the production
parameter values for a given production parameter as a function of time and
position
in the subsurface volume of interest. The processor(s) may be configured to
apply,
with the one or more physical computer processors, the parameter model to the
multiple production parameter maps to generate refined production parameter
values. The processor(s) may be configured to generate, with the one or more
physical computer processors, multiple refined production parameter graphs
from
the refined production parameter values wherein a given refined production
parameter graph specifies the refined production parameter values for a
corresponding production parameter as a function of well production. The
processor(s) may be configured to display, via the graphical user interface,
the
3
multiple refined production parameter graphs. The processor(s) may be
configured
to generate, with the one or more physical computer processors, one or more
user
input options to limit the refined production parameter values corresponding
to
individual ones of the multiple refined production parameters. The
processor(s) may
be configured to receive, via the graphical user interface, the one or more
user input
options selected by a user to limit the refined production parameter values
corresponding to the multiple refined production parameter graphs to generate
limited production parameter values. The processor(s) may be configured to
generate, with the one or more physical computer processors, a representation
of
estimated reservoir productivity as a function of depth in the subsurface
volume of
interest using visual effects to depict at least a portion of the limited
production
parameter values, based on the one or more user input options selected. The
processor(s) may be configured to display, via the graphical user interface,
the
representation.
[0003A] In another aspect, there is a computer-implemented method for
estimating
reservoir productivity as a function of depth in a subsurface volume of
interest, the
method being implemented in a computer system that includes one or more
physical
computer processors, non-transient electronic storage, and a graphical user
interface, comprising:
obtaining, from the non-transient electronic storage, subsurface data and well
data corresponding to the subsurface volume of interest, wherein the
subsurface
data and the well data include production parameter values for multiple
production
parameters as a function of position in the subsurface volume of interest,
thereby
characterizing subsurface production features that affect the reservoir
productivity;
4
Date Recue/Date Received 2021-08-06
obtaining, from the non-transient electronic storage, a parameter model, the
parameter model having been conditioned by training an initial parameter model
using training data, wherein the training data includes (i) the well data of
one or more
wells in the subsurface volume of interest, and (ii) the production parameter
values
for corresponding multiple production parameters affecting productivity of the
one or
more wells as a function of position in the subsurface volume of interest;
using, with the one or more physical computer processors, the subsurface
data and the well data to generate multiple production parameter maps, wherein
a
given production parameter map represents the production parameter values for
a
given production parameter as a function of time and position in the
subsurface
volume of interest;
applying, with the one or more physical computer processors, the parameter
model to the multiple production parameter maps to generate refined production
parameter values, wherein the parameter model facilitates identification of
relative
effect of individual ones of the multiple production parameters on the
productivity
such that one or more of the multiple production parameters that have greatest
effect
on the productivity are identified;
generating, with the one or more physical computer processors, multiple
refined production parameter graphs from the refined production parameter
values,
wherein a given refined production parameter graph specifies the refined
production
parameter values for a corresponding production parameter as a function of the
productivity via a plot of the refined production parameter values versus the
productivity, the given refined production parameter graph providing
visualization of
marginal effect of the given production parameter on the productivity, the
4a
Date Recue/Date Received 2021-08-06
visualization of the marginal effect enabling an interpretation of natural
thresholds or
trends on the productivity;
displaying, via the graphical user interface, the multiple refined production
parameter graphs;
generating, with the one or more physical computer processors, one or more
user input options to limit the refined production parameter values
corresponding to
individual ones of the multiple refined production parameter graphs, wherein
the one
or more user input options to limit the refined production parameter values
corresponding to the individual ones of the multiple refined production
parameter
graphs include an option to define a user-identified trend of values of the
given
production parameter and values of the productivity;
receiving, via the graphical user interface, the one or more user input
options
selected by a user to limit the refined production parameter values
corresponding to
the multiple refined production parameter graphs to generate limited
production
parameter values;
based on the one or more user input options selected, generating, with the
one or more physical computer processors, a representation of an estimated
reservoir productivity as a function of depth in the subsurface volume of
interest
using visual effects to depict at least a portion of the limited production
parameter
values as a function of position in the subsurface volume of interest; and
displaying, via the graphical user interface, the representation.
[0003B] In another aspect, there is a computer-implemented method for
estimating reservoir productivity as a function of depth in a subsurface
volume of
interest, the method being implemented in a computer system that includes one
or
4h
Date Recue/Date Received 2021-08-06
more physical computer processors, non-transient electronic storage, and a
display,
comprising:
obtaining, from the non-transient electronic storage, subsurface data and well
data corresponding to the subsurface volume of interest, wherein the
subsurface
data and the well data include production parameter values for multiple
production
parameters as a function of position in the subsurface volume of interest,
thereby
characterizing subsurface production features that affect the reservoir
productivity;
obtaining, from the non-transient electronic storage, a parameter model, the
parameter model having been conditioned by training an initial parameter model
using training data, wherein the training data includes (i) the well data of
one or more
wells in the subsurface volume of interest, and (ii) the production parameter
values
for corresponding multiple production parameters affecting productivity of the
one or
more wells as a function of position in the subsurface volume of interest;
using, with the one or more physical computer processors, the subsurface
data and the well data to generate multiple production parameter maps, wherein
a
given production parameter map represents the production parameter values for
a
given production parameter as a function of time and position in the
subsurface
volume of interest;
applying, with the one or more physical computer processors, the parameter
model to the multiple production parameter maps to generate refined production
parameter values, wherein the parameter model facilitates identification of
relative
effect of individual ones of the multiple production parameters on the
productivity
such that one or more of the multiple production parameters that have greatest
effect
on the productivity are identified, wherein the relative effect of the
individual ones of
4c
Date Recue/Date Received 2021-08-06
the multiple production parameters on the productivity is presented within a
Boruta
plot;
generating, with the one or more physical computer processors, multiple
refined production parameter graphs from the refined production parameter
values,
wherein a given refined production parameter graph specifies the refined
production
parameter values for a corresponding production parameter as a function of the
productivity via a plot of the refined production parameter values versus the
productivity, the given refined production parameter graph providing
visualization of
marginal effect of the given production parameter on the productivity, the
visualization of the marginal effect enabling an interpretation of natural
thresholds or
trends on the productivity;
displaying, via the graphical user interface, the multiple refined production
parameter graphs; and
generating, with the one or more physical computer processors, one or more
user input options to limit the refined production parameter values
corresponding to
individual ones of the multiple refined production parameter graphs, wherein
the one
or more user input options to limit the refined production parameter values
corresponding to the individual ones of the multiple refined production
parameter
graphs include an option to define a user-identified trend of values of the
given
production parameter and values of the productivity.
[0003C] In
another aspect, there is a system configured for estimating reservoir
productivity as a function of depth in a subsurface volume of interest, the
system
comprising:
non-transient electronic storage;
a graphical user interface; and
4d
Date Recue/Date Received 2021-08-06
one or more physical computer processors configured by machine-readable
instructions to:
obtain, from the non-transient electronic storage, subsurface data and
well data corresponding to the subsurface volume of interest, wherein the
subsurface data and the well data include production parameter values for
multiple production parameters as a function of position in the subsurface
volume of interest, thereby characterizing subsurface production features that
affect the reservoir productivity;
obtain, from the non-transient electronic storage, a parameter model,
the parameter model having been conditioned by training an initial parameter
model using training data, wherein the training data includes (i) the well
data
of one or more wells in the subsurface volume of interest, and (ii) the
production parameter values for corresponding multiple production
parameters affecting productivity of the one or more wells as a function of
position in the subsurface volume of interest;
use, with the one or more physical computer processors, the
subsurface data and the well data to generate multiple production parameter
maps, wherein a given production parameter map represents the production
parameter values for a given production parameter as a function of time and
position in the subsurface volume of interest;
apply, with the one or more physical computer processors, the
parameter model to the multiple production parameter maps to generate
refined production parameter values, wherein the parameter model facilitates
identification of relative effect of individual ones of the multiple
production
parameters on the productivity such that one or more of the multiple
4e
Date Recue/Date Received 2021-08-06
production parameters that have greatest effect on the productivity are
identified;
generate, with the one or more physical computer processors, multiple
refined production parameter graphs from the refined production parameter
values, wherein a given refined production parameter graph specifies the
refined production parameter values for a corresponding production
parameter as a function of the productivity via a plot of the refined
production
parameter values versus the productivity, the given refined production
parameter graph providing visualization of marginal effect of the given
production parameter on the productivity, the visualization of the marginal
effect enabling an interpretation of natural thresholds or trends on the
productivity;
display, via the graphical user interface, the multiple refined production
parameter graphs;
generate, with the one or more physical computer processors, one or
more user input options to limit the refined production parameter values
corresponding to individual ones of the multiple refined production parameter
graphs, wherein the one or more user input options to limit the refined
production parameter values corresponding to the individual ones of the
multiple refined production parameter graphs include an option to define a
user-identified trend of values of the given production parameter and values
of
the productivity;
receive, via the graphical user interface, the one or more user input
options selected by a user to limit the refined production parameter values
corresponding to the multiple refined production parameter graphs to
4f
Date Recue/Date Received 2021-08-06
generate limited production parameter values;
generate, with the one or more physical computer processors, a
representation of estimated reservoir productivity as a function of depth in
the
subsurface volume of interest using visual effects to depict at least a
portion
of the limited production parameter values, based on the one or more user
input options selected; and
display, via the graphical user interface, the representation.
[0004] These and other features, and characteristics of the present
technology,
as well as the methods of operation and functions of the related elements of
structure and the combination of parts and economies of manufacture, will
become
more apparent upon consideration of the following description and the appended
Claims with reference to the accompanying drawings, all of which form a part
of this
specification, wherein like reference numerals designate corresponding parts
in the
various figures. It is to be expressly understood, however, that the drawings
are for
the purpose of illustration and description only and are not intended as a
definition of
the limits of the presently disclosed technology. As used in the specification
and in
the Claims, the singular form of "a", "an", and "the" include plural referents
unless the
context clearly dictates otherwise.
4g
Date Recue/Date Received 2021-08-06
CA 03072107 2020-02-04
WO 2019/067213
PCT/US2018/050639
[0005] The technology disclosed herein, in accordance with one or more
various
implementations, is described in detail with reference to the following
figures. The
drawings are provided for purposes of illustration only and merely depict
typical or
example implementations of the disclosed technology. These drawings are
provided
to facilitate the reader's understanding of the disclosed technology and shall
not be
considered limiting of the breadth, scope, or applicability thereof. It should
be noted
that for clarity and ease of illustration these drawings are not necessarily
made to
scale.
BRIEF DESCRIPTION OF THE DRAWINGS
[0006] FIG. 1A shows a system configured for estimating reservoir
productivity as
a function of depth in a subsurface volume of interest, in accordance with one
or
more implementations.
[0007] FIG. 1B illustrates a flowchart of a method of hydrocarbon reservoir
recoverable pay characterization, in accordance with some implementations.
[0008] FIG. 2 illustrates example training for a parameter model, in
accordance
with some implementations.
[0009] FIG. 3 illustrates example refined production parameter graphs and
an
example representation, in accordance with some implementations.
[0010] FIG. 4 illustrates example refined production parameter graphs, in
accordance with some implementations.
[0011] FIG. 5 illustrates example refined production parameter graphs, in
accordance with some implementations.
[0012] FIG. 6 illustrates example user input options, in accordance with
some
CA 03072107 2020-02-04
WO 2019/067213
PCT/US2018/050639
implementations.
[0013] FIG. 7 illustrates an example representation, in accordance with
some
implementations.
[0014] FIG. 8 includes a flow chart of a method for estimating reservoir
productivity as a function of depth in a subsurface volume of interest, in
accordance
with one or more implementations.
[0015] FIG. 9 illustrates a workflow for estimating productivity of a well
location as
a function of position in a subsurface volume of interest, in accordance with
one or
more implementations.
[0016] FIG. 10 illustrates a comparison of the disclosed technology with
actual
productivity, in accordance with one or more implementations.
DETAILED DESCRIPTION
[0017] Well planning in hydrocarbon reservoirs may require characterization
of
the reservoir, including an understanding of the rock properties. Previous
approaches for pay characterization often focus on hydrocarbon storage
capability or
may rely on inferential relationships to well productivity. More recent
approaches
may utilize simple linear and non-linear multivariate regression techniques to
characterize the relationship between rock properties, completion strategies,
and
well production performance, but these methods may be prone to overfitting,
have
difficulty capturing complex interaction structures in noisy reservoir data,
and
generally fall short of characterizing the rock properties that may correspond
to
enhanced production performance.
[0018] There exists a need for improved recoverable pay characterization of
6
CA 03072107 2020-02-04
WO 2019/067213
PCT/US2018/050639
subsurface reservoirs, allowing the identification of geologic target zones
and landing
surfaces for well completion, especially for unconventional and tight rock
plays.
[0019] Disclosed below are methods, systems, and computer readable storage
media that provide an estimation of reservoir productivity as a function of
depth in a
subsurface volume of interest. These implementations may be used to identify
recoverable pay zones and fracture barriers.
[0020] Reference will now be made in detail to various implementations,
examples of which are illustrated in the accompanying drawings. In the
following
detailed description, numerous details may be set forth in order to provide a
thorough understanding of the present disclosure and the implementations
described
herein. However, implementations described herein may be practiced without
such
details. In other instances, some methods, procedures, components, and
mechanical
apparatuses may not be described in detail, so as not to unnecessarily obscure
aspects of the implementations.
[0021] The presently disclosed technology includes implementations of a
method
and system for estimated reservoir productivity as a function of depth,
allowing better
well planning including landing targets, pay zones, horizontal drill planning,
and
geosteering. A subsurface volume of interest may include any area, region,
and/or
volume underneath a surface. Such a volume may include, or be bounded by, one
or
more of a water surface, a ground surface, and/or other surfaces. The method
may
link key petrophysical reservoir characteristics with long-term well
production using a
predictive data analytic approach. The method may be designed to identify
reservoir
zones that will enable high-end well recovery, not just calculation of
possible
hydrocarbon volume storage as traditional methods do. Additionally, the method
may
7
CA 03072107 2020-02-04
WO 2019/067213
PCT/US2018/050639
characterize potential hydraulic fracture barriers (fractards).
[0022] FIG. 1A illustrates a system 100 configured for estimating reservoir
productivity as a function of depth in a subsurface volume of interest, in
accordance
with one or more implementations. In some implementations, system 100 may
include one or more servers 102. Server(s) 102 may be configured to
communicate
with one or more client computing platforms 104 according to a client/server
architecture and/or other architectures. Client computing platform(s) 104 may
be
configured to communicate with other client computing platforms via server(s)
102
and/or according to a peer-to-peer architecture and/or other architectures.
Users
may access system 100 via client computing platform(s) 104.
[0023] Server(s) 102 may be configured by machine-readable instructions
106.
Machine-readable instructions 106 may include one or more instruction
components.
The instruction components may include computer program components. The
instruction components may include one or more of a subsurface data and well
data
component 108, a parameter model component 110, a production parameter graph
component 112, a user input component 114, a representation component 116,
and/or other instruction components.
[0024] Subsurface data and well data component 108 may be configured to
obtain, from the non-transient electronic storage, subsurface data and well
data
corresponding to a subsurface volume of interest. The subsurface data and/or
the
well data may be obtained from the non-transient electronic storage and/or
other
sources. The subsurface data and the well data may include production
parameter
values for multiple production parameters as a function of position in the
subsurface
volume of interest, thereby characterizing subsurface production features that
affect
8
CA 03072107 2020-02-04
WO 2019/067213
PCT/US2018/050639
the reservoir productivity.
[0025] The subsurface data and the well data may be filtered by one or more
pay
zones. The subsurface data may include geological data and reservoir data.
Geological data may include petrophysical, core, cutting, pressure, drilling
property,
mudlog, seismic properties, and/or other geological data. In implementations,
for
unconventional reservoirs, this may include an anticipated stimulated rock
volume, a
natural geologic target zone, or even a gross formation interval. In some
implementations, reservoir data may be interpolated using cokriging,
autocorrelation
gridding techniques, and/or other techniques. Well data may include completion
data
and production data. Completion data may include well perforation lengths,
proppant
intensity, fluid types, well spacing, number of frac stages, and/or other
completion
data. Production data may include cumulative oil, gas, and/or water production
at
different time intervals, such as, for example, 6 month or 18 month cumulative
standard barrels of oil equivalent produced.
[0026] By way of non-limiting example, the subsurface production features
may
include one or more petrophysical, core, cutting, pressure, drilling property,
mudlog,
seismic features, well perforation lengths, proppant intensity, fluid types,
well
spacing, number of fracturing stages, cumulative oil production over a time
interval,
cumulative gas production over a time interval, cumulative water production
over a
time interval, and/or other features.
[0027] Subsurface data and well data component 108 may be configured to use
the subsurface data and the well data to generate multiple production
parameter
maps. This may be accomplished by one or more physical computer processors. A
given production parameter map may represent the production parameter values
for
9
CA 03072107 2020-02-04
WO 2019/067213
PCT/US2018/050639
a given production parameter as a function of time and position in the
subsurface
volume of interest.
[0028] In implementations, production parameter values may be filtered
based on
statistical significance and/or collinearity using, for example, a Pearson
correlation
matrix.
[0029] Parameter model component 110 may be configured to obtain a
parameter model. The parameter model may be obtained from the non-transient
electronic storage and/or other sources. The parameter model may be trained
using
training data on an initial parameter model. The training data may include
well data
and the production parameter values for corresponding multiple production
parameters affecting productivity of the one or more wells as a function of
position in
the subsurface volume of interest. The parameter model may include random
forest
machine learning and/or other machine learning.
[0030] For example, FIG. 2 illustrates example training for a parameter
model, in
accordance with some implementations. The parameter model may be include
random forest machine learning. Random forest machine learning may have a low
risk of overfitting, may allow extreme randomization, and may be very
iterative.
Random forest may be a modification of bootstrap aggregation that builds on a
large
collection of de-correlated regression trees and then averages them. Bootstrap
aggregation may average many noisy but unbiased models to reduce prediction
variance. Regression trees may be appropriate for bootstrap aggregation,
because
they can capture complex interaction structure. The random forest machine
learning
uses many boot strap sets and many regression trees to generate many
predictions,
ultimately averaged together to provide the final prediction algorithm. This
identifies
CA 03072107 2020-02-04
WO 2019/067213
PCT/US2018/050639
the most impacfful and statistically significant predictor production
parameters that
account for differences in well production. Applying the parameter model to
the
multiple refined production parameter maps may allow for validation of the
analytic
model via blind testing.
[0031] Referring to FIG. 1A, parameter model component 110 may be
configured
to apply the parameter model to the multiple production parameter maps to
generate
multiple refined production parameters including refined production parameter
values. This may be accomplished by the one or more physical computer
processors. The refined production parameters may be a subset of the multiple
production parameters. The parameter model may have been trained, as described
herein, to identify one or more of the multiple production parameters that
have the
greatest effect on productivity compared to the other multiple production
parameters.
[0032] In implementations, a Boruta plot may be generated from the random
forest model using the refined production parameters and corresponding refined
production parameter values.
[0033] Production parameter graph component 112 may be configured to
generate multiple refined production parameter graphs from the refined
production
parameter values wherein a given refined production parameter graph specifies
the
refined production parameter values for a corresponding production parameter
as a
function of well production. This may be accomplished by the one or more
physical
computer processors.
[0034] Production parameter graph component 112 may be configured to
display
the multiple refined production parameter graphs. The multiple refined
production
parameter graphs may be displayed on a graphical user interface and/or other
11
CA 03072107 2020-02-04
WO 2019/067213
PCT/US2018/050639
displays.
[0035] In implementations, production parameter graph component 112 may be
configured to determine or identify trends, thresholds, and/or other
conditions to limit
the refined production parameter values using linear analysis, non-linear
analysis,
rate of change analysis, machine learning, and/or other techniques.
[0036] User input component 114 may be configured to generate one or more
user input options to limit the refined production parameter values
corresponding to
individual ones of the multiple refined production parameters. This may be
accomplished by the one or more physical computer processors. By way of non-
limiting example, user input options may include a window input for text,
numbers,
and/or symbols; options to select greater than, greater than or equal to, less
than,
and/or less than or equal to; note a trend of increasing values, a trend of
decreasing
values; note a linear trend, a non-linear trend, and/or other trends, options
to select
one or more threshold values; and/or other trends.
[0037] User input component 114 may be configured to present the one or
more
user input options corresponding to the multiple refined production
parameters. The
one or more user input options may be displayed on a graphical user interface
and/or other displays.
[0038] User input component 114 may be configured to receive the one or
more
user input options selected by a user to limit the refined production
parameter values
corresponding to the multiple refined production parameter graphs to generate
limited production parameter values. This may be accomplished by the one or
more
physical computer processors. The limited production parameter values may be a
subset of the refined production parameter values. As described herein, the
limited
12
CA 03072107 2020-02-04
WO 2019/067213
PCT/US2018/050639
production parameter values may be limited based on the thresholds and/or
trends
of the multiple refined production parameter graphs identified by the system
or by a
user through the user input options.
[0039] Representation component 116 may be configured to generate a
representation of estimated reservoir productivity as a function of depth in
the
subsurface volume of interest using visual effects to depict at least a
portion of the
limited production parameter values, based on the one or more user input
options
selected. This may be accomplished by the one or more physical computer
processors. The representation may estimate a productivity of one or more pay
zones of a reservoir in the subsurface volume of interest. The representation
may
change as a function of time.
[0040] In some implementations, a visual effect may include one or more
visual
transformation of the representation. A visual transformation may include one
or
more visual changes in how the representation is presented or displayed. In
some
implementations, a visual transformation may include one or more of a visual
zoom,
a visual filter, a visual rotation, and/or a visual overlay (e.g., text and/or
graphics
overlay).
[0041] Representation component 116 may be configured to display the
representation. The representation may be displayed on a graphical user
interface
and/or other displays.
[0042] In some implementations, server(s) 102, client computing platform(s)
104,
and/or external resources 130 may be operatively linked via one or more
electronic
communication links. For example, such electronic communication links may be
established, at least in part, via a network such as the Internet and/or other
13
CA 03072107 2020-02-04
WO 2019/067213
PCT/US2018/050639
networks. It will be appreciated that this is not intended to be limiting, and
that the
scope of this disclosure includes implementations in which server(s) 102,
client
computing platform(s) 104, and/or external resources 130 may be operatively
linked
via some other communication media.
[0043] A given client computing platform 104 may include one or more
processors configured to execute computer program components. The computer
program components may be configured to enable an expert or user associated
with
the given client computing platform 104 to interface with system 100 and/or
external
resources 130, and/or provide other functionality attributed herein to client
computing
platform(s) 104. By way of non-limiting example, the given client computing
platform
104 may include one or more of a desktop computer, a laptop computer, a
handheld
computer, a tablet computing platform, a NetBook, a Smartphone, a gaming
console,
and/or other computing platforms.
[0044] External resources 130 may include sources of information outside of
system 100, external entities participating with system 100, and/or other
resources.
In some implementations, some or all of the functionality attributed herein to
external
resources 130 may be provided by resources included in system 100.
[0045] Server(s) 102 may include electronic storage 132, one or more
processors
134, and/or other components. Server(s) 102 may include communication lines,
or
ports to enable the exchange of information with a network and/or other
computing
platforms. Illustration of server(s) 102 in FIG. 1A is not intended to be
limiting.
Server(s) 102 may include a plurality of hardware, software, and/or firmware
components operating together to provide the functionality attributed herein
to
server(s) 102. For example, server(s) 102 may be implemented by a cloud of
14
CA 03072107 2020-02-04
WO 2019/067213
PCT/US2018/050639
computing platforms operating together as server(s) 102.
[0046] Electronic storage 132 may comprise non-transitory storage media
that
electronically stores information. The electronic storage media of electronic
storage
132 may include one or both of system storage that is provided integrally
(i.e.,
substantially non-removable) with server(s) 102 and/or removable storage that
is
removably connectable to server(s) 102 via, for example, a port (e.g., a USB
port, a
firewire port, etc.) or a drive (e.g., a disk drive, etc.). Electronic storage
132 may
include one or more of optically readable storage media (e.g., optical disks,
etc.),
magnetically readable storage media (e.g., magnetic tape, magnetic hard drive,
floppy drive, etc.), electrical charge-based storage media (e.g., EEPROM, RAM,
etc.), solid-state storage media (e.g., flash drive, etc.), and/or other
electronically
readable storage media. Electronic storage 132 may include one or more virtual
storage resources (e.g., cloud storage, a virtual private network, and/or
other virtual
storage resources). Electronic storage 132 may store software algorithms,
information determined by processor(s) 134, information received from
server(s)
102, information received from client computing platform(s) 104, and/or other
information that enables server(s) 102 to function as described herein.
[0047] Processor(s) 134 may be configured to provide information processing
capabilities in server(s) 102. As such, processor(s) 134 may include one or
more of a
digital processor, an analog processor, a digital circuit designed to process
information, an analog circuit designed to process information, a state
machine,
and/or other mechanisms for electronically processing information. Although
processor(s) 134 is shown in FIG. 1A as a single entity, this is for
illustrative
purposes only. In some implementations, processor(s) 134 may include a
plurality of
CA 03072107 2020-02-04
WO 2019/067213
PCT/US2018/050639
processing units. These processing units may be physically located within the
same
device, or processor(s) 134 may represent processing functionality of a
plurality of
devices operating in coordination. Processor(s) 134 may be configured to
execute
components 108, 110, 112, 114, and/or 116, and/or other components.
Processor(s)
134 may be configured to execute components 108, 110, 112, 114, and/or 116,
and/or other components by software; hardware; firmware; some combination of
software, hardware, and/or firmware; and/or other mechanisms for configuring
processing capabilities on processor(s) 134. As used herein, the term
"component"
may refer to any component or set of components that perform the functionality
attributed to the component. This may include one or more physical processors
during execution of processor readable instructions, the processor readable
instructions, circuitry, hardware, storage media, or any other components.
[0048] It should be appreciated that although components 108, 110, 112,
114,
and/or 116 are illustrated in FIG. 1A as being implemented within a single
processing
unit, in implementations in which processor(s) 134 includes multiple
processing
units, one or more of components 108, 110, 112, 114, and/or 116 may be
implemented remotely from the other components. The description of the
functionality provided by the different components 108, 110, 112, 114, and/or
116
described below is for illustrative purposes, and is not intended to be
limiting, as any
of components 108, 110, 112, 114, and/or 116 may provide more or less
functionality
than is described. For example, one or more of components 108, 110, 112, 114,
and/or 116 may be eliminated, and some or all of its functionality may be
provided by
other ones of components 108, 110, 112, 114, and/or 116. As an example,
processor(s) 134 may be configured to execute one or more additional
components
that may perform some or all of the functionality attributed below to one of
16
CA 03072107 2020-02-04
WO 2019/067213
PCT/US2018/050639
components 108, 110, 112, 114, and/or 116.
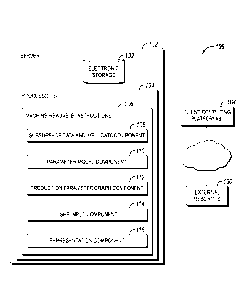
[0049] FIG. 1B illustrates a flowchart 150 of a method for pay
characterization of
a subsurface reservoirs. The left column shows input data 152, which may
include
subsurface data and well data, as described above. Input data 152 may have
corresponding production parameters characterizing subsurface production
features,
such as, for example, well attributes, as a function of position in the
subsurface
volume of interest. The subsurface data and the well data may be used to
generate
multiple production parameter maps (e.g., reservoir property maps). Geological
data
may be gridded. Geostatistical gridding methods 154, such as, for example,
cokriging may provide measurable uncertainty due to interpolation in the form
of
standard error maps. The standard error maps may be useful for considering the
inclusion of a production parameter into the parameter model (e.g., random
forest
algorithm) of the workflow. Multiple production parameters maps or reservoir
property maps 156 may include, at a minimum, average porosity, pore
saturation,
mineralogy, lithofacies, geomechanical properties, organic richness, vertical
filtering
of the reservoir data by pay zones, and/or any other reservoir property. For
example,
in unconventional reservoirs, vertical filtering may include an anticipated
stimulated
rock volume, a natural geologic target zone, a gross formation interval,
and/or any
other filtering.
[0050] Production parameter maps 156 may be subjected to a parameter model,
such as, for example, a 2D statistical analysis 158. In particular, a random
forest
algorithm may be used, as described herein. Using the parameter model with the
multiple production parameter maps may allow for validation of the parameter
model
via blind testing 160. The interpretations of the multiple refined production
parameter
17
CA 03072107 2020-02-04
WO 2019/067213
PCT/US2018/050639
graphs are combined to generate a representation or pay flag curve 164. Pay
flag
curve 164 identifies the pay zones of the reservoir that may be likely to have
good
production or may have fractards. A fractard may be a bed of rock that is
characterized by very high fracture toughness, resulting in a large amount of
resistance to hydraulic fracture propagation. Fractards can be inferred by
very poor
well production in association with ductile or high closure stress rock
properties. In
implementations, the pay flag curve may be used for well planning and
completion,
including decisions on landing targets, horizontal drilling, fracturing, and
perforations.
[0051] The production parameters identified by the parameter model may be
individually evaluated in order to identify thresholds and/or trends that
impact well
productivity. FIG. 3 illustrates example refined production parameter graphs
and an
example representation, in accordance with some implementations. The reservoir
property #3 graph may have a threshold value of greater than about 50% because
that is when the production parameter values begin to increase past nominal
values.
The reservoir property #4 graph may have a negative rate of change as a
function of
productivity. The reservoir property #1 graph may have a threshold value of
about
800 because that is when the production parameter values begin to increase
past
nominal values and stay at high values. The multiple refined production
parameter
graphs indicate the marginal effect of a given variable on production. Example
may
be illustrated in FIGs. 4 and 5.
[0052] FIG. 4 may illustrate partial dependence plots, or multiple refined
production parameter graphs, and how they may be generated. FIG. 5 illustrates
example refined production parameter graphs, in accordance with some
implementations. As illustrated, different production parameters may be
interpreted
18
CA 03072107 2020-02-04
WO 2019/067213
PCT/US2018/050639
differently based on the multiple refined production parameter graphs. For
example,
Property #1 and Property #5 indicate opposite effects with respect to rate of
change.
Properties #4, 6, 7, and 8 use a threshold value above which good productivity
is
identified. The multiple refined production parameter graphs may be
interpreted for
natural thresholds or trends that enable better than average production, good
production, or great production. This can be done manually by a subject matter
expert or can be automated by a computerized auto-picking routine, as
described
herein. The recoverable pay flag curve is inclusive of all critical production
parameters and their interpreted cutoffs that enable better than average well
performance.
[0053] FIG. 6 illustrates example user input options, in accordance with
some
implementations. An example graphical user interface is illustrated with user
input
options for limiting production parameter values, such as a condition (e.g.,
greater
than, less than, etc.), a cutoff value (e.g., a threshold value, as described
herein), a
linear or non-linear fit, and/or any other user input options. These may be
used to
generate the representation.
[0054] FIG. 7 illustrates an example representation, in accordance with
some
implementations. As illustrated, the representation may use visual effects to
help a
user identify an ideal reservoir based on a depth in a subsurface volume of
interest.
The P90 landing corresponds with the representation on the far right where
strip 704
indicates an ideal reservoir. Strip 702 indicates a ductile fractard and may
be derived
from Rio wells. Strip 706 indicates a stress fractard.
[0055] FIG. 8 illustrates a method 800 for estimating reservoir
productivity as a
function of depth in a subsurface volume of interest, in accordance with one
or more
19
CA 03072107 2020-02-04
WO 2019/067213
PCT/US2018/050639
implementations. The operations of method 800 presented below are intended to
be
illustrative. In some implementations, method 800 may be accomplished with one
or
more additional operations not described, and/or without one or more of the
operations discussed. Additionally, the order in which the operations of
method 800
are illustrated in FIG. 8 and described below is not intended to be limiting.
[0056] In some implementations, method 800 may be implemented in one or
more processing devices (e.g., a digital processor, an analog processor, a
digital
circuit designed to process information, an analog circuit designed to process
information, a state machine, and/or other mechanisms for electronically
processing
information). The one or more processing devices may include one or more
devices
executing some or all of the operations of method 800 in response to
instructions
stored electronically on an electronic storage medium. The one or more
processing
devices may include one or more devices configured through hardware, firmware,
and/or software to be specifically designed for execution of one or more of
the
operations of method 800.
[0057] An operation 802 may include obtaining, from the non-transient
electronic
storage, subsurface data and well data corresponding to a subsurface volume of
interest. The subsurface data and the well data may include production
parameter
values for multiple production parameters as a function of position in the
subsurface
volume of interest, thereby characterizing subsurface production features that
affect
the reservoir productivity. Operation 802 may be performed by one or more
hardware processors configured by machine-readable instructions including a
component that is the same as or similar to subsurface data and well data
component 108, in accordance with one or more implementations.
CA 03072107 2020-02-04
WO 2019/067213
PCT/US2018/050639
[0058] An operation 804 may include obtaining, from the non-transient
electronic
storage, a parameter model. The parameter model may have been conditioned by
training an initial parameter model using training data. The training data may
include
(i) the well data of one or more wells in the subsurface volume of interest,
and (ii) the
production parameter values for corresponding multiple production parameters
affecting productivity of the one or more wells as a function of position in
the
subsurface volume of interest. Operation 804 may be performed by one or more
hardware processors configured by machine-readable instructions including a
component that is the same as or similar to parameter model component 110, in
accordance with one or more implementations.
[0059] An operation 806 may include using, with the one or more physical
computer processors, the subsurface data and the well data to generate
multiple
production parameter maps. A given production parameter map may represent the
production parameter values for a given production parameter as a function of
time
and position in the subsurface volume of interest. Operation 806 may be
performed
by one or more hardware processors configured by machine-readable instructions
including a component that is the same as or similar to subsurface data and
well
data component 108, in accordance with one or more implementations.
[0060] An operation 808 may include applying, with the one or more physical
computer processors, the parameter model to the multiple production parameter
maps to generate refined production parameter values. Operation 808 may be
performed by one or more hardware processors configured by machine-readable
instructions including a component that is the same as or similar to parameter
model
component 110, in accordance with one or more implementations.
21
CA 03072107 2020-02-04
WO 2019/067213
PCT/US2018/050639
[0061] An operation 810 may include generating, with the one or more
physical
computer processors, multiple refined production parameter graphs from the
refined
production parameter values wherein a given refined production parameter graph
specifies the refined production parameter values for a corresponding
production
parameter as a function of well production. Operation 810 may be performed by
one
or more hardware processors configured by machine-readable instructions
including
a component that is the same as or similar to production parameter graph
component 112, in accordance with one or more implementations.
[0062] An operation 812 may include displaying, via the graphical user
interface,
the multiple refined production parameter graphs. Operation 812 may be
performed
by one or more hardware processors configured by machine-readable instructions
including a component that is the same as or similar to production parameter
graph
component 112, in accordance with one or more implementations.
[0063] An operation 814 may include generating, with the one or more
physical
computer processors, one or more user input options to limit the refined
production
parameter values corresponding to individual ones of the multiple refined
production
parameters. Operation 814 may be performed by one or more hardware processors
configured by machine-readable instructions including a component that is the
same
as or similar to user input component 114, in accordance with one or more
implementations.
[0064] An operation 816 may include receiving, via the graphical user
interface,
the one or more user input options selected by a user to limit the refined
production
parameter values corresponding to the multiple refined production parameter
graphs
to generate limited production parameter values. Operation 816 may be
performed
22
CA 03072107 2020-02-04
WO 2019/067213
PCT/US2018/050639
by one or more hardware processors configured by machine-readable instructions
including a component that is the same as or similar to user input component
114, in
accordance with one or more implementations.
[0065] An operation 818 may include generating, with the one or more
physical
computer processors, a representation of estimated reservoir productivity as a
function of depth in the subsurface volume of interest using visual effects to
depict at
least a portion of the limited production parameter values, based on the one
or more
user input options selected. Operation 818 may be performed by one or more
hardware processors configured by machine-readable instructions including a
component that is the same as or similar to representation component 116, in
accordance with one or more implementations.
[0066] An operation 820 may include displaying, via the graphical user
interface,
the representation. Operation 820 may be performed by one or more hardware
processors configured by machine-readable instructions including a component
that
is the same as or similar to representation component 116, in accordance with
one
or more implementations.
[0067] FIG. 9 illustrates a workflow for estimating reservoir productivity
as a
function of depth in a subsurface volume of interest, in accordance with one
or more
implementations. In part A, production parameter values may be pre-filtered
for
statistical significance and collinearity using, for example, a Pearson
correlation
matrix. In part B, a Boruta plot may be generated from the random forest
model. The
critical production parameters for estimating well productivity are identified
and
ranked in order of effect on well productivity. At part C, there is a
production
parameter graph interpretation. Individual production parameters may be
interpreted
23
CA 03072107 2020-02-04
WO 2019/067213
PCT/US2018/050639
under P50 performance. It should be appreciated that different performance
values
may be used for different applications. The multiple refined production
parameter
graphs may be combined into a representation. The representation may represent
all
the rock conditions corresponding to P50 performance. Poor reservoir pay may
indicate reservoir conditions where most but not all production parameters for
P50
are present. Ductile fractards may be defined as rock conditions that fail
production
parameter graph interpretation due to geomechanical or mineralogical
conditions
associated with ductile, high fracture toughness rock properties.
[0068] FIG. 10 illustrates a comparison of the disclosed technology with
actual
productivity, in accordance with one or more implementations. The disclosed
technology may estimate line 1002 while the actual production may be line
1004. As
illustrated, the disclosed technology is fairly close to a number of points on
graph
1000.
[0069] Although the present technology has been described in detail for the
purpose of illustration based on what is currently considered to be the most
practical
and preferred implementations, it is to be understood that such detail is
solely for
that purpose and that the technology is not limited to the disclosed
implementations,
but, on the contrary, is intended to cover modifications and equivalent
arrangements
that are within the spirit and scope of the appended Claims. For example, it
is to be
understood that the present technology contemplates that, to the extent
possible,
one or more features of any implementation can be combined with one or more
features of any other implementation.
[0070] While particular implementations are described above, it will be
understood it is not intended to limit the presently disclosed technology to
these
24
CA 03072107 2020-02-04
WO 2019/067213
PCT/US2018/050639
particular implementations. On the contrary, the presently disclosed
technology
includes alternatives, modifications and equivalents that are within the
spirit and
scope of the appended claims. Numerous specific details are set forth in order
to
provide a thorough understanding of the subject matter presented herein. But
it will
be apparent to one of ordinary skill in the art that the subject matter may be
practiced
without these specific details. In other instances, well-known methods,
procedures,
components, and circuits have not been described in detail so as not to
unnecessarily obscure aspects of the implementations.
[0071] The terminology used in the description of the presently disclosed
technology herein is for the purpose of describing particular implementations
only
and is not intended to be limiting of the presently disclosed technology. As
used in
the description of the presently disclosed technology and the appended claims,
the
singular forms "a," "an," and "the" are intended to include the plural forms
as well,
unless the context clearly indicates otherwise. It will be understood that the
term
"and/or" as used herein refers to and encompasses any and all possible
combinations of one or more of the associated listed items. It will be further
understood that the terms "includes," "including," "comprises," and/or
"comprising,"
when used in this specification, specify the presence of stated features,
operations,
elements, and/or components, but do not preclude the presence or addition of
one or
more other features, operations, elements, components, and/or groups thereof.
[0072] As used herein, the term "if" may be construed to mean "when" or
"upon"
or "in response to determining" or "in accordance with a determination" or "in
response to detecting," that a stated condition precedent is true, depending
on the
context. Similarly, the phrase "if it is determined [that a stated condition
precedent is
CA 03072107 2020-02-04
WO 2019/067213
PCT/US2018/050639
truer or "if [a stated condition precedent is truer or "when [a stated
condition
precedent is truer may be construed to mean "upon determining" or "in response
to
determining" or "in accordance with a determination" or "upon detecting" or
"in
response to detecting" that the stated condition precedent is true, depending
on the
context.
[0073] Although some of the various drawings illustrate a number of logical
stages in a particular order, stages that are not order dependent may be
reordered
and other stages may be combined or broken out. While some reordering or other
groupings are specifically mentioned, others will be obvious to those of
ordinary skill
in the art and so do not present an exhaustive list of alternatives. Moreover,
it should
be recognized that the stages could be implemented in hardware, firmware,
software
or any combination thereof.
[0074] The foregoing description, for purpose of explanation, has been
described
with reference to specific implementations. However, the illustrative
discussions
above are not intended to be exhaustive or to limit the presently disclosed
technology to the precise forms disclosed. Many modifications and variations
are
possible in view of the above teachings. The implementations were chosen and
described in order to best explain the principles of the presently disclosed
technology
and its practical applications, to thereby enable others skilled in the art to
best utilize
the presently disclosed technology and various implementations with various
modifications as are suited to the particular use contemplated.
26