Note: Descriptions are shown in the official language in which they were submitted.
CONVERSION OF ROCK MECHANICS DATA FROM CONFINING STRESS TO
PORE PRESSURE FOR RESERVOIR SIMULATORS
FIELD OF THE DISCLOSURE
The present disclosure relates to reservoir simulation and, more specifically,
to the
conversion of rocks mechanics data obtained from pore compressibility tests
into rock
compaction tables for a reservoir simulator using Dimensionless Stress to Pore
Pressure
Conversion.
BACKGROUND
In the oil and gas industry, the most widely accepted workflow for executing
io production induced compaction studies would be to complete a coupled
reservoir and
geomechanics simulation that takes fluid and solid medium mechanics and
displacement
into consideration. However, such methods typically prove more financially
burdensome
and time intensive because disparate simulators or a single multiphysics
simulator is
involved. As a result, practitioners often negate the effects of coupled
geomechanics in
their modeling at the detriment of their capability to accurately predict the
response of
their asset to production. Alternatively, practitioners resort to
incorporating pore volume
and transmissibility multipliers as a function of pressure into reservoir
simulation studies
through rock compaction tables, as a pseudo-representation of structural
subsurface
changes caused by production. However, this approach does not capture the full
physics
zo from the interaction of structural and hydrodynamic phenomena which
occur as a result of
production from the reservoir.
SUMMARY
In accordance with one aspect, there is provided a computer-implemented
reservoir
simulation method, comprising obtaining rock mechanics data from a pore
compressibility
test, the rock mechanics data being expressed as a function of confining
stress, converting
the rock mechanics data from a function of confining stress to a function of
pore pressure
using dimensionless stress to pore pressure conversion ("DSPC"), generating
one or more
rock compaction tables using the converted rock mechanics data, and inputting
data from
the rock compaction table into a reservoir simulator to thereby generate a
reservoir model,
wherein the reservoir model may be used to evaluate well production.
1
Date Recue/Date Received 2021-09-21
In accordance with another aspect, there is provided a system for simulating a
reservoir. The system comprises non-transitory memory storing rock mechanics
data and
one or more hardware processors coupled to the non-transitory memory and
configured to
execute instructions to cause the system to perform operations comprising,
obtaining rock
mechanics data from a pore compressibility test, the rock mechanics data being
expressed
as a function of confining stress, converting the rock mechanics data from a
function of
confining stress to a function of pore pressure using dimensionless stress to
pore pressure
conversion ("DSPC"), generating one or more rock compaction tables using the
converted
rock mechanics data, and inputting data from the rock compaction table into a
reservoir
to .. simulator to thereby generate a reservoir model, wherein the reservoir
model may be used
to perform wellbore operations.
BRIEF DESCRIPTION OF THE DRAWINGS
FIG. 1 is a flow chart of a generalized method for simulating a reservoir,
according
is to certain illustrative embodiments of the present disclosure.
FIG. 2 is a flow chart of detailed method for simulating a reservoir,
according to an
illustrative embodiment of the present disclosure.
FIG. 3A is an illustrative graph showing changes in porosity as a function of
confining stress for a number of rock samples.
20 FIG. 3B is an illustrative graph showing changes in permeability as a
function of
confining stress for a number of rock samples.
FIG. 3C is an illustrative plot of the pore volume multiplier computed as a
function
of pore pressure.
la
Date Recue/Date Received 2021-09-21
FIG. 3D is an illustrative plot of the permeability multiplier computed as a
function
of pore pressure.
FIG. 4 is a plot showing the dry rock/mineral bulk modulus ratio computed for
original and modeled rock mechanics data of the present disclosure, providing
validation
of the illustrative methods.
FIG. 5 is a block diagram illustrating an example of a computer system in
which
embodiments of the present disclosure may be implemented.
DESCRIPTION OF ILLUSTRATIVE EMBODIMENTS
Illustrative embodiments and related methods of the present disclosure are
io described below as they might be employed in systems and methods to derive
rock
compaction tables from physical core compressibility tests for usage in
reservoir
simulation. In the interest of clarity, not all features of an actual
implementation or
method are described in this specification. It will of course be appreciated
that in the
development of any such actual embodiment, numerous implementation-specific
decisions
is must be made to achieve the engineers' specific goals, such as
compliance with system-
related and business-related constraints, which will vary from one
implementation to
another. Moreover, it will be appreciated that such a development effort might
be complex
and time-consuming, but would nevertheless be a routine undertaking for those
of ordinary
skill in the art having the benefit of this disclosure. Further aspects and
advantages of the
20 various embodiments and related methods of this disclosure will become
apparent from
consideration of the following description and drawings.
As described herein, illustrative systems and methods of the present
disclosure are
directed to reservoir simulation models using rock compaction tables derived
from
physical core compressibility tests. The illustrative methods transform rock
mechanics-
25 based pore compressibility tests into compliant rock compaction tables for
reservoir
simulators using Dimensionless Stress to Pore Pressure Conversion ("DSPC÷), to
thereby
transfer geomechanical changes due to confining stress into expressions of
geomechanical
changes due to pore pressure. The underlying assumption in developing the
model
transform from effects of confining stress (i.e., stress surrounding the rock
on all sides) to
30 those of pore pressure (i.e., outward pressure of fluid within pores of
rock due to, e.g.,
fluid injection) is a completely linear elastic response of the porous media,
so that changes
in the pore space due to confining stress are proportional to changes in the
pore space due
to pore pressure.
2
Date Recue/Date Received 2022-06-03
CA 03077300 2020-03-27
WO 2019/098988 PCT/US2017/061457
In a generalized method of the present disclosure, rock mechanics data is
obtained
from one or more pore compressibility tests. The rock mechanics data is
expressed as a
function of confining stress. The rock mechanics data is then converted from a
function of
confining stress to a function of pore pressure using DSPC. Rock compaction
tables are
generated using the converted rock mechanics data. The rock compaction tables
are input
into a reservoir simulator to thereby execute a reservoir simulation model,
which may he
used to evaluate and/or forecast a variety of asset operations. Accordingly,
the reservoir
model simulates changes in the converted rock mechanics data generated as a
function of
confining stress into expressions of changes in the reservoir simulation due
to pore
to pressure.
Illustrative embodiments and related methods of the present disclosure are
described below in reference to FIGS. 1-5 as they might be employed in, for
example, a
computer system for reservoir simulation and data analysis. An illustrative
reservoir
simulator is the Nexus Suite Reservoir Simulation platform, commercially
available
is .. from Landmark Graphics Corp. of Houstonõ TX. Other features and
advantages of the
disclosed embodiments will be or will become apparent to one of ordinary skill
in the art
upon examination of the following figures and detailed description. It is
intended that all
such additional features and advantages be included within the scope of the
disclosed
embodiments. Further, the illustrated figures are only illustrative and are
not intended to
20 assert or imply any limitation with regard to the environment,
architecture, design, or
process in which different embodiments may be implemented.
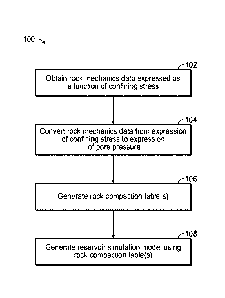
FIG. 1 is a flow chart of a generalized method for simulating a reservoir,
according
to certain illustrative embodiments of the present disclosure. At block 102 of
method 100,
rock mechanics data performed on cores is obtained by a computing system and
expressed
25 as a function of confining stress. The rock mechanics data may be
obtained in a variety of
ways, such as performing a pore volume compressibility test as a function of
confining
stress. In the test, the confining stress of a core is increased, then the
porosity and
permeability are measured at a given confining stress. At block 104, the
computing
system converts the rock mechanics data from the expressions of confining
stress to
30 expressions of pore pressure. As will be described in further detail
below, the reservoir
models provided herein take rock mechanics data performed on cores, which are
measured
at varying confining stresses, and defines a suitable transform to model the
corresponding
property multipliers as functions of pore pressure. At block 106, the
computing system
generates one or more rock compaction tables, which are then included in a
reservoir
3
CA 03077300 2020-03-27
WO 2019/098988 PCT/US2017/061457
simulation model in block 108. Thereafter, the generated reservoir model may
be used to
simulate and/or perIbmi reservoir asset operations, such as the prediction of
well
production or the evaluation of production drive mechanisms.
The illustrative reservoir simulation models assumes constant pore space
stiffness,
and validation of the model may be performed by evaluating whether the modeled
property
multipliers, created as a function of pore pressure, converge into the same
family of pore
space/mineral bulk modulus ratios. Small differences in association between
the measured
and modeled data indicate a higher degree of model accuracy, while larger
differences
indicate poor model quality. As such, the models may be validated.
In view of the foregoing generalized method, a more detailed description of
the
present disclosure will be provided with reference to FIG. 2, which is a flow
chart of
method 200 according to an illustrative embodiment of the present disclosure.
At block
202, rock mechanics data is collected from pore compressibility test data. The
rock
mechanics data includes porosity and/or permeability data (also referred to
herein as
is "property
data") as a function of confining stress. FIG. 3A is an illustrative graph
showing
changes in porosity as a function of confining stress for a number of rock
samples. FIG.
3B is an illustrative graph showing changes in permeability as a function of
confining
stress for a number of rock samples. The data in both FIGS. 3A and 3B were
obtained
from rock mechanics compressibility tests.
At block 204, the measured property data of block 202 is analyzed as a
function of
confining stress. Here, the computing system ensures the property data
(porosity or
permeability, for example) is represented as a fraction instead of a
percentage. The
associations between the property data and confining stress are also
determined. Linear
elasticity is assumed, therefore there must be a linear association between
the rock
mechanics property data and confining stress, but may have varying degrees of
correlation,
as illustrated in FIGS. 3A and 3B.
At block 206, the computing system performs DSPC on the confining stress data
of
block 202. Here, the computing system normalizes the maximum confining stress
value to
unity (i.e., to 1) and all other confining stress values to a value less than
unity. Here, the
confining stress values may be referred to as the normalized pressure
response. At block
208, the computing system normalizes the property data measured as a function
of
confining stress in bock 202 to its respective porosity/permeability of
greatest magnitude
in the pore compressibility test. In
this way, the maximum normalized
porosity/permeability becomes unity and the measured porosity/permeability at
the
4
CA 03077300 2020-03-27
WO 2019/098988 PCT/US2017/061457
maximum confining stress becomes a value less than unity. The normalized
porosity/permeability represents the respective "property multiplier." The
property
multiplier is the resealing parameter that, when multiplied by the reference
property value
of unity, leads to a dimensional description of the of the intended property
at a specific
.. confining stress.
At block 210, the computing system mathematically projects the normalized
stress
response from block 206 so that it is symmetrically scaled above unity. The
explanatory
variable the x-
axis variable) is not considered converted from confining stress to pore
pressure. Since it is symmetrically scaled above unity, the minimum pore
pressure is unity
lo .. and the maximum pore pressure is 2. This may be referred to as a
symmetric normalized
pressure response.
At block 212, the computing system plots the symmetric nomialized pressure
response from block 210 against the normalized porosity/permeability from
block 208.
Thereafter, the equation of the trendline describing the association between
the predictor
is (pore pressure) and normalized pressure response variable
(porosity/permeability) is
computed. The trendline equation can be computed, for example, in a
spreadsheet
program by using endpoints in the plot to compute a slope and then inferring a
y-intercept,
as would be understood by those ordinarily skilled in the art having the
benefit of this
disclosure.
20 At block
214, the computing system reverses the range of the normalized pressure
response in block 212 such that it is in ascending order. The computing system
then
rescales the ranee of the pore pressure so that the maximum value is unity. In
certain
illustrative methods, the computing system may perform this by subtracting the
normalized
pressure from the maximum pressure value of 2 in block 212.
25 At block
216, the computing system develops a rescale model of the property
multiplier (porosity/permeability multiplier) from block 208 using the
trendline from block
212. To achieve this in certain illustrative embodiments, substitution in the
trendline of
the reverse normalized pressure in block 214 is used to compute the property
multiplier. In
this way a trend based function of property multiplier versus reverse
normalized pressure
30 15 obtained. This newly resealed property multiplier is then plotted as
a function of the
reverse normalized pressure in block 214.
Thereafter, at block 218, the computing system reseales the resealed
normalized
pressure from block 214 to dimensional pressure. Here, in order to maintain
the proper
scaling of the property multiplier and normalized pressure, the computing
system scales
5
the slope of the trendline from block 216 according to the difference in
minimum
and maximum dimensional pressure. Thereafter, the computing system plots the
property
multiplier against the dimensional pore pressure. At block 220, the system
executes a
reservoir simulation using the dimensional pressure model. FIG. 3C is an
illustrative plot
of the pore volume, or porosity, multiplier computed as a function of pore
pressure. FIG.
3D is an illustrative plot of the pelineability multiplier computed as a
function of pore
pressure. FIGS. 3C and 3D are also referred to as rock compaction
tables/curves.
The computing system may then output the rock compaction tables, which are
tables characterized as dimensional property multipliers (e.g., pore volume,
porosity, or
io permeability) as a function of pore pressure, as opposed to the original
confining stress
utilized in the rock mechanics test. The rock compaction tables may be
utilized by the
computing system to execute a reservoir simulation model that incorporates
structural and
hydrodynamic interaction resulting from hydrocarbon production, for example,
via a user
computing workstation, cluster or cloud computing network. The reservoir model
may be
is .. used to analyze or predict well production for a given well, or to
evaluate production drive
mechanisms of a planned or operating well.
As previously mentioned, in certain illustrative methods, the generated
reservoir
model may be validated by evaluating whether the modeled property multipliers,
created
as a function of pore pressure, converge into the same family of pore
space/mineral bulk
20 modulus ratio. FIG. 4 is a plot of this validation, showing the dry
rock/mineral bulk
modulus ratio computed for original and modeled rock mechanics data. Note FIG.
4 only
shows porosity and the dry rock/mineral bulk modulus ratio. Note the dry
rock/mineral
bulk modulus ratio computed for the rock mechanics lab data are computed as a
function
of confining stress (orig) and the modeled rock property multipliers (mod) are
computed as
25 a function of pore pressure. Constant lines of the pore space/mineral
bulk modulus ratio
are provided as validation that the modeled properties are coincident with the
original lab
data. Small differences in association between measured and model data
indicate higher
degree of model accuracy, while large differences indicate poor model quality.
As
illustrated in FIG. 4, the small differences between original rock mechanics
lab data on the
30 modeled pore pressure data, highlights the accuracy of the model
generated using the
illustrative methods provided herein.
In one or more illustrative embodiments, a visual representation of various
plots
and reservoir models may be displayed to a user via a GUI of a reservoir
simulation
application executable at the user's computing device. Such a computing device
may be
6
Date Recue/Date Received 2022-06-03
CA 03077300 2020-03-27
WO 2019/098988 PCT/US2017/061457
implemented using any type of device having one or more processors, a user
input (e.g., a
mouse, QWFRTY keyboard, touch-screen, a graphics tablet, or microphone), a
display,
and a communications infrastructure capable of receiving and transmitting data
over a
network. An example of such a computing device will be described in further
detail below
with respect to FIG. 5.
FIG. 5 is a block diagram illustrating an example of a computing system 500 in
which embodiments of the present disclosure may be implemented. For example,
methods
100 or 200 of FIGS. I and 2, as described above, may be implemented using
system 500.
System 500 can be a computer, phone, PDA, or any other type of electronic
device. Such
to an electronic device includes various types of computer readable media
and interfaces for
various other types of computer readable media. As shown in FIG. 5, system 500
includes
a permanent storage device 502, a system memory 504, an output device
interface 506, a
system communications bus 508, a read-only memory ("ROM") 510, processing
unit(s)
512, an input device interface 514, and a network interface 516.
Bus 508 collectively represents all system, peripheral, and chipset buses that
communicatively connect the numerous internal devices of system 500. For
instance, bus
508 communicatively connects processing unit(s) 512 with ROM 710, system
memory
504, and permanent storage device 502. From these various memory units,
processing
unit(s) 512 retrieves instructions to execute and data to process in order to
execute the
processes of the subject disclosure. The processing unit(s) can be a single
processor or a
multi-core processor in different implementations.
ROM 510 stores static data and instructions that are needed by processing
unit(s)
512 and other modules of system 500. Permanent storage device 502, on the
other hand, is
a read-and-write memory device. This device is a non-volatile memory unit that
stores
instructions and data even when system 500 is off. Some implementations of the
subject
disclosure use a mass-storage device (such as a magnetic or optical disk and
its
corresponding disk drive) as permanent storage device 502.
Other implementations use a removable storage device (such as a floppy disk,
flash
drive, and its corresponding disk drive) as permanent storage device 502. Like
permanent
storage device 502, system memory 504 is a read-and-write memory device.
However,
unlike storage device 502, system memory 504 is a volatile read-and-write
memory, such a
random access memory. System memory 504 stores some of the instructions and
data that
the processor needs at runtime. In some implementations, the processes of the
subject
disclosure are stored in system memory 504, permanent storage device 502,
andlor ROM
7
CA 03077300 2020-03-27
WO 2019/098988 PCT/US2017/061457
510. From these various memory units, processing unit(s) 512 retrieves
instructions to
execute and data to process in order to execute the processes of some
implementations.
Bus 508 also connects to input and output device interfaces 514 and 506. Input
device interface 514 enables the user to communicate information and select
commands to
the system 500. Input devices used with input device interface 514 include,
for example,
alphanumeric, QWERTY, or T9 keyboards, microphones, and pointing devices (also
called "cursor control devices"). Output device interfaces 506 enables, for
example, the
display of images generated by the system 500. Output devices used with output
device
interface 506 include, for example, printers and display devices, such as
cathode ray tubes
to ("CRT") or liquid crystal displays ("LCD"). Some implementations
include devices such
as a touchscreen that functions as both input and output devices. It should be
appreciated
that embodiments of the present disclosure may be implemented using a computer
including any of various types of input and output devices for enabling
interaction with a
user. Such interaction may include feedback to or from the user in different
forms of
15 sensory feedback including, but not limited to, visual feedback, auditory
feedback, or
tactile feedback. Further, input from the user can be received in any form
including, but
not limited to, acoustic, speech, or tactile input. Additionally, interaction
with the user
may include transmitting and receiving different types of information, e.g.,
in the form of
documents, to and from the user via the above-described interfaces.
20 Also, as shown in FIG. 5, bus 508 also couples system 500 to a
public or private
network (not shown) or combination of networks through a network interface
516. Such a
network may include, for example, a local area network ("LAN"), such as an
Intranet, or a
wide area network ("WAN"), such as the Internet. Any or all components of
system 500
can be used in conjunction with the subject disclosure.
25 These finictions described above can be implemented in digital
electronic circuitry,
in computer software, firmware or hardware. The techniques can be implemented
using
one or more computer program products. Programmable processors and computers
can be
included in or packaged as mobile devices. The processes and logic flows can
be
performed by one or more programmable processors and by one or more
programmable
30 logic circuitry. General and special purpose computing devices and
storage devices can be
interconnected through communication networks.
Some implementations include electronic components, such as microprocessors,
storage and memory that store computer program instructions in a machine-
readable or
computer-readable medium (alternatively referred to as computer-readable
storage media,
CA 03077300 2020-03-27
WO 2019/098988 PCT/US2017/061457
machine-readable media, or machine-readable storage media). Some examples of
such
computer-readable media include RAM, ROM, read-only compact discs ("CD-ROM"),
recordable compact discs ("CD-R"), rewritable compact discs ("CD-RW"), read-
only
digital versatile discs (e.g., DVD-ROM, dual-layer DVD-ROM), a variety of
recordablelrewritable DVDs (e.g., DV. -RAM, DVD-RW, DVD+RW, etc.), flash
memory
(e.g.. SD cards, mini-SD cards, micro-SD cards, etc.), magnetic and/or solid
state hard
drives, read-only and recordable Blu-Ray0 discs, ultra density optical discs,
any other
optical or magnetic media, and floppy disks. The computer-readable media can
store a
computer program that is executable by at least one processing unit and
includes sets of
to instructions for performing various operations. Examples of computer
programs or
computer code include machine code, such as is produced by a compiler, and
files
including higher-level code that are executed by a computer, an electronic
component, or a
microprocessor using an interpreter.
While the above discussion primarily refers to microprocessor or multi-core
is processors that execute software, some implementations are performed by
one or more
integrated circuits, such as application specific integrated circuits
("ASICs") or field
programmable gate arrays ("FPGAs"). In some implementations, such integrated
circuits
execute instructions that are stored on the circuit itself. Accordingly,
methods 100 or 200,
as described above, may be implemented using system 500 or any computer system
having
20 processing circuitry or a computer program product including
instructions stored therein,
which, when executed by at least one processor, causes the processor to
perform functions
relating to these methods.
As used in this specification and any claims of this application, the terms
"computer", "server", "processor", and "memory" all refer to electronic or
other
25 technological devices. These terms exclude people or groups of people.
As used herein,
the terms "computer readable medium" and "computer readable media" refer
generally to
tangible, physical, and non-transitory electronic storage mediums that store
information in
a form that is readable by a computer.
Embodiments of the subject matter described in this specification can be
30 implemented in a computing system that includes a hack end component,
e.g., as a data
server, or that includes a middleware component, e.g., an application server,
or that
includes a front end component, e.g., a client computer having a graphical
user interface or
a Web browser through which a user can interact with an implementation of the
subject
matter described in this specification, or any combination of one or more such
back end,
9
CA 03077300 2020-03-27
WO 2019/098988 PCT/US2017/061457
middleware, or front end components. The components of the system can be
interconnected by any form or medium of digital data communication, e.g., a
communication network. Examples of communication networks include a LAN and a
WAN, an inter-network (e.g., the Internet), and peer-to-peer networks (e.g.,
ad hoc peer-to-
peer networks).
The computing system can include clients and servers. A. client and server are
generally remote from each other and typically interact through a
communication network.
The relationship of client and server arises by virtue of computer programs
running on the
respective computers and having a client-server relationship to each other. In
some
to embodiments, a server transmits data (e.g., a web page) to a client device
(e.g., for
purposes of displaying data to and receiving user input from a user
interacting with the
client device). Data generated at the client device (e.g., a result of the
user interaction) can
be received from the client device at the server.
It is understood that any specific order or hierarchy of steps in the
processes
15 disclosed is an illustration of exemplary approaches. Based upon design
preferences, it is
understood that the specific order or hierarchy of steps in the processes may
be rearranged,
or that all illustrated steps be performed. Some of the steps may be performed
simultaneously. For example, in certain circumstances, multitasking and
parallel
processing may be advantageous. Moreover, the separation of various system
components
20 in the embodiments described above should not be understood as requiring
such separation
in all embodiments, and it should be understood that the described program
components
and systems can generally be integrated together in a single software product
or packaged
into multiple software products.
Accordingly, the illustrative embodiments described herein provide improved
25 reservoir simulation models generated using rock compaction tables that
express chances
in geomechanical processes of reservoirs due to pore pressure. This is
advantageous
because pore pressure is modeled in the reservoir simulator, confining stress
is not. If the
porosity/pore volume/permeability are not expressed as ftmctions of pore
pressure, there
would be no way to model their chances in the reservoir simulator. A number of
other
30 advantages are provided by the current disclosure. It provides: a
reproducible method for
computing rock property variations as a function of pore pressure given data
measured
according to confining stress; intrinsic rock property consideration when
building rock
compaction tables for modeling pore volume compressibility in reservoir
simulations; it
promotes: the existing rock compaction modeling capability as a fimction of
pore pressure
CA 03077300 2020-03-27
WO 2019/098988 PCT/US2017/061457
in Nexus*; the ability to identify 4D anomalies attributed (like stress
arching) to changes
in saturated rock properties using reservoir simulation in the absence of a
coupled
geomechanics model; and it increases accuracy while maintaining a simplified
approach to
modeling rock compaction in a reservoir simulation model. Moreover, the end-
user cost of
acquiring additional pore pressure based rock mechanics test data is negated
and the time
to acquire the rock mechanics data is short, thus the present disclosure can
be easily
incorporated into existing workflows without significant burden to end users.
Embodiments and methods of the present disclosure described herein further
relate
to any one or more of the following paragraphs:
1. A computer-implemented reservoir simulation method, comprising
obtaining rock mechanics data from a pore compressibility test, the rock
mechanics data
being expressed as a function of confining stress; converting the rock
mechanics data from
a function of confining stress to a function of pore pressure using
dimensionless stress to
pore pressure conversion ("DSPC"); generating one or more rock compaction
tables using
is the converted rock mechanics data; and inputting data from the rock
compaction table into
a reservoir simulator to thereby generate a reservoir model, wherein the
reservoir model
may be used to evaluate well production.
2. The computer-implemented method as defined in paragraph 1, wherein
porosity or permeability data as a function of confining stress is obtained
from the rock
mechanics data.
3. The computer-implemented method as defined in paragraphs 1 or 2,
wherein the reservoir model simulates changes in the converted rock mechanics
data
generated as a function of confining stress into expressions of changes in the
reservoir
simulation due to pore pressure.
4. The computer-implemented method as defined in any of paragraphs 1-3,
wherein converting the rock mechanics data to a function of pore pressure
comprises
determining an assumed linear association that is determined to exist between
the rock
mechanics data and confming stress, the rock mechanics data being comprised of
porosity
or permeability data; representing the rock mechanics data as a fraction;
using DSPC,
normalizing the rock mechanics data such that a maximum confining stress value
is equal
to 1 and all other confining stress values are less than 1, wherein the
confining stress
values represent a normalized stress response; using DSPC, normalizing the
rock
mechanics data such that a maximum porosity and permeability value is equal to
1 and a
porosity and permeability value at the maximum confining stress value is less
than 1,
11
CA 03077300 2020-03-27
WO 2019/098988 PCT/US2017/061457
wherein the normalized porosity and permeability values represent porosity and
permeability multipliers; projecting the normalized stress response to be
symmetrical
above 1, thereby converting from confining stress to pore pressure wherein
pore pressure
values represent a normalized pressure response; plotting the symmetric
normalized
pressure response against the normalized porosity and permeability values, and
computing
an equation of a trendline describing an association between the symmetric
normalized
pressure response and normalized porosity and permeability values; resealing a
range of
the symmetric normalized pressure response such that the maximum pore pressure
value is
equal to 1; using the trendline, generating a rescale model of the porosity
and permeability
to multipliers; resealing the resealed range of the symmetric normalized
pressure response to
dimensionless pore pressure using DSPC; and plotting the resealed porosity and
permeability multipliers against the dimensionless pore pressure, thereby
representing
compaction tables which can be included in the execution of a reservoir model
to relate
changes in pore pressure to multipliers which effect porosity or permeability
of a
subsurface system being modeled.
5. The computer-implemented method as defined in any of paragraphs 1-4,
wherein the reservoir model is used to predict well production or evaluate
production drive
mechanisms.
6. A system for simulating a reservoir, the system comprising non-
transitory
memory storing rock mechanics data; and one or more hardware processors
coupled to the
non-transitory memory and configured to execute instructions to cause the
system to
perform operations comprising: obtaining rock mechanics data from a pore
compressibility
test, the rock mechanics data being expressed as a function of confining
stress; converting
the rock mechanics data from a function of confining stress to a function of
pore pressure
using dimensionless stress to pore pressure conversion ("DSPC"); generating
one or more
rock compaction tables using the converted rock mechanics data; and inputting
data from
the rock compaction table into a reservoir simulator to thereby generate a
reservoir model,
wherein the reservoir model may be used to perform wellbore operations.
7. The system as defined in paragraph 6, wherein porosity or permeability
data
as a function of confining stress is obtained from the rock mechanics data.
8. The system as defined in paragraphs 6 or 7, wherein the reservoir model
simulates changes in the converted rock mechanics data generated as a function
of
confining stress into expressions of changes in the reservoir simulation due
to pore
pressure.
12
CA 03077300 2020-03-27
WO 2019/098988 PCT/US2017/061457
9. The system as defined in any of paragraphs 6-8, wherein
converting the
rock mechanics data to a function of pore pressure comprises determining an
assumed
linear association that is determined to exist between the rock mechanics data
and
confining stress, the rock mechanics data being comprised of porosity or
permeability data;
representing the rock mechanics data as a fraction; using DSPC, normalizing
the rock
mechanics data such that a maximum confining stress value is equal to 1 and
all other
confining stress values are less than 1, wherein the confining stress values
represent a
normalized stress response; using DSPC, normalizing the rock mechanics data
such that a
maximum porosity and permeability value is equal to I and a porosity and
permeability
ia value at the maximum confining stress value is less than 1, wherein the
normalized
porosity and permeability values represent porosity and permeability
multipliers;
projecting the normalized stress response to be symmetrical above 1, thereby
converting
from confining stress to pore pressure wherein pore pressure values represent
a normalized
pressure response; plotting the symmetric normalized pressure response against
the
normalized porosity and permeability values, and computing a trendline
describing an
association between the symmetric normalized pressure response and normalized
porosity
and permeability values; resealing a range of the symmetric normalized
pressure response
such that the maximum pore pressure value is equal to 1; using the trendline,
generating a
rescale model of the porosity and permeability multipliers; resealing the
resealed range of
the symmetric normalized pressure response to dimensionless pore pressure
using DSPC;
and plotting the resealed porosity and permeability multipliers against the
dimensionless
pore pressure, thereby representing compaction tables which can be included in
the
execution of a reservoir model to relate changes in pore pressure to
multipliers which
effect porosity or permeability of a subsurface system being modeled.
10. The system as defined in any of paragraphs 6-9, wherein the reservoir
model is used to predict production from wells or evaluate production drive
mechanisms.
Furthermore, the illustrative methods described herein may be implemented by a
system comprising processing circuitry or a non-transitory computer readable
medium
comprising instructions which, when executed by at least one processor, causes
the
processor to perform any of the methods described herein.
Although various embodiments and methods have been shown and described, the
present disclosure is not limited to such embodiments and methods and will he
understood
to include all modifications and variations as would be apparent to one
skilled in the art.
Therefore, it should be understood that this disclosure is not intended to be
limited to the
13
CA 03077300 2020-03-27
WO 2019/098988 PCT/US2017/061457
particular forms disclosed. Rather, the intention is to cover all
modifications, equivalents
and alternatives falling within the spirit and scope of the disclosure as
defined by the
appended claims.
14