Note: Descriptions are shown in the official language in which they were submitted.
CA 03083183 2020-05-21
WO 2019/103967 PCT/US2018/061802
COMPOSITIONS AND METHODS FOR TREATING CANCER
CROSS REFERENCE TO RELATED APPLICATION
This application claims priority to and the benefit of U.S. Provisional
Application No.
62/590,072, filed November 22, 2017, which is hereby incorporated by reference
in its entirety.
STATEMENT REGARDING FEDERALLY SPONSORED RESEARCH OR
DEVELOPMENT
This application was supported by Grant Nos. U01CA113913 and R01CA154365
awarded by the National Institutes of Health. The government has certain
rights in the invention.
FIELD
Provided herein are compositions and methods for treating cancer. In
particular, provided
herein are compositions, methods, and uses of inhibitors of Testis-associated
Highly-conserved
Oncogenic long non-coding RNA (THOR) for treating cancer.
BACKGROUND
Lung cancer remains the leading cause of cancer death in industrialized
countries. About
75 percent of lung cancer cases are categorized as non-small cell lung cancer
(e.g.,
adenocarcinomas), and the other 25 percent are small cell lung cancer. Lung
cancers are
characterized in to several stages, based on the spread of the disease. In
stage I cancer, the
tumor is only in the lung and surrounded by normal tissue. In stage II cancer,
cancer has spread
to nearby lymph nodes. In stage III, cancer has spread to the chest wall or
diaphragm near the
lung, or to the lymph nodes in the mediastinum (the area that separates the
two lungs), or to the
lymph nodes on the other side of the chest or in the neck. This stage is
divided into IIIA, which
can usually be operated on, and stage IIIB, which usually cannot withstand
surgery. In stage IV,
the cancer has spread to other parts of the body.
Most patients with non-small cell lung cancer (NSCLC) present with advanced
stage
disease, and despite recent advances in multi-modality therapy, the overall
ten-year survival rate
remains dismal at 8-10% (Fry etal., Cancer 86:1867 [19991). However, a
significant minority
of patients, approximately 25-30%, with NSCLC have pathological stage I
disease and are
usually treated with surgery alone. While it is known that 35-50% of patients
with stage I
disease will relapse within five years (Williams etal., Thorac. Cardiovasc.
Surg. 82:70 [1981];
1
CA 03083183 2020-05-21
WO 2019/103967
PCT/US2018/061802
Pairolero etal., Ann, Thorac. Surg. 38:331 [19841), it is not currently
possible to identify which
specific patients are at high risk of relapse.
Adenocarcinoma is currently the predominant histologic subtype of NSCLC (Fry
etal.,
supra; Kaisermann etal., Brazil Oncol. Rep. 8:189 [2001]; Roggli etal., Hum.
Pathol. 16:569
[19851). While histopathological assessment of primary lung carcinomas can
roughly stratify
patients, there is still an urgent need to identify those patients who are at
high risk for recurrent
or metastatic disease by other means. Previous studies have identified a
number of preoperative
variables that impact survival of patients with NSCLC (Gail etal., Cancer
54:1802 19841;
Takise etal., Cancer 61:2083 [1988]; Ichinose etal., J. Thorac. Cardiovasc.
Surg. 106:90
[1993]; Harpole et al., Cancer Res. 55:1995]). Tumor size, vascular invasion,
poor
differentiation, high tumor proliferate index, and several genetic
alterations, including K-ras
(Rodenhuis etal., N. Engl. J. Med. 317:929 [1987]; Slebos etal., N. Engl. J.
Med. 323:561
[19901) and p53 (Harpole etal., supra; Horio etal., Cancer Res. 53:1 [19931)
mutation, have
been reported as prognostic indicators.
Tumor stage is an important predictor of patient survival, however, much
variability in
outcome is not accounted for by stage alone, as is observed for stage I lung
adenocarcinoma
which has a 65-70% five-year survival (Williams etal., supra; Pairolero etal.,
supra). Current
therapy for patients with stage I disease usually consists of surgical
resection and no additional
treatment (Williams et al., supra; Pairolero et al., supra). The
identification of a high-risk group
among patients with stage I disease would lead to consideration of additional
therapeutic
intervention for this group, as well as leading to improved survival of these
patients.
There is a need for additional diagnostic and treatment options, particularly
treatments
customized to a patient's tumor.
SUMMARY
Provided herein are compositions and methods for treating cancer. In
particular, provided
herein are compositions, methods, and uses of inhibitors of THOR for treating
cancer.
For example, in some embodiments, provided herein is a method of treating
cancer,
comprising: administering an agent that blocks the expression or activity of
THOR to a subject
diagnosed with cancer under conditions such that a sign or symptom of the
cancer is reduced. In
some embodiments, the agent is a nucleic acid that inhibits expression of
THOR. In some
embodiments, the nucleic acid is selected from, for example, an siRNA, miRNA,
an antisense
nucleic acid, or a shRNA. In some embodiments, the cancer is lung cancer or
melanoma. In
some embodiments, the cancer expresses THOR. In some embodiments, THOR is
2
CA 03083183 2020-05-21
WO 2019/103967
PCT/US2018/061802
overexpressed in the cancer relative to the level of expression in non-
cancerous cells. In some
embodiments, the method further comprises the step of assaying a sample of the
cancer for the
level of expression of THOR.
Additional embodiments provide a method, comprising: a) assaying a sample from
a
subject diagnosed with cancer, wherein the sample comprises cancer tissue or
cells for the level
of expression of THOR; and b) administering an agent that blocks the
expression or activity of
THOR when expression of THOR is present in the sample.
Further embodiments provide a pharmaceutical composition comprising a) an
agent that
blocks the expression or activity of THOR; and b) a pharmaceutically
acceptable carrier.
Additional embodiments are described herein.
DESCRIPTION OF THE FIGURES
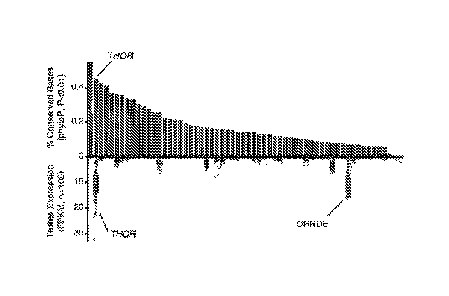
FIG. IA-D. THOR is a conserved testis specific lncRNA. A, Scatter plot
depicting the
distribution of basewise transcript conservation levels (x axis) and the
average conservation for
the best 200bp window (y axis) for all intergenic transcripts expressed at 1
FPKM or more in the
top 1% of TCGA samples. Full transcript conservation levels were measured
using the fraction
of conserved bases (PhyloP p < 0.01). Sliding window conservation levels were
measured using
the average PhastCons score across 200bp regions along the transcript. Green
points indicate
transcripts with 200bp windows that meet the criteria for `ultraconserved'
regions (Methods). B,
Dual plot depicting the fraction of conserved bases (top, green, FIG. IA, x
axis) and the
expression across testes RNA-seq samples (bottom, blue) for all ultraconserved
lncRNAs
identified in FIG. 1A. C, Expression in FPKM of THOR amongst the GTEX normal
tissue
RNA-seq dataset, spanning a myriad of different normal tissue types. D, Genome
browser
depiction of THOR and its conserved analogues in mouse and zebrafish. THOR is
annotated in
the mouse as gm29359. Multiz alignment of multiple vertebrate species depicted
as well as the
per base PhastCons conservation score.
FIG. 2A-D. THOR exhibits testis-specific expression. A, Estimation of THOR
mRNA
expression by qRT-PCR in human adult normal tissue panel. B, H&E stain of
human testis at
high magnification (400x) (right), and RNA-ISH of THOR in human testis (left).
Various cells
of the testis are labelled as follows: (1) spermatogonia, (2) spermatocytes,
(3) spermatids, (4)
mature spermatozoa, and (5) scattered Sertoli cells with a single central
prominent nucleolus.
THOR expression is observed in the spermatid and spermatocyte. C, Measurement
of mouse
THOR expression by qRT-PCR on an adult murine tissue panel (left) and embryos
(right). D,
3
CA 03083183 2020-05-21
WO 2019/103967 PCT/US2018/061802
Quantification of zebrafish THOR expression by qRT-PCR on a piscine tissue
panel (left) and
embryos (right).
FIG. 3A-M. THOR is expressed in cancers and potentiates tumorigenesis. A,
Expression
of THOR across a panel of 9,714 TCGA tumors from a myriad of different
tissues, and 2,921
normal tissue samples from GTEX and 748 normal tissue samples from the TCGA.
Expression
represented as 1og2 (FPKM+1). B, Expression of THOR in the CCLE cell line
panel. Expression
represented as 1og2 (FPKM+1). C, Expression of THOR in the TCGA lung
adenocarcinoma
(LUAD) and lung squamous cell carcinoma (LUSC) samples represented alongside
each tissue's
matched normal samples. THOR is significantly overexpressed in both LUAD and
LUSC. D,
qRT-PCR validation in an independent tissue cohort reveals THOR upregulation
in cancer
compared to benign samples both in lung adenocarcinoma (benign, n=13; cancer,
n=180), and
melanoma tissues (benign, n = 2; cancer, n=24). E, Expression levels of THOR
in two melanoma
(SKCM) and two non-small cell lung cancer (NSCLC) cell lines. Data show mean
S.D. F, Cell
proliferation assays for NCI-H1299 cells treated with 2 independent THOR
siRNAs. G, Cell
proliferation assays for NCI-H1299 cells treated with 2 independent THOR ASOs.
Data show
mean S.E. from one of the two independent experiments. H, Anchorage-
independent growth
of H1299 cells transfected with non-targeting siRNA (si-NT) or two THOR siRNAs
(siTHOR-
A, siTHOR-B),I, Cell proliferation assay for NCI-H1299 cells with CRISPR-Cas9
mediated
THOR knockout vs control in the context of LacZ and THOR overexpression. I,
Anchorage-
independent growth of H1299 cells transfected with non-targeting siRNA (si-NT)
or two THOR
siRNAs (siTHOR-A, siTHOR-B). Left, quantification of number of colonies.
Right,
representative image of surviving colonies and individual colony. J, THOR
knockout NCI-
H1299 cell line xenografts (N=10) demonstrate decreased tumor growth relative
to control
samples (N=10). Tumor volumes at each time point by caliper measurement are
shown. K, Cell
proliferation assay in NCI-H1437 cells stably transfected with THOR
overexpression or LacZ
control lentivirus. Data show mean S.E. from one of the two independent
experiments. L,
Anchorage-independent growth of LacZ or THOR overexpressing H1437 cells. Left,
quantification of number of colonies. Right representative images of surviving
soft agar
colonies. M, THOR overexpressing NCI-H1437 cell line xenografts (N=10)
demonstrate
increased tumor growth relative to control LacZ samples (N=10). Tumor volumes
at each time
point by caliper measurement are shown. Asterisk (*) indicates P < 0.001 by a
two-tailed
Student's t-test. Data show mean S.E.M. from one of the two independent
experiments. For all
panels, asterisk (*) indicates P < 0.01, (**) indicates P < 0.001, (***)
indicates P < 0.0001 by a
two-tailed Student's t-test.
4
CA 03083183 2020-05-21
WO 2019/103967 PCT/US2018/061802
FIG. 4A-F. Conserved interaction of THOR and IGF2BP1. A, Table reporting the
protein
binding partners for THOR in four different experimental conditions of RNA
pull-down
analysis: zebrafish THOR added to human H1299 cell lysate (green), human THOR
added to
human H1299 cell lysate (blue), zebrafish THOR added to zebrafish embryo
lysate (yellow), and
.. human THOR added to zebrafish embryo lysate (red). All proteins bound in
any condition are
displayed in the table, and each dot represents binding in the respective
condition. B,
Immunoprecipitation western blotting analysis (IP-WB) for various components
of the IGFBP
complex which contains IGF2BP1, IGF2BP2, IGF2BP3, STAU1 and YBX1. HuR (ELAV1)
was used as a negative control. C, qRT-PCR following RIP of IGF2BP1, IGF2BP2,
IGF2BP3,
.. STAU1, YBX1, HUR, and IgG in H1299 cells. Data show mean S.D. from one of
the two
independent experiments. D, In vitro RNA-protein binding assay. In vitro
transcribed THOR
added to purified myc-tagged proteins. THOR qRT-PCR was then performed
following anti-myc
pull-down. Asterisk (*) indicates P < 0.01 by a two-tailed Student's t-test.
Data show mean
S.D. from one of the two independent experiments. E, Schematic representation
of human
THOR, antisense-THOR (AS), and various deletion constructs generated to
interrogate IGF2BP1
binding (left). Fragment sizes confirmed by PCR (right, top), and binding of
each fragment to
IGF2BP1 determined via pulldown of BRU-labelled RNA fragments (right, bottom)
in H1299
cells. F, Schematic representation of zebrafish THOR constructs generated to
study IGF2BP1
binding. Fragment sizes confirmed by PCR (right, top), and binding of each
fragment to
zebrafish igf2bp1 determined via pulldown of BRU-labelled RNA fragments
(right, bottom) in
16 hpf embryos.
FIG. 5A-E. Interrogation of the functional relationship of THOR and IGF2BP1.
A, Bar
plot depiction of the expression levels of 13 canonical IGF2BP1 target genes
by qRT-PCR in
various conditions: THOR knockdown, THOR overexpression, IGF2BP1 knockdown,
IGF2
knockdown, IGF2 overexpression, and CD44 knockdown. Data show mean S.D. from
one of
the two independent experiments. B, qRT-PCR expression levels for IGF2 (red,
black) and
CD44 (blue, black) following RIP of IGF2BP1 or IgG as negative control. RIPs
performed in
H1299 cells under various experimental conditions: THOR siRNA knockdown, IGF2
siRNA
knockdown, CD44 siRNA knockdown, and THOR overexpression. Asterisk indicate *P
< 0.05;
**P < 0.01; ***P < 0.001 by two-tailed Student's t-test. Data show mean S.D.
from one of the
two independent experiments. C, qRT-PCR expression levels for IGF2 (top) and
CD44 (bottom)
following Actinomycin D treatment in THOR or LacZ overexpressing H1347 cells.
Data show
mean S.D. from one of the two independent experiments. D, Cell proliferation
assays for
H1437 and SKMEL5 cells overexpressing LacZ control and THOR in the context of
siRNA
5
CA 03083183 2020-05-21
WO 2019/103967 PCT/US2018/061802
control and siRNA knockdown of IGF2BP1. Inset depicts the 1og2(fold change)
comparing the
proliferation at the final time point for control and IGF2BP1 knockdown for
the LacZ and
THOR-overexpression settings. E, Cell proliferation assay in H1437 cells
overexpressing full
length THOR, a THOR deletion mutant lacking the IGF2BP1 binding site, and LacZ
control.
Asterisk indicate *P < 0.05; **P < 0.001 by two-tailed Student's t-test. Data
show mean S.E.
from one of the two independent experiments.
FIG. 6A-C. Shared transcriptional regulation by THOR and IGF2BP1. A. Heatmap
depicting the expression of the genes significantly differentially expressed
(DESeq FDR < 0.05)
in knockdown of THOR and IGF2BP1 in H1299 cells in addition to those genes
with significant
differential expression in HUR knockdown. Expression depicted as the 1og2(fold-
change) for
each siRNA compared to the non-targeting siRNA control. B. Venn diagram
depiction of the
overlap for the significant differentially expressed genes in THOR, IGF2BP1,
and HUR
knockdown. Fisher's exact statistics shown on the right. C. Scatterplot
depicting the GSEA
performance for MSigDBv5.0 gene signatures with NES <0 for both THOR and
IGF2BP1
knockdown (left). Signatures significant upon knockdown of both genes (FWER p-
value < 0.01)
depicted in gold. Two melanoma gene signatures depicted in blue. Pearson
correlation
coefficient shown in bottom right of scatterpot. GSEA plots for two
significant melanoma
signatures depicted for knockdown of THOR and IGF2BP1 (right).
FIG. 7A-J. THOR regulates melanoma onset in zebrafish. A, Schematic depicting
creation of THOR knockout zebrafish model. B, Fraction of fertilized zebrafish
embryos derived
from wild-type, or THOR knockout zebrafish (-/-) 6 hours following mating.
Asterisk (*)
indicates P < 0.01 by a x2 test. Data show mean S.D. from two independent
experiments. C,
Fraction of fertilized 6hpf zebrafish embryos derived from wild-type female
crossed with THOR
knockout male, or THOR knockout female crossed with wild-type male. Asterisk
(*) indicates P
< 0.01 by a2 test. Data show mean S.D. from two independent experiments. D,
Expression
levels of zTHOR in testicular somatic cells as well as in six Hoechst profiled
subpopulations of
testicular germ cells. Data show mean S.D. E, Bar plot demonstrates
expression of 12
zebrafish orthologs of the canonical IGF2BP1 target genes by qRT-PCR in
zebrafish embryos.
Expression represented as 1og2 of the fold change of either THOR-I- compared
to wild-type
embryos (red) or THOR overexpression compared to control mCherry. Data show
mean S.D.
from one of the two independent experiments. F, Kaplan-Meier curve of melanoma
free period
for mitfa promoter driven NRAS 61K zebrafish in either THOR-I- background or
wildtype
background. P values were determined using a log-rank test. G, Schematic
describing the
generation of the h-THOR overexpression melanoma zebrafish model. H, Kaplan-
Meier curve of
6
CA 03083183 2020-05-21
WO 2019/103967 PCT/US2018/061802
melanoma free period for p53-/- zebrafish co-injected with either mitfa
promoter driven NRAS
61K + mitfa promoter driven human THOR or mitfa promoter driven NRAS 61K +
mCherry. P
values were determined using a log-rank test. I, Percentage of body area
covered in melanoma
for mCherry and h-THOR injected zebrafish also containing mitfa promoter
driven NRAS 61K.
Asterisk (*) indicates P < 0.01 obtained by a two-tailed Student's t-test. J,
Specimen example of
NRAS 61K driven melanomas in zebrafish co-injected with mitfa promoter driven
h-THOR or
mitfa promoter driven mCherry in a p53-/- background.
FIG. 8A-E. Conservation of protein-coding genes and expression of CRNDE in
normal
tissue. A, Scatter plot depicting the distribution of basewise transcript
conservation levels (x
axis) and the average conservation for the best 200bp window (y axis) for all
protein coding
genes expressed at 1 FPKM or more in the top 1% of TCGA samples. B, Expression
of lncRNA
CRNDE amongst the GTEX normal tissue RNA-seq dataset, spanning a myriad of
different
normal tissue types. C-E, UCSC genomic browser view of THOR represented in the
UCSC
browser for (C) human GRCh37, (D) mouse GRCm38, and (E) zebrafish Zv9. THOR
structure
depicted along with H3K4me3 histone marks (ENCODE), conservation (Phylop and
PhastCons)
and Multiz 100 vertebrate alignment.
FIG. 9A-K. A, Northern blot of endogenous THOR in H1299 cells, and of H1437
cells
expressing LacZ control, THOR, and THOR with the addition of siRNA targeting
THOR. Blot of
gapdh provided as a control. B, Bar plot depicting the qPCR expression of the
long vs short
THOR isoform. C, qPCR expression of the long THOR isoform following addition
of siRNA. C,
Northern blot of THOR in zebrafish kidney and testis. Blot of GAPDH provided
as a control. D,
5' RACE for the THOR transcripts expressed by the lentiviral system. PCR
agarose gel (left)
confirms single band used in Sanger sequencing (right). F, 3' RACE for the
THOR transcripts
expressed by the lentiviral system. PCR agarose gel (left) shows two bands
utilized in Sanger
sequencing (right). G, Coding probability scores for the transcripts were
assessed by Coding
Potential Assessment Tool (CPAT). NRAS and TP53 used as positive control, and
SCHLAP 1 as
a negative control. H, Coding probability scores for the PhyloCSF and CPC
tools for THOR and
MYC. Values less than 0 suggest a lack of coding potential. I, Genome browser
depiction of the
THOR locus with aggregate ribosomal profiling track (red), aggregate poly-A
RNA-seq track
(green) and GENCODE v22 genome annotation obtained from the GWIPS-viz ribo-seq
genome
browser. J, H&E image of the testis and surrounding tissue architecture. K,
H&E (left) and
THOR ISH (right) for the human testis, rete, and adipose.
FIG. 10A-U. THOR knockdown efficiency and cancer phenotype assays. A,
Knockdown
efficiency of two independent siRNAs against THOR in NCI-H1299 and MM603 cells
7
CA 03083183 2020-05-21
WO 2019/103967 PCT/US2018/061802
determined by qRT-PCR. Data show mean S.D. B, Knockdown efficiency of two
independent
ASOs against THOR in NCI-H1299 and MM603 cells determined by qRT-PCR. Data
show
mean S.D. C, Cell proliferation assays for MM603 cells treated with two
independent THOR
siRNAs. D, Cell proliferation of MM603 cells treated with two independent
ASOs. E, Cell
proliferation assays for NCI-H1437 cells treated with two independent THOR
siRNAs. Data
show mean S.E. from one of the two independent experiments. F, Cell
proliferation assays for
SK-MEL-5 cells treated with two independent THOR ASOs. Data show mean S.E.
from one
of the two independent experiments. G-H, Anchorage-independent growth of (G)
H1299 cells
transfected with non-targeting ASO or two THOR ASOs, (H) MM603 cells
transfected with
non-targeting siRNA and siRNAs targeting THOR, and (I) MM603 cells transfected
with non-
targeting ASO and ASOs targeting THOR. Left, quantification of number of
colonies. Right,
representative image of surviving colonies and individual colony. K, DNA
agarose gel
confirming knockout of THOR region flanked by sg#2 and sg#3 vis PCR. L, qPCR
validation of
THOR expression in control cells compared to knockout cells. M, DNA agarose
gel confirming
knockout of regions flanked by sgRNAs in the various conditions vis PCR in
H1299 cells. N,
RNA knockout efficiency for the mosaic CRISPR knockout models determined by
qPCR. 0,
Proliferation assay for the mosaic populations for the THOR knockout H1299
cells produced via
various sgRNA combinations compared to non-targeting sgRNA. P, DNA agarose gel
confirming knockout of regions flanked by sgRNAs in the various conditions vis
PCR in H1437
cells. Q, Proliferation assay for the mosaic populations for the THOR knockout
H1437 cells
produced via various sgRNA combinations compared to non-targeting sgRNA. R,
Overexpression efficiency of THOR in NCI-H1299 and SK-MEL-5 cells. Data show
mean
S.D. S, Cell proliferation assay in SK-MEL-5 cells stably transfected with
THOR overexpression
or LacZ control lentivirus. Data show mean S.E. from one of the two
independent
experiments. T, Anchorage-independent growth of LacZ or THOR overexpressing
SKMEL5
cells. Left, quantification of number of colonies. Right representative images
of surviving soft
agar colonies. U, Tumor growth for THOR overexpressing SKMEL5 cell line
xenografts
(N=10) and control LacZ samples (N=10).
FIG. 11A-N. THOR cellular localization. A, qRT-PCR for TERC , ACTB, and THOR
following nuclear and cytoplasmic fractionation of NCI-H1299 cell lysates
demonstrates both
nuclear and cytoplasmic expression of THOR. B, Single molecule RNA in situ
hybridization in
NCI-H1299 cells. (C, E, G) Representative, pseuodocolored images of H1299 or
H1437 cells,
treated with various siRNAs, ASOs or overexpression constructs and stained for
DAPI
(magenta) and THOR (grey). Scale bar, 10 p.m. (D, F, H) Quantification of fold
change in
8
CA 03083183 2020-05-21
WO 2019/103967 PCT/US2018/061802
THOR expression of samples represented in D, E, G respectively. I, Venn
diagram depiction of
the proteins preferentially bound to sense THOR (compared to antisense) from
nuclear or
cytoplasmic lysate from H1299 cells. Jdiagram of the RRM and KH domains on the
IGF2BP1
protein. N, Western blot of input (top) and following RNA-pulldown of BrU
labelled THOR
(bottom) for Halo-tagged mutant IGF2BP1 with various IGF2BP1 protein domains
deleted.
Error bars, s.e.m. (n=4; > 300 cells per replicate, per sample; *p<0.05;
****p<0.0001).
FIG. 12A-J. THOR interaction with IGF2BP proteins. A, The expression of
IGF2BP1
targets and IGF2-MEK-ERK axis proteins and their corresponding phosphorylated
forms in
siTHOR treated H1299 cells (left) and THOR overexpressing H1437 cells (right).
B, Bar plot
depiction of the expression levels of 13 canonical IGF2BP1 target genes by qRT-
PCR in H1299
cells with CRISPR-mediated THOR knockout, and in the same cells with
expression of ectopic
THOR. Data show mean S.D. from one of the two independent experiments. C,
Western blot
confirming IGF2BP1 pull-down utilized for the RIP experiments depicted in
Figure 5C. D, qRT-
PCR expression levels for GAPDH (left) and UBC (right) following Actinomycin D
treatment in
THOR or LacZ overexpressing H1347 cells. Data show mean S.D. from one of the
two
independent experiments. E, qRT-PCR expression levels for THOR (red), GAPDH
(blue) and
MYC (green) following Actinomycin D treatment in H1299 cells. Data show mean
S.D. from
one of the two independent experiments. F, Schematic diagram of the IGF2-MEK-
ERK
signaling cascade. G-H, Cell proliferation assay for cells treated with
IGF2BP1 siRNA in (G)
H1299 cells and (H) MM603. I-J, Anchorage-independent growth for cells with
addition of non-
targeting siRNA and siRNA targeting IGF2BP1 in (C) H1299 and (D) MM603 cells.
FIG. 13A-J. RNA-seq analysis of THOR function. A, Heatmap depicting the
expression
of the genes significantly differentially expressed (DESeq FDR < 0.05) in
knockdown of THOR
and IGF2BP1 in H1299 cells via siRNA in addition to those genes with
significant differential
expression in HUR knockdown via siRNA. B,C, Scatterplot depicting the GSEA
performance
for MSigDBv5.0 gene signatures with NES <0 for (B) HUR and THOR and (C) HUR
and
IGF2BP1. Signatures significant upon knockdown of both genes (FWER p-value <
0.01)
depicted in gold. D, Genomic depiction of THOR. Coverage plots for IGF2BP1
replicates
shown for H1437 cells overexpressing THOR and LacZ control (blue). GENCODEv24
gene
structure of THOR also shown (green). Peaks called via Piranha for all three
iCLIP samples
shown (bottom). E-F, Gene expression depicted as 1og2(Fold Change) from RNA-
seq data
comparing the THOR-overexpression condition to LacZ overexpression. Genes
identified as
IGF2BP1 binding partners via iCLIP are depicted in blue, while all other genes
in yellow.
Expression differences shown via (E) density plot and (F) cumulative
distribution function. G,
9
CA 03083183 2020-05-21
WO 2019/103967
PCT/US2018/061802
Coverage plots for IGF2BP1 binding via iCLIP for H1299. H-I, Gene expression
depicted as
1og2(Fold Change) from RNA-seq data comparing the THOR knockdown to control
knockdown
in H1299 cells. Genes identified as IGF2BP1 binding partners via iCLIP are
depicted in blue,
while all other genes in yellow. Expression differences shown via (H) density
plot and (I)
cumulative distribution function. J, Scatterplot depiction of the RNA-seq
expression of genes in
the genomic vicinity of THOR.
FIG. 14A-L. THOR genetic model in zebrafish exhibits melanoma phenotype and
fertility phenotype. A, Schematic representation of human and zebrafish THOR
transcript
structure and the guide RNA (gRNA) design used to delete the conserved
transcript region of
zebrafish THOR via CRISPR/Cas9 genome editing (top). Validation of THOR
knockout at both
DNA (genotyping) and RNA (qRT-PCR) level (bottom). Data show mean S.D. B,
Kaplan-
Meier curve of tumor free period for p53-/- zebrafish (solid lines) and p53
wildtype zebrafish
(dotted lines) co-injected with either mitfa promoter driven NRAS 61K + mitfa
promoter driven
human THOR (red) or mitfa promoter driven NRAS 61K + mCherry (blue). C-D, Cell
selection
is visualized in a "Hoechst Blue"/"Hoechst Red" contour plot, in which the
density of the cells is
displayed as contour lines that form circular contours upon high cell density.
Contour plots
shown for sorted zebrafish spermatocytes from (C) wildtype zebrafish and (D)
THOR knockout
zebrafish. E, GSEA results shown for all 5 MSigDB signatures related to
meiosis for gene
expression changes following siRNA mediated THOR knockdown determined by RNA-
seq.
Genes ranked by ¨log(pval)*(Fold Change). F, Representative GSEA plot for the
REACTOME MEIOTIC SYNAPSE gene signature. G, Volcano plot for gene expression
changes following THOR knockdown determined via DESeq. Meiotic histone genes
in the
MEIOTIC SYNAPSE gene signature shown in blue. H, Representative image of
zebrafish with
melanoma. I-J, Immunohistochemistry for melanoma in p53 wildtype background
with
endogenous THOR. K-L, Immunohistochemistry for melanoma in p53 knockout
background
zebrafish with exogenous h-THOR. I and K, H and E staining (100x) of melanoma.
J and L,
Immunohistochemistry staining (100x) for Melan-A of melanoma.
DEFINITIONS
To facilitate an understanding of the present disclosure, a number of terms
and phrases
are defined below:
As used herein, the term "subject" refers to any animal (e.g., a mammal),
including, but
not limited to, humans, non-human primates, rodents, and the like, which is to
be the recipient of
CA 03083183 2020-05-21
WO 2019/103967 PCT/US2018/061802
a particular treatment. Typically, the terms "subject" and "patient" are used
interchangeably
herein in reference to a subject (e.g., a human subject).
As used herein, the term "subject suspected of having cancer" refers to a
subject that
presents one or more symptoms indicative of cancer. A subject suspected of
having cancer may
also have one or more risk factors. A subject suspected of having cancer has
generally not been
tested for cancer. However, a "subject suspected of having cancer" encompasses
an individual
who has received a preliminary diagnosis but for whom a confirmatory test has
not been done or
for whom the level or severity of cancer is not known.
As used herein, the term "subject diagnosed with cancer" refers to a subject
who has
been tested and found to have cancer. As used herein, the term "initial
diagnosis" refers to a test
result of initial disease that reveals the presence or absence of disease.
As used herein, the term "non-human animals" refers to all non-human animals
including, but not limited to, vertebrates such as rodents, non-human
primates, ovines, bovines,
ruminants, lagomorphs, porcines, caprines, equines, canines, felines, ayes,
etc.
As used herein, the term "cell culture" refers to any in vitro culture of
cells. Included
within this term are continuous cell lines (e.g., with an immortal phenotype),
primary cell
cultures, transformed cell lines, finite cell lines (e.g., non-transformed
cells), and any other cell
population maintained in vitro.
As used herein, the term "eukaryote" refers to organisms distinguishable from
"prokaryotes." It is intended that the term encompass all organisms with cells
that exhibit the
usual characteristics of eukaryotes, such as the presence of a true nucleus
bounded by a nuclear
membrane, within which lie the chromosomes, the presence of membrane-bound
organelles, and
other characteristics commonly observed in eukaryotic organisms. Thus, the
term includes, but
is not limited to such organisms as fungi, protozoa, and animals (e.g.,
humans).
As used herein, the term "in vitro" refers to an artificial environment and to
processes or
reactions that occur within an artificial environment. In vitro environments
can consist of, but
are not limited to, test tubes and cell culture. The term "in vivo" refers to
the natural
environment (e.g., an animal or a cell) and to processes or reaction that
occur within a natural
environment.
The terms "test compound" and "candidate compound" refer to any chemical
entity,
pharmaceutical, drug, and the like that is a candidate for use to treat or
prevent a disease, illness,
sickness, or disorder of bodily function (e.g., cancer). Test compounds
comprise both known
and potential therapeutic compounds. A test compound can be determined to be
therapeutic by
screening using the screening methods of the present disclosure.
11
CA 03083183 2020-05-21
WO 2019/103967 PCT/US2018/061802
As used herein, the term "sample" is used in its broadest sense. In one sense,
it is meant
to include a specimen or culture obtained from any source, as well as
biological and
environmental samples. Biological samples may be obtained from animals
(including humans)
and encompass fluids, solids, tissues, and gases. Biological samples include
blood products,
such as plasma, serum and the like. Environmental samples include
environmental material
such as surface matter, soil, water, and industrial samples. Such examples are
not however to be
construed as limiting the sample types applicable to the present disclosure.
As used herein, the term "effective amount" refers to the amount of a compound
(e.g., a
compound described herein) sufficient to effect beneficial or desired results.
An effective
amount can be administered in one or more administrations, applications or
dosages and is not
limited to or intended to be limited to a particular formulation or
administration route.
As used herein, the term "co-administration" refers to the administration of
at least two
agent(s) (e.g., THOR inhibitor described herein) or therapies to a subject. In
some
embodiments, the co-administration of two or more agents/therapies is
concurrent. In other
embodiments, a first agent/therapy is administered prior to a second
agent/therapy. Those of
skill in the art understand that the formulations and/or routes of
administration of the various
agents/therapies used may vary. The appropriate dosage for co-administration
can be readily
determined by one skilled in the art. In some embodiments, when
agents/therapies are co-
administered, the respective agents/therapies are administered at lower
dosages than appropriate
for their administration alone. Thus, co-administration is especially
desirable in embodiments
where the co-administration of the agents/therapies lowers the requisite
dosage of a known
potentially harmful (e.g., toxic) agent(s).
As used herein, the term "pharmaceutical composition" refers to the
combination of an
active agent with a carrier, inert or active, making the composition
especially suitable for
diagnostic or therapeutic use in vivo, or ex vivo.
As used herein, the term "toxic" refers to any detrimental or harmful effects
on a cell or
tissue as compared to the same cell or tissue prior to the administration of
the toxicant.
"Amelioration" or "ameliorate" or "ameliorating" refers to a lessening of at
least one
indicator, sign, or symptom of an associated disease, disorder, or condition.
The severity of
indicators may be determined by subjective or objective measures, which are
known to those
skilled in the art.
"Antisense activity" means any detectable or measurable activity attributable
to the
hybridization of an antisense compound to its target nucleic acid. In certain
embodiments,
12
CA 03083183 2020-05-21
WO 2019/103967 PCT/US2018/061802
antisense activity is a decrease in the amount or expression of a target
nucleic acid or protein
encoded by such target nucleic acid.
"Antisense compound" means an oligomeric compound that is capable of
undergoing
hybridization to a target nucleic acid through hydrogen bonding. Examples of
antisense
compounds include, but are not limited to, single-stranded and double-stranded
compounds,
such as, antisense oligonucleotides, siRNAs and shRNAs.
"Antisense inhibition" means reduction of target nucleic acid levels or target
protein
levels in the presence of an antisense compound complementary to a target
nucleic acid
compared to target nucleic acid levels or target protein levels in the absence
of the antisense
compound.
"Antisense oligonucleotide" means a single-stranded oligonucleotide having a
nucleobase sequence that permits hybridization to a corresponding region or
segment of a target
nucleic acid.
"Oligonucleotide" means a polymer of linked nucleosides each of which can be
modified
or unmodified, independent one from another.
DETAILED DESCRIPTION OF THE DISCLOSURE
Provided herein are compositions and methods for treating cancer. In
particular, provided
herein are compositions, methods, and uses of inhibitors of THOR for treating
cancer.
Over the past decade, there has been a paradigm shift in the understanding of
molecular
biology sparked by the discovery of non-coding RNAs (ncRNAs) challenging the
central dogma
of molecular biology (Mattick and Makunin, Hum. Mol. Genet. 15 Spec No, 17-29
2006). It has
become apparent that the transcriptome is far more intricate than previously
appreciated (Birney
et al., Nature 447, 799-816 2007), with various types of non-coding RNAs
implicated in key
physiological roles in cells (Morris and Mattick, Nat. Rev. Genet. 15, 423-437
2014). Long non-
coding RNAs (lncRNAs) have emerged as an abundant and functionally diverse
species of
ncRNA (Iyer et al Nat Genet advance on (2015); Ulitsky and Bartel, Cell 154,
26-46 2013a).
Despite their striking prevalence in the transcriptome and countless efforts
to interrogate their
function, understanding of the function of the vast majority of lncRNAs
remains anecdotal,
making their classification particularly challenging (St. Laurent et al.,
Trends Genet. 31, 239-
251 2015). Novel classes of lncRNAs continue to be identified with
categorization criteria
including their degree of conservation (Ulitsky et al., Cell 147, 1537-1550
2011), association
with various DNA elements (Kim et al., Nature 465, 182-187 2010; Luke and
Lingner, EMBO
J. 28, 2503-2510 2009), ability to bind miRNAs (Salmena et al., Cell 146, 353-
358 2011),
13
CA 03083183 2020-05-21
WO 2019/103967 PCT/US2018/061802
regulation of chromatin remodeling (Gupta et al., Nature 464, 1071-1076 2010;
Prensner et al.,
Nat. Genet. 45, 1392-1398 2013; Wang et al., Nature 472, 120-124 2011),
induction of
aneuploidy (Lee et al., Cell 2015), influence on RNA stability machinery
(Kretz et al., Nature
493, 231-235 2013), and their potential to produce small peptides (Nelson et
al., Science 351,
271-275 2016; Pauli et al., Science 343, 1248636 2014).
Recently, it was discovered that the human genome possesses the potential to
transcribe
tens of thousands of lncRNAs (Iyer et al., supra). With the overwhelmingly
large number of
potentially functional elements to investigate, features such as degree of
evolutionary
conservation and expression pattern are logical criteria that can be employed
to discover
functionally important lncRNAs in cells. Although the general level of
conservation of lncRNAs
has been contentious (Cabili et al., Genes Dev. 25, 1915-1927 2011; Iyer et
al., supra), there is a
clear subclass of lncRNAs that are highly conserved, many of which possess
"ultraconserved"
regions (i.e., at least 200 base-pairs (bps) of nearly perfect vertebrate
conservation) (Calin et al.,
Cancer Cell 12, 215-229 2007; Hudson et al., Mol. Cancer 12, 13 2013; Ulitsky
et al., Cell 147,
1537-1550 2011). While conservation is a trait highly suggestive of functional
relevance in
cells, it also permits the characterization and mechanistic investigation of
lncRNAs in model
organisms (Sauvageau et al., eLife 2013, 1-24 2013; Ulitsky et al., 2011;
supra), a particularly
exciting avenue given the recent popularization of genome editing techniques
(Cong et al.,
Science 339, 819-823 2013).
In searching for highly conserved lncRNAs with intriguing expression patterns,
experiments described herein defined a novel class of lncRNA, with normal
tissue expression
limited to the testis and widespread expression in multiple cancer types. This
cancer/testis
expression pattern is characteristic of cancer/testis antigens. While many
cancer-associated
lncRNAs have been identified (Prensner and Chinnaiyan, Cancer Discov. 1, 391-
407 2011;
Sahu et al., Trends Cancer 1, 93-109 2016), none previously characterized have
exhibited
cancer/testis expression. Described herein is the first cancer/testis lncRNA,
THOR (Testis-
associated Highly-conserved Oncogenic long non-coding RNA), and its role in
oncogenesis and
testis physiology, identifying an evolutionarily conserved functional
interaction with IGF2
mRNA-binding proteins (IGF2BPs).
Accordingly, provided herein are compositions and methods for treating cancer
by
inhibiting the expression and/or function of THOR.
I. Inhibitors
14
CA 03083183 2020-05-21
WO 2019/103967 PCT/US2018/061802
In some embodiments, the THOR inhibitor is selected from, for example, a
nucleic acid
(e.g., siRNA, shRNA, miRNA or an antisense nucleic acid), a small molecule, a
peptide, or an
antibody.
a) nucleic acids
In some embodiments, the THOR inhibitor is a nucleic acid. Exemplary nucleic
acids
suitable for inhibiting THOR (e.g., by preventing expression of THOR) include,
but are not
limited to, antisense nucleic acids and RNAi. In some embodiments, nucleic
acid therapies are
complementary to and hybridize to at least a portion (e.g., at least 5, 8, 10,
11, 12, 13, 14, 15, 16,
17, 18, 19, or 20 nucleotides) of THOR.
In some embodiments, compositions comprising oligomeric antisense compounds,
particularly oligonucleotides are used to modulate the function of nucleic
acid molecules
encoding THOR, ultimately modulating the amount of THOR expressed. This is
accomplished
by providing antisense compounds that specifically hybridize with one or more
THOR nucleic
acids. The specific hybridization of an oligomeric compound with its target
nucleic acid
interferes with the normal function of the nucleic acid. This modulation of
function of a target
nucleic acid by compounds that specifically hybridize to it is generally
referred to as
"antisense." The functions of DNA to be interfered with include replication
and transcription.
The functions of RNA to be interfered with include all vital functions such
as, for example,
translocation of the RNA to the site of protein translation, translation of
protein from the RNA,
splicing of the RNA to yield one or more mRNA species, and catalytic activity
that may be
engaged in or facilitated by the RNA. The overall effect of such interference
with target nucleic
acid function is decreasing the amount of THOR proteins in the T-cell.
Antisense activity may result from any mechanism involving the hybridization
of the
antisense compound (e.g., oligonucleotide) with a target nucleic acid, wherein
the hybridization
ultimately results in a biological effect. In certain embodiments, the amount
and/or activity of
the target nucleic acid is modulated. In certain embodiments, the amount
and/or activity of the
target nucleic acid is reduced. In certain embodiments, hybridization of the
antisense compound
to the target nucleic acid ultimately results in target nucleic acid
degradation. In certain
embodiments, hybridization of the antisense compound to the target nucleic
acid does not result
in target nucleic acid degradation. In certain such embodiments, the presence
of the antisense
compound hybridized with the target nucleic acid (occupancy) results in a
modulation of
antisense activity. In certain embodiments, antisense compounds having a
particular chemical
motif or pattern of chemical modifications are particularly suited to exploit
one or more
CA 03083183 2020-05-21
WO 2019/103967 PCT/US2018/061802
mechanisms. In certain embodiments, antisense compounds function through more
than one
mechanism and/or through mechanisms that have not been elucidated.
Accordingly, the
antisense compounds described herein are not limited by particular mechanism.
Antisense mechanisms include, without limitation, RNase H mediated antisense;
RNAi
mechanisms, which include, without limitation, siRNA, ssRNA and microRNA
mechanisms;
and occupancy based mechanisms. Certain antisense compounds may act through
more than one
such mechanism and/or through additional mechanisms.
In certain embodiments, antisense compounds, including those particularly
suitable for
ssRNA comprise one or more type of modified sugar moieties and/or naturally
occurring sugar
moieties. In certain embodiments, antisense compounds, including those
particularly suited for
use as ssRNA comprise modified intemucleoside linkages. Exemplary
modifications are
described, for example, in Geary et al., Adv Drug Deliv Rev. 2015 Jun 29;87:46-
51; herein
incorporated by reference in its entirety.
In some embodiments, nucleic acids are RNAi nucleic acids. "RNA interference
(RNAi)" is the process of sequence-specific, post-transcriptional gene
silencing initiated by a
small interfering RNA (siRNA), shRNA, or microRNA (miRNA). During RNAi, the
RNA
induces degradation of target mRNA with consequent sequence-specific
inhibition of gene
expression.
In "RNA interference," or "RNAi," a "small interfering RNA" or "short
interfering
RNA" or "siRNA" or "short hairpin RNA" or "shRNA" molecule, or "miRNA" an RNAi
(e.g.,
single strand, duplex, or hairpin) of nucleotides is targeted to a nucleic
acid sequence of interest,
for example, THOR.
An "RNA duplex" refers to the structure formed by the complementary pairing
between
two regions of a RNA molecule. The RNA using in RNAi is "targeted" to a gene
in that the
nucleotide sequence of the duplex portion of the RNAi is complementary to a
nucleotide
sequence of the targeted gene. In certain embodiments, the RNAi is targeted to
THOR nucleic
acids. In some embodiments, the length of the RNAi is less than 30 base pairs.
In some
embodiments, the RNA can be 32, 31, 30, 29, 28, 27, 26, 25, 24, 23, 22, 21,
20, 19, 18, 17, 16,
15, 14, 13, 12, 11 or 10 base pairs in length. In some embodiments, the length
of the RNAi is 19
to 32 base pairs in length. In certain embodiment, the length of the RNAi is
19 or 21 base pairs
in length.
In some embodiments, RNAi comprises a hairpin structure (e.g., shRNA). In
addition to
the duplex portion, the hairpin structure may contain a loop portion
positioned between the two
sequences that form the duplex. The loop can vary in length. In some
embodiments the loop is 5,
16
CA 03083183 2020-05-21
WO 2019/103967 PCT/US2018/061802
6, 7, 8, 9, 10, 11, 12, 13, 14, 15, 16, 17, 18, 19, 20, 21, 22, 23, 24, 25, 26
or 27 nucleotides in
length. In certain embodiments, the loop is 18 nucleotides in length. The
hairpin structure can
also contain 3' and/or 5' overhang portions. In some embodiments, the overhang
is a 3' and/or a
5' overhang 0, 1, 2, 3, 4 or 5 nucleotides in length.
"miRNA" or "miR" means a non-coding RNA between 18 and 25 nucleobases in
length
which hybridizes to and regulates the expression of a coding RNA. In certain
embodiments, a
miRNA is the product of cleavage of a pre-miRNA by the enzyme Dicer. Examples
of miRNAs
are found in the miRNA database known as miRBase.
As used herein, Dicer-substrate RNAs (DsiRNAs) are chemically synthesized
asymmetric 25-mer/27-mer duplex RNAs that have increased potency in RNA
interference
compared to traditional RNAi. Traditional 21-mer RNAi molecules are designed
to mimic Dicer
products and therefore bypass interaction with the enzyme Dicer. Dicer has
been recently shown
to be a component of RISC and involved with entry of the RNAi into RISC. Dicer-
substrate
RNAi molecules are designed to be optimally processed by Dicer and show
increased potency
by engaging this natural processing pathway. Using this approach, sustained
knockdown has
been regularly achieved using sub-nanomolar concentrations. (U.S. Pat. No.
8,084,599; Kim et
al., Nature Biotechnology 23:222 2005; Rose et al., Nucleic Acids Res.,
33:4140 2005).
The transcriptional unit of a "shRNA" is comprised of sense and antisense
sequences
connected by a loop of unpaired nucleotides. shRNAs are exported from the
nucleus by
Exportin-5, and once in the cytoplasm, are processed by Dicer to generate
functional RNAi
molecules. "miRNAs" stem-loops are comprised of sense and antisense sequences
connected by
a loop of unpaired nucleotides typically expressed as part of larger primary
transcripts (pri-
miRNAs), which are excised by the Drosha-DGCR8 complex generating
intermediates known
as pre-miRNAs, which are subsequently exported from the nucleus by Exportin-5,
and once in
the cytoplasm, are processed by Dicer to generate functional miRNAs or siRNAs.
"Artificial miRNA" or an "artificial miRNA shuttle vector", as used herein
interchangeably, refers to a primary miRNA transcript that has had a region of
the duplex stem
loop (at least about 9-20 nucleotides) which is excised via Drosha and Dicer
processing replaced
with the siRNA sequences for the target gene while retaining the structural
elements within the
stem loop necessary for effective Drosha processing. The term "artificial"
arises from the fact
the flanking sequences (e.g., about 35 nucleotides upstream and about 40
nucleotides
downstream) arise from restriction enzyme sites within the multiple cloning
site of the RNAi. As
used herein the term "miRNA" encompasses both the naturally occurring miRNA
sequences as
well as artificially generated miRNA shuttle vectors.
17
CA 03083183 2020-05-21
WO 2019/103967
PCT/US2018/061802
The RNAi can be encoded by a nucleic acid sequence, and the nucleic acid
sequence can
also include a promoter (e.g., testes specific promoter; See e.g., Wang et
al., DNA Cell Biol.
2008 Jun;27(6):307-14.; herein incorporate by reference in its entirety). The
nucleic acid
sequence can also include a polyadenylation signal. In some embodiments, the
polyadenylation
signal is a synthetic minimal polyad n certain embodiments, provided herein
are compounds
comprising a modified oligonucleotide consisting of 12 to 30 linked
nucleosides and comprising
a nucleobase sequence comprising a portion of at least 8, at least 10, at
least 12, at least 14, at
least 15, at least 16, at least 17, at least 18, at least 19, or at least 20
contiguous nucleobases
complementary to an equal length portion of THOR.
In some embodiments, hybridization occurs between an antisense compound
disclosed
herein and an THOR nucleic acid. The most common mechanism of hybridization
involves
hydrogen bonding (e.g., Watson-Crick, Hoogsteen or reversed Hoogsteen hydrogen
bonding)
between complementary nucleobases of the nucleic acid molecules.
Hybridization can occur under varying conditions. Stringent conditions are
sequence-dependent
and are determined by the nature and composition of the nucleic acid molecules
to be
hybridized.
An antisense compound and a target nucleic acid are complementary to each
other when
a sufficient number of nucleobases of the antisense compound can hydrogen bond
with the
corresponding nucleobases of the target nucleic acid, such that a desired
effect will occur (e.g.,
antisense inhibition of a target nucleic acid, such as an THOR nucleic acid).
Non-complementary nucleobases between an antisense compound and an THOR
nucleic acid
may be tolerated provided that the antisense compound remains able to
specifically hybridize to
a target nucleic acid. Moreover, an antisense compound may hybridize over one
or more
segments of an THOR nucleic acid such that intervening or adjacent segments
are not involved
in the hybridization event (e.g., a loop structure, mismatch or hairpin
structure).
In certain embodiments, the antisense compounds provided herein, or a
specified portion
thereof, are, or are at least, 70%, 80%, 85%, 86%, 87%, 88%, 89%, 90%, 91%,
92%, 93%, 94%,
95%, 96%, 97%, 98%, 99%, or 100% complementary to an THOR nucleic acid, a
target region,
target segment, or specified portion thereof Percent complementarily of an
antisense compound
with a target nucleic acid can be determined using routine methods.
For example, an antisense compound in which 18 of 20 nucleobases of the
antisense
compound are complementary to a target region, and would therefore
specifically hybridize,
would represent 90 percent complementarity. In this example, the remaining
noncomplementary
nucleobases may be clustered or interspersed with complementary nucleobases
and need not be
18
CA 03083183 2020-05-21
WO 2019/103967 PCT/US2018/061802
contiguous to each other or to complementary nucleobases. As such, an
antisense compound
which is 18 nucleobases in length having 4 (four) noncomplementary nucleobases
which are
flanked by two regions of complete complementarity with the target nucleic
acid would have
77.8% overall complementarity with the target nucleic acid and would thus fall
within the scope
of the present invention. Percent complementarity of an antisense compound
with a region of a
target nucleic acid can be determined routinely using BLAST programs (basic
local alignment
search tools) and PowerBLAST programs known in the art (Altschul et al., J.
Mol. Biol., 1990,
215, 403 410; Zhang and Madden, Genome Res., 1997, 7, 649 656). Percent
homology,
sequence identity or complementarity, can be determined by, for example, the
Gap program
(Wisconsin Sequence Analysis Package, Version 8 for Unix, Genetics Computer
Group,
University Research Park, Madison Wis.), using default settings, which uses
the algorithm of
Smith and Waterman (Adv. Appl. Math., 1981, 2, 482 489).
In certain embodiments, the antisense compounds provided herein, or specified
portions
thereof, are fully complementary (i.e., 100% complementary) to a target
nucleic acid, or
specified portion thereof For example, an antisense compound may be fully
complementary to a
THOR nucleic acid, or a target region, or a target segment or target sequence
thereof As used
herein, "fully complementary" means each nucleobase of an antisense compound
is capable of
precise base pairing with the corresponding nucleobases of a target nucleic
acid. For example, a
nucleobase antisense compound is fully complementary to a target sequence that
is 400
20 nucleobases long, so long as there is a corresponding 20 nucleobase
portion of the target nucleic
acid that is fully complementary to the antisense compound. Fully
complementary can also be
used in reference to a specified portion of the first and/or the second
nucleic acid. For example, a
20 nucleobase portion of a 30 nucleobase antisense compound can be "fully
complementary" to
a target sequence that is 400 nucleobases long. The 20 nucleobase portion of
the 30 nucleobase
oligonucleotide is fully complementary to the target sequence if the target
sequence has a
corresponding 20 nucleobase portion wherein each nucleobase is complementary
to the 20
nucleobase portion of the antisense compound. At the same time, the entire 30
nucleobase
antisense compound may or may not be fully complementary to the target
sequence, depending
on whether the remaining 10 nucleobases of the antisense compound are also
complementary to
the target sequence.
The location of a non-complementary nucleobase may be at the Send or 3' end of
the
antisense compound. Alternatively, the non-complementary nucleobase or
nucleobases may be
at an internal position of the antisense compound. When two or more non-
complementary
nucleobases are present, they may be contiguous (i.e., linked) or non-
contiguous. In one
19
CA 03083183 2020-05-21
WO 2019/103967 PCT/US2018/061802
embodiment, a non-complementary nucleobase is located in the wing segment of a
gapmer
antisense oligonucleotide.
In certain embodiments, antisense compounds that are, or are up to 12, 13, 14,
15, 16, 17,
18, 19, or 20 nucleobases in length comprise no more than 4, no more than 3,
no more than 2, or
no more than 1 non-complementary nucleobase(s) relative to a target nucleic
acid, such as an
THOR nucleic acid, or specified portion thereof
In certain embodiments, antisense compounds that are, or are up to 12, 13, 14,
15, 16, 17,
18, 19, 20, 21, 22, 23, 24, 25, 26, 27, 28, 29, or 30 nucleobases in length
comprise no more than
6, no more than 5, no more than 4, no more than 3, no more than 2, or no more
than 1 non-
complementary nucleobase(s) relative to a target nucleic acid, such as an THOR
nucleic acid, or
specified portion thereof
The antisense compounds provided herein also include those which are
complementary
to a portion of a target nucleic acid. As used herein, "portion" refers to a
defined number of
contiguous (i.e. linked) nucleobases within a region or segment of a target
nucleic acid. A
"portion" can also refer to a defined number of contiguous nucleobases of an
antisense
compound. In certain embodiments, the antisense compounds, are complementary
to at least an
8 nucleobase portion of a target segment. In certain embodiments, the
antisense compounds are
complementary to at least a 12 nucleobase portion of a target segment. In
certain embodiments,
the antisense compounds are complementary to at least a 15 nucleobase portion
of a target
segment. In certain embodiments, the antisense compounds are complementary to
at least an 18
nucleobase portion of a target segment. Also contemplated are antisense
compounds that are
complementary to at least a 9, 10, 11, 12, 13, 14, 15, 16, 17, 18, 19, 20, or
more nucleobase
portion of a target segment, or a range defined by any two of these values.
b) Genetic therapies
The present disclosure contemplates the use of any genetic manipulation for
use in
modulating the expression of THOR. Examples of genetic manipulation include,
but are not
limited to, gene knockout (e.g., removing the THOR gene from the chromosome
using, for
example, recombination), expression of antisense constructs with or without
inducible
promoters, and the like. Delivery of nucleic acid construct to cells in vitro
or in vivo may be
conducted using any suitable method. A suitable method is one that introduces
the nucleic acid
construct into the cell such that the desired event occurs (e.g., expression
of an antisense
construct).
CA 03083183 2020-05-21
WO 2019/103967 PCT/US2018/061802
Introduction of molecules carrying genetic information into cells is achieved
by any of
various methods including, but not limited to, directed injection of naked DNA
constructs,
bombardment with gold particles loaded with said constructs, and macromolecule
mediated gene
transfer using, for example, liposomes, biopolymers, and the like. Exemplary
methods use gene
delivery vehicles derived from viruses, including, but not limited to,
adenoviruses, retroviruses,
vaccinia viruses, and adeno-associated viruses. Because of the higher
efficiency as compared to
retroviruses, vectors derived from adenoviruses are the preferred gene
delivery vehicles for
transferring nucleic acid molecules into host cells in vivo. Adenoviral
vectors have been shown
to provide very efficient in vivo gene transfer into a variety of solid tumors
in animal models and
into human solid tumor xenografts in immune-deficient mice. Examples of
adenoviral vectors
and methods for gene transfer are described in PCT publications WO 00/12738
and WO
00/09675 and U.S. Pat. Appl. Nos. 6,033,908, 6,019,978, 6,001,557, 5,994,132,
5,994,128,
5,994,106, 5,981,225, 5,885,808, 5,872,154, 5,830,730, and 5,824,544, each of
which is herein
incorporated by reference in its entirety.
Vectors may be administered to subject in a variety of ways. For example, in
some
embodiments of the present disclosure, vectors are administered into tumors or
tissue associated
with tumors using direct injection. In other embodiments, administration is
via the blood or
lymphatic circulation (See e.g., PCT publication 1999/02685 herein
incorporated by reference in
its entirety). Exemplary dose levels of adenoviral vector are preferably 108
to 1011 vector
particles added to the perfusate.
In some embodiments, CRISPR/Cas9 systems are used to delete or knock out genes
or
express an inhibitor (e.g., nucleic acid). Clustered regularly interspaced
short palindromic
repeats (CRISPR) are segments of prokaryotic DNA containing short, repetitive
base sequences.
These play a key role in a bacterial defence system, and form the basis of a
genome editing
technology known as CRISPR/Cas9 that allows permanent modification of genes
within
organisms.
In some embodiments, candidate THOR inhibitors are screened for activity
(e.g., using the
methods described herein or another suitable assay).
c) Compositions
The present disclosure further provides pharmaceutical compositions (e.g.,
comprising
the compounds described above). The pharmaceutical compositions of the present
disclosure
may be administered in a number of ways depending upon whether local or
systemic treatment
is desired and upon the area to be treated. Administration may be topical
(including ophthalmic
21
CA 03083183 2020-05-21
WO 2019/103967 PCT/US2018/061802
and to mucous membranes including vaginal and rectal delivery), pulmonary
(e.g., by inhalation
or insufflation of powders or aerosols, including by nebulizer; intratracheal,
intranasal,
epidermal and transdermal), oral or parenteral. Parenteral administration
includes intravenous,
intraarterial, subcutaneous, intraperitoneal or intramuscular injection or
infusion; or intracranial,
e.g., intrathecal or intraventricular, administration.
Compositions and formulations for oral administration include powders or
granules,
suspensions or solutions in water or non-aqueous media, capsules, sachets or
tablets.
Thickeners, flavoring agents, diluents, emulsifiers, dispersing aids or
binders may be desirable.
Compositions and formulations for parenteral, intrathecal or intraventricular
administration may include sterile aqueous solutions that may also contain
buffers, diluents and
other suitable additives such as, but not limited to, penetration enhancers,
carrier compounds and
other pharmaceutically acceptable carriers or excipients.
Pharmaceutical compositions of the present disclosure include, but are not
limited to, solutions,
emulsions, and liposome-containing formulations. These compositions may be
generated from a
variety of components that include, but are not limited to, preformed liquids,
self-emulsifying
solids and self-emulsifying semisolids.
The pharmaceutical formulations of the present disclosure, which may
conveniently be
presented in unit dosage form, may be prepared according to conventional
techniques well
known in the pharmaceutical industry. Such techniques include the step of
bringing into
association the active ingredients with the pharmaceutical carrier(s) or
excipient(s). In general
the formulations are prepared by uniformly and intimately bringing into
association the active
ingredients with liquid carriers or finely divided solid carriers or both, and
then, if necessary,
shaping the product.
The compositions of the present disclosure may be formulated into any of many
possible
dosage forms such as, but not limited to, tablets, capsules, liquid syrups,
soft gels, suppositories,
and enemas. The compositions of the present disclosure may also be formulated
as suspensions
in aqueous, non-aqueous or mixed media. Aqueous suspensions may further
contain substances
that increase the viscosity of the suspension including, for example, sodium
carboxymethylcellulose, sorbitol and/or dextran. The suspension may also
contain stabilizers.
Agents that enhance uptake of oligonucleotides at the cellular level may also
be added to the
pharmaceutical and other compositions of the present disclosure. For example,
cationic lipids,
such as lipofectin (U.S. Pat. No. 5,705,188), cationic glycerol derivatives,
and polycationic
molecules, such as polylysine (WO 97/30731), also enhance the cellular uptake
of
oligonucleotides.
22
CA 03083183 2020-05-21
WO 2019/103967 PCT/US2018/061802
The compositions of the present disclosure may additionally contain other
adjunct
components conventionally found in pharmaceutical compositions. Thus, for
example, the
compositions may contain additional, compatible, pharmaceutically-active
materials such as, for
example, antipruritics, astringents, local anesthetics or anti-inflammatory
agents, or may contain
additional materials useful in physically formulating various dosage forms of
the compositions
of the present disclosure, such as dyes, flavoring agents, preservatives,
antioxidants, opacifiers,
thickening agents and stabilizers. However, such materials, when added, should
not unduly
interfere with the biological activities of the components of the compositions
of the present
disclosure. The formulations can be sterilized and, if desired, mixed with
auxiliary agents, e.g.,
lubricants, preservatives, stabilizers, wetting agents, emulsifiers, salts for
influencing osmotic
pressure, buffers, colorings, flavorings and/or aromatic substances and the
like which do not
deleteriously interact with the nucleic acid(s) of the formulation.
Dosing is dependent on severity and responsiveness of the disease state to be
treated,
with the course of treatment lasting from several days to several months, or
until a cure is
effected or a diminution of the disease state is achieved. Optimal dosing
schedules can be
calculated from measurements of drug accumulation in the body of the patient.
The
administering physician can easily determine optimum dosages, dosing
methodologies and
repetition rates. Optimum dosages may vary depending on the relative potency
of individual
oligonucleotides, and can generally be estimated based on EC50s found to be
effective in in
vitro and in vivo animal models or based on the examples described herein. In
general, dosage is
from 0.01 lig to 100 g per kg of body weight, and may be given once or more
daily, weekly,
monthly or yearly. The treating physician can estimate repetition rates for
dosing based on
measured residence times and concentrations of the drug in bodily fluids or
tissues. Following
successful treatment, it may be desirable to have the subject undergo
maintenance therapy to
prevent the recurrence of the disease state, wherein the oligonucleotide is
administered in
maintenance doses, ranging from 0.01 pg to 100 g per kg of body weight, once
or more daily, to
once every 20 years.
Methods of treating cancer
Provided herein are methods of treating cancer (e.g., melanoma or lung
cancer). In some
embodiments, a sample of tumor or cancerous tissue from the subject is first
tested for
expression of THOR. In some embodiments, treatment is administered to
individuals with
expression of THOR and/or individuals with levels of expression of THOR
greater than the
23
CA 03083183 2020-05-21
WO 2019/103967 PCT/US2018/061802
levels in non-cancerous tissue. In some embodiments, samples of tumor or
cancer tissue are
tested during treatment in order to determine whether or not to continue
treatment.
In some embodiments, samples are screened for the presence of THOR nucleic
acids using any
suitable method (e.g., including but not limited to, those described below).
In some embodiments, the compounds and pharmaceutical compositions described
herein are administered in combination with one or more additional agents,
treatment, or
interventions (e.g., agents, treatments, or interventions useful in the
treatment of cancer).
In some embodiments, THOR inhibitors are co-administered with an anti-cancer
agent (e.g.,
chemotherapeutic). The present disclosure is not limited by type of anti-
cancer agent co-
administered.
III. Detection of THOR
The presence or level of THOR is detected using any suitable method, including
but not
limited to, those described herein.
In some embodiments, RNA is detection by Northern blot analysis. Northern blot
analysis
involves the separation of RNA and hybridization of a complementary labeled
probe.
In some embodiments, RNA (or corresponding cDNA) is detected by hybridization
to a
oligonucleotide probe). A variety of hybridization assays using a variety of
technologies for
hybridization and detection are available. For example, in some embodiments,
TaqMan assay
(PE Biosystems, Foster City, CA; See e.g., U.S. Patent Nos. 5,962,233 and
5,538,848, each of
which is herein incorporated by reference) is utilized. The assay is performed
during a PCR
reaction. The TaqMan assay exploits the 5'-3' exonuclease activity of the
AMPLITAQ GOLD
DNA polymerase. A probe consisting of an oligonucleotide with a 51-reporter
dye (e.g., a
fluorescent dye) and a 3'-quencher dye is included in the PCR reaction. During
PCR, if the
probe is bound to its target, the 5'-3' nucleolytic activity of the AMPLITAQ
GOLD polymerase
cleaves the probe between the reporter and the quencher dye. The separation of
the reporter dye
from the quencher dye results in an increase of fluorescence. The signal
accumulates with each
cycle of PCR and can be monitored with a fluorimeter.
In some embodiments, microarrays including, but not limited to: DNA
microarrays (e.g., cDNA
microarrays and oligonucleotide microarrays); protein microarrays; tissue
microarrays;
transfection or cell microarrays; chemical compound microarrays; and, antibody
microarrays are
utilized for measuring cancer marker mRNA levels. A DNA microarray, commonly
known as
gene chip, DNA chip, or biochip, is a collection of microscopic DNA spots
attached to a solid
surface (e.g., glass, plastic or silicon chip) forming an array for the
purpose of expression
24
CA 03083183 2020-05-21
WO 2019/103967 PCT/US2018/061802
profiling or monitoring expression levels for thousands of genes
simultaneously. The affixed
DNA segments are known as probes, thousands of which can be used in a single
DNA
microarray. Microarrays can be used to identify disease genes by comparing
gene expression in
disease and normal cells. Microarrays can be fabricated using a variety of
technologies,
including but not limited to: printing with fine-pointed pins onto glass
slides; photolithography
using pre-made masks; photolithography using dynamic micromirror devices; ink-
jet printing;
or, electrochemistry on microelectrode arrays.
In yet other embodiments, reverse-transcriptase PCR (RT-PCR) is used to detect
the
expression of RNA. In RT-PCR, RNA is enzymatically converted to complementary
DNA or
"cDNA" using a reverse transcriptase enzyme. The cDNA is then used as a
template for a PCR
reaction. PCR products can be detected by any suitable method, including but
not limited to, gel
electrophoresis and staining with a DNA specific stain or hybridization to a
labeled probe. In
some embodiments, the quantitative reverse transcriptase PCR with standardized
mixtures of
competitive templates method described in U.S. Patents 5,639,606, 5,643,765,
and 5,876,978
(each of which is herein incorporated by reference) is utilized.
In some embodiments, the cancer markers are detected by hybridization with a
detectably
labeled probe and measurement of the resulting hybrids. Illustrative non-
limiting examples of
detection methods are described below.
One illustrative detection method, the Hybridization Protection Assay (HPA)
involves
hybridizing a chemiluminescent oligonucleotide probe (e.g., an acridinium
ester-labeled (AE)
probe) to the target sequence, selectively hydrolyzing the chemiluminescent
label present on
unhybridized probe, and measuring the chemiluminescence produced from the
remaining probe
in a luminometer. See, e.g., U.S. Pat. No. 5,283,174; Nelson et al.,
Nonisotopic Probing,
Blotting, and Sequencing, ch. 17 (Larry J. Kricka ed., 2d ed. 1995, each of
which is herein
incorporated by reference in its entirety).
The interaction between two molecules can also be detected, e.g., using
fluorescence energy
transfer (FRET) (see, for example, Lakowicz etal., U.S. Pat. No. 5,631,169;
Stavrianopoulos et
al., U.S. Pat. No. 4,968,103; each of which is herein incorporated by
reference). A fluorophore
label is selected such that a first donor molecule's emitted fluorescent
energy will be absorbed by
a fluorescent label on a second, 'acceptor' molecule, which in turn is able to
fluoresce due to the
absorbed energy.
Alternately, the 'donor' protein molecule may simply utilize the natural
fluorescent
energy of tryptophan residues. Labels are chosen that emit different
wavelengths of light, such
that the 'acceptor' molecule label may be differentiated from that of the
'donor'. Since the
CA 03083183 2020-05-21
WO 2019/103967 PCT/US2018/061802
efficiency of energy transfer between the labels is related to the distance
separating the
molecules, the spatial relationship between the molecules can be assessed. In
a situation in
which binding occurs between the molecules, the fluorescent emission of the
'acceptor' molecule
label should be maximal. A FRET binding event can be conveniently measured
through
fluorometric detection means.
Another example of a detection probe having self-complementarity is a
"molecular
beacon." Molecular beacons include nucleic acid molecules having a target
complementary
sequence, an affinity pair (or nucleic acid arms) holding the probe in a
closed conformation in
the absence of a target sequence present in an amplification reaction, and a
label pair that
interacts when the probe is in a closed conformation. Hybridization of the
target sequence and
the target complementary sequence separates the members of the affinity pair,
thereby shifting
the probe to an open conformation. The shift to the open conformation is
detectable due to
reduced interaction of the label pair, which may be, for example, a
fluorophore and a quencher
(e.g., DABCYL and EDANS). Molecular beacons are disclosed, for example, in
U.S. Pat. Nos.
5,925,517 and 6,150,097, herein incorporated by reference in its entirety.
By way of non-limiting example, probe binding pairs having interacting labels,
such as those
disclosed in U.S. Pat. No. 5,928,862 (herein incorporated by reference in its
entirety) might be
adapted for use in meothd of embodiments of the present disclsoure. Probe
systems used to
detect single nucleotide polymorphisms (SNPs) might also be utilized in the
present invention.
Additional detection systems include "molecular switches," as disclosed in
U.S. Publ. No.
20050042638, herein incorporated by reference in its entirety. Other probes,
such as those
comprising intercalating dyes and/or fluorochromes, are also useful for
detection of
amplification products methods of embodiments of the present disclosure. See,
e.g., U.S. Pat.
No. 5,814,447 (herein incorporated by reference in its entirety).
In some embodiments, nucleic acid sequencing methods are utilized for
detection. In
some embodiments, the sequencing is Second Generation (a.k.a. Next Generation
or Next-Gen),
Third Generation (a.k.a. Next-Next-Gen), or Fourth Generation (a.k.a. N3-Gen)
sequencing
technology including, but not limited to, pyrosequencing, sequencing-by-
ligation, single
molecule sequencing, sequence-by-synthesis (SBS), semiconductor sequencing,
massive parallel
clonal, massive parallel single molecule SBS, massive parallel single molecule
real-time,
massive parallel single molecule real-time nanopore technology, etc. Morozova
and Marra
provide a review of some such technologies in Genomics, 92: 255 (2008), herein
incorporated
by reference in its entirety. Those of ordinary skill in the art will
recognize that because RNA is
26
CA 03083183 2020-05-21
WO 2019/103967 PCT/US2018/061802
less stable in the cell and more prone to nuclease attack experimentally RNA
is usually reverse
transcribed to DNA before sequencing.
DNA sequencing techniques include fluorescence-based sequencing methodologies
(See, e.g.,
Birren et al., Genome Analysis: Analyzing DNA, 1, Cold Spring Harbor, N.Y.;
herein
incorporated by reference in its entirety). In some embodiments, the
sequencing is automated
sequencing. In some embodiments, the sequenceing is parallel sequencing of
partitioned
amplicons (PCT Publication No: W02006084132 to Kevin McKernan et al., herein
incorporated
by reference in its entirety). In some embodiments, the sequencing is DNA
sequencing by
parallel oligonucleotide extension (See, e.g., U.S. Pat. No. 5,750,341 to
Macevicz et al., and
U.S. Pat. No. 6,306,597 to Macevicz et al., both of which are herein
incorporated by reference in
their entireties). Additional examples of sequencing techniques include the
Church polony
technology (Mitra et al., 2003, Analytical Biochemistry 320, 55-65; Shendure
et al., 2005
Science 309, 1728-1732; U.S. Pat. No. 6,432,360, U.S. Pat. No. 6,485,944, U.S.
Pat. No.
6,511,803; herein incorporated by reference in their entireties), the 454
picotiter pyrosequencing
technology (Margulies et al., 2005 Nature 437, 376-380; US 20050130173; herein
incorporated
by reference in their entireties), the Solexa single base addition technology
(Bennett et al., 2005,
Pharmacogenomics, 6, 373-382; U.S. Pat. No. 6,787,308; U.S. Pat. No.
6,833,246; herein
incorporated by reference in their entireties), the Lynx massively parallel
signature sequencing
technology (Brenner et al. (2000). Nat. Biotechnol. 18:630-634; U.S. Pat. No.
5,695,934; U.S.
Pat. No. 5,714,330; herein incorporated by reference in their entireties), and
the Adessi PCR
colony technology (Adessi et al. (2000). Nucleic Acid Res. 28, E87; WO
00018957; herein
incorporated by reference in its entirety).
Next-generation sequencing (NGS) methods share the common feature of massively
parallel, high-throughput strategies, with the goal of lower costs in
comparison to older
sequencing methods (see, e.g., Voelkerding etal., Clinical Chem., 55: 641-658,
2009; MacLean
et al., Nature Rev. Microbiol., 7: 287-296; each herein incorporated by
reference in their
entirety). NGS methods can be broadly divided into those that typically use
template
amplification and those that do not. Amplification-requiring methods include
pyrosequencing
commercialized by Roche as the 454 technology platforms (e.g., GS 20 and GS
FLX), Life
Technologies/Ion Torrent, the Solexa platform commercialized by Illumina,
GnuBio, and the
Supported Oligonucleotide Ligation and Detection (SOLiD) platform
commercialized by
Applied Biosystems. Non-amplification approaches, also known as single-
molecule sequencing,
are exemplified by the HeliScope platform commercialized by Helicos
BioSciences, and
27
CA 03083183 2020-05-21
WO 2019/103967 PCT/US2018/061802
emerging platforms commercialized by VisiGen, Oxford Nanopore Technologies
Ltd., and
Pacific Biosciences, respectively.
EXPERIMENTAL
The following examples are provided in order to demonstrate and further
illustrate
certain preferred embodiments and aspects of the present disclosure and are
not to be construed
as limiting the scope thereof
Example 1
EXPERIMENTAL PROCEDURES
RNA-seq data processing
TCGA prostate FASTQ files were obtained from the CGhub. Reads were aligned
using
STAR version 2.4.2 (Dobin et al., Bioinformatics 29, 15-21 2013a) and read
abundance was
calculated using FeatureCounts version 1.4.6 (Liao et al., Bioinformatics 30,
923-930 2014),
providing the MiTranscriptome gene annotation GTF (mitranscriptome.org) (Iyer
et al., supra).
GTEX (accession: phs000424.v6.p1) and TCGA (accession: phs000178.v8.p7) data
were
downloaded from dbGAP.
Conservation analysis
Evolutionary conservation of transcripts was assessed via the fraction of
significantly
conserved bases (P < 0.01, phyloP algorithm), and the most conserved 200nt
sliding window
(phastCons scores averaged within each window). For contiguous sliding window
conservation
an average PhastCons probability of 0.9986 was used to identify ultraconserved
elements as
previously described (Iyer et al.,supra).
Coding potential assessment
Coding potential for THOR was assessed using the CPAT tool, PhyloCSF, and CPC
tool.
CPAT and PhyloCSF were run using the command line tools. For PhyloCSF, the
multiz
alignment for 46 vertebrate species for the sequence conservation of THOR and
MYC was
.. obtained using the conservation track from the UCSC genome browser for
GRCh38. The CPC
tool was run using their online tool (cpc.cbi.pku.edu.cn). Ribosomal profiling
data was obtained
using the GWIPS-viz genome browser (gwips.ucc.ie).
Cell lines
28
CA 03083183 2020-05-21
WO 2019/103967 PCT/US2018/061802
All cell lines were obtained from the American Type Culture Collection
(Manassas,
VA). Cell lines were maintained using standard media and conditions.
Specifically, NCI-H1299
and NCI-H1437 were maintained in RPMI 1640 (Invitrogen) plus 10% fetal bovine
serum (FBS)
and 1% penicillin-streptomycin. MM603 and SK-MEL-5 were maintained in DMEM
(Invitrogen) plus 10% FBS and 1% penicillin-streptomycin. All cell lines were
grown at 37 C in
a 5% CO2 cell culture incubator and genotyped for identity at the University
of Michigan
Sequencing Core and tested routinely for Mycoplasma contamination. THOR or
control-
expressing cell lines were generated by cloning THOR or control into the
pLenti6 vector
(Invitrogen) using pCR8 non-directional Gateway cloning (Invitrogen) as an
initial cloning
vector and shuttling to p1enti6 using LR clonase II (Invitrogen) according to
the manufacturer's
instructions. Stably-transfected NCI-H1437 and SK-MEL-5 cells were selected
using blasticidin
(Invitrogen). All lentiviruses were generated by the University of Michigan
Vector Core.
Tissue Samples
The lung cancer and paired non-tumoral lung tissues were obtained from
patients
undergoing curative cancer surgery during the period from 1991 to 2012 at the
University of
Michigan Health System. None of the patients included in this study received
any preoperative
radiation or chemotherapy. All melanoma tissues were procured from the
University of
Michigan Hospitals Cutaneous Surgery and Oncology Program with appropriate
informed
consent. Resected specimens were frozen in liquid nitrogen and then stored at
¨80 C until use.
Total RNA panels from human and mouse normal tissues were purchased from
Clontech and
Zyagen. Mouse embryos were obtained from the University of Michigan Transgenic
Core.
Zebrafish tissues and embryos were obtained from AB strain wild type
zebrafish.
RNA isolation and cDNA synthesis
Total RNA from human and mouse normal tissues were purchased from Clontech and
Zyagen. Mouse embryos were obtained from the University of Michigan Transgenic
Core.
Zebrafish tissues or embryos were obtained from AB strain wild type fish.
Nuclear and
cytoplasmic fractions were separated using NE-PER Nuclear and Cytoplasmic
Extraction
Reagents (Thermo) according to the manufacturer's instructions. Total RNA was
isolated using
miRNeasy Mini Kit (Qiagen) with DNase I (Qiagen) digestion according to the
manufacturer's
instructions. RNA integrity was verified on an Agilent Bioanalyzer 2100
(Agilent Technologies,
Palo Alto, CA). cDNAs weresynthesized from total RNA using Superscript III
(Invitrogen) and
random primers (Invitrogen).
29
CA 03083183 2020-05-21
WO 2019/103967 PCT/US2018/061802
Quantitative Real-time PCR
Quantitative Real-time PCR (qRT-PCR) was performed using Power SYBR Green
Mastermix (Applied Biosystems, Foster City, CA) on an Applied Biosystems
7900HT Real-
Time PCR System. All oligonucleotide primers were obtained from Integrated DNA
Technologies (Coralville, IA) and are listed in Table 3. The housekeeping
genes, GAPDH,
HMBS and UBC, were amplified as controls. Fold changes were calculated
relative to
housekeeping genes and normalized to the median value of the lung benign
samples.
RNA-ligase-mediated Rapid Amplification of cDNA Ends (RACE)
5' and 3' RACE was performed using the GeneRacer RLM-RACE kit (Invitrogen)
according to the manufacturer's instructions. RACE PCR products were obtained
using Platinum
Taq High Fidelity polymerase (Invitrogen), the supplied GeneRacer primers, and
appropriate
gene-specific primers indicated in Table 3. RACE-PCR products were separated
on a 2%
agarose gels, bands excised and the extracted DNA (Gel Extraction kit, Qiagen)
were cloned
into pCR4-TOPO vector (Invitrogen), and sequenced bidirectionally using M13
forward and
reverse primers at the University of Michigan Sequencing Core. At least four
colonies were
sequenced for every gel product that was purified and the data was analyzed
using Sequencher
software (GeneCodes).
siRNA Knockdown Experiments
Knockdown experiments were carried out in approximately 1 - 2 x 10⁵ cells
plated in 100
mm dishes. While THOR knockdown in MM603 cells was achieved with two
sequential
transfections (at 24 hr and 48 hr post-plating) with 50[1.M experimental siRNA
oligos or non-
targeting controls, for THOR knockdown in H1299 cells only one siRNA
transfection (24hr post
plating) was done. Only one transfection was performed for all protein coding
gene
knockdowns. Knockdowns were performed with RNAiMAX (Invitrogen) in OptiMEM
media
and its efficiency was determined by qRT-PCR 96 hr post-plating. All siRNAs
were purchased
from Dharmacon and their sequences (in sense format) are listed in Table 4.
Overexpression Studies
The THOR expression construct were generated by amplifying the full-length
transcript
from NCI-H1299 cells and subcloning into the pLenti6 expression vector
(Invitrogen), LacZ
constructs were used as controls. Following Sanger sequencing (University of
Michigan
CA 03083183 2020-05-21
WO 2019/103967 PCT/US2018/061802
Sequencing Core) confirmation of the inserts, lentiviruses were generated at
the University of
Michigan Vector Core. NCI-H1437 and 5K-MEL-5 cells were infected with
lentiviruses
expressing THOR or LacZ and stable pools and clones were generated by
blasticidin selection
(Invitrogen). The THOR deletion constructs were also generated by amplifying
by PCR using
the full-length transcript as a template and were subcloned into the pLenti6
expression vector
(Invitrogen).
Northern Blotting
Northern blotting was performed using the NorthernMax-Gly Kit (Ambion)
following
the manufacturer's protocol. Briefly, 20-30 ug of total RNA was denatured with
Glyoxal loading
dye solution for 30 minutes at 50 C, and separated on a 1% agarose glyoxal
gel. The RNA was
then transferred to Nylon Membrane (Roche) by capillary blotting with the
transfer buffer and
cross-linked with UV light (UV Stratalinker 1800). The membrane was subjected
to a
prehybridization step by incubation in Ultrahyb buffer (Ambion) at 68 C for 1
hour. The
membrane was incubated at 68 C overnight with antisense p32 labeled RNA probe
in UltraHyb
buffer. Following washing in accordance with the NorthernMax-Gly kit protocol,
the
membranes were exposed to HyBlot CL autoradiography film (Denville
Scientific). The primer
sequences used for generating the probes are given in Table 3.
Expression of recombinant protein
IGF2BP1 cDNA (NM 006546.3) was purchased from Gegecopoea. IGF2BP1 coding
region was amplified by PCR and cloned into pFN19A (HaloTag07) T7 5P6 Flexi
vector
(Promega). IGF2BP1 deletion constructs were generated by inverse PCR using
primers
described in Table 3. All clones were verified by DNA sequencing. The HaloTag
fusion proteins
were synthesized by incubating 3 pg plasmid with in vitro TNT Quick-coupled
Transcription/Translation System (Promega). Synthesized proteins were
subjected to RNA
Pulldown Assay.
Cell Proliferation Assays
Proliferation experiments were carried out by plating 1-2 x 10⁴ cells or 0.15-
0.3 x 10⁴
cells in 24-well or 96-well plates respectively and grown in regular media.
Growth rate was
monitored by IncuCyte live-cell imaging system (Essen Biosciences) for the
specified durations.
Murine Subcutaneous In Vivo Models
31
CA 03083183 2020-05-21
WO 2019/103967 PCT/US2018/061802
All experimental procedures were approved by the University of Michigan
Committee
for the Use and Care of Animals (UCUCA). Mice (CB-17 SCID) aged 5-7 weeks were
injected
with 0.25 x 10⁶ cells with a Matrigel scaffold (BD Matrigel Matrix, BD
Biosciences) in the
posterior dorsal flank region (n = 10 per cell line). Tumors were measured
weekly using a digital
caliper, and endpoint was determined as a tumor volume of 1000 mm3. Upon
reaching endpoint,
or if the animal became fatally ill, the mouse was euthanized and the primary
tumor resected.
The resected specimen was divided in two halves: one preserved in 10% buffer
formalin and the
other snap frozen.
RNA In Situ Hybridization in Testis
THOR ISH was performed on thin (approximately 4 pm thick) tissue sections
(Advanced
Cell Diagnostics, Inc., Hayward, CA), as described previously (Mehra et al.,
Neoplasia N. Y. N
16, 1121-1127 2014). Appropriate batch positive and negative controls
demonstrated expected
staining patterns. Slides were examined for THOR ISH signals in
morphologically intact cells
and scored manually by a study pathologist. Specific THOR ISH signal was
identified as brown,
punctate dots.
Single-Molecule Fluorescence in situ Hybridization in Cell Lines
smFISH was performed as described (Raj et al., Nat. Methods 5, 877-879 2008),
with
some minor modifications. Cells were grown on 8-well chambered coverglasses,
formaldehyde
fixed and permeablized overnight at 4 C using 70% ethanol. Cells were
rehydrated in a solution
containing 10% formamide and 2x SSC for 5 minutes and then treated with lOnM
FISH probes
for 16 h in 2x SSC containing 10% dextran sulfate, 2 mM vanadyl-ribonucleoside
complex,
0.02% RNAse-free BSA, 1 pg/pL E.coli tRNA and 10% formamide at 37 C. After
hybridization
the cells were washed twice for 30 minutes at 37 C using a wash buffer (10%
formamide in 2x
SSC). Cells were then mounted in solution containing 10 mM Tris/HC1 pH 7.5, 2x
SSC, 2 mM
trolox, 50 p.M protocatechiuc acid (PCA) and 50nM protocatechuate
dehydrogenase (PCD).
FISH samples were imaged in 3 dimensions using HILO illumination as described
(Pitchiaya et
al., EMBO Rep. 13, 709-715 2012). Images were processed using custom-written
macros in
ImageJ. Analysis routines comprised of 3 major steps: background subtraction,
Laplacian of
Gaussian (LoG) filtering and thresholding. Spots with intensity above set
threshold are
represented in images. All probes were obtained from Biosearch technologies
and are listed in
Table 5.
32
CA 03083183 2020-05-21
WO 2019/103967 PCT/US2018/061802
Western Blot Analysis
Western blot analysis was performed according to standard procedures using
Immobilon-
P filters (Millipore) and an Enhanced Chemiluminescence detection system (GE
Healthcare).
Details of the primary antibodies used are listed in Table 6.
RNA Immunoprecipitation (RIP) Assay
RIP assays were performed using a Millipore EZ-Magna RIP RNA-Binding Protein
Immunoprecipitation kit (Millipore, #17-701) according to the manufacturer's
instructions. RIP-
PCR was performed using total RNA as input controls and 1:150 of RIP RNA
product was used
per PCR reaction. The antibodies (3 - 5 pg of antibody per RIP reaction) used
for RIP are
described in Table 6.
RNA Pulldown Assay
RNA-pull down assays were performed using a RiboTrap Kit (MBL, RN1011/RN1012)
according to the manufacturer's instructions. Briefly, 5-bromo-UTP (BrU) was
randomly
incorporated into the THOR RNA upon transcription using THOR full-length or
deleted
fragments PCR products as templates. Next Anti-BrdU antibodies conjugated with
protein G
beads (Invitrogen), were bound to the in vitro synthesized RNA before
incubating with NCI-
H1299 cell lysates for 4 hr. Finally, the samples were washed, eluted, and
subjected to Mass
spectrometry analysis.
Mass Spectrometry
The samples were treated with SDS-PAGE loading buffer supplied with 10 mM DTT
for
5 min at 85 C. The proteins were alkylated by the addition of iodoacetamide to
the final
concentration of 15 mM. The samples were subjected to SDS-PAGE and the whole
lanes were
cut out and digested with trypsin in-gel for 2 hours. The resulting peptides
were extracted, dried
and resuspended in 0.1% formic acid with 5% acetonitrile prior to loading onto
a trap EASY-
column (Thermo Scientific) coupled to an in-house made nano HPLC column (20 cm
x 75 um)
packed with LUNA C18 media. Analysis was performed on Velos Pro mass
spectrometer
(Thermo Scientific) operated in data-dependent mode using 90-min gradients in
EASY-LC
system (Proxeon) with 95% water, 5% acetonitrile (ACN), 0.1% formic acid (FA)
(solvent A),
and 95% ACN, 5% water, 0.1% FA (solvent B) at a flow rate of 220 nl/min. The
acquisition
cycle consisted of a survey MS scan in the normal mode followed by twelve data-
dependent
MS/MS scans acquired in the rapid mode. Dynamic exclusion was used with the
following
33
CA 03083183 2020-05-21
WO 2019/103967 PCT/US2018/061802
parameters: exclusion size 500, repeat count 1, repeat duration 10 s,
exclusion time 45 s. Target
value was set at 104 for tandem MS scan. The precursor isolation window was
set at 2 m/z. The
complete analysis comprised two independent biological replicates.
MS Data Analysis
The resulting spectrum files were transformed into MGF format by MS Convert
software
and interrogated by MASCOT 2.4 search engine using human UniProt database
version 15
concatenated with reverse sequences for estimation of false discovery rate
(FDR) and with a list
of common contaminants (40729 entries in total). The search parameters were as
follows: full
tryptic search, 2 allowed missed cleavages, peptide charges +2 and +3 only, MS
tolerance 1 Da,
MS/MS tolerance 0.5 Da. Permanent post-translational modifications was:
cysteine
carbamidomethylation. Variable post-translational modifications were: protein
N-terminal
acetylation, Met oxidation and N-terminal Glutamine to pyro-Glutamate
conversion. The
remaining analysis was performed as previously described (Poliakov et al.,
Mol. Cell.
Proteomics MCP 10, M110.007039 2011). To summarize, the minimal ion score
threshold was
chosen such that a peptide false discovery rate (FDR) below 1% was achieved.
The peptide FDR
was calculated as: 2 x (decoy hits)/(target + decoy hits). Spectral counts for
all detected proteins
were assembled using an in-house written Python script. The adjustment of
spectral counts was
done by the same script as in (Poliakov et al., Mol. Cell. Proteomics MCP 10,
M110.007039
2011).
RNA-protein Interaction Assay
The in vitro transcribed BrU labeled RNA were heated at 92 C for 2 min (to
remove
secondary structure), and incubated with recombinant myc-tagged proteins in
RIP buffer (150
mM KC1, 25 mM Tris pH 7.4, 0.5 mM DTT, 0.5% NP40, 1 mM PMSF and protease
inhibitor
(Roche Complete Protease Inhibitor Cocktail Tablets) for 3 hr at 4 C.
RNA¨protein complexes
of interest were then partially purified with anti-myc magnetic beads (Thermo)
and the products
were treated with proteinase K, to remove the protein components leaving the
RNAs intact. The
recovered RNAs were extracted using miRNeasy Mini Kit as described above.
RNA Endogenous Degradation Assay
Cells were treated with 5 pg/ml Actinomycin D (Sigma) and collected in Quiazol
at the
indicated time points after treatment. Purified RNA was subjected cDNA
synthesis and qRT-
PCR as described above. The slopes for decay plots were determined by simple
linear
34
CA 03083183 2020-05-21
WO 2019/103967 PCT/US2018/061802
regression, and transcript half-life was calculated as the x intercept at y =
0.5, using GraphPad
Prism.
Anchorage-independent soft agar colony formation Assay
For H1437 and H1299 soft-agar colony formation assay, 1-3x10³ cells were
suspended in
DMEM containing 0.3 % agar, 10 % fetal bovine serum, and layered on DMEM
containing
0.6% agar, 10% FBS in 6-well plate. After 2 weeks incubation, colonies were
stained with
iodonitrotetrozolium chloride (Sigma) for overnight. Visible colonies were
enumerated from two
replicate wells.
In Vivo Xenograft Experiments
Male mice (CB17SCID) aged 5-7 weeks were injected with 0.25 x 10⁶ NCI-H1437
LacZ
or THOR over-expressing (THOR-OE) cells with a Matrigel scaffold (BD Matrigel
Matrix, BD
Biosciences) in the posterior dorsal flank region (n = 10 per cell line). For
THOR CRISPR
knockout experiment, 1 x 10⁶ vector control or THOR knockout H1299 cells were
injected in
the dorsal flank region of CB17SCID mice (n = 10 per cell line). For the
melanoma xenograft
experiment, 1 X 10⁶ LacZ or THOR overexpressing SKMEL5 were injected
subcutaneously into
CB17SCID mice (n=10 per cell line). In all murine xenograft experiments, tumor
measurement
was taken twice weekly using a digital caliper.
RNA-seq Data Processing
RNA-sequencing reads were quantified to the human transcriptome (GENCODEv24)
using Kallisto (v0.43.0) (Bray et al., Nat Biotech 34, 525-527 2016).
GENCODEv24 GTF was
obtained from GENCODE (Harrow et al., Genome Res. 22, 1760-1774 2012), and
transcriptome fasta file was produced using the rsem-prepare-reference
function of RSEM
(version 1.2.26) (Li and Dewey, BMC Bioinformatics 12, 323 2011). Kallisto
index was
generated using the kallisto index function. Transcript level quantification
obtained using the
kallisto quant function. Gene level expression obtained by summing the TPM
values for all
transcripts within each gene.
RNA-Seq Differential Expression Testing
Differentially expressed genes were obtained by comparing non-targeting shRNA
control
to each of the two replicates for the three genes tested (i.e., THOR, IGF2BP
1, and HUR) using
DESeq2 (Anders and Huber, Genome Biol. 11, R106 2010). Significantly
differentially
CA 03083183 2020-05-21
WO 2019/103967 PCT/US2018/061802
expressed genes were defined as genes with a greater than 2^0.75 log-fold-
change with a q-
value < 0.05.
Gene signature GSEA analysis
For each gene a rank list was generated by ordering each gene in the
differential
expression analysis by the DESeq log-fold-change value (log2foldchange) by the
q-value (padj).
These rank lists were used in a weighted, pre-ranked GSEA analysis against
MSigDBv5.
Significant associations were determined for any gene set having an FWER p-
value below 0.01.
iCLIP
iCLIP was performed as previously described. Briefly, H1437-LacZ and H1437-
THOR
cells were cross-linked with UV light (UV Stratalinker 1800). After cell
lysis, RNA was
partially digested using RNase I (Life Technologies, AM2295), and IGF2BP1-RNA
complexes
were immunoprecipitated with anti-IGF2BP1 antibody (MBL International
Corporation)
immobilized on protein A¨coated magnetic beads (Invitrogen). After 3' end
dephosphorylation
by T4 PNK (NEB, M0201L), RNAs were ligated at their 3' ends to a 3'
Preadenylated RNA
adaptor, radioactively labeled by p32-y, and run in MOPS-based protein gel
electrophoresis.
After transferring to a nitrocellulose membrane, protein-RNA complexes 15-80
kDa above free
protein were cut from the membrane. The SDS based RNA recovery platform was
used as
described previously. Reverse transcription primers containing a 6-nt
experiment-specific
barcode within an 8-nt random barcode at their 5' end to mark individual cDNA
molecules were
used. cDNA were size purified in TBE gel, circularized by CircLigase II
(Cambio, CL9025K),
annealed to an oligonucleotide complementary to the cleaved site and cut using
BamHI (New
England Biolabs Inc.). Linearized cDNAs were then PCR-amplified using
AccuPrine SuperMix
I (Invitrogen, 12342-010) and subjected to high throughput sequencing using
Illumina HiSeq.
iCLIP data analysis
PCR duplicates were initially removed by collapsing identical reads. The iCLIP
reads
contained 8 random bases before the barcode, serving to distinguish reads
arising from PCR
amplification from reads arising from multiple RNA species. iCLIP eeads were
first filtered for
sequencing quality using the fastq quality filter tool in the FASTX-Toolkit
(hannonlab.cshl.edu/fastx toolkit) with the "-Q33 25" and "-p 80" flags. The
fastx collapser
tool was used to collapse duplicate reads with the "-Q33" flag. Barcodes were
trimmed from
36
CA 03083183 2020-05-21
WO 2019/103967 PCT/US2018/061802
reads using the fastx clipper tool, and random bases were trimmed using the
fastx trimmer tool
also from the FASTX-Toolkit package.
Trimmed and deduplicated reads were then mapped to the GRCh38 genome using
STAR
(Dobin et al., 2013b; supra) using the "EndToEnd" option for the
"¨alignEndsType" flag, and
"0.08" for the "¨outFilterMismatchNoverLmax" flag. RT-stops were identified as
the 5' base in
aligned reads, and a custom BED file was created for a window of 15 bases up
and downstream
of the RT stop. These 30BP windows surrounding the RT-stops were then used to
identify peaks
using Piranha with the following commands: "-b 30¨s ¨p 0.01". Genes were
identified as
having IGF2BP1 binding if they were identified to have an exonic Piranha peak
for both iCLIP
replicates from the H1437 cells overexpressing THOR.
Embryo GFP sorting
48 hpf embryos were harvested and dechlorinated with Pronase (2 mg/ml) in E2
medium
(15 mM NaCl, 0.5 mM KCL, 2.7 mM CaCl2, 1 mM MgSO4, 0.7 mM NaHCO3, 0.15 mM
KH2PO4, 0.05 mM Na2HPO4). After deyolking by pipetting with 200 ul tip in 1/2
Ginsberg
Fish Ringer without Calucium (55 mM NaCl, 1.8 mM KCL, 1.25 mM NaHCO3), embryos
were
re-suspended in the Protease Medium (0.25 Tripsin, 1mM EDTA in PBS pH=8.0) and
incubated for 40 min at 28 C with homogenizing with 200 ul tip every 10 min.
After adding 100
ul FBS to stop reaction, cells were centrifuged for 3 min at 3,000 rpm, washed
by Suspension
Medium (08 mM CaCl2, 1 % FBS in Leibovitz medium L-15 (GIBCO, 21083-027))
once, and
filtered through strainer (352235, Falcon). GFP positive cells were sorted and
collected in
Quiazol followed by RNA extraction. Cell sorting and data analysis were
performed by
University of Michigan Flow Cytometry Core using MoFlo Astrios cell sorter
(Beckman
Coulter).
Cas9 Target Site Design, Vector Construction and in vitro RNA Synthesis
The plasmids MLM3613 bacterial Cas9 expression vector ((Addgene plasmid #
42251),
(Mali et al., Science 339, 823-826 2013)) and DR274 sgRNA expression vector
((Addgene
plasmid # 42251), (Mali et al., 2013; supra)) were purchased from Addgene
(Cambridge, MA).
Two sgRNA targets with ZIFIT Targeter
(zifit.partners.org/zifit/Introduction.aspx) were selected
to generate a deletion of the conserved portion of THOR in zebrafish. For each
target, the
oligonucleotide pairs were annealed and ligated into Bsa I-linearized DR274.
sgRNAs were
transcribed from Dra I-linearized templates using the MEGAscript0 T7 Kit
(Ambion). Cas9
mRNA was transcribed in vitro with the mMESSAGE mMACHINE T7 ULTRA kit
(Ambion).
37
CA 03083183 2020-05-21
WO 2019/103967 PCT/US2018/061802
RNAs were purified by RNA Clean &Amp; Concentrator (Zymo Research) and re-
dissolved in
RNase-free water.
Generation of THOR knockout cell line
The plasmids pSpCas9(BB)-2A-GFP (PX458) (Addgene plasmid # 48138) (Cong et
al.,
2013; supra) was purchased from Addgene (Cambridge, MA). Two sgRNA targets
were
selected with CRISPR Design (crispr.mit. edu) to generate a deletion of the
conserved portion of
human THOR. For each target, the oligonucleotide pairs were annealed and
ligated into BbsI-
linearized PX458 plasmid. Cells were transfected with two vectors using
Lipofectamine 3000
(Life Technologies) according to the manufacturer's instructions. 48 hours
post-transfection,
mosaic cells were genotyped and subjected to further experiments. To obtain
monoclonal clones,
GFP-positive cells were FACS sorted as a single cell into 96-well plate. After
culturing for 3
weeks, cells are distributed into two 24 well plates followed by PCR-based
genotyping. A clone
showing deletion of the targeted region in THOR was used for further analysis.
Single-cell
sorted cells obtained after transfection of the empty PX458 construct was used
as a negative
control. Cell sorting and data analysis were performed by University of
Michigan Flow
Cytometry Core using MoFlo Astrios cell sorter (Beckman Coulter).
Microinjection of Zebrafish Embryos
One-cell stage embryos were microinjected with 250 ng/ul Cas9 mRNA and 150
ng/ul of
each sgRNAs by using a pneumatic pico-pump (PV-820, World Precision
Instrument).
DNA Isolation and PCR Analysis for Identifying Deletion
For embryonic gDNA extraction, 20 pooled embryos were lysed in 20 uL lysis
buffer
(10mM Tris HC1 pH8.0, 2mM EDTA, and 0.2% Triton) containing proteinase K (10
ug/mL) at
55 C for 2 hrs followed by 95 C for 10 minutes. 1 uL of lysate was used
directly for genotyping
PCR performed for40 cycles of lOs at 95 C, 30s at 60 C, and 60s at 72 C after
initial denaturing
for 30s at 95 C. PCR products were analyzed by 2% agarose gel. All genotyping
primers are
listed in Table 3.
Germ cell sorting
Germ cell sorting was performed as described previously (Gaysinskaya et al.,
Cytom.
Part J. Int. Soc. Anal. Cytol. 85, 556-565 2014). Briefly, zebrafish testes
were placed in 6 ml
Collagenase I/Dnase I solution (200 U/ml Collagenase type I (Sigma-Aldrich)
and 5 ug/m1
38
CA 03083183 2020-05-21
WO 2019/103967
PCT/US2018/061802
DNAse I (Invitrogen) in Gey's Balanced Salt Solution (GBSS) (Sigma-Aldrich))
and shaken at
150 rpm for 10 min at 35 C. The temperature and agitation speed were the same
for all
subsequent incubation steps. The testes were gently pipetted halfway into the
10 minute
incubation. Tubules were settled for 2 min at room temperature (RT), then the
supernatant,
enriched in interstitial testicular cells (somatic cells), was harvested. 6 ml
Collagenase I/Dnase
1/Trypsin solution (200 U/ml Collagenase type I, 5 pg/ml DNAse I and 0.025%
Trypsin (Gibco)
in GBSS) was added to the pellet and the tubules were gently pipetted. Halfway
into the 25
minute digestion period, 60 p1 of 2.5% Trypsin was added, and the tubules were
pipetted again.
At the end of the incubation time, pipetting was repeated. The resulting cell-
dense suspension
was passed through a Nylon cell strainer (Falcon). To the resulting filtered
cell suspension 10 p1
of 1 mg/ml DNAse I and 10 p1 of 10 mg/ml Hoechst 33342 (Life Technologies)
were added and
incubated for 20 min. Halfway into the 20 minute period, the suspension was
pipetted. At the
end of incubation, 600 p1 of FBS was added to inactivate the trypsin. After
determining the cell
number, the suspension was spiked with 10 p1 of 1 mg/ml DNAse I, and stained
with Hoechst
dye for the final 6 pg Hoechst/million cells. The suspension was incubated for
25 min. The cells
were then stained with 10 p1 of PI (Sigma-Aldrich) at RT. Cell sorting and
data analysis were
performed by University of Michigan Flow Cytometry Core using MoFlo Astrios
cell sorter
(Beckman Coulter). Hoechst was excited using 375 nm laser, and the dye's wide
emission
spectrum detected in two distinct channels: the "Ho Blue" (450/40 nm band-pass
filter) and the
"Ho Red" (670 nm long pass filter). Cells from each subpopulation were sorted
and subjected to
qRT-PCR.
Generation of THOR Knockout Zebrafish
FO zebrafish was crossed to wild-type AB* to generate Fl embryos that were
screened
for THOR deletion. FO zebrafish that were able to produce germ-line deletion
of THOR were
crossed to produce Fl heterozygotes, which were subsequently genotyped and
crossed to
generate THOR homozygous. THOR homozygotes and matched wild-type fish were
used for
phenotypic analyses.
Zebrafish Mosaic Melanoma Model
All transgenic constructs were made using the To12/Gateway kit (a gift from
Dr. Kristen
Kwan) (Kwan et al., Dev. Dyn. Off Publ. Am. Assoc. Anat. 236, 3088-3099 2007).
Full-length
human NRAS 61K was amplified from pBabe NRAS 61K construct (a gift from
Channing Der
(Addgene plasmid # 12543),(Khosravi-Far et al., Mol. Cell. Biol. 16, 3923-3933
1996))
39
CA 03083183 2020-05-21
WO 2019/103967 PCT/US2018/061802
subcloned into BglII and BamHI restriction enzyme sites. GFP was amplified and
subcloned
into Sall and BamHI sites of pME entry vector. THOR transcript was amplified
from THOR
expression plasmid and cloned into Sall and BamHI sites of pME entry vector.
The mitfa
promoter was amplified using gDNA extracted from embryos as a template, and
cloned into
p5'E entry vector; and polyA tail was cloned into p3'E entry vector. These
were assembled into
the To12 destination vector using MultiSite Gateway Technology system
(Invitrogen). 2.5 ng/uL
of mitfa:NRAS 61K was co-injected into one-cell stage of p53-/- embryos
(Berghmans et al.,
Proc. Natl. Acad. Sci. U. S. A. 102, 407-412 2005) with mitfa: THOR or
mitfa:mCherry (25
ng/ul each) with 2.5 ng/ul of To12 mRNA. For injections into THOR -I- embryos
and their
corresponding wild type embryos, 5 ng/uL of mitfa:NRAS 61K was injected into
one-cell
embryos with 5 ng/ul of To12 mRNA. Zebrafish were inspected weekly, then
euthanized when
17 weeks old and fixed in 4% paraformaldehyde overnight. After taking photos,
they were then
decalcified in 0.5 M ethylenediaminetetraacetic acid before paraffin embedding
and sectioning.
Staining and immunohistochemistry were done using the standard techniques by
the University
of Michigan URAM Core. Percentage of melanoma area per body was calculated
using ImageJ
software. Antibodies used for immunohistochemistry are described in Table 6.
RESULTS
Discovery of THOR, a conserved lncRNA expressed in the testis
In a recent large-scale RNA-sequencing analysis, we comprehensively profiled
the
human transcriptome, discovering tens of thousands of novel lncRNAs (Iyer et
al., supra). While
lncRNAs tend to be less conserved than protein-coding genes (Figure 8A) and
most do not
exhibit marked sequence conservation, a subset of conserved lncRNAs does exist
(Figure 1A).
Both the average base-wise conservation of the entire transcript (Figure 1A, x-
axis) and the level
of conservation of the best 200bp window (Figure 1A, y-axis), a metric
previously utilized to
determine "ultraconserved" elements (Hudson et al., 2013; supra; Iyer et al.,
supra) were
measured and 82 intergenic ultraconserved lncRNAs with expression of at least
1 FPKM in the
top 1% of samples in our tissue RNA-seq compendium (Figure 1A,B and Table 1)
were
identified. Despite possessing a 200bp ultraconserved segment, these lncRNAs
possessed
varying degrees of base-wise conservation (Figure 1B, top; range, 0.1% - 55.4%
conserved
bases), with THOR exhibiting the second highest degree of base-wise
conservation.
Interestingly, when interrogating the GTEX benign tissue RNA-seq dataset
(Consortium, Nat.
Genet. 45, 580-585 2013; Mele et al., Science 348, 660-665 2015), two of these
ultraconserved
lncRNAs, THOR and CRNDE, displayed substantial expression in the testes
(Figure 1B,
CA 03083183 2020-05-21
WO 2019/103967
PCT/US2018/061802
bottom). Further analysis was focused on THOR due to its testis-specific
expression pattern
(Figure 1C), compared to the promiscuous expression of CRNDE (Figure 8B).
Transcriptional THOR homologues exist in the mouse and zebrafish
Utilizing structure prediction from prior RNA-seq assembly (Iyer et al.,
supra) and from
corroboration of 5' and 3' rapid amplification of cDNA ends (RACE), two
isoforms of THOR,
comprised of either 2 or 3 exons on chromosome 2 (Figure 8C and Table 2) were
identified.
Additionally, existence of the 3 exon isoform of THOR was confirmed via
Northern blotting in
the H1299 human lung adenocarcinoma cell line (Figure 9A). While the GENCODE
annotated
gene has an additional larger isoform with a downstream exon, expression of
this isoform was
not detected in any of the cell lines used in this study (Figure 9B), and
addition of THOR-
targeting siRNA did not alter the expression of the long isoform (Figure 9C).
Given its
substantial sequence conservation, THOR homologues were identified in other
species. Utilizing
the BLAT tool (Kent, Genome Res. 12, 656-664 2002), predicted regions in the
mouse and
zebrafish genome homologous to the human THOR (h-THOR, Ensemble ID:
ENSG0000(226856) were identified (Figure 2D). Additionally, elevated THOR
expression was
observed during the early development of both the mouse and zebrafish (Figure
2C,D, right).
THOR exhibits an evolutionarily conserved expression pattern in normal tissues
To obtain an independent validation of testis specific THOR expression
observed in the
GTEX RNA-seq data, quantitative real-time PCR (qRT-PCR) was performed with
cDNA
derived from various normal human tissues, observing a similarly testis-
specific expression
pattern (Figure 2E). Moreover, RNA in situ hybridization (ISH) of human testis
tissue using h-
THOR specific probes revealed an enrichment of THOR testis expression in the
spermatocyte
and spermatid (Figure 2B) but not in surrounding tissue (Figure 9H, I). This
expression pattern
for THOR is a similar expression pattern to that reported for cancer/testis
antigens not found on
the X-chromosome (Simpson et al., Nat. Rev. Cancer 5, 615-625 2005; Tapparel
et al., Gene
323, 189-199 2003). Querying additional RNA from tissue panels in the mouse
and zebrafish
identified testis-specific expression for both m-THOR (Figure 2C) and z-THOR
(Figure 2D).
Additionally, elevated THOR expression was observed during the early
development of both the
mouse and zebrafish (Figure 2 C, D, right).
Expression and functional implication of THOR in human cancers
41
CA 03083183 2020-05-21
WO 2019/103967 PCT/US2018/061802
Further interrogation of the expression of THOR in cancer tissue RNA-seq
samples from
the TCGA revealed that, despite bearing a benign expression pattern restricted
to the testis,
THOR is widely expressed in a number of tumor types and is expressed
significantly higher in
cancers compared to both the GTEX normal and the TCGA normal samples (Figure
3A).
Additionally, THOR was expressed in a multitude of the cell lines in the
Cancer Cell Line
Encyclopedia (Barretina et al., Nature 483, 603-307 2012) with the highest
expression in lung
cancer cell lines (Figure 3B). In both subtypes of lung cancer represented in
the TCGA (lung
adenocarcinoma, LUAD; lung squamous carcinoma, LUSC), THOR expression was
significantly higher in cancer in comparison to matched benign adjacent normal
tissue (Figure
3C). This cancer specific non-small cell lung cancer (NSCLC) expression was
confirmed by
performing h-THOR qRT-PCR on RNA from an independent cohort of tumor and
normal lung
tissue obtained from the University of Michigan (Figure 3D). This cohort also
contained both
melanoma and benign melanocytes, in which THOR similarly exhibited cancer
specific
expression (Figure 3D).
In order to interrogate the potential role of THOR in cancer processes, its
function in
NSCLC and melanoma cell lines was investigated. Knockdown of THOR via siRNA
and ASO
in H1299 and MM603, NSCLC and melanoma cell lines with high levels of THOR
(Figure 3E
and Figure 10C,D) resulted in a dramatic reduction in the proliferative
capacity of these cells
(Figure 3F,G and Figure 10C,D). siRNA and ASO knockdown of THOR in H1437 cells
(lacking
endogenous THOR expression Figure 3E) exhibited no significant proliferation
phenotype
(Figure 10E,F). THOR knockdown resulted in reduced colony formation in soft
via both ASO
and siRNA knockdown (Figure 3H and Figure 10G-I) and siRNA knockdown (Figure
10H).
Additionally, a THOR knockout cell line model was generated via CRISPR-Cas9
technology
with paired single-guide RNAs (sgRNAs) targeted to the conserved region of
THOR transcript
in the H1299 cell line. Multiple sgRNAs were utilized targeting varying
regions of THOR
(Figure 10J), and a monoclonal population of one of the sgRNA combinations
exhibiting
significant knockout of THOR at both the DNA and RNA level was selected for
further use
(Figure 10K, L). Similar to the results shown for siRNA and ASO knockdown, the
THOR
knockout H1299 cells exhibited significantly reduced cell proliferation
(Figure 31). Further
corroborating the capacity for THOR to act in trans, a recovery of the
proliferation phenotype
when ectopically expressing THOR in the context of CRISPR-mediated knockout
was observed
(Figure 31). These results were also recapitulated in a mosaic population of
knockout clones,
suggesting that the monoclonal findings are not due to selection bias (Figure
10M-0). Further
corroborating on-target effects, THOR mosaic knockout in H1437 cells (Figure
10P) did not
42
CA 03083183 2020-05-21
WO 2019/103967 PCT/US2018/061802
result in reduced proliferation (Figure 10Q). Moreover, a mouse xenograft of
H1299 cells
containing THOR knockout exhibited markedly reduced tumor growth compared to
control
knockout cells (Figure 3J). Cells with stable lentiviral THOR overexpression
in H1437 and
SKMEL5 (Figure 10R) exhibited
significant increases in proliferative capacity (Figure 3K and Figure 10S) and
soft agar colony
formation (Figure 3L and Figure 10T). Additionally, murine tumor xenografts
derived from cells
stably overexpressing THOR in H1437 cells exhibited a significant
proliferative advantage when
compared to cells stably overexpressing LacZ control (Figure 3M). However,
this finding was
not significant in a murine xenograft using SMKEL5 cells (Figure 10U).
Interrogation of the
lentiviral plasmid via Northern blotting revealed an unexpected long isoform
of THOR in
addition the isoform included in the plasmid (Figure 9A). 5' and 3' RACE
identified a segment
of plasmid in the expressed in the longer isoform (Figure 9J,K), however, THOR
targeting
siRNAs did reduce levels of this isoform, suggesting functional fidelity of
this longer isoform
(Figure 9A).
Characterization of the THOR-IGF2BP1 interaction
To characterize the mechanism through which THOR is functioning in cells, the
cellular
localization of THOR was investigated, observing it to be present in both the
cytoplasm and
nucleus via qRT-PCR following cellular fractionation (Figure 11A) and via
single molecule
fluorescence in situ hybridization (ISH) (Figure 11B-H). THOR protein
interactors were
identified via RNA-pulldown followed by mass-spectrometry. Building on the
sequence
conservation of THOR, protein-binding interactions that were also conserved
were identified.
This was accomplished by utilizing four conditions for RNA-pulldown mass
spectrometry: 1)
pulldown of h-THOR added to human H1299 cancer cell lysate, 2) pulldown of h-
THOR added
to zebrafish embryo lysate, 3) pulldown of z-THOR added to human H1299 cancer
cell lysate,
and 4) pulldown of z-THOR added to zebrafish embryo lysate. In all conditions
pulldown of
antisense THOR was utilized as a negative control. Two proteins, IGF2BP1 and
IGF2BP3, were
pulled down in all four conditions (Figure 4A). The IGF2BP proteins were also
the only proteins
pulled down by h-THOR in both the nuclear and cytoplasmic fractions of H1299
cells (Figure
110. Both IGF2BP1 and IGF2BP3 have been reported to exhibit a cancer/testis
expression
pattern similar to that of THOR (Bell et al., Cell. Mol. Life Sci. CMLS 70,
2657-2675 2013)
(Figure 11 J,K).
IGF2BP1 and IGF2BP3 have been implicated in mediating RNA-stability and
translation
through their binding to a number of well-defined mRNA targets (Bell et al.,
Cell. Mol. Life Sci.
43
CA 03083183 2020-05-21
WO 2019/103967 PCT/US2018/061802
CMLS 70, 2657-2675 2013; Hafner et al., Cell 141, 129-141 2010). Additionally,
this function
has been documented to occur in concert with a number of other proteins
comprising a
messenger ribonucleoprotein (mRNP) complex (Weidensdorfer et al., RNA N. Y. N
15, 104-
115 2009). It was observed that many members of this complex are also pulled
down by THOR
in the various conditions (Figure 4A), and confirmed that IGF2BP1, IGF2BP2,
IGF2BP3, and
YBX1 are present in the complex via immunoprecipitation and Western blotting
(Figure 4B). To
further validate the specificity of the interaction between h-THOR and mRNP
complex proteins,
RNA immunoprecipitation (RIP) assays were performed with antibodies against
IGF2BP1-3,
YBX1, STAU1 and HuR with subsequent qRT-PCR for THOR and a panel of additional
control
RNAs (Figure 4C). Overexpression of THOR in H1437 cells was shown to produce a
modest
increase in the IGF2BP1 and IGF2BP3 interaction, demonstrated a role for THOR
in mediating
the mRNP complex formation (Figure 11L).
THOR and IGF2 RNAs were pulled down by the various proteins of the mRNP
complex,
while negative control lncRNAs NEAT 1 , TINCR, and HOTAIR exhibit a
substantially reduced
extent of pulldown (Figure 4C). It was also observed that HuR, a protein not
in the mRNP
complex (Figure 4B), does not to pull down any of the RNAs used in the study
(Figure 4C)
despite robust pulldown confirmed via immunoblot (Figure 4B). The relationship
of THOR and
IGF2BP1 was investigated as a direct binding interaction, showing that in
vitro transcribed h-
THOR and purified myc-tagged IGF2BP1 exhibit substantial binding compared to
negative
controls (Figure 4D).
In order to further implicate that the conserved regions of THOR are
responsible for its
binding to IGF2BP1, indicated that this binding interaction was selected for
evolutionarily,
multiple deletion isoforms of both h-THOR and z-THOR were added to human H1299
cancer
cell lysate and to zebrafish embryo lysate, respectively. Pulldown of the
various isoforms of h-
THOR followed by Western blot for IGF2BP1 revealed that the region of THOR
responsible for
IGF2BP1 binding is in exon 2 and 3, the conserved region of h-THOR (Figure
4E). Additionally,
this observation was also observed for z-THOR, wherein the 5' conserved
portion of z-THOR
was sufficient to result in pulldown of the zebrafish igf2bp1 protein (Figure
4F).
The localization of binding interaction between THOR and IGF2BP1 on the
IGF2BP1
protein was also interrogated. IGF2BP1 possesses 2 RNA recognition motif (RRM)
domains and
4 K homology (1(H) domains (Figure 11M). Multiple recombinant deletion
isoforms of
IGF2BP1 were generated, and their ability to bind THOR was tested using RNA
pulldown
followed by Western blotting. Deletion of the RRM domains did not affect THOR
binding,
44
CA 03083183 2020-05-21
WO 2019/103967 PCT/US2018/061802
while the KH1, KH3, and KH4 domains were found to be essential for THOR
binding (Figure
11N).
THOR regulates IGF2BP1's target mRNAs levels
Having identified a specific and evolutionarily conserved interaction between
THOR and
IGF2BP1, this functional relationship was further characterized. As IGF2BP1
has been reported
to regulate the mRNA stability of a set of well-described target RNAs (Bell et
al., 2013; supra;
Hammerle et al., 2013; supra), it was hypothesized that THOR may be playing a
role in
IGF2BP1-facilitated mRNA stabilization. To test this hypothesis, the levels of
canonical
IGF2BP1 targets (IGF2, CD44, KRAS, ACTB, PABPC1, GLI1, MYC, MAPT, CTNNB1,
PPP 1R9B, BTRC, PTEN and H19) (Bell et al., 2013; supra) were measured in
various
conditions. The levels of nearly all IGF2BP1 targets were decreased upon
knockdown of THOR
in both H1299 and MM603 cells, and conversely increased with stable
overexpression of THOR
in H1437 and SKMEL5 cells (Figure 5A and Figure 12A). Knockdown of IGF2BP1
produced a
similar reduction in its targets, while altering levels of IGF2 and CD44, two
of the canonical
IGF2BP1 targets, failed to show a trend in the expression of IGF2BP1 targets
(Figure 5A). This
finding was confirmed in CRISPR-mediated THOR knockout H1299 cells, displaying
a similar
reduction of expression of IGF2BP1 targets. Additionally, a reversal of this
phenotype was
observed when expressing ectopic THOR in these cells, demonstrating a trans
function for
THOR (Figure 12B). IGF2BP1 binds to target mRNAs, and has been shown to mostly
increase
their stability (Bell et al., 2013; supra; Weidensdorfer et al., RNA N. Y. N
15, 104-115 2009),
although there has been a report of an IGF2BP1-mediated destabilization effect
(Hammerle et
al., Hepatology 58, 1703-1712 2013). Thus, it was hypothesized that the
effects of THOR levels
on IGF2BP1 targets (Figure 5A) may be explained by THOR stabilizing the
interaction of
IGF2BP1 with its targets. To examine this function, qRT-PCR for IGF2BP1
targets, IGF2 and
CD44, following IGF2BP1 RIP was performed. Knockdown of THOR reduced binding
of both
IGF2 and CD44 to IGF2BP1, while overexpression of THOR increased IGF2 and CD44
binding. However, knockdown of IGF2 did not result in an altered binding of
CD44 to
IGF2BP1, while CD44 knockdown failed to cause an effect of IGF2 binding to
IGF2BP1
(Figure 5B and Figure 12C). Further corroborating this hypothesis, THOR
overexpression
substantially increased the mRNA stability of IGF2BP1 targets IGF2 and CD44
following
Actinomycin D treatment (Figure 5C), while having no effect on the stability
of the GAPDH and
UBC, two control mRNAs that do not interact with IGF2BP1 (Figure 12D). The
THOR mRNA
has a half-life of 14 hours (Figure 12E), which is longer than the dynamic
range observed for the
CA 03083183 2020-05-21
WO 2019/103967 PCT/US2018/061802
stabilization effects on IGF2 and CD44 (Figure 5C and Figure 12D), confirming
THOR is
present in cells long enough to exert these effects.
IGF2, one of the canonical IGF2BP1 targets from which it derives its name
(Nielsen et
al., Mol. Cell. Biol. 19, 1262-1270 1999), is a secreted protein that has been
shown to contribute
to oncogenesis via mitogenic activation through receptor tyrosine kinase-MEK-
ERK signaling
(El-Shewy et al., J. Biol. Chem. 282, 26150-26157 2007; Livingstone, Cancer
20, 321-339
2013). It was observed that in addition to altering levels of IGF2 (Figure 5A)
and modulating
IGF2-IGF2BP1 binding (Figure 5B), THOR is also successful in regulating the
downstream
signaling pathway of IGF2 (Figure 12A,F), showing that the THOR-mediated
changes in
IGF2BP1 target expression are sufficient to result in functional downstream
signaling.
dditionally, the proliferative advantage conferred by THOR overexpression was
abrogated by
reduction of IGF2BP1 levels in those cells, with a particularly striking
phenotype in the
SKMEL5 cell line (Figure 5D), further corroborating the functional relevance
of the THOR-
IGF2BP1 interaction. Additionally, knockdown of IGF2BP1 in both H1299 and
MM603 cells
reduced cell proliferation (Figure 12 G,H) and soft agar colony formation
(Figure 12I,J).
Overexpression of a deletion construct of THOR lacking the conserved IGF2BP1
binding
sequence failed to exhibit the enhanced proliferation observed with full
length THOR
overexpression (Figure 5E). These data indicate that the binding interaction
between THOR and
IGF2BP1 leads to functionally relevant consequences in cells that have
implications for the
oncogenicity of THOR.
To more broadly assess the transcriptional phenotype of THOR-knockdown in
comparison to IGF2BP1-knockdown, differential expression was assessed for RNA-
seq
performed with two independent siRNAs targeted to THOR, IGF2BP1, and HUR.
Providing
further evidence for a shared functional role for THOR and IGF2BP1,
significant overlap
between the genes with significant differential expression upon THOR and
IGF2BP1
knockdown was observed (Figure 6A,B). Knockdown of THOR produced gene
expression
changes in many more genes than did knockdown of IGF2BP1, demonstrating a
potential
functional role of THOR beyond that mediated through IGF2BP1. Corroborating
that the
observed gene expression changes via siRNA knockdown are on-target effects,
knockdown of
THOR via two independent ASOs produced gene expression changes in line with
those
produced via siRNA knockdown (Figure 13A). As a negative control, the
transcriptional
changes upon knockdown of HUR that failed to exhibit a similar differential
expression profile
to that of THOR and IGF2BP1 knockdown was demonstrated. The gene signatures
most altered
upon knockdown of THOR and IGF2BP1 were also highly concordant when comparing
GSEA
46
CA 03083183 2020-05-21
WO 2019/103967
PCT/US2018/061802
(Subramanian et al., Proc. Natl. Acad. Sci. U. S. A. 102, 15545-50 2005)
analyses upon gene
expression changes following knockdown (Pearson r = 0.50; Figure 6C). The gene
signature
changes following HUR knockdown, however, were not correlated to those
following either
THOR (Figure 6C) or IGF2BP1 (Figure 6C) knockdown. Two independent gene
signatures
associated with metastasis and relapse of melanoma (Kauffmann et al., Oncogene
27, 565-573
2007; Winnepenninckx et al., J. Natl. Cancer Inst. 98, 472-482 2006) were
among the top gene
signatures altered upon knockdown of both IGF2BP1 and THOR (Figure 6C),
further
implicating the THOR-IGF2BP1 relationship in cancer progression, particularly
in melanoma.
To further implicate a functional relationship of THOR and IGF2BP1, iCLIP was
performed on IGF2BP1 in H1437 cells overexpressing THOR. Binding of IGF2BP1on
THOR
was observed in the same region identified via deletion construct pulldowns
(Figure 4D), while
no binding was observed in the H1437 cells overexpressing the LacZ control
(Figure 13D). 185
genes were identified as IGF2BP1 binding targets via iCLIP, and RNA-sequencing
was also
performed on to interrogate gene expression changes for these genes bound to
IGF2BP1. In the
context of THOR overexpression, those genes identified as IGF2BP1 targets were
observed to
have a significant increase in expression compared to genes that are not
IGF2BP1 targets
(Figure 13 E, F). Additionally, iCLIP was performed in H1299 to interrogate
IGF2BP1 in the
context of endogenous THOR expression. IGF2BP1 binding to THOR was identified
as in
H1437 cells (Figure 13G). Additionally, as identified in the THOR
overexpression context
above, those genes identified as binding targets of IGF2BP1 in the H1299 iCLIP
experiment
exhibited a significant reduction in expression upon THOR knockdown when
compared to those
genes without IGF2BP1 binding, although the magnitude of effect was lesser
than in the H1437
experiment (Figure 13 H, I). These data provide a high-throughput
corroboration of the potential
effects of THOR in mediating RNA-stability of IGF2BP1 targets. Further
leveraging these data,
cis function for THOR was ruled out by the finding that genes near THOR do not
exhibit gene
expression changes upon modulation of THOR levels (Figure 13J).
THOR knockout zebrafish exhibit fertilization defects and resistance to
melanoma
formation
Given that sequence conservation of THOR (Figure 1A,B,D, and Figure 8C-E, a
conserved tissue expression pattern (Figure 2A,C,D), and conservation of its
binding interaction
to IGF2BP1 (Figure 4A,E,F) were observed, its potential function in a
different animal model
was investigated, extending the implications of its functionality beyond human
cancer cell lines
(Figure 3 and Figure 4). The zebrafish animal model has become a commonly used
system for
47
CA 03083183 2020-05-21
WO 2019/103967 PCT/US2018/061802
investigation of development (Giraldez etal., Science 308, 833-838 2005;
Ulitsky etal., Cell
154, 26-46 2011), and more recently it has become a relevant model system for
cancer
investigation (Lieschke and Currie, Nat. Rev. Genet. 8, 353-367 2007). With
the advent of
CRISPR-Cas genome editing technology (Cong et al., 2013; surpa), the genomes
of model
organisms can be molded to interrogate specific genomic questions with ease
(Hwang et al., Nat.
Biotechnol. 31, 227-229 2013; Sanchez-Rivera and Jacks, Nat. Rev. Cancer 15,
387-395 2015).
Thus, utilizing the CRISPR-Cas9 genome editing system, a THOR knockout
zebrafish line was
generated. Firstly, two sgRNAs targeting the conserved region of z-THOR
(Figure 14A) and
Cas9 mRNA were injected into zebrafish embryos, producing a mosaic FO
generation that was
subsequently mated to wildtype zebrafish to generate heterozygous Fl offspring
(THOR'). The
heterozygotes were then mated with one another to generate a population of
homozygous THOR
knockout zebrafish (THOR) in the F2 generation (Figure 7A).
Upon generation of THOR-I- zebrafish, a striking phenotypic effect on the
fertility of
zebrafish in comparison to wildtype zebrafish was observed, with 55% of
embryos from
mating of THOR-I- zebrafish either dead or unfertilized 6 hours post
fertilization (hpf), compared
to only 11% from wildtype mating (Figure 7B). Moreover, when mating wildtype
males to
female THOR-I- zebrafish, the fertilization defect was substantially
diminished, while mating
wildtype females to male THOR-I- zebrafish produced a significant
fertilization defect in the
zebrafish offspring (Figure 7C). This finding supports the role of THOR in the
testis, and
suggests a primary functional role in fertility for THOR in the testis. When
assessing the
subpopulations of sperm at various stages of development, expression of THOR
was found to be
isolated to spermatocytes in meiosis II at much higher levels than sperm at
any other stage of
development (Figure 7D) and testis of THOR-I- zebrafish contained fewer cells
in meiosis II
compared to wildtype zebrafish (Figure 14 C, D). Of note, GSEA performed on
siRNA THOR
knockdown RNA-seq (Figure 6C and Figure 13 B,C) revealed a significant
association of
THOR expression with all meiosis signatures found within MSigDB v5 (Figure 14,
E, F). Upon
THOR knockdown, genes involved in meiotic pathways were significantly
upregulated. Within
these signatures, a striking preponderance of upregulation in histone genes
involved in meiosis
was observed. Many of these meiotic histone genes were identified as some of
the most
positively dysregulated genes upon THOR knockdown (Figure 14G).
Having shown a shared role transcriptional modulation for THOR and IGF2BP 1 in
human
cancer cell lines, shared gene expression changes in the zebrafish model were
investigated,
observing a significant decrease in the expression of IGF2BP1 targets in THOR-
I- zebrafish
embryos compared to wildtype embryos, and a significant increase of 1gf2a and
1gf2b in
48
CA 03083183 2020-05-21
WO 2019/103967 PCT/US2018/061802
zebrafish embryos ectopically overexpressed h-THOR (Figure 7E). Additionally,
given that the
transcriptional changes resulting from THOR and IGF2BP 1 knockdown exhibited
strong
association with previously identified melanoma gene signatures, the
oncogenicity of THOR was
investigated using a zebrafish melanoma model wherein driver genes are
injected into zebrafish
to elicit various cancer phenotypes (Langenau et al., Oncogene 27, 4242-4248
2008).
Specifically, a previously described zebrafish melanoma model that employs
embryonic
injection of human NRAS-K61 driven by the mitfa promoter (a zebrafish gene
expressed in
melanocytes) resulting in the formation of easily visible zebrafish melanoma
(Figure 7A)
(Dovey et al., Zebrafish 6, 397-404 2009) was used. The zebrafish melanoma
model is different
from that previously reported in the modality of transgenesis. In the previous
model, naked
DNA containing NRAS61K was injected into single cell zebrafish embryos
containing a mutant
p53 background (Dovey et al., 2009; supra). The naked DNA transgenesis model
is largely
inefficient and requires mating of transgenic zebrafish to the Fl generation
for successful
generation of the transgenic fish, which can negatively impact transgenesis
that can be
deleterious to animal viability. Here, a To12 integration system which has
been shown to
produce markedly more robust transgenesis (Kwan et al., Dev. Dyn. Off. Publ.
Am. Assoc.
Anat. 236, 3088-3099 2007) was used. In addition to the more robust
integration of the NRAS
transgene, this system enables generation of a mosaic FO generation that can
be utilized in
functional experimentation. The timeframe of transcription and translation of
the transposase
injected into the embryos is longer than the time to replication of the single
cell embryo,
resulting in mosaic expression of the transgene in the adult zebrafish. This
phenomenon
circumvents the selection against particularly stressful transgenic events in
the naked DNA
model, enabling robust expression of NRAS61K in these To12 mediated transgenic
zebrafish.
Using this NRAS melanoma system, a striking resistance to melanoma development
in the
THOR-I- zebrafish was observed (Figure 7F). Of note, while the previous
NRAS61K model of
zebrafish melanoma required a p53 mutant background for tumorigenesis, tumor
growth in p53
wildtype zebrafish was observed after injection of a high amount of
NRAS61K/To12 into the
single cell embryo (5 ng/uL). The ability to generate tumors in a p53 wildtype
context is likely
due to the FO mosaicism and to the increased efficiency of transgenesis of the
To12 system. The
fertilization defect and resistance to melanoma mediated by THOR present
compelling evidence
for a conserved role of THOR in vertebrate physiology and pathophysiology.
Human THOR enhances the onset of melanoma in zebrafish
49
CA 03083183 2020-05-21
WO 2019/103967
PCT/US2018/061802
In order to further investigate the role of THOR in zebrafish melanoma
development, the
function of the addition of human THOR to zebrafish embryos utilizing the
mitfa-promoter
driven injection method with injection of mCherry used as a negative control
was performed
(Figure 7G) (Langenau et al., 2008; supra). Injection was performed on p53
knockout (p53-/-)
.. zebrafish to enhance the melanoma phenotype observed, as previously
described (Dovey et al.,
2009; supra). In this model, embryos were injected with a lower concentration
of
NRAS61K/To12 (2.5ng/uL) than the THOR knockout model (Figure 7A,F), resulting
in a more
indolent phenotype (Figure 7H), despite the loss of p53. Nevertheless, it was
shown that loss of
p53, in the context of THOR overexpression significantly reduces tumor-free
survival (Figure
14B). The overexpression of h-THOR in zebrafish was sufficient for a
significant increase in not
only the onset of melanoma development (Figure 7H), but also on the size of
the melanoma
tumors that developed (Figure 71, J). NRAS 61K induced melanomas in both p534-
and
wildtype zebrafish (Figure7J and 14 I, K) were positive for Melan-A staining,
a mitf target gene
and marker for melanoma in human specimens confirming that the lesions were in
fact
melanoma (Figure 14J, L). Thus, the striking ability of the human isoforrn of
THOR to promote
melanoma in zebrafish argues for an evolutionarily conserved role of THOR in
mediating
cellular processes that are potentially involved in tumor development.
Table 1
chrom start end maxlength tcat (tucp =
reference_na mitranscriptome
transcript of me name
unknown coding
potential)
chr1 44969848 45026990 56307 Incrna NA KCCAT40
chr1 98389009 98515563 26545 Incrna,tucp MIR137HG,R MIR137HG
P11-272L13.3
chr1 143644576 143750106 5416 Incrna,tucp L1NC00875,R OVAT215
P6-
206117.3,LINC
01138,RP6-
206117.1
chr1 149576502 149577300 705 Incrna,tucp .. RP11-277L2.3
OVAT12
chr1 200311566 200453140 16675 Incrna,mixed_read_ LINC00862,Z HICLINC26
through,protein_co NF281
ding
chr1 200380708 200452674 5107 Incrna EU250746,RP KCCAT533
11-469A15.2
chr1 244172879 244220780 8373 Incrna,mixed_read_ RP11- HICLINC32
through,protein_co 278H7.1,ZBT
ding B18,L0C3395
29,AK310634
chr10 38092552 38108477 15925 Incrna NA CA11248
chr10 77001895 77121872 5532 Incrna ZNF503-AS1 ZNF503-AS1
chr10 77220957 77275854 20332 Incrna NA HICLINC242
CA 03083183 2020-05-21
WO 2019/103967
PCT/US2018/061802
chr10 77294696 77378177 46237 Incrna NA HICLINC243
chr10 77552200 77599462 46408 Incrna AL731568.1 KCCAT544
chr10 103459280 103489889 5784 Incrna RP11-190J1.3 CA11297
chr10 104106019 104116259 6598 Incrna MIR_584 HICLINC250
chr10 130452758 130494912 13203 Incrna NA HICLINC259
chr11 119768522 119826605 8007 Incrna NA HNCAT224
chr12 22852032 23356838 18523 Incrna AK094733,RP HICLINC274
11-
114G22.1,RP
11-
449P1.1,RP11
-153K16.1
chr12 54101956 54150729 15635 Incrna,mixed_read_ CALC0001,CI LGAT88
through,protein_co STR-ACT
ding
chr13 97999250 98026479 27229 Incrna RNA5SP37
HICLINC295
chr14 36349494 36705454 19108 Incrna,mixed_read_ RP11- CA11653,LINC006
through,pseudogen 317N8.4,BRM 09
e S1L,RP11-
116N8.1,LINC
00609, RP11-
259K15.2
chr14 36738267 36742582 1211 Incrna NA HICLINC304
chr14 50249312 50338400 8843 Incrna,mixed_read_ NEMF,METAZ KHCAT459
through,protein_co 0A_SRP,RN7S
ding L3
chr15 35837850 36341917 3178 Incrna DPH6- DPH6-AS1
AS1,RP11-
684621.1
chr15 37396029 37402163 5987 Incrna NA HICLINC318
chr15 95869090 96051292 3747 Incrna L1NC00924 L1NC00924
chr16 54304911 54333259 10945 Incrna,tucp NA CA11854
chr16 54885553 54964563 13236 Incrna CRNDE
CA11855,CRNDE
chr16 72459846 72569836 7095 Incrna AC004158.3, CAT1871
AK095618
chr16 73092989 73096990 2413 Incrna RP11- HICLINC335
346C20.3
chr18 39041057 39212203 9553 Incrna RP11- LSCAT30
142I20.1,KC6
chr18 53346311 53540358 15142 Incrna RP11- CAT2020
397A16.1
chr18 53440321 53464004 13719 Incrna AK127787,RP HICLINC356
11-397A16.2
chr18 53670978 53859225 7403 Incrna RP11- CAT2021
456019.4,RP
11-
456019.5,L0
C100505474,
CTD-
2008L17.2
chr18 73926337 73938535 11083 Incrna RP11- HICLINC362
94619.1
51
CA 03083183 2020-05-21
WO 2019/103967
PCT/US2018/061802
chr2 19165588 19558440 10815 Incrna,mixed_read_
AC092594.1, CAT215
through OSR1
chr2 25450706 25455918 5067 Incrna,tucp NA
HICLINC40
chr2 60781023 60783714 2420 Incrna NA CAT245
chr2 60898696 60965989 1947
Incrna,pseudogene RP11- HICLINC50
416L21.2
chr2 66654202 66959175 15117 Incrna,mixed_read_
AC007392.3, HICLINC53
through MEIS1
chr2 105022724 105035698 4799 Incrna AC068535.2 CAT284
chr2 105315691 105322361 5627 Incrna AC068057.1 PRCAT310
chr2 118940511 118944639 2100 Incrna AC093901.1 HICLINC62
chr2 144386688 144667222 9863 Incrna AC092652.1, LACAT234
RP11-
434H14.1
chr2 156840544 157111546 22110 Incrna,tucp AC093375.1, LSCAT223
BC032407
chr2 157192442 157224262 9962 Incrna,tucp NA HICLINC71
chr2 157582258 157599808 11646 Incrna NA HICLINC73
chr2 177293899 177690269 23452 Incrna AC017048.4 CAT339
chr2 177475747 177505108 13894 Incrna,tucp RP11- CAT338
324L17.1,ACO
17048.3
chr2 219933448 219940404 5849 Incrna NA HICLINC86
chr20 20950791 20955373 3417 Incrna RP5- LGAT73
1177M21.1
chr20 21068793 21073177 3741 Incrna NA LGAT90
chr20 21206871 21224948 18077 Incrna NA THCAT569
chr20 22509221 22559600 11882 Incrna LINC00261
LINC00261
chr20 29507940 29554859 20944 I RP4- PRCAT186
n 610C12.4,RP4
c -610C12.3
r
n
a
chr21 17442467 18018743 9992 Incrna L1NC00478,A L1NC00478
P000473.8,AP
000473.5
chr21 17663062 17682186 5305 Incrna AP001172.2 HICLINC384
chr21 17905940 17949011 6191 Incrna AP000962.2 CA12192
chr3 52584100 52596258 12158 Incrna RNU6ATAC16
AMAT96
P
chr3 114034977 114108032 8763 Incrna ZBTB20-AS1 CA1434
chr3 114812496 114825853 5199 Incrna ZBTB20-AS4 ZBTB20-AS4
chr3 181132104 181162548 5313 Incrna RP11- LG AT79
275H4.1
chr3 181916542 182131010 23537 Incrna NA CA1477
chr3 188651106 188667032 10698 Incrna TPRG1-AS1 TP
RG 1-AS1
chr4 41872093 41893020 4422 Incrna RP11- LI NC00682
457P14.5,BCO
25350,LINCOO
682
52
CA 03083183 2020-05-21
WO 2019/103967
PCT/US2018/061802
chr4 54738988 54876128 16468 Incrna RP11- CA1547
89616.1
chr5 87830417 87907735 6814 Incrna L1NC00461 LINC00461
chr5 87960173 87987573 10449 Incrna L1NC00461
LINC00461
chr5 91726221 92275609 12050 Incrna,pseudogene CTC- CAT691
529L17.2,CTC
-
458G6.2,CCT
7P2,RP11-
133F8.2
chr5 139028390 139059331 29236 Incrna CTD- HICLINC139
3224K15.2
chr5 141201511 141258811 13854 Incrna,protein_codi PCDH1 HICLINC142
ng
chr5 175848245 175861702 2235 Incrna NA HNCAT169
chr6 50059498 50071660 2441 Incrna RP11- HICLINC150
397G17.1
chr6 108439973 108480892 4361 Incrna OSTM1-AS1 OSTM1-AS1
chr6 156241778 156310880 37387 Incrna M1R1202 BRCAT280
chr7 26623027 26904974 11311 Incrna,protein_codi SKAP2 HICLINC169
ng
chr8 28894032 29127341 15757 Incrna,protein_codi KIF136 HICLINC185
ng
chr8 77315031 77437350 6168 Incrna RP11- HICLINC201
706J10.1,RP1
1-706J10.3
chr8 99999693 100013023 3873 Incrna AC104986.1 HICLINC207
chr8 130886169 130934817 29107 Incrna RP11- THCAT385
47304.4
chr9 96327492 96338734 10823 Incrna,tucp AL353629.1 CAT1166
chr9 109040241 109465042 2376 Incrna,tucp RP11- MEAT55
308N19.1,AK
093363, RP11-
308N19.4
chrX 41092072 41095828 3545 Incrna NA HICLINC387
Table 2
Species Sequence SEQ ID
AGCCGAGTTCGCGCCGCCGGTAGGTGCTGCCATGCCAGGGGGCGGGATCGTGGAGCG 1
CCTCGCAGAACCGCACGAAAGCAAAAACAAAGCCATCTCTCCGGAGCAGAAATAGAAC
AGACGTGGCCGGGGAAAGCCAAATATTTCCTGCCGTCCTGGTGAACACAATCGAGCAA
GGCAGTGAAGCAAACATCATTAGGTGGCTGGACTCAGACACATCACGCTCCAGTTTGG
H uman GTTCCAAGGTGCTTCTCTCTGGATTTTCACCTGCCTTGCCAAAAATGATTGATTACGCTG
GGCCAACTGGGTGTCCGGCAATACCCAACAAATGACTTTGGCCCCTAACAGCAGGTCTT
GGCCAGACAGAAATCAATATTTCACCATTAAAATCTATCAAAGAAGAGTTAAGGCACCA
TCTGTCCCTGCCGCCTCTCTATGGTGTGTGAACATTAAATCCGACACTTGTACTACATGG
GTAATCAATATATAGTGGTTCACAGATCATTTGTGGTTCCCTTTTAGCAGTGATGGATGT
CTGGAATCGTTGTGATTCATTTTGTCAGACCATTAAACAAGATTCTGTCCA
GGCACACGCCTTTAATCCCAGCACTTGGGAGGCACGGAATAGAGTCACCTTATCCAGG 2
M TCATCTGTCCTTACTAGCAGAGCCAGCAGGAGCCAAGTAGTTTGCCTTCATAATTTAGG
ouse
TTTTCTTCACCCTGTGCTGATTCATGAAAACATTAATCAAAGAGAGAAAAGTGCTACATT
GTTTTTTGGGGAAAAAAAACAAGTATATTCCTTTCTGAATGTATGCATTTACATATGTAC
53
CA 03083183 2020-05-21
WO 2019/103967
PCT/US2018/061802
ATG ATA CA CA CATA C CTG TG TG AA CA C C CAAAA CAA G CAA G G CAT G A CAAA
CCATG TCT
TTGTGTG CA C GTG TG CATGTG CCTG A G TGT GTG TG TG TG TGTG T GT GTGT G TGTG
TCTA
TACTTCCTAG CAGTAATAG G GG GAG GAAG CCGAGAAAAAG GAG GAG GAAGAG GAG C
CAGCAGCAAGAGGTCAATGTTGGGTGTCTTCTTTGATTACTTTCTATCTGA 111111 GAG
ATAAAA G TTTCTG A CT CAA C CTTG A G CTTA C CAATA CA G CTA G A CA G G CTGTCCAG
CAA
ACCCTATAGATCTG CCTCATTTCCCCAACACAGAACTAGAGTTCCAGACACACATCCCAG
TG CCTAG GTTCTTATTTGAATGCTGAG GATCTG AA CTTA GTTTG ATATG CTTGAG CA G C
AA G CAC CTTA C CAA CTG A G C CAATTC C C CA G CC CATG ACTATTTTC CAATG
CAAATGCTG
AC CTCG G CTTATG CCTCAGAGACACCCATATTGTG GACACTCTGTGAATCCTTAGACTG
TAG CTAG G G TA CATA G C C CTTCAA CTA C CTCATA C C CTA CA G AG AAATCAA ACA G G
AAA
ATAAATAGGTGGCTAACCTTGAGGGCTAGAGGCTGAGGATCACTCTGGGGACATGCA
GTGCTCG CTCCTGACACCTACTTCTAAGCAGATGTCACCCCTTCCCTATCAGTCTTCCTG
GGAAGCCACCCACTTAACCCCATCATTACAAACTATAAGGGGCTCCATCTGAGAACTGT
CTTTAA G A C CATG TTCTAAG CTACACAAGAAAAATTAACCTTGTTACTTG G CAATTA CAC
ACACTCACACCCCTTTCTAAGAAAGGTTGCAGGAATGACGTCACAAAACCCTGGGAGC
AGGCTACTATAGGCGGTTCTCTTGTTGGAGCCCCACCCTCCCAGCTGTTCCTTGCCCTTC
CCAG CACAGAG CAGTTTCCCCTG GTTG CTGACTTG G CAAG CCCTT CA CTTTATG AATAT
GACCCTCG GCG GG GAGAGTCCCTCTCTG CATCCCCCAACTATGTTATCACCATTATTAA
GGAGCTTAAAAGAGGAGCTGGGAGGACGAGACACTGCTGGAATTGCAGGCTGATTGT
G ATTG ATGT GTTC CTATTA G TG C CTCA GT GTTATCTCTCTG GATG G CAA G AACAA CCA G
TG A G TTG TAACA CAA CA G ATTA C CTG A G TTC CCA G C CTTA G AA G G
GTGTTTAAATAAAA
TATAGTCCCTCTTAG CAAGAGG CTCATTTTCTCCGCG GAG CTCCCG GACTATGTCATGTC
AG CTCTGATTCGCTGTG C CTCTC CT CA G TAAACATG TCTTAT CATTAATAATTC CTTACA G
GCACCGTCTCCGAGAGTCCTCTCTCACG CTCTCCCCC CA CATTCTTC CT CTA G GTG G CTG
GATTCAGACACATCACGCATCG GCATG G GTTCCAAGGTG CTTCTCTCTG G ATTTTCA C CT
GCCTTGCCAAAAATGATTGATTACGCTAGGCCAACTGGGTGTCCGGCAATACCCAACAA
ATGACTTTG GCCCCTAACAG CAG G CCTTG GCCAGATAGAAATCAATATTTCACCATTAA
AATCTATCAAAGAAGAGTTAAGG CACCATCTGTCCCTG CCGCCTCTCTATG GTG TG TG A
ACATTAAATC C G A CA CTTG TA CCA CA CG G GTAATCAATATATAGTG GTTCA CA G ATCAT
TT G TG GTCCCCCTTTAG CA G TG AT G G ATGT CTG G AAT CG TTG TG ATTCATTTTG TCA G
A C
CATTAAACAAGATTCTGTCCAGTT
ACTA C C G CA G CCACTATG CATTTAT CT CTT CTAG TA G GTCTTTCT CA C C GT GT GTG
TATCT 3
GTGAGAGAGAGACCGAGAGAGAGACGATTCCAGTTACCTTGACACCCTAATAGACTGC
CTTTTCTCAA C CA G TG CAATC G A G CAAA CCA CTG GAG CAAAAATCATTAGGTAAG CAA C
GTAATCACAATCAAATCTCCCCGCTTCCATCTGTGTACTTTTG CCCTCTCTCAAGGATACC
TGTG 11111 ACATGCAGCTCTTCTCTGCGTCACTCTTCTCGGAATCTCGTCACTTTCCTCC
TCG TATATTA CATCTCCCA GTTAAAAG AG ATG CTG ACTTCACCG CT GTTTAATCTG CG CG
AG GTAAATG AC CTCTCG GATGAG CTCGG G CCGCTATCTG CGG CTATAG AA GTATG TTA
TCACCGTTATTAGAGCACGTTAAACAGTGGCTGAGAGTGTAGAGACACCGGGCGAAAT
TGGAAGCTTATTGTGATTGATGGGTTCCTATTAGGCGCTCGCTGTTATCGCGGCGGATG
GAGGGGAACGGGGCACTGAGTTGTAACACAACAGATTACCTGAGCCTGTAGTCTCCCG
AAGGATGTTTAAATAAAACATAGTCGCTCCTTTTCTCTCTCC 111111 TCTCCCCACACCT
TCATTTCCACTCGCG G G CCA CTC CAC CTACCCG ACGTCAT GTG CAATTTG CCCG AG CCTC
Z ebrafish TCCACTCAATAAACTGACATGG CG CTCATATTTCCTTTTATTTCCCCGACGATAAAG GAG
TGCCGCCGCGAGACTAGCACGAGGAGGGAATCGTATTTTGGTCCGCAGCTCC IIIIIIC
TTTCCCTTTCTTCCC 11111 GGCGCACTGTGCCAACATGATTGATTGTGACTCGCAAACC
GGGTGTCCAGCTCTGCCCAACAAATGACTTTGGCCCCTACCAGTAGACCTTGACCAGAC
AG AAATCAATATTT CA C CATTAAAATCTAT CAAA G AA G A G TTAA G G CTG CA G CTGTC CA
AGGCGCCCTTTTGAACATTAAATCCGACACTTGTAGTACACGGGTAATCAATATATAGT
G GTTCA CAG AT CATTTG TG GTCACCTTTTTG GTCGTGATG GATACTTG GAG GAGTC GT G
ATTCATTTTGTCACCCCATTAAAG C G AA CTGTG TCAA G TC GTT CCTTCATTTTATCTG GA
AG AGATTC CTATTG CT CAAA CTATGAG GGAAAGTATATG GG GAAAG GGGG GTTG TA G
CG GTAAATG AA G A G CA C CA G C CTC CA G G TTC C CATTT CAATG G G AATCTATAG A G
ATTT
TGTGTCCAGCGGAGTGTGAAAATCCCTTTGAGATAGAACAAACATTCTAGGAGACCAA
GCCACACGGCTGATACATACAGAATAGATGGGAGTACATTTACAAGCCATTACAGATT
AA G TTTA G CTTG G A CAAA CA G AATTTTA G ATG AATATAATCATTATG CAATATCCA C CA
GCCTTAG CGGACAAAGCCATTTAACAAAACAGTTATCAGTAAATGTATATG CTC CT CTTT
54
CA 03083183 2020-05-21
WO 2019/103967
PCT/US2018/061802
TTGTATATGTTTTAG CTTTGATCGACTG CATG CTATTTAGTGTTTTCAG GTCAACCTAAA
ATAAAAAG GATG GTGTCTTTTAATCACTGAG GAAG GG GTTATCTTATTCAGTCAATCCC
AAGAG CAGACTCCTG CCTG CCTACTTGTTTTATTCTCCAAGACTGTATCCCGTTTTTACA
GTAG CTCATCCAGTGACTGAAGTGATCGTCCCATAG CCCTCACATAACCCATATG CTGT
CGTATACCTG CTG CG GG GAAGATTATTAGTTACAAG CTACTGTCATTAAAAATGGATTT
ATTCACCCTCTGCAGG G AG CAG ATCTG CCCTCCTG GTCACAAATGTACCATAACAGTAT
GCATG GTG G G CTTTCTCCGACTCAG G CTCATTCTGATTATGTACCCCTATATACATTTCT
GGAGAGCGCCAAATACGCCCCAGGAGGTATG 1111111 TGCAGTTTTTGTTTTCGCAAA
TCTG CCAG AG GTCACTGTATG CCTTTTCAGACCTTAAATTTCTCTG GCGTGTG CCATTTG
TGCCTG CTCTTCTCG CGTAAATCCACCAG AG G CTG CCGTCG ACTG ACTGACTG ACCG AC
CAATGCCAACACAAAGTGGTTCGATAAACAATCC
Table 3
application Forward (5'-3') SEQ ID Reverse (5'-3') SEQ ID
NO.: NO.:
THOR qRT-PCR CAAGGTGCTTCTC 4 GC CAAAGTCATTT 5
TCTGGATTT GTTGGGTAT
IGF2 qRT-PCR GC GGCTTCTACTT 6 CAGGTGTCATATT 7
CAGCAG GGAAGAAC
CD44 qRT-PCR AGAAGGTGTGGG 8 AAATGCACCATTT 9
CAGAAGAA CCTGAGA
UBC qRT-PCR AAGATGGACGCA 10 CCTCAAGCGCAG 11
CCCTGTC GACCAAGT
ACTB qRT-PCR AAGGCCAACCGC 12 ACAGCCTGGATAG 13
GAGAAG CAACGTACA
MAPT qRT-PCR TACACCATGCACC 14 GTCTCCAATGC CT 15
AAGAC GCTTCTT
PABPC1 qRT-PCR AGCAAATGTTGGG 16 AC CGGTGGCACTG 17
TGAACGG TTAACTG
KRA S qRT-PCR ACACAAAACAGG 18 AGGCATCATCAAC 19
CTCAGGACT AC CCTGT
MYC qRT-PCR CTTCTCTCCGTCC 20 GAAGGTGATCCA 21
TCGGATTCT GACTCTGACCTT
PTEN qRT-PCR GCTACCTGTTAAA 22 CATGAACTTGTCT 23
GAATCATCTGG TCCCGT
GLI1 qRT-PCR AGGGAGTGCAGC 24 ATTGGCCGGAGTT 25
CAATACAG GATGTAG
BTRC qRT-PCR CCCGTGCTCCTGC 26 CGGAATGCTCCAC 27
AGGGACA AAGGGTCCG
PPP1R9B qRT-PCR AGCCGGAAGATC 28 GTTGCGACGATCG 29
CATTTCA TAATC CT
CA 03083183 2020-05-21
WO 2019/103967
PCT/US2018/061802
H19 qRT-PCR AGAAGCGGGTCT 30 TGCAGCATATTCA 31
GTTTCTTT TTTCCAA
CTNNB 1 qRT-PCR CACAAGCAGAGT 32 GATTCCTGAGAGT 33
GCTGAAGGTG CCAAAGACAG
GAPDH qRT-PCR TGCACCACCAACT 34 GGCATGGACTGTG 35
GCTTAGC GTCATGAG
HMBS qRT-PCR 36 37
GATGGGCAACTGT TGGGGCCCTCGTG
AC CTGACTGGA GAATGTTA
TERC qRT-PCR GTGGTGGCCATTT 38 TGCTCTAGAATGA 39
TTTGTCTAAC AC GGTGGAA
TINCR qRT-PCR TGTGGCCCAAACT 40 AGATGACAGTGG 41
CAGGGATACAT C TGGAGTTGTCA
HOTAIR qRT-PCR CCAGTTCTCAGGC 42 GTTTTACATGTGG 43
GAGAGC TGAATAT
NEAT1 qRT-PCR GCTGGACCTTTCA 44 TGAACTCTGCCGG 45
TGTAACGGG TACAGGGAA
m-THOR qRT-PCR CCGACACTTGTAC 46 GAACTGGACAGA 47
CACACGGGTAA ATCTTGT
m-Gapdh qRT-PCR AC CACAGTCCATG 48 CACCACCCTGTTG 49
CCATCAC CTGTAGCC
z-THOR qRT-PCR GAGTTAAGGCTGC 50 CCCGTGTACTACA 51
AGCTGTC CAA AGTGTCGGATT
z-gapdh qRT-PCR CCAAGGCTGTAGG 52 GGACTGTCAGATC 53
CAAAGTAAT CACAACAGA
z-myca qRT-PCR AAGAAGGCGACA 54 TTTCGCCTCAGCT 55
GAGTGCAT GTTCTTT
z-igf2a qRT-PCR GAGTCCCATCCAT 56 TCCTTTGTTTGTTG 57
TCTGTTG CCATTTG
z-igf2b qRT-PCR CTGCCATGGATGA 58 CATGGACAATGAC 59
TTACCATGTATT AGAACGAAGAC
z-kras qRT-PCR GGCTTCCTCTGTG 60 CTTATTCCCCACC 61
TCTTTGC AGAACCA
z-actbl qRT-PCR CGAGCAGGAGAT 62 CAACGGAAAC GC 63
GGGAACC TCATTGC
z-glil qRT-PCR CAGACGTCCTCTC 64 AGTAGCGCTGTCC 65
GC CTTAC TTGCATT
z-ctnnbl qRT-PCR ATCCTGTCCAACC 66 TCTCTGCATCCTG 67
TGACCTG GTGTCTG
56
CA 03083183 2020-05-21
WO 2019/103967
PCT/US2018/061802
z-ptena qRT-PCR CAAGGGTGAGCG 68 CGGCTGGAAAGC 69
AGGCACGG CCATGGCA
z-ptenb qRT-PCR TCGCCTCTGACTG 70 TGAGGCTAGACG 71
GGAATAGTC GAGCGCGA
z-pabpcla qRT-PCR CGGGACCCATTCT 72 GATGTTACCCACA 73
GTCTATC CCGCTCT
z-pabpc lb qRT-PCR TCCACAGGAACA 74 TCCACAGGAACA 75
GAAGCAGA GAAGCAGA
h-THOR-in vitro-#1 in vitro RNA CTAATACGACTCA 76 AAATATTTGGCTT 77
transcription CTATAGGGAGAA TCCCCGGCC
GCCGAGTTCGCGC
CGCCGGTA
h-THOR-in vitro-#2 in vitro RNA CTAATACGACTCA 78 CTAATGATGTTTG 79
transcription CTATAGGGAGAA CTTCACTGCC
GCCGAGTTCGCGC
CGCCGGTA
h-THOR-in vitro-#3 in vitro RNA CTAATACGACTCA 80 ATAGATTTTAATG 81
transcription CTATAGGGAGAA GTGAAA
GCCGAGTTCGCGC
CGCCGGTA
h-THOR-in vitro-#4 in vitro RNA CTAATACGACTCA 82 TGGACAGAATCTT 83
transcription CTATAGGGAGAA GTTTAATGG
GCCGAGTTCGCGC
CGCCGGTA
h-THOR-in vitro-#5 in vitro RNA CTAATACGACTCA 84 AGCCGAGTTCGCG 85
transcription CTATAGGGAGATG CCGCCGGTA
GACAGAATCTTGT
TTAATGG
h-THOR-in vitro-#6 in vitro RNA CTAATACGACTCA 86 TGGACAGAATCTT 87
transcription CTATAGGGAGAA GTTTAATGG
GCCGAGTTCGCGC
CGCCGGTA
h-THOR-in vitro-#7 in vitro RNA CTAATACGACTCA 88 TGGACAGAATCTT 89
transcription CTATAGGGAGACC GTTTAATGG
TGCCGTCCTGGTG
AACACAAT
h-THOR-in vitro-#8 in vitro RNA CTAATACGACTCA 90 TGGACAGAATCTT 91
transcription CTATAGGGAGAGT GTTTAATGG
57
CA 03083183 2020-05-21
WO 2019/103967
PCT/US2018/061802
GGCTGGACTCAGA
CACAT
h-THOR-in vitro-#9 in vitro RNA CTAATACGACTCA 92 TGGACAGAATCTT 93
transcription CTATAGGGAGAC GTTTAATGG
AAAGAAGAGTTA
AGGCACC
h-THOR-in vitro- in vitro RNA CTAATACGACTCA
94 ATAGATTTTAATG 95
#10 transcription CTATAGGGAGAGT GTGAAA
GGCTGGACTCAGA
CACAT
z-THOR-in vitro-#1 in vitro RNA CTAATACGACTCA 96 GGATTGTTTATCG 97
transcription CTATAGGGAGAA AACCACT
CTACCGCAGCCAC
TATGCA
z-THOR-in vitro-#2 in vitro RNA CTAATACGACTCA 98 TGCATAGTGGCTG 99
transcription CTATAGGGAGAA CGGTAGT
GTGGTTCGATAAA
CAATCC
z-THOR-in vitro-#3 in vitro RNA CTAATACGACTCA 100 TTGACACAGTTCG 101
transcription CTATAGGGAGAA CTTTAATG
CTACCGCAGCCAC
TATGCA
z-THOR-in vitro-#4 in vitro RNA CTAATACGACTCA 102 GGATTGTTTATCG 103
transcription CTATAGGGAGAGT AACCACT
CGTTCCTTCATTTT
ATCTG
z-THOR-gRNA-5 CRISPR TACGATTGCACTG 104 AAACTTTCTCAAC 105
GTTGAGAAA CAGTGCAAT
z-THOR-gRNA-3' CRISPR TAGGTCACCTTTT 106 AAACTCACGACC 107
TGGTCGTGA AAAAAGGTGA
z-THOR-genotyping CRISPR CCGAGAGAGAGA 108 CTGCTCTTGGGAT 109
CGATTCCA TGACTGAA
GeneRacer 5' Primer RACE NA CGACTGGAGCAC 110
GAGGACACTGA
GeneRacer 5' RACE NA GGACACTGACATG 111
Nested Primer GACTGAAGGAGT
A
58
CA 03083183 2020-05-21
WO 2019/103967
PCT/US2018/061802
GeneRacer 3 Primer RACE GCTGTCAACGATA 112 NA
CGCTACGTAACG
GeneRacer 3' RACE CGCTACGTAACGG 113 NA
Nested Primer CATGACAGTG
z-THOR 5' Primer RACE NA GACCAAAAAGGT 114
GACCACAAAT
z-THOR 5' Nested RACE NA CCCGTGTACTACA 115
Primer AGTGTCGGATT
z-THOR 3' Primer RACE CAAATGACTTTGG 116 NA
CCCCTACCA
z-THOR 3' Nested RACE GAGTTAAGGCTGC 117 NA
Primer AGCTGTCCAA
m-THOR 5' Primer RACE NA TCACACACCATAG 118
AGAGGCGGCAGG
GA
m-THOR 5' Nested RACE NA GCCGGACACCCA 119
Primer GTTGGCCTAGCGT
AATC
m-THOR 3' Primer RACE TCCCTGCCGCCTC 120 NA
TCTATGGTGTGTG
A
m-THOR 3' Nested RACE TTGTGGTCCCCCT 121 NA
Primer TTAGCAGTGATGG
A
h-THOR-cloning Cloning AGCCGAGTTCGCG 122 TGGACAGAATCTT 123
CCGCCGGTA GTTTAATGG
z-THOR-cloning Cloning ACTACCGCAGCCA 124 TGGATTGTTTATC 125
CTATGCA GAACCAC
EGFP-pME zebrafish AAAAAGTCGACG 126 AAAAGATCTGAGT 127
melanoma CCACCATGGTGAG CCGGACTTGTACA
model CAAGGGCGAGGA GCTCGTCCATGC
NRAS61K-pME zebrafish AAAAGATCTATGA 128 AAAGGATCCTTAC 129
melanoma CTGAGTACAAACT ATCACCACACATG
model GGTG GCA
mitfa-promoter-p5E zebrafish AAAGGTACCGTTA 130
AAAGGATCCGTTA 131
melanoma AGGCAGACTCATT AGGCAGACTCATT
model TTTTAC TTTTAC
59
CA 03083183 2020-05-21
WO 2019/103967
PCT/US2018/061802
Halo-IGF2BP1-WT cloning GACCGCGATCGCC 132 GTGAGTTTAAACC 133
cloning AACAAGCTTTACA TTCCTCCGTGCCT
TCGGCAACCTCAA GGGCCT
Halo-IGF2BP1-del- inverse PCR GAGCAGATAGCA 134
CATGGTGGGCCTT 135
RRM CAGGGACC GACGGCCCTT
Halo-IGF2BP1-del- inverse PCR TTGGAGATTATGC 136
CACTTGCTGCTGC 137
KH1 ATAAAGAGGC TTGGCTG
Halo-IGF2BP1-del- inverse PCR ATGAAGAAAGTTC 138
GTCAGCCGTTTTG 139
KH2 GGGAGGC GTGTCCT
Halo-IGF2BP1-del- inverse PCR ATCTATGGCAAAC 140
GGGAGCCTGCATA 141
KH3 TCAAGG AAGGAGC
Halo-IGF2BP1-del- inverse PCR ATCCGAGACATCC 142
TTCCTCCTTGGGA 143
KH4 TGGCCCA CCAAAGA
Halo-IGF2BP1-del- inverse PCR ATGAAGAAAGTTC 144
CACTTGCTGCTGC 145
KH(1+2) GGGAGGC TTGGCTG
Halo-IGF2BP1-del- inverse PCR ATCCGAGACATCC 146
GGGAGCCTGCATA 147
KH(3+4) TGGCCCA AAGGAGC
Halo-IGF2BP1-del- inverse PCR ATCCGAGACATCC 148
CACTTGCTGCTGC 149
KH(1+2+3+4) TGGCCCA TTGGCTG
h-THOR Northern GTGGCTGGACTCA 150 cTAATACGACTCA 151
blotting probe GACACAT CTATAGggagaTGG
ACAGAATCTTGTT
TAATGGTCTGAC
h-GAPDH Northern CCCTTCATTGACC 152 CTAATACGACTCA 153
blotting probe TCAACTACATGG CTATAGGGAGAA
GTCTTCTGGGTGG
CAGTGAT
z-THOR Northern AGTGCCGCCGCG 154 cTAATACGACTCA 155
blotting probe AGACTAGCA CTATAGggagaTTG
ACACAGTTCGCTT
TAATG
z-gapdh Northern GTATGACAATGAG 156 CTAATACGACTCA 157
blotting probe TTCGGTT CTATAGGGAGAC
ATTTCTCACAAAC
AGAGGAC
h-THOR-gRNA-#1 CRISPR CACCgAGGGTGTA 158 AAACTCTAGCCCG 159
GCGCGGGCTAGA CGCTACACCCTc
h-THOR-gRNA-#2 CRISPR CACCgGTAGGTGC 160 AAACCTGGCATGG 161
TGCCATGCCAG CAGCACCTACc
CA 03083183 2020-05-21
WO 2019/103967
PCT/US2018/061802
h-THOR-gRNA-#3 CRISPR CACCgGTTCCAAG 162 AAACGAGAGAAG 163
GTGCTTCTCTC CACCTTGGAACc
h-THOR-gRNA-#4 CRISPR CACCgTGAAATAT 164 AAACGACAGAAA 165
TGATTTCTGTC TCAATATTTCAc
h-THOR-gRNA-#5 CRISPR CACCgTTCACACA 166 AAACCCTCTCTAT 167
CCATAGAGAGG GGTGTGTGAAc
h-THOR- CRISPR cgaggaacgaaaatgagattt 168 tggacagaatcttgtttaatgg
169
genotyping gg
h-18S qRT-PCR ctcaacacgggaaacctcac 170 cgctccaccaactaagaacg 171
h-THOR-exl qRT-PCR CGGTAGGTGCTGC 172 CGGCCACGTCTGT 173
CATGC TCTATTT
Pre-adenylated iCLIP rAppAGATCGGAA 174
adapter L3 GAGCGGTTCAG/dd
C/
iCLIP RT primer- iCLIP NNatcacgNNNNNN 175
LacZ-#1 AGATCGGAAGAG
CGTCGTGgatcCTG
AACCGC
iCLIP RT primer- iCLIP NNcgatgtNNNNNNA 176
LacZ-#2 GATCGGAAGAGC
GTCGTGgatcCTGA
ACCGC
iCLIP RT primer- iCLIP NNttaggcNNNNNNA 177
THOR-#1 GATCGGAAGAGC
GTCGTGgatcCTGA
ACCGC
iCLIP RT primer- iCLIP NNtgaccaNNNNNN 178
THOR-#2 AGATCGGAAGAG
CGTCGTGgatcCTG
AACCGC
h-THOR-exl cloning AGCCGAGTTCGCG 179 AAATATTTGGCTT 180
CCGCCGGTA TCCCCGGCC
lenti-THOR 5 RACE NA GCCAAAGTCATTT 181
Primer GTTGGGTAT
lenti-THOR 5' RACE NA CGGCCACGTCTGT 182
Nested Primer TCTATTT
lenti-THOR 3' RACE CGGTAGGTGCTGC 183 NA
Primer CATGC
lenti-THOR 3' RACE CAAGGTGCTTCTC 184 NA
Nested Primer TCTGGATTT
61
CA 03083183 2020-05-21
WO 2019/103967
PCT/US2018/061802
Table 4
sequence(5'-3') SEQ ID NO.: catalog number
siNT D-001810-10
siTHOR-#A CUACAUGGGUAAUCAAUAU 185 custom
siTHOR-#B CUAUGGUGUGUGAACAUUA 186 custom
siIGF2-# 1 J-004093-05
siIGF2-#2 J-004093-07
siCD44-#1 J-009999-07
siCD44-#2 J-009999-09
siIGF2BP 1-#1 J-003977-06
siIGF2BP1-#2 J-003977-07
Table 5
application sequence(5'-3') SEQ ID NO.:
THOR-probe-#1 cell line FISH catcagccggcgtttcag 187
THOR-probe-#2 cell line FISH cgctctcgcctttgtcag 188
THOR-probe-#3 cell line FISH cgaactcggctgctgtgg 189
THOR-probe-#4 cell line FISH tggcatggcagcacctac 190
THOR-probe-#5 cell line FISH cgtctgttctatttctgct 191
THOR-probe-#6 cell line FISH aaatatttggctttccccg 192
THOR-probe-#7 cell line FISH cgattgtgttcaccaggac 193
THOR-probe-#8 cell line FISH tgtttgcttcactgccttg 194
THOR-probe-#9 cell line FISH ctgagtccagccacctaat 195
THOR-probe-#10 cell line FISH ccaaactggagcgtgatgt 196
THOR-probe-#11 cell line FISH tccagagagaagcaccttg 197
THOR-probe-#12 cell line FISH tttttggcaaggcaggtga 198
THOR-probe-#13 cell line FISH ttggcccagcgtaatcaat 199
THOR-probe-#14 cell line FISH gttgggtattgccggacac 200
THOR-probe-#15 cell line FISH tgttaggggccaaagtcat 201
THOR-probe-#16 cell line FISH tactgtctggccaagacc 202
THOR-probe-#17 cell line FISH atggtgccttaactcttct 203
THOR-probe-#18 cell line FISH atagagaggcggcagggac 204
62
CA 03083183 2020-05-21
WO 2019/103967 PCT/US2018/061802
THOR-probe-#19 cell line FISH gtgtcggatttaatgttca 205
THOR-probe-#20 cell line FISH ttgattacccatgtagtac 206
THOR-probe-#21 cell line FISH atgatctgtgaaccactatat 207
THOR-probe-#22 cell line FISH tcactgctaaaagggaaccac 208
THOR-probe-#23 cell line FISH atcacaacgattccagacatc 209
THOR-probe-#24 cell line FISH atcttgtttaatggtctgaca 210
Table 6
application company catalog number
IGF2 WB Sigma 5AB1408589
CD44 WB Cell Signaling Technology #3578
IGF2BP1 WB, RIP MBL RN007P
HuR WB, RIP Millipore 03-102
Total H3 WB Cell Signaling Technology #9715
Myc-Tag WB, pull- MBL M047-3
down
MEK WB Cell Signaling Technology #9146
p-MEK WB Cell Signaling Technology #9121
ERK WB Cell Signaling Technology #9102
p-ERK WB Cell Signaling Technology #9101
Rabbit Polyclonal IgG RIP MBL PM035
IGF2BP2 WB, RIP MBL RN008P
IGF2BP3 WB, RIP MBL RN009P
STAU1 WB, RIP MBL RN012P
YBX1 WB, RIP MBL RN015P
Melan-A IHC DAKO M719629-2
p-ERK IHC Cell Signaling Technology #9106
Halo-tag WB Promega G9281
All publications and patents mentioned in the above specification are herein
incorporated
by reference. Various modifications and variations of the described method and
system of the
disclosure will be apparent to those skilled in the art without departing from
the scope and spirit
of the disclosure. Although the disclosure has been described in connection
with specific
63
CA 03083183 2020-05-21
WO 2019/103967
PCT/US2018/061802
preferred embodiments, it should be understood that the disclosure as claimed
should not be
unduly limited to such specific embodiments. Indeed, various modifications of
the described
modes for carrying out the disclosure that are obvious to those skilled
relevant fields are
intended to be within the scope of the following claims.
64