Note: Descriptions are shown in the official language in which they were submitted.
CA 03127833 2021-07-26
WO 2020/154807
PCT/CA2020/050108
- 1 -
SYSTEM AND METHOD FOR GENERATING PERFUSION FUNCTIONAL MAPS FROM
TEMPORALLY RESOLVED HELICAL COMPUTED TOMOGRAPHIC IMAGES
CROSS-REFERENCE
[0001] This
application claims the benefit of United States Provisional Patent
Application No. 62/798,358, filed January 29, 2019, and the entire contents of
United
States Provisional Patent Application No. 62/798,358 is hereby incorporated by
reference.
FIELD
[0002] Various
embodiments are described herein that generally relate to the
generation of perfusion functional maps from Time-Resolved Helical Computed
Tomography Angiograms.
BACKGROUND
[0003] Stroke is
a leading cause of morbidity and the third leading cause of death
in developed countries. For example, in Canada, there are about 50,000 strokes
per
year and about 300,000 people living with the effects of stroke. When a person
suffers
a stroke, a stroke specialist, such as a stroke clinician or a neurologist,
must determine
the severity of the stroke in order to determine a treatment method, which
typically
involves some form of recanalization. Time is of the essence for treatment
since the
longer the person goes without receiving treatment after suffering a stroke,
the larger
the amount of neurons and synapses that are damaged which makes it
increasingly
difficult for the person to recover and may result in loss of motor and neural
function
for the person as well as premature aging.
[0004] In order
to aid the stroke specialist to determine the severity of the stroke, a
typical CT stroke imaging protocol has been developed worldwide. At all
centres, an
admission non-contrast CT image is acquired to rule out any stroke mimic blood
in the
brain. Next, at most centres, a contrast enhanced (iodinated inert fluid)
single phase
CTA (sCTA) is acquired to provide information on the large vessels of he
brain,
potentially providing vascular occlusion location if present. However, it is
not suitable
for determining the viability state of tissue. Therefore, to look at the
tissue state,
another acquisition may be used, CT Perfusion (CTP), in which another dose of
an CT
contrast agent is used to determine the hemodynamic temporal changes in brain
tissue. The changes in brain tissue density over time depend on the changes in
iodine
CA 03127833 2021-07-26
WO 2020/154807
PCT/CA2020/050108
- 2 -
concentration which in turn is a reflection of the nature of brain tissue
vascularity. While
CTP provides valuable information about the viability of brain tissue during,
its
downsides are that it subjects the patient to increased amounts of harmful X-
ray
radiation (a dose similar to what a person is subjected to in one year on
earth), needs
another CT contrast agent injection which has implications for renal failure
in some
patients, and also requires the acquisition and remote processing of a large
amount
of imaging data, which requires additional infrastructure and is an added
expense to
hospitals.
[0005] Multiphase CT Angiography (mCTA), which has been developed to
assess
in pial artery filling (surrogate for collateral efficiency to the ischemic
tissue at risk),
may represent a compromise between the time to gather data, the quality of the
gathered data and reducing the amount of exposure of the person to X-ray
radiation
and image contrast agent (Menon, et al. 2015) . For example, mCTA has been
found
to improve clot detection versus single phase CTA (Volny et al., 2017) while
also using
a lower X-ray and image contrast agent dose than when CTP is used. The mCTA
imaging protocol also has faster image data acquisition for the whole brain
and
requires less data processing. However, the interpretation of mCTA imaging
data is
difficult and subjective as the mCTA imaging data is currently presented to
the stroke
specialist in a raw format after image reconstruction has been performed and
does not
look at the state of the tissue, which is crucial for many patients whose
stroke onset
time is unknown.
[0006] Accordingly, the stroke imaging community is still trying to find a
balance
between the complexity of obtaining and interpreting CT images, achieving high
accuracy of diagnosis and selection of the treatment method and minimizing the
time
to diagnosis and treatment decision.
SUMMARY OF VARIOUS EMBODIMENTS
[0007] In accordance with one broad aspect of the teachings provided
herein, there
is provided a system for providing at least one Computed Tomography
Angiography
(CTA) perfusion functional map, wherein the system comprises: at least one
processor
that is configured to: obtain Time Resolved Helical CTA (TRH-CTA) image data;
preprocess the TRH-CTA helical image data to generate preprocessed TRH-CTA
helical image data; generate time density curve data for a plurality of voxels
from the
CA 03127833 2021-07-26
WO 2020/154807
PCT/CA2020/050108
- 3 -
preprocessed TRH-CTA helical image data for an axial imaging slice, where the
time
density curve data comprise intensity values for different phases of the
preprocessed
TRH-CTA helical image data arranged sequentially in time; generate the at
least one
perfusion functional map for the axial imaging slice by at least one of: (1)
applying at
least one mapping function to different phases of the time density curve data
corresponding to the axial imaging slice; (2) applying a deconvolution method
to the
time density curve data; and (3) applying a non-deconvolution method to the
time
density curve data; and perform filtering in the spatial domain or the
frequency domain
on the at least one perfusion functional map; and a display that is coupled to
the at
least one processor for receiving and displaying the at least one filtered
perfusion
functional map.
[0008] In at least one embodiment, the at least one processor is
configured to
obtain the TRH-CTA image data by loading TRH-CTA image data from a data store
or
receiving the TRH-CTA image data from a CT scanner where the TRH-CTA image
data was obtained by the CT scanner from a patient after the patient received
a bolus
of imaging contrast agent.
[0009] In at least one embodiment, at least one processor is configured to
preprocess the TRH-CTA image data by: generating raw TRH-CTA image by
performing reconstruction on the TRH-CTA image data; separating the raw TRH-
CTA
image data into separate groups of TRH-CTA time series data where each group
corresponds to a distinct phase of the TRH-CTA image data; and performing
registration on the separate groups of TRH-CTA time series data to align the
separate
groups of TRH-CTA time series data in 3D space.
[0010] In at least one embodiment, the at least one processor is further
configured
to generate the preprocessed TRH-CTA helical image data by: applying a first
threshold to the groups of TRH-CTA time series data to remove or reduce
contributions from a skull of the patient to values of the time series data
points; and
applying a second threshold to the groups of TRH-CTA time series data to
remove or
reduce contributions from cerebrospinal fluid of the patient to values of the
time series
data points.
[0011] In at least one embodiment, the at least one processor is
configured to apply
the mapping function to create a delay map for a plurality of pixels
corresponding to
CA 03127833 2021-07-26
WO 2020/154807
PCT/CA2020/050108
- 4 -
the axial imaging slice by, for a given pixel, selecting a highest intensity
value of the
time density curve data for the voxel that corresponds to the given pixel.
[0012] In at least one embodiment, the at least one processor is
configured to apply
the mapping function to create a first blood flow map for a plurality of
pixels
corresponding to the axial imaging slice by, for a given pixel, determining a
slope of
the intensity value of the time density curve data over first and second
phases of the
voxel that corresponds to the given pixel.
[0013] In at least one embodiment, the at least one processor is
configured to apply
the mapping function to create a second blood flow map for a plurality of
pixels
corresponding to the axial imaging slice by, for a given pixel, determining a
slope of
the intensity value of the time density curve data over second and third
phases of the
voxel that corresponds to the given pixel.
[0014] In at least one embodiment, the at least one processor is
configured to
generate a flow average perfusion functional map by averaging the first and
second
blood flow maps.
[0015] In at least one embodiment, the at least one processor is
configured to apply
the mapping function to create a blood volume map for a plurality of pixels
corresponding to the axial imaging slice by, for a given pixel, performing an
integral of
the time density curve data of the voxel that corresponds to the given pixel.
[0016] In at least one embodiment, the at least one processor is configured
to apply
the mapping function to create a washout map for a plurality of pixels
corresponding
to the axial imaging slice by, for a given pixel, subtracting an intensity
value of a third
phase from a highest intensity value of all phases of the time density data
for the voxel
that corresponds to the given pixel.
[0017] In at least one embodiment, the at least one processor is configured
to apply
the deconvolution to the time density curve data corresponding to the axial
imaging
slice by using an arterial input function.
[0018] In at least one embodiment, the deconvolution is implemented based
on
one of a Fourier transform based deconvolution, standard truncated singular
value
decomposition (sSVD), block-circulant truncated SVD (bSVD), Tikhonov
regularization and sparse perfusion deconvolution (SPD).
CA 03127833 2021-07-26
WO 2020/154807
PCT/CA2020/050108
- 5 -
[0019] In at least one embodiment, the at least one processor is
configured to apply
the non-deconvolution to the time density curve data by applying a function
that
doesn't involve deconvolution including one of multiplication, subtraction,
division, max
slope approach, and the Patlak model.
[0020] In at least one embodiment, the at least one processor is configured
to apply
the mapping function to create a combination map for a plurality of pixels
corresponding to the axial imaging slice by, for a given pixel, generating at
least two
functional maps and then combining the at least two functional maps by: (a)
optionally
applying coefficients to the at least two functional maps followed by applying
a linear
or non-linear function to combine the at least two functional maps or (b) by
applying a
machine learning model to the at least two functional maps.
[0021] In at least one embodiment, the machine learning model comprises at
least
one of a logistic regression model, a decision tree, a support vector machine,
principle
component analysis, a random forest, and a neural network.
[0022] In at least one embodiment, the at least one processor is further
configured
to apply filtering to the at least one perfusion functional map by applying at
least one
of: (a) spatial filtering including moving average filtering, 3D Gaussian
filtering, bilateral
Gaussian filtering followed by a full Gaussian blur, or guided filtering, (b)
spectral
filtering including bandpass, low pass, high pass or band stop filtering in
the frequency
domain, or (c) iterative spatial and/or frequency filtering.
[0023] In at least one embodiment, the at least one processor is further
configured
to apply at least one threshold to the at least one perfusion functional map
to generate
an infarct and/or penumbra output volume for the axial imaging slice and
display the
infarct and/or penumbra output volume.
[0024] In at least one embodiment, the at least one processor is further
configured
to apply additional filtering after the thresholding to remove small objects
including
small infarcts that are noise.
[0025] In at least one embodiment, the at least one processor is further
configured
to obtain and display a Non-Contract CT (NCCT) image, a CTA and/or a
collateral
image for the axial imaging slice.
CA 03127833 2021-07-26
WO 2020/154807
PCT/CA2020/050108
- 6 -
[0026] In accordance with one broad aspect of the teachings provided
herein, there
is provided a method for providing at least one Computed Tomography
Angiography
(CTA) perfusion functional map, wherein the method is performed by at one
processor
and the method comprises: obtaining Time Resolved Helical CTA (TRH-CTA) image
data; preprocessing the TRH-CTA helical image data to generate preprocessed
TRH-
CTA helical image data; generating time density curve data for a plurality of
voxels for
an axial imaging slice from the preprocessed TRH-CTA helical image data, where
the
time density curve data comprise intensity values for different phases of the
preprocessed TRH-CTA helical image data arranged sequentially in time;
generating
the at least one perfusion functional map for the axial imaging slice by at
least one of:
(1) applying at least one mapping function to different phases of the time
density curve
data corresponding to the axial imaging slice; (2) applying a deconvolution
method to
the time density curve data; and (3) applying a non-deconvolution method to
the time
density curve data; performing filtering in the spatial domain or the
frequency domain
on the at least one perfusion functional map; and outputting, via a display,
the at least
one filtered perfusion functional map.
[0027] In at least one embodiment, the method comprises obtaining the TRH-
CTA
image data by loading TRH-CTA image data from a data store or receiving the
TRH-
CTA image data from a CT scanner where the TRH-CTA image data was obtained by
the CT scanner from a patient after the patient received a bolus of imaging
contrast
agent.
[0028] In at least one embodiment, the method comprises preprocessing the
TRH-
CTA image data by: generating raw TRH-CTA image by performing reconstruction
on
the TRH-CTA image data; separating the raw TRH-CTA image data into separate
groups of TRH-CTA time series data where each group corresponds to a distinct
phase of the TRH-CTA image data; and performing registration on the separate
groups of TRH-CTA time series data to align the separate groups of TRH-CTA
time
series data in 3D space.
[0029] In at least one embodiment, the method further comprises
generating the
preprocessed TRH-CTA helical image data by: applying a first threshold to the
groups
of TRH-CTA time series data to remove or reduce contributions from a skull of
the
patient to values of the time series data points; and applying a second
threshold to the
CA 03127833 2021-07-26
WO 2020/154807
PCT/CA2020/050108
- 7 -
groups of TRH-CTA time series data to remove or reduce contributions from
cerebrospinal fluid of the patient to values of the time series data points.
[0030] In at least one embodiment, the method comprises applying the
mapping
function to create a delay map for a plurality of pixels corresponding to the
axial
imaging slice by, for a given pixel, selecting a highest intensity value of
the time density
curve data for the voxel that corresponds to the given pixel.
[0031] In at least one embodiment, the method comprises applying the
mapping
function to create a first blood flow map for a plurality of pixels
corresponding to the
axial imaging slice by, for a given pixel, determining a slope of the
intensity value of
the time density curve data over first and second phases of the voxel that
corresponds
to the given pixel.
[0032] In at least one embodiment, the method comprises applying the
mapping
function to create a second blood flow map for a plurality of pixels
corresponding to
the axial imaging slice by, for a given pixel, determining a slope of the
intensity value
of the time density curve data over second and third phases of the voxel that
corresponds to the given pixel.
[0033] In at least one embodiment, the method comprises generating a flow
average perfusion functional map by averaging the first and second blood flow
maps.
[0034] In at least one embodiment, the method comprises applying the
mapping
function to create a blood volume map for a plurality of pixels corresponding
to the
axial imaging slice by, for a given pixel, performing an integral of the time
density curve
data of the voxel that corresponds to the given pixel.
[0035] In at least one embodiment, the method comprises applying the
mapping
function to create a washout map for a plurality of pixels corresponding to
the axial
imaging slice by, for a given pixel, subtracting an intensity value of a third
phase from
a highest intensity value of all phases of the time density data for the voxel
that
corresponds to the given pixel.
[0036] In at least one embodiment, the method comprises applying
deconvolution
to the time density curve data corresponding to the axial imaging slice by
using an
.. arterial input function.
CA 03127833 2021-07-26
WO 2020/154807
PCT/CA2020/050108
- 8 -
[0037] In at least one embodiment, the method comprises performing
deconvolution based on implemented based on one of a Fourier transform based
deconvolution, standard truncated singular value decomposition (sSVD), block-
circulant truncated SVD (bSVD), Tikhonov regularization and sparse perfusion
deconvolution (S PD).
[0038] In at least one embodiment, the method comprises applying the non-
deconvolution to the time density curve data by applying a function that
doesn't involve
deconvolution including one of multiplication, subtraction, division, max
slope
approach, and the Patlak model.
[0039] In at least one embodiment, the method comprises applying the
mapping
function to create a combination map for a plurality of pixels corresponding
to the axial
imaging slice by, for a given pixel, generating at least two functional maps
and then
combining the at least two functional maps by: (a) optionally applying
coefficients to
the at least two functional maps followed by applying a linear or non-linear
function to
combine at least two functional maps or (b) by applying a machine learning
model to
combine at least two functional maps. Preferably, each functional map may be
weighted according order of importance, given by the coefficient.
[0040] In at least one embodiment, the method comprises implanting the
machine
learning model by using one of a decision tree, a support vector machine,
principle
component analysis, a random forest, or a number of neural network options.
[0041] In at least one embodiment, the method comprises applying
filtering to the
at least one perfusion functional map by applying at least one of: (a) spatial
filtering
including moving average filtering, 3D Gaussian filtering, bilateral Gaussian
filtering
followed by a full Gaussian blur, or guided filtering; (b) spectral filtering
including
bandpass, low pass, high pass or band stop filtering in the frequency domain;
or (c)
iterative spatial and/or frequency filtering.
[0042] In at least one embodiment, the method comprises applying at least
one
threshold to the at least one perfusion functional map to generate an infarct
and/or
penumbra output volume for the axial imaging slice and display the infarct
and/or
penumbra output volume.
CA 03127833 2021-07-26
WO 2020/154807
PCT/CA2020/050108
- 9 -
[0043] In at least one embodiment, the method comprises applying
additional
filtering after the thresholding to remove small objects including small
infarcts that are
noise.
[0044] In at least one embodiment, the method comprises obtaining and
displaying
a Non-Contract CT (NCCT) image, a CTA and/or a collateral image for the axial
imaging slice.
[0045] In accordance with one broad aspect of the teachings provided
herein, there
is provided a non-transitory computer readable medium with program
instructions
stored thereon that, when executed by at least one processor, cause the at
least
processor to perform a method for providing at least one Computed Tomography
Angiography (CTA) perfusion functional map, wherein the method comprises:
obtaining Time Resolved Helical CTA (TRH-CTA) image data; preprocessing the
TRH-
CTA helical image data to generate preprocessed TRH-CTA helical image data;
generating time density curve data for a plurality of voxels for an axial
imaging slice
from the preprocessed TRH-CTA helical image data, where the time density curve
data comprise intensity values for different phases of the preprocessed TRH-
CTA
helical image data arranged sequentially in time; generating the at least one
perfusion
functional map for the axial imaging slice by at least one of: (1) applying at
least one
mapping function to different phases of the time density curve data
corresponding to
the at least one axial imaging slice; (2) applying a deconvolution method to
the time
density curve data; and (3) applying a non-deconvolution method to the time
density
curve data; performing filtering in the spatial domain or the frequency domain
on the
at least one perfusion functional map; and outputting, via a display, the at
least one
filtered perfusion functional map.
[0046] In at least one embodiment, the non-transitory computer readable
medium
stores computer code for performing other acts of the any one of the methods
described in accordance with the teachings herein.
[0047] In accordance with one broad aspect of the teachings provided
herein, there
is provided a method for providing images used to determine a treatment method
for
treating a stroke patient, wherein the method comprises: administering a bolus
of
image contrast agent to the patient; and generating and displaying at least
one TRH-
CA 03127833 2021-07-26
WO 2020/154807
PCT/CA2020/050108
- 10 -
CTA perfusion functional map according to any of the acts of the methods
described
in accordance with the teachings herein.
[0048] Other features and advantages of the present application will
become
apparent from the following detailed description taken together with the
accompanying
drawings. It should be understood, however, that the detailed description and
the
specific examples, while indicating preferred embodiments of the application,
are
given by way of illustration only, since various changes and modifications
within the
spirit and scope of the application will become apparent to those skilled in
the art from
this detailed description.
BRIEF DESCRIPTION OF THE DRAWINGS
[0049] For a better understanding of the various embodiments described
herein,
and to show more clearly how these various embodiments may be carried into
effect,
reference will be made, by way of example, to the accompanying drawings which
show
at least one example embodiment, and which are now described. The drawings are
not intended to limit the scope of the teachings described herein.
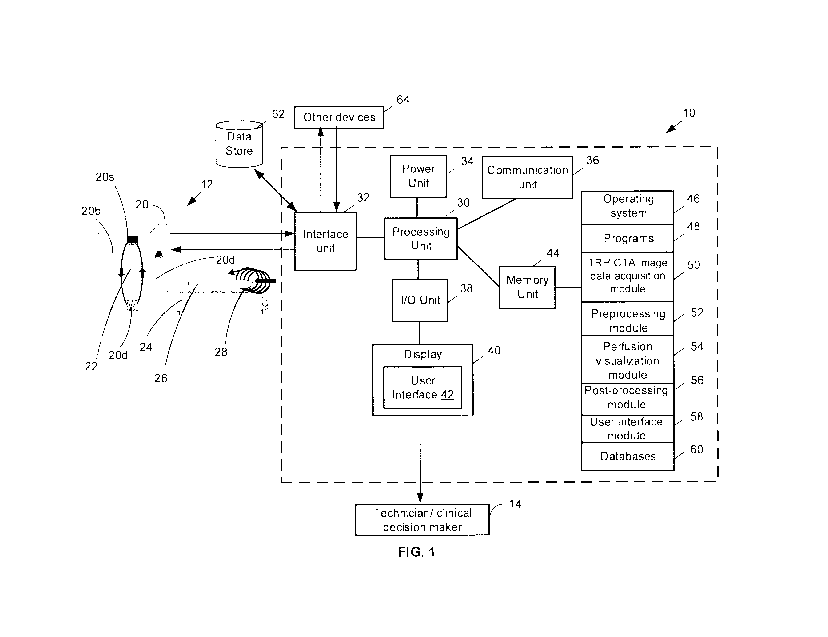
[0050] FIG. 1 shows a block diagram of an example embodiment of an imaging
system that can perform perfusion visualization based on Time-Resolved Helical
Computed Tomography Angiograms (TRH-CTA) image data.
[0051] FIG. 2A shows a flow chart diagram of an example embodiment of a
method
for performing an imaging workflow in accordance with the teachings herein.
[0052] FIG. 2B shows an example of TRH-CTA image data acquisition, with
each
phase represented by at least one arrow.
[0053] FIG. 2C shows an example of how time density curves can be
generated
for a given voxel of different TRH-CTA image volumes obtained for an axial
imaging
slice of a patient's brain.
[0054] FIG. 2D shows an example of time density curves for a voxel of
normal
tissue, slightly ischemic tissue and severely ischemic tissue.
[0055] FIG. 2E shows an example of a delay perfusion functional map
showing
highest intensity values for time density curve data for an axial imaging
slice of a
patient's brain.
CA 03127833 2021-07-26
WO 2020/154807
PCT/CA2020/050108
-11 -
[0056] FIG. 2F shows an
example of a blood flow perfusion functional map for an
axial imaging slice of a patient's brain.
[0057] FIG. 2G shows an
example of a blood volume perfusion functional map for
an axial imaging slice of a patient's brain.
[0058] FIG. 2H shows an
example of a combination perfusion functional map for
an axial imaging slice of a patient's brain that was generated by applying
several
functional maps as input to a machine learning model.
[0059] FIG. 21 shows a
flow chart diagram of another example embodiment of a
method for performing an imaging workflow in accordance with the teachings
herein.
[0060] FIGS. 3A-3D show
case study results for a single patient in which FIG. 3A
is a delay perfusion functional map, FIG. 3B is a flow average perfusion
functional
map, FIG. 30 is an MR diffusion weighted image and FIG. 3D is an amalgamated
histogram of all patients in the case study which may be used to determine an
optimal
threshold for generating the Delay perfusion functional map.
[0061] FIGS. 4A-4C show an
example of pairs of perfusion functional maps
determined for a patient where the first column of images (FIG. 4A) are
obtained using
the CTP framework, the second column of images (FIG. 4B) are obtained using
the
TRH-CTA framework described in accordance with the teachings herein and the
last
column of images (FIG. 40) are 24 hour diffusion weighted images (DWI).
[0062] FIGS. 5A-50 show an
example of pairs of perfusion functional maps
determined for a second patient where the first column of images (FIG. 5A) are
obtained using the CTP framework, the second column of images (FIG. 5B) are
obtained using the TRH-CTA framework described in accordance with the
teachings
herein and the last column of images (FIG. 5C) are 24 hour diffusion weighted
images
(DWI).
[0063] FIG. 6 shows a
plot of sensitivity for final infarction on 24 hour MRI versus
lesion size for TRH-CTA and CTP-Tmax maps.
[0064] FIGS. 7A-70 show the admission TRH-CTA map, the CTP Tmax map and
the 24 hour MR-DWI image for three patients respectively who underwent EVT for
M1
occlusions and had quality/fast reperfusion with the final infarct volume
being outlined
on the 24 hour MR-DWI image.
CA 03127833 2021-07-26
WO 2020/154807
PCT/CA2020/050108
- 12 -
[0065] Further aspects
and features of the example embodiments described herein
will appear from the following description taken together with the
accompanying
drawings.
DETAILED DESCRIPTION OF THE EMBODIMENTS
[0066] Various embodiments
in accordance with the teachings herein will be
described below to provide an example of at least one embodiment of the
claimed
subject matter. No embodiment described herein limits any claimed subject
matter.
The claimed subject matter is not limited to devices, systems or methods
having all of
the features of any one of the devices, systems or methods described below or
to
features common to multiple or all of the devices, systems or methods
described
herein. It is possible that there may be a device, system or method described
herein
that is not an embodiment of any claimed subject matter. Any subject matter
that is
described herein that is not claimed in this document may be the subject
matter of
another protective instrument, for example, a continuing patent application,
and the
applicants, inventors or owners do not intend to abandon, disclaim or dedicate
to the
public any such subject matter by its disclosure in this document.
[0067] It will be
appreciated that for simplicity and clarity of illustration, where
considered appropriate, reference numerals may be repeated among the figures
to
indicate corresponding or analogous elements or steps. In addition, numerous
specific
details are set forth in order to provide a thorough understanding of the
embodiments
described herein. However, it will be understood by those of ordinary skill in
the art
that the embodiments described herein may be practiced without these specific
details. In other instances, well-known methods, procedures and components
have
not been described in detail so as not to obscure the embodiments described
herein.
Also, the description is not to be considered as limiting the scope of the
embodiments
described herein.
[0068] It should also be
noted that the terms "coupled" or "coupling" as used herein
can have several different meanings depending in the context in which these
terms
are used. For example, the terms coupled or coupling can have a mechanical or
electrical connotation. For example, as used herein, the terms coupled or
coupling can
indicate that two elements or devices can be directly connected to one another
or
connected to one another through one or more intermediate elements or devices
via
CA 03127833 2021-07-26
WO 2020/154807
PCT/CA2020/050108
- 13 -
an electrical signal, an electrical connection, an electrical element, or a
mechanical
element depending on the particular context. Furthermore, certain coupled
electrical
elements may send and/or receive data.
[0069] Unless the context requires otherwise, throughout the specification
and
claims which follow, the word "comprise" and variations thereof, such as,
"comprises"
and "comprising" are to be construed in an open, inclusive sense, that is, as
"including,
but not limited to".
[0070] It should also be noted that, as used herein, the wording "and/or"
is intended
to represent an inclusive-or. That is, "X and/or Y" is intended to mean X or Y
or both,
for example. As a further example, "X, Y, and/or Z" is intended to mean X or Y
or Z or
any combination thereof.
[0071] It should be noted that terms of degree such as "substantially",
"about" and
"approximately" as used herein mean a reasonable amount of deviation of the
modified term such that the end result is not significantly changed. These
terms of
degree may also be construed as including a deviation of the modified term,
such as
by 1%, 2%, 5% or 10%, for example, if this deviation does not negate the
meaning of
the term it modifies.
[0072] Furthermore, the recitation of numerical ranges by endpoints herein
includes all numbers and fractions subsumed within that range (e.g. 1 to 5
includes 1,
1.5, 2, 2.75, 3, 3.90, 4, and 5). It is also to be understood that all numbers
and fractions
thereof are presumed to be modified by the term "about" or "approximately"
which
means a variation of up to a certain amount of the number to which reference
is being
made if the end result is not significantly changed, such as 1%, 2%, 5%, or
10%, for
example.
[0073] Reference throughout this specification to "one embodiment", "an
embodiment", "at least one embodiment" or "some embodiments" means that one or
more particular features, structures, or characteristics may be combined in
any
suitable manner in one or more embodiments, unless otherwise specified to be
not
combinable or to be alternative options.
[0074] As used in this specification and the appended claims, the singular
forms
"a," "an," and "the" include plural referents unless the content clearly
dictates
otherwise. It should also be noted that the term "or" is generally employed in
its
CA 03127833 2021-07-26
WO 2020/154807
PCT/CA2020/050108
- 14 -
broadest sense, that is, as meaning "and/or" unless the content clearly
dictates
otherwise.
[0075] Similarly, throughout this specification and the appended claims
the term
"communicative" as in "communicative pathway," "communicative coupling," and
in
variants such as "communicatively coupled," is generally used to refer to any
engineered arrangement for transferring and/or exchanging information.
Examples of
communicative pathways include, but are not limited to, electrically
conductive
pathways (e.g., electrically conductive wires, electrically conductive
traces), magnetic
pathways (e.g., magnetic media), optical pathways (e.g., optical fiber),
electromagnetically radiative pathways (e.g., radio waves), or any combination
thereof. Examples of communicative couplings include, but are not limited to,
electrical
couplings, magnetic couplings, optical couplings, radio couplings, or any
combination
thereof.
[0076] In addition, throughout this specification and the appended
claims, infinitive
verb forms are often used. Examples include, without limitation: "to detect,"
"to
provide," "to transmit," "to communicate," "to process," "to route", and the
like. Unless
the specific context requires otherwise, such infinitive verb forms are used
in an open,
inclusive sense, that is as "to, at least, detect", "to, at least, provide",
"to, at least,
transmit", and so on.
[0077] A portion of the example embodiments of the systems, devices, or
methods
described in accordance with the teachings herein may be implemented as a
combination of hardware or software. For example, a portion of the embodiments
described herein may be implemented, at least in part, by using one or more
computer
programs, executing on one or more programmable devices each comprising at
least
one processing element, and at least one data storage element (including
volatile and
non-volatile memory). These devices may also have at least one input device
(e.g., a
keyboard, a mouse, a touchscreen, and the like) and at least one output device
(e.g.,
a display screen, a printer, a wireless radio, and the like) depending on the
nature of
the device.
[0078] It should also be noted that there may be some elements that are
used to
implement at least part of the embodiments described herein that may be
implemented
via software that is written in a high-level procedural language such as
object-oriented
CA 03127833 2021-07-26
WO 2020/154807
PCT/CA2020/050108
- 15 -
programming. The program code may be written in Python, MATLABTm, Visual
Basic,
Fortran, C, C" or any other suitable programming language and may comprise
modules or classes, as is known to those skilled in object-oriented
programming.
Alternatively, or in addition thereto, some of these elements implemented via
software
may be written in assembly language, machine language, or firmware as needed.
[0079] At least some of the software programs used to implement at least
one of
the embodiments described herein may be stored on a storage media (e.g., a
computer readable medium such as, but not limited to, ROM, magnetic disk,
optical
disc) or a device that is readable by a general or special purpose
programmable
device. The software program code, when read by at least one processor of the
programmable device, configures the at least one processor to operate in a
new,
specific and predefined manner in order to perform at least one of the methods
described herein.
[0080] Furthermore, at least some of the programs associated with the
systems
and methods of the embodiments described herein may be capable of being
distributed in a computer program product comprising a computer readable
medium
that bears computer usable instructions, such as program code or program
instructions, for one or more processors. The program code may be preinstalled
and
embedded during manufacture and/or may be later installed as an update for an
already deployed computing system. The medium may be provided in various
forms,
including non-transitory forms such as, but not limited to, one or more
diskettes,
compact disks, tapes, chips, and magnetic and electronic storage, for example.
In
alternative embodiments, the medium may be transitory in nature such as, but
not
limited to, wire-line transmissions, satellite transmissions, internet
transmissions (e.g.
downloads), media, as well as digital and analog signals, for example. The
computer
useable instructions may also be in various formats, including compiled and
non-
compiled code.
[0081] The present disclosure provides systems and methods for determining
brain
perfusion characteristics for a person, such as a patient, using contrast
enhanced
TRH-CTA imaging data. For example, the perfusion characteristics may be
determined for a patient that has recently suffered a stroke. A stroke
specialist, such
CA 03127833 2021-07-26
WO 2020/154807
PCT/CA2020/050108
- 16 -
as a stroke clinician or neurologist, can then use the perfusion
characteristics to
diagnose and determine prognosis and may also inform treatment decisions.
[0082] The TRH-CTA imaging data may be determined in accordance with a
time-
resolved CTA imaging protocol, which comprises a number of sampling periods
after
the provision of an imaging contrast to a patient. For example, the TRH-CTA
imaging
protocol may include sampling at two, three, four or more time points, without
the need
to acquire an additional CT perfusion scan during the acute stroke imaging
workup.
For ease of illustration, TRH-CTA imaging for three time points will be
described
hereafter. Three-phase CIA imaging (i.e. three sampling time points) can
provide
information on parenchymal hemodynamics (i.e. blood flow affecting the
function of an
organ) distal to an occlusion, similar to CTP. However, TRH-CTA is a less
expensive
and is a more widely available modality compared to CTP since CTP usually
needs
expensive post processing software which is only available at tertiary stroke
centres
and not primary stroke centres. Since TRH-CTA acquires temporal information
for at
least two different sampling time points, TRH-CTA can provide information in a
somewhat similar manner as perfusion CT (Menon et al., 2013 and Frolich et
al.,
2014). However, TRH-CTA uses less information and requires less processing
than
perfusion CT.
[0083] The TRH-CTA imaging data may be used to generate one or more perfusion
functional maps, in accordance with the teachings herein. Furthermore, one or
more
thresholds may be applied to the perfusion functional maps for predicting
various
hemodynamic and tissue aspects as well as producing different volume images
such
as, but not limited to, volume images of infarct and/or penumbral tissue, for
example.
The stroke specialist can then review the perfusion and/or volume images, as
well as
the perfusion functional maps and other standard CT images, in order to make a
diagnosis and inform recanalization treatment decision.
[0084] Studies and testing performed by the inventors have shown that a
contrast
enhanced TRH-CTA imaging protocol that generates various perfusion functional
maps and/or volume images, in accordance with the teachings herein, may be
used
to provide a stroke imaging workflow that will save time and money while
maintaining
a similar diagnostic accuracy as current imaging paradigms such as the costly,
time
inefficient and unstandardized CTP cine scan.
CA 03127833 2021-07-26
WO 2020/154807
PCT/CA2020/050108
- 17 -
[0085] Referring now to FIG. 1, shown therein is a block diagram of an
example
embodiment of an imaging system 10 that can perform perfusion visualization of
TRH-
CTA image data. The imaging system 10 is electrically coupled with a CT
scanner 12
which is used to acquire the TRH-CTA imaging data for a patient 26. Some of
the
components of the imaging system 10 can be physically configured as a console
that
can be used by a user 14, such as a technician, to visualize the TRH-CTA
imaging
data and obtain one or more perfusions maps and optionally other volume images
which can then be used by a stroke specialist to determine a treatment method
for the
patient when the patient has suffered a stroke, or to detect and monitor other
conditions such as epilepsy and/or brain tumours.
[0086] The CT scanner 12 comprises a housing 20 with a moveable x-ray
source
20s, a radiation detector 20d and a bore 22. The CT scanner 12 further
comprises a
tray or bed 24 upon which the patient 26 lies down. The tray 24 is moved in an
axial
direction to place the head of the patient 26 within the bore 22 of the CT
scanner 12.
The x-ray source 20s generates x-ray beams 20b which are directed towards a
portion
of the head of the patient 26. The x-ray beams 20b are fan beams for
performing
volume CT scanning. The x-ray beams 20b travel through the head of the patient
26
and are partially attenuated by softer-tissue and absorbed by denser materials
in the
head of the patient 26. The x-ray beams 20b that are not absorbed are detected
by
the x-ray detector 20d. The CT scanner 12 also comprises electronics (not
shown) for
controlling the operation of the x-ray source 20s and movement of the tray 24
as well
as for digitizing the detected x-ray beams to produce CT image data which can
be
stored and transmitted to another device for further processing.
[0087] In accordance with the teachings herein, TRH-CTA can be performed
by the
CT scanner 12 in which the tray 24 and the x-ray source 20s (and optionally
the x-ray
detector 20d if it is moveable) are controlled such that as the x-ray source
20s rotates,
the tray 24 is moved axially into or out of the bore 22 which results in the
CT image
data being acquired according to a helical or spiral sampling pathway 28, an
example
of which is shown for illustration purposes in FIG. 1. This allows for the
acquisition of
TRH-CTA image data allowing for volume images to be created for different
axial
slices of the brain of the patient 26. The operation of the CT scanner 12 to
perform
TRH-CTA imaging is further described by Menon et at. (2015) and is also
further
CA 03127833 2021-07-26
WO 2020/154807
PCT/CA2020/050108
- 18 -
discussed herein with respect to FIGS. 2A and 2B. Menon et al. (2015) is
hereby
incorporated by reference in its entirety.
[0088] The imaging system 10 includes a processing unit 30, an interface
unit 32,
a power unit 34, a communication unit 36, an I/O unit 38, a display 40 that
can be used
to output a user interface 42 and a memory unit 44. The memory unit 44
comprises
software code for implementing an operating system 46, various programs 48, an
TRH-CTA image data acquisition module 50, a preprocessing module 52, a
perfusion
visualization module 54, a post-processing module 56 and one or more databases
60.
Certain components of the imaging system 10 can be implemented using a desktop
computer, a laptop, a mobile device, a tablet, and the like. The imaging
system 10 is
provided as an example and there can be other embodiments of the imaging
system
10 with different components or a different configuration of the components
described
herein.
[0089] The processing unit 30 controls the operation of the imaging system
10 and
is electrically coupled with the CT scanner 12 to receive the helical TRH-CTA
image
data from the CT scanner 12 as it is being obtained or after it has been
obtained by
executing the TRH-CTA image data acquisition module 50. In some embodiments,
the
processing unit 30 can be used to control the CT scanner 12 to perform an TRH-
CTA
imaging workflow, such as the example workflow shown in FIG. 2A or FIG. 21. In
other
embodiments, the processing unit 30 may obtain TRH-CTA image data that has
already been obtained and is stored on a data store 62. The data store 62 may
comprise one or more databases or may be part of a PACS.
[0090] The processing unit 30 can also execute the other modules 52, 54
and 56
for processing the TRH-CTA image data to obtain one or more perfusion
functional
maps and perform thresholding on these maps for determining various volumes
such
as the penumbra volume and/or infarct volume, for example. The processing unit
30
may also execute the user interface module 58 for generating the user
interface 42
and displaying the user interface 42 on the display 40.
[0091] The processing unit 30 can include one or more of any suitable
processors,
controllers or digital signal processors that can provide sufficient
processing power
depending on the configuration, and operational requirements of the imaging
system
10 as is known by those skilled in the art. For example, the processing unit
30 can
CA 03127833 2021-07-26
WO 2020/154807
PCT/CA2020/050108
- 19 -
include one or more high performance processors. In embodiments where there is
more than one processor, each processor may be configured to perform different
dedicated tasks. In alternative embodiments, specialized hardware, such as
ASICs,
can be used to provide some of the functions performed by the processing unit
30.
[0092] The interface unit
32 includes various interfaces that allow the imaging
system operator 20 to communicate with other devices or computers 64. In some
cases, the interface unit 32 can include at least one of a serial port, a
parallel port or
a USB port that provides USB connectivity. In some embodiments, the interface
unit
32 can also include at least one of an Internet, Local Area Network (LAN),
Ethernet,
Firewire, or digital subscriber line connection or a modem. Various
combinations of
these elements can be incorporated within the interface unit 32. In the
example
embodiment shown in FIG. 1, the interface unit 32 is used to send data, such
as control
data, to the CT scanner 12 and also to receive data, such as TRH-CTA image
data,
from the CT scanner 12.
[0093] The power unit 34
can be any suitable power source that provides power to
the various components of the imaging system 10 such as a power adaptor or a
rechargeable battery pack depending on the implementation of the imaging
system 10
as is known by those skilled in the art.
[0094] The communication
unit 36 is optional but can be used by the imaging
system 10 to communicate
with other devices in a wireless fashion. For example, the
communication unit 36 can include a radio that communicates utilizing CDMA,
GSM,
GPRS, Bluetooth or another suitable communication protocol according to
communication standards such as IEEE 802.11a, 802.11b, 802.11g, 802.11n or
another suitable communication standard. The communication unit 36 can allow
the
processing unit 30 to communicate wirelessly with the CT scanner 12 or with
other
devices or computers that are remote from the imaging system 10.
[0095] The I/O unit 38
provides one or more ports or other interfaces that allows a
user 14, such as an imaging technician or another operator, to control the
imaging
system 10 by using an input device that is communicatively coupled to the I/O
unit 38
to send control input data
to the imaging system 10. The I/O unit 38 also provides one
or more ports or other interfaces that allows the imaging system 10 to provide
outputs
to the user 14.
CA 03127833 2021-07-26
WO 2020/154807
PCT/CA2020/050108
- 20 -
[0096] For example, the I/O unit 38 has ports that can be communicatively
coupled
with at least one input devices such as, but not limited to, at least one of a
mouse, a
keyboard, a touch screen, a thumbwheel, a track-pad, a track-ball, a card-
reader, and
the like depending on the particular implementation of the imaging system 10.
For
ease of illustration, none of these input devices have been shown. The control
input
data can include, but is not limited to, start and stop commands to control
the beginning
and end of image data acquisition as well as various parameters that control
the timing
of the phases of the image data acquisition, the amount of the head of the
patient 26
that is imaged, the types of perfusion images to be generated, and the
threshold values
used to determine the penumbra and/or infarct volumes. In some embodiments,
other
types of data can be included in addition to the perfusion functional maps
such as, but
not limited to, one or more of demographics, time from stroke onset to CT,
NCCT
ASPECTS, and any other admission information such as blood work results, for
example. In some embodiments the user interface 42 may provide access to tools
that
the user 14 can use to enter control input data and perform certain actions.
[0097] In some embodiments, the tools may include an acquisition and
reconstruction tool (which may be provided by the TRH-CTA image data
acquisition
module 50 and the preprocessing module 52, for example) that the user 14 can
use
to acquire the TRH-CTA image data, to separate this data in two, three or more
data
acquisition phases and align the separated data in 3D space. The functionality
of the
data acquisition and reconstruction tool corresponds to act 104 of workflow
100 shown
in FIG. 2A and may be varied depending on the CT vendor.
[0098] In some embodiments, the tools may include a data processing tool
(which
may be provided by the preprocessing module 52 and/or the perfusion
visualization
module 54, for example) that the user 14 can use to control the generation of
time
density curves for each voxel of TRH-CTA image data that is used to generate a
perfusion functional map for a given axial slice of the brain of the patient
26. The user
14 may also use the data acquisition processing tool to create one or more
perfusion
functional maps for the given axial slice. The functionality of the data
processing tool
corresponds to acts 106, 106a, 106b and 106c of the workflow 100. In some
embodiments, the inputs to the data processing tool can be one or more of
DICOM,
NIFTI, or Matrix-based file formats (one for each sampling time) and/or the
outputs of
CA 03127833 2021-07-26
WO 2020/154807
PCT/CA2020/050108
- 21 -
the data processing tool can be matrix-based file formats (e.g. the time-
density curves
can be stored in a 4-D matrix).
[0099] In some embodiments, the tools may include a perfusion post-
processing
tool (which may be provided by the post-processing module 52 and/or the
perfusion
visualization module 54, for example) that the user 14 can use to determine
infarct
and/or penumbra volumes that are derived from the one or more perfusion
functional
maps that are generated. The user 14 may also use the perfusion post-
processing tool
to display the infarct and/or penumbra tissue regions in volume images as well
as
optionally to display other CT images that have been obtained, using known
techniques, such as collateral and Non-contrast CT (NCCT) images, for example.
In
some embodiments, the inputs to the perfusion post-processing tool can be a 4D
matrix (e.g. the time-density curves can be stored in a 4-D matrix) and/or the
output
can be one or more of DICOM, NIFTI, or a matrix-based file formats (e.g. a
perfusion
map can be stored in a 3-D matrix).
[00100] The user 14 may generate one or more of the perfusion images, generate
images showing the infarct and/or penumbra volumes as well as optionally
generate
and show the collateral and Non-contrast CT (NCCT) images, depending on which
of
the images provide the most useful information so that the stroke specialist
can make
an accurate diagnosis and select an appropriate course of treatment.
Alternatively,
some stroke specialists may wish to view all of these images.
[00101] The user 14 may generate images showing the infarct and/or penumbra
volumes by applying a threshold. The threshold may be determined in different
ways.
For example, thresholds may be determined from two different cohorts of
patients. A
first cohort of patients can be used to determine the threshold for infarct
tissue (i.e. a
volume of tissue that is non-viable even with fast reperfusion) where these
patients
are those who receive endovascular treatment within 90 minutes of admission CT
and
achieve quality reperfusion (TICI-2b/3) as defined on the last run of a
digital
subtraction angiography image (DSA). A second cohort of patients can be used
to
determine the threshold for penumbra tissue (i.e. a volume of tissue that will
infarct
without reperfusion) where these patients are those who do not reperfuse (TICI-
0).
This methodology is explained in more detail in d'Esterre et al. (2015), which
is hereby
incorporated by reference.
CA 03127833 2021-07-26
WO 2020/154807
PCT/CA2020/050108
- 22 -
[00102] In some embodiments, the tools may comprise the acquisition and
reconstruction tool, the data processing tool and the perfusion post-
processing tool. In
some embodiments, some of these tools may not be available for the user 14 to
enter
control data as the functionality of at least some of these tools may be
preset during
manufacturing so that the system 10 operates in a known and controlled manner
so
that a user 14 cannot enter data which may otherwise cause the system 10 to
not
operate properly.
[00103] As another example, the I/O unit 38 has ports that can be
communicatively
coupled with at least one output device such as, but not limited to, at least
one of a
microphone, a speaker, a printer, a display and the like again depending on
the
particular implementation of the imaging system 10. Only one example of an
output
device, e.g. the display 40, is shown for ease of illustrative purposes.
[00104] The display 40 can be any suitable display that provides visual
information
depending on the configuration of the imaging system 10. For instance, the
display 40
can be a cathode ray tube, a flat-screen monitor and the like if the imaging
system 10
is at least partially implemented using a desktop computer. In other cases,
the display
40 can be a display that is suitable for a laptop, a tablet or a handheld
device such as
an LCD-based display and the like when the imaging system 10 is implemented at
least partially using these devices.
[00105] The display 40 can provide various types of information to the user 14
such
as, but not limited to, one or more of patient data, CT scan status, raw TRH-
CTA image
data, one or more perfusion functional maps, one or more volume images and
other
types of images such as, but not limited to, NCCT images and collateral
images. The
patient data can include various information about the patient 26 such as one
or more
of name, sex, age, medical history and any previous CT images that have been
obtained, for example. The patient data can be obtained from a PACS, the
databases
60, the data store 62 or one of the devices 64. The perfusion functional maps
may be,
but are not limited to, one or more of a blood volume map, a blood flow map or
other
types of perfusion functional maps described herein, for example. The volume
images
may be, but are not limited to, a penumbra volume image, an infarct volume
image or
other types of volume images, such as, but not limited to, images of tissue
that will
CA 03127833 2021-07-26
WO 2020/154807
PCT/CA2020/050108
- 23 -
infarct based on time from CT to reperfusion (as described in d'Esterre et
al., 2015),
for example.
[00106] In some embodiments, the display 40 can provide this information via
the
graphical user interface 42, which will have output fields, or output regions
where
certain information is displayed for the user 14 to see as well as certain
input fields
where the user 14 may provide certain control input data. For example, the
control
input data may control how helical TRH-CTA image data is acquired and
processed.
In some embodiments in which there are tools that are provided for the user 14
to
control the operation of the system 10 and the generation of images, these
tools may
be displayed using the user interface 42. In such embodiments, the tools may
include
at least one of the acquisition and reconstruction tool, the data processing
tool and the
perfusion post-processing tool.
[00107] The memory unit 44 can include RAM, ROM, one or more hard drives, one
or more flash drives or some other suitable data storage elements such as disk
drives,
etc. The memory unit 44 may be used to store the operating system 46 and
programs
48 as is commonly known by those skilled in the art. For instance, the
operating system
46 provides various basic operational processes for the imaging system 10 and
the
programs 46 can include certain system diagnostic tools that can be used to
perform
troubleshooting on the imaging system 10 as well as other common user
applications
such as, but not limited to, an email application, and a spreadsheet
applications, for
example.
[00108] The various modules 50, 52, 54, 56 and 58 comprises software code
(i.e.
program instructions) that when executed, by at least one processor, such as
at least
one processor of the processing unit 30, for example, includes instructions
for
performing certain functions as described in further detail below.
Accordingly, the
processing unit 30 may access the memory unit 44 to load software instructions
from
any of the programs 48 and/or the various modules 50 to 58 and execute the
software
instructions in order to operate the imaging system 10 according to a desired
fashion
or a fashion selected by the user 14.
[00109] While some of the modules 50, 52, 54, 56 and 58 will be described as
performing certain functions, it should be understood that in alternative
embodiments
some of these functions may be performed by other modules. In some
embodiments,
CA 03127833 2021-07-26
WO 2020/154807
PCT/CA2020/050108
- 24 -
some of the modules 50, 52, 54, 56 and 58 may be combined or further separated
into
two or more modules. Furthermore, while the modules 50, 52, 54, 56 and 58 are
preferably implemented using software in alternative embodiments the
functionality of
at least one of the modules 50, 52, 54, 56 and 58 may be implemented using an
FPGA
or application specific circuitry.
[00110] The TRH-CTA image acquisition module 50 may be used to obtain the TRH-
CTA image data from the CT scanner 12 or from the data store 62. The TRH-CTA
image data acquisition module 50 can also load the acquisition parameters used
to
obtain the TRH-CTA image data as well as data about the geometrical
characteristics
of the x-ray beams 20b and the x-ray detector 20d so that reconstruction and
alignment
can be performed on the TRH-CTA image data as described below. In some
embodiments, the TRH-CTA image data acquisition module 50 may be used to
control
the CT scanner 12 to obtain the TRH-CTA image data according to various
acquisition
parameters which can be used to control the generation of the x-ray beams 20b
as
well as the motion of the x-ray source 20s and the tray 24 to provide the
helical pattern
28 for image data acquisition. Other parameters can be specified such as the
sampling
rate, the sampling times for obtaining image data for different phases as well
as the
timing and intensity of the generated x-ray beams 20b. These parameters may be
stored in the databases 60 or it may be provided by the user 14 depending on
the
embodiment.
[00111] The preprocessing module 52 may be used to preprocess the TRH-CTA
image data. The preprocessing may involve performing TRH-CTA image data
acquisition from the patient 26 in real-time or load this data from a data
store. The
preprocessing may further involve separating the TRH-CTA image data into N
groups
of time series of image data where each group of time series is for a
different phase,
and aligning the N series of volume time points in 3D space. In some
embodiments,
N can be an integer such as 3 or more than 3.
[00112] In some embodiments, the preprocessing module 52 may provide the back-
end processing capability for the acquisition and reconstruction tool while
the user
interface module 58 may be used to create a first Graphical User Interface
(GUI) for
this tool to allow the user 14 to enter control input data for this tool and
receive output
data related to the preprocessing.
CA 03127833 2021-07-26
WO 2020/154807
PCT/CA2020/050108
- 25 -
[00113] The perfusion visualization module 54 can be used create one or more
desired perfusion functional maps. Accordingly, the perfusion visualization
module 54
can generate time density curves for the voxels of interest, which can be a
subset of
voxels or all of the voxels, in a desired perfusion functional map. The
perfusion
visualization module 54 can then select a mapping function that corresponds to
the
desired perfusion functional map and apply the mapping function to the time
density
curves for the voxels of interest to create perfusion values for these voxels.
In some
embodiments, the perfusion visualization module 54 can also apply some further
processing to the voxels of interest in order to remove noise and/or improve
the visual
contrast of the voxels of interest in the perfusion functional map. For
example, the
perfusion visualization module 54 can apply spatial filtering, as described at
act 108c
of method 100, to the perfusion values of the voxels of interest to improve
SNR and
create a final version of the desired perfusion functional map. In some cases,
additional filtering can be performed to remove small infarcts that are noise,
as
described in further detail with respect to method 100. In an alternative
embodiment,
which is discussed more with respect to FIG. 21, the perfusion visualization
module 54
can be adapted to perform deconvolution or non-deconvolution with respect to
the time
density curves.
[00114] In some embodiments, the perfusion visualization module 54 may provide
the back-end processing capability for the data processing tool while the user
interface
module 58 may be used to create a second GUI for this tool to allow the user
14 to
enter control input data for this tool and receive output data related to the
preprocessing.
[00115] The post-processing module 56 can be used to create other images, or
determine other characteristics such as the penumbra and/or infract volumes,
based
on one or more of the perfusion functional maps that are created by the
perfusion
visualization module 54. The post-processing module 56 can also be used for
displaying one of more of a perfusion functional map, the penumbra and/or
infarct
volume images in mL or cm3, or any applicable unit of volume, as well as other
types
of images such as collateral and/or NCCT images.
[00116] In some embodiments, the perfusion visualization module 54 may provide
the back-end processing capability for the perfusion post-processing tool
while the
CA 03127833 2021-07-26
WO 2020/154807
PCT/CA2020/050108
- 26 -
user interface module 58 may be used to create a third GUI for this tool to
allow the
user 14 to enter control input data for this tool and receive output data
related to the
preprocessing.
[00117] As described previously, the user interface module 58 can be used to
create
the user interface 42 which may include various types of GUIs for allowing the
user 14
to operate the imaging system 10 as well as various GUIs to allow the user 14
to
interact with one or more of acquisition and reconstruction tool, the data
processing
tool and the perfusion post-processing tool.
[00118] The one or more databases 60 can be used to store data for the imaging
system 10 such as various system settings, parameter values, and calibration
data.
The databases 228 can also store other information required for the operation
of the
programs 48 or the operating system 46 such as dynamically linked libraries
and the
like. The databases 60 can also store data related to the operation of the TRH-
CTA
image data acquisition module 50, the preprocessing module 52, the perfusion
visualization module 54, the post-processing module 56 and the user interface
module
58.
[00119] Referring now to FIG. 2A, shown therein is a flow chart diagram of an
example embodiment of a method 100 for performing a stroke imaging workflow
which
involves obtaining TRH-CTA imaging data and performing perfusion visualization
on
the TRH-CTA imaging data. The perfusion visualization may include generating
and
displaying at least one CIA based perfusion functional map and/or volume
images
that are derived from one or more TRH-CTA-based perfusion functional maps.
[00120] At act 102, the workflow 100 includes injecting a bolus of CT contrast
dye
into the patient 26. In some embodiments, NCCT image data may be obtained
before
providing the CT contrast dye to the patient 26. As described previously, the
CT
contrast dye is an imaging contrast agent that improves the contrast of
various
structures in the CT image. The CT contrast dye may be an iodine contrast
agent or
some other suitable chemical solution. The amount and type of CT contrast dye
that
is given to the patient 26 may be determined according to the amount that will
not
affect the determination of the perfusion maps, such as 40 to 80 mL, for
example.
[00121] At act 104, the workflow 100 includes obtaining TRH-CTA image data
after
the patient received the bolus of imaging contrast agent. At least one
processor of the
CA 03127833 2021-07-26
WO 2020/154807
PCT/CA2020/050108
- 27 -
processing unit 30 may be configured to do this. The TRH-CTA image data may be
obtained by loading the TRH-CTA image data from a data store, such as the data
store
62, or receiving the TRH-CTA image data from the CT scanner 12 in real-time or
receiving stored TRH-CTA image data from the CT scanner 12.
[00122] Referring now to FIG. 2B, shown therein is an example of an TRH-CTA
image data acquisition, with each phase (i.e. time sampling point) represented
by at
least one arrow. The first phase (solid arrow 152) is the same as in a
conventional
arch-to-vertex CT angiography. The second phase (solid arrow 154b) and the
third
phase (solid arrow 156b) are sequential skull base¨to-vertex acquisitions
performed
in the midvenous and late venous phases. The dashed arrows 154a and 156a
indicate
movement of the CT scanner 12 in between image acquisition phases. The example
scan trajectory FIG. 2B shows scanning to obtain three phases of TRH-CTA image
data; however, in alternative embodiments, the scan trajectory can be modified
to
collect two, four or more phases of TRH-CTA image data.
[00123] The TRH-CTA imaging technique generates time-resolved cerebral
angiograms of brain vasculature from the skull base to the vertex in three
phases after
contrast material injection. Aortic arch vertex CT angiography performed with
a
multidetector CT scanner can make up the first phase. Image acquisition can be
timed
to occur during the peak arterial phase in a normally perfused brain and can
be
triggered by bolus monitoring. The remaining two time sampling points (e.g.
phases)
for the example scan trajectory of FIG. 2B are from the skull base to the
vertex in the
equilibrium/peak venous and late venous phases in a normally perfused brain.
The
TRH-CTA image data can be acquired according to a certain thickness, such as a
0.5
to 5 mm, 0.5 to 1mm, of 0.625 mm, for example.
[00124] In one example imaging protocol, the first phase of the TRH-CTA
imaging
from the arch to the vertex may be acquired in less than 7 seconds, with an
average
dose length product of 700-800 mGy. cm. The second phase may be acquired after
a
certain delay, such as a delay of 4 seconds for example, that allows for table
repositioning for imaging of the skull base of the patient 36. The scanning
duration for
each additional phase may be set to 3.4 seconds. Thus, the three phases were
each
8 seconds apart. However, in alternative embodiments, the TRH-CTA acquisition
parameters may be changed for collecting image data at other time points. A
total of
CA 03127833 2021-07-26
WO 2020/154807
PCT/CA2020/050108
- 28 -
80 mL of contrast material (68% ioversol, Optiray 320; Mallinckrodt, St Louis,
Mo) may
be injected at a rate of 5 mL/sec and followed by a 50-mL normal saline chase
at a
rate of 6 mL/sec. Generally, a total of 40-80 ml of contrast material may be
used. An
advantageous feature of the TRH-CTA imaging protocol is that the two
additional
phases of the TRH-CTA use no additional contrast material and the total
radiation
dose as per this TRH-CTA imaging protocol was less than that in many
established
stroke centers.
[00125] Referring again to FIG. 2A, at act 106, the workflow 100 includes
performing
preprocessing on the TRH-CTA image data to generate preprocessed TRH-CTA
helical image data. This preprocessing may be done by one or more processors
of the
processing unit 30. This may be done by first generating raw TRH-CTA image
data by
performing reconstruction on the TRH-CTA image data at act 106a. For example,
continuing again with the TRH-CTA imaging protocol discussed with respect to
FIG.
2B, the axial scan images are reconstructed with a certain amount of overlap,
such as
at 1-mm overlapping sections, and multiplanar reconstructions for axial,
coronal, and
sagittal images of the circle of Willis may be performed with 3-mm thickness
at 1-mm
intervals.
[00126] Referring again to FIG. 2A, after TRH-CTA image reconstruction, the
raw
TRH-CTA image data can be separated into separate groups of TRH-CTA time
series
data where each group corresponds to a distinct phase (e.g. sampling time
point) of
the TRH-CTA image data acquisition at act 106b. Depending on the protocol used
for
obtaining the TRH-CTA image data, there is a certain amount of time delay
between
each group of TRH-CTA time series data. This time delay corresponds to the
spacing
in time between successive phases of the TRH-CTA imaging protocol. For
example,
this time delay may be from 8 to 10 seconds. After the separation, the
workflow 100
can include performing registration on the separate groups of TRH-CTA time
series
data to align the separate groups of TRH-CTA time series data in 3D space at
act
106c.
[00127] Act 106c may also include processing the aligned groups of TRH-CTA
time
series data to isolate the brain tissue in the data. This can be done by
removing any
contributions to the time series data due to the skull and/or Cerebrospinal
Fluid (CSF)
of the head of the patient 26. For example, at least one processor from the
processing
CA 03127833 2021-07-26
WO 2020/154807
PCT/CA2020/050108
- 29 -
unit 30 may be configured to apply a first threshold to the groups of TRH-CTA
time
series data to remove or reduce contributions from the skull of the patient 26
to the
values of the time series data points. In addition, at least one processor
from the
processing unit 30 may be configured to apply a second threshold to the groups
of
TRH-CTA time series data to remove or reduce contributions from the CSF of the
patient 26 to the values of time series data points. The first threshold is
generally
applied before the second threshold.
[00128] At act 108, the workflow 100 includes performing perfusion
visualization by
using one or more processors of the processing unit 30. This includes
generating time
density curve data for a plurality of voxels from the preprocessed TRH-CTA
helical
image data for an axial imaging slice, where the time density curve data
comprise
intensity values for different phases of the preprocessed TRH-CTA helical
image data
arranged sequentially in time at act 108a. In at least one embodiment, the
time density
curve data may be normalized to a baseline value. For example, the time
density curve
data, which may also be referred to as time attenuation curves (TAO) can be
processed to subtract the baseline NCCT HU values for each voxel.
[00129] An example of generating a time density curve is shown in FIG. 20
which
shows how a time density curve 174 can be generated for a given voxel 172 of
different
TRH-CTA image volumes 170a, 170b and 170c obtained for an axial imaging slice
170 of a patient's brain at three different time periods. The voxel 172a
corresponds to
the image volume 170a for a first phase, the voxel 172b corresponds to the
image
volume 170b for a second phase and the voxel 172c corresponds to the image
volume
170c for a third phase. The intensities of voxels 170a, 170b and 170c, in
Houndsfield
Units (HU), are shown at times t1, t2 and t3 in the time density curve 174 for
the first,
second and third phases, respectively.
[00130] Referring now to FIG. 2D, shown therein is an example of several
illustrative
time density curves for a voxel of normal tissue, slightly ischemic tissue and
severely
ischemic tissue. As can be seen, different types of tissue will have time
density curves
with certain characteristics that are different from one another. For example,
the
intensity of the TRH-CTA image data decreases across phase for normal tissue,
increases across phase for slightly ischemic tissue and is somewhat flat or
rounded
for severely ischemic tissue. This allows for the location of damaged tissue
to be
CA 03127833 2021-07-26
WO 2020/154807
PCT/CA2020/050108
- 30 -
determined by looking for these characteristics in the time density curves or
in other
data derived from the time density curves such as in perfusion functional
maps.
[00131] Accordingly, after generating the time density curves for the voxels
of
interest, at least one perfusion functional map for an axial imaging slice may
be
generated, in accordance with the teachings herein, by applying at least one
mapping
function to different phases (i.e. different time points) of the time density
curve data
corresponding to the axial imaging slice at act 108b.
[00132] In at least one embodiment, the perfusion visualization may include
applying
a mapping function using at least one processor of the processing unit 30 to
create a
perfusion functional map which is a delay map for a plurality of pixels
corresponding
to the axial imaging slice. This can be done by, for a given pixel, selecting
a highest
intensity value of the time density curve data for the voxel that corresponds
to the
given pixel. For instance, FIG. 2E provides an example of a delay perfusion
functional
map.
[00133] In at least one embodiment, the perfusion visualization may include
applying
a mapping function using at least one processor of the processing unit 30 to
create a
perfusion functional map which is a first blood flow map for a plurality of
pixels
corresponding to the axial imaging slice. This can be done by, for a given
pixel,
determining a slope of the intensity value of the time density curve data over
first and
second phases of the voxel that corresponds to the given pixel.
[00134] In at least one embodiment, the perfusion visualization may include
applying
a mapping function using at least one processor of the processing unit 30 to
create a
perfusion functional map which is a second blood flow map for a plurality of
pixels
corresponding to the axial imaging slice. This can be done by, for a given
pixel,
determining a slope of the intensity value of the time density curve data over
second
and third phases of the voxel that corresponds to the given pixel.
[00135] In at least one embodiment, the perfusion visualization may include
applying
a mapping function using at least one processor of the processing unit 30 to
create a
perfusion functional map which is a flow average perfusion functional map for
a
plurality of pixels corresponding to the axial imaging slice. This can be done
by, for a
given pixel, averaging the first and second blood flows, described above, that
CA 03127833 2021-07-26
WO 2020/154807
PCT/CA2020/050108
- 31 -
correspond to the given pixel. For instance, FIG. 2F shows an example of a
blood flow
perfusion functional.
[00136] In at least one embodiment, the perfusion visualization may include
applying
a mapping function using at least one processor of the processing unit 30 to
create a
perfusion functional map which is a blood volume map for a plurality of pixels
corresponding to the axial imaging slice. This can be done by, for a given
pixel,
performing an integral of the time density curve data of the voxel that
corresponds to
the given pixel. For instance, FIG. 2G shows an example of a blood volume
perfusion
functional map.
[00137] In at least one embodiment, the perfusion visualization may include
applying
a mapping function using at least one processor of the processing unit 30 to
create a
perfusion functional map which is a washout map for a plurality of pixels
corresponding
to the axial imaging slice. This can be done by, for a given pixel,
subtracting an
intensity value of a third phase from a highest intensity value of all phases
of the time
density data for the voxel that corresponds to the given pixel.
[00138] In some embodiments, the perfusion visualization may include
generating
any combination of the aforementioned the perfusion functional maps. For
example,
in some embodiments, the perfusion visualization may include applying a
mapping
function using at least one processor of the processing unit 30 to create a
perfusion
functional map which is a combination map for a plurality of pixels
corresponding to
the axial imaging slice. This can be done by, for a given pixel, combining any
two or
more of the aforementioned mapping functions in a linear or nonlinear fashion
to obtain
a combination map. Such combination maps may allow for a higher accuracy when
determining the final infarct volume.
[00139] The combination functional maps can be obtained in a variety of
different
ways. For example, two or more functional maps can be combined by pixel-by-
pixel
subtraction, addition, multiplication or division which may in some cases
include
applying coefficients to one or more of the functional maps. The coefficients
may be
determined by using a machine learning model such as a logistic regression
model,
for example. Other types of machine learning models that may be used include a
decision tree, a support vector machine, principle component analysis, a
random
forest, and a neural network, for example. The machine learning models are
trained
CA 03127833 2021-07-26
WO 2020/154807
PCT/CA2020/050108
- 32 -
using a training data set and known outcomes, and then the trained machine
learning
model is used to predict outcomes for new patients, e.g. such as in generating
an
optimized combination perfusion map that may then be used to determined
infarct or
other items of interest. Alternatively, statistical measures (e.g. mean,
median, mode,
standard deviation, and skewness), integration, deconvolution, normalization,
and
differentiation may be used on one or more of the perfusion maps.
[00140] An example of an embodiment which uses a logistic regression model for
generating a combination functional map is provided in equation (1) and
described in
further detail in the image processing section of Study #2. In using logistic
regression,
a set of initial perfusion maps is first selected, coefficients are applied to
each perfusion
map and the perfusion map along with the coefficients are then applied to a
logistic
regression model (which is in the form of an equation). Accordingly, the
initial
functional maps are taken as inputs and calculations are done on a voxel-by-
voxel
basis according to a function (e.g. equation 1) to generate the combination
functional
map. For example, equation (1) is based on a backwards step-wise logistic
regression
model that was trained to create a combination map. The logistic regression
model
takes the initial (e.g. base) maps as an input and generates a new logistic
regression
map as the output. This calculation is done on a voxel-by-voxel basis. The
training
generally involves using many different initial functional maps to vary the
values of the
coefficients and a scaling constant generating maps using a set of training
images to
determine a set of values for A, B, C, D and E to improve the discriminatory
ability of
the linear regression model to distinguish between certain conditions at a
voxel level
such as infarction and non-infarction. In this example, the backwards step-
wise logistic
regression model was used to avoid over-fitting the model to the training
data.
However, for larger training data sets more complex machine learning models
may be
used to generate the combination functional map.
[00141] An example of a perfusion functional map for an axial imaging slice of
a
patient's brain that is generated by machine learning (Le. logistic
regression) is shown
in FIG. 2H.
[00142] After a perfusion functional map is generated, it may be further
processed
to increase the signal to noise ratio and provide more useful information to
the stroke
specialist so that they may make the proper diagnosis and select the proper
course of
CA 03127833 2021-07-26
WO 2020/154807
PCT/CA2020/050108
- 33 -
treatment when reviewing the one or more perfusion maps that are generated.
For
example, filtering at act 108c of method 100 may be applied to a perfusion
functional
map after it is initially generated in order to smooth out the perfusion
function map.
The filtering may be done in the spatial domain or the frequency domain. In at
least
one embodiment, the filtering may involve applying spatial filtering such as
bilateral
Gaussian filtering. In such embodiments, a full Gaussian blur (e.g. with a
standard
deviation of 3x3 pixels) or a 3D Gaussian filter may be applied thereafter. An
another
example, in at least one embodiment, a guided filter may be used for spatial
filtering.
In alternative embodiments, other spatial filters that may be used include,
but are not
limited to, moving average, Gaussian, bilateral Gaussian). Alternatively,
spectral
filtering may be used such as, but not limited to, bandpass, low pass, high
pass, and
band stop filtering, for example. In at least one embodiment, the spatial
and/or
frequency filtering is applied iteratively.
[00143] In some embodiments, the filtering may also include performing
additional
filtering that removes small infarcts that are noise. This additional
filtering may act as
a small-object removal algorithm by using texture features of the smoothed
functional
map to improve the accuracy of identifying the main regions of brain death.
For
example, this additional filtering may be performed by finding the sizes of
all objects
highlighted by the thresholds, and then removing these objects based on the
width of
the Gaussian blur filter. The optimization of the removal of small infarcts
may also be
done iteratively.
[00144] At act 110, the workflow 100 includes performing perfusion post-
processing
on at least one of the perfusion maps that were created at act 108. For
example, this
post-processing may involve determining the infarct and/or the penumbra tissue
volume from one of the perfusion maps at act 110a, such as from preferably the
delay
perfusion map. This may done by applying a threshold to at least one of the
functional
maps generated at act 108. The threshold may be determined as explained
previously.
The determined penumbra and/or infarct volumes may then be shown in other
volume
images in which the penumbra and/or infract tissue portions of the volume
images are
shown in different colors and/or outlined or otherwise highlighted compared to
surrounding tissue.
CA 03127833 2021-07-26
WO 2020/154807
PCT/CA2020/050108
- 34 -
[00145] At act 112, the workflow 100 includes displaying the one or more
perfusion
maps as well as the penumbra and/or infarct volume images via the user
interface 42
on the display 40. In some embodiments, act 112 can also include displaying
collateral
images and/or NCCT images.
.. [00146] At act 114, the stroke specialist can review the displayed images
in order to
perform a diagnosis and determine a treatment strategy. For example, the
stroke
specialist may diagnose the severity of the stroke and determine whether it is
possible
to save the penumbra tissue. To aid in this diagnosis, the method 100 may
include
another act in which the fraction of "core tissue" divided by "the penumbra"
is
determined and provided as a metric, since this shows how much tissue cannot
be
saved versus how much tissue can be saved. If it is possible to save a
sufficient
amount of the penumbra then the stroke specialist may determine that the
patient
should receive an intravenous tissue plasminogen activator or a suitable
endovascular
therapy.
[00147] Referring now to FIG. 21, shown therein is a flow chart diagram of an
example of an alternative embodiment of embodiment of a method 200 for
performing
an imaging workflow in accordance with the teachings herein. The method 200 is
similar to the method 100 except for having a modified technique for
performing
perfusion visualization in which deconvolution and/or non-deconvolution is
optionally
.. applied to the time density curve at act 204 after the time density curves
are generated
at act 108a. Accordingly, there can be at least one of: (a) one or more
perfusion maps
generated from the time density curve data as explained for method 100, (b)
one or
more perfusion maps generated after applying a deconvolution method to the
time
density curve data and (c) one or more perfusion maps generated after applying
a
non-deconvolution method to the time density curve data.
[00148] Various deconvolution and/or non-deconvolution approaches can be
applied to the time density curves to generate deconvolved and/or non-
deconvolved
to generate one or more functional maps. For example, these functional maps
may be
those described previously for act 108b of method 100 including at least one
of a delay
map, blood flow maps based on differences in data obtained at different
phases, a
flow average perfusion functional map, a blood volume map and a washout map.
Alternatively, or in addition thereto, the deconvolved/non-deconvolved data
may be
CA 03127833 2021-07-26
WO 2020/154807
PCT/CA2020/050108
- 35 -
used to generate at least one of a time to peak (TIP) or TO map, area under
the time
density curve, the slope for the first and second time points, a mean transit
time (MTT)
map, cerebral blood flow (CBF) and cerebral blood volume (CBV) (d'Esterre et
al.,
2015; Konstas et al., 2009).
[00149] The deconvolution method that is used may be based on one of a Fourier
transform based deconvolution, standard truncated singular value decomposition
(sSVD) (Fang et al., 2015), a block-circulant truncated SVD (bSVD), Tikhonov
regularization and sparse perfusion deconvolution (SPD), for example. Each
deconvolution method works to different levels of accuracy and have different
amounts
of computation time.
[00150] In deconvolution, these techniques are used to remove the delay and
dispersion of the contrast blood that occurs before the reaching the tissue of
interest
(i.e. the stroke area). This way, a more hemodynamically accurate
interpretation of the
tissue blood flow can be achieved. Accordingly, the particular deconvolution
method
is applied along with the selection of an Arterial Input Function (AlF) from
the Internal
Carotid Artery (ICA) (d'Esterre et al., 2015) such as the basilar artery or
contralateral
ICA using a 2 voxel x 2 voxel (in-slice) region-of-interest (ROI). The AIF is
explained
in more detail in the image processing section for Study #2.
[00151] For non-deconvolution, some example techniques in the context of
perfusion imaging are any methods that do not use a convolution operator such
as,
but not limited to, multiplication, subtraction, division, max slope approach,
and the
Patlak model, for example (AbeIs et at., 2010; Horn etal., 2009).
[00152] It should be noted that method 200 may be further modified in at least
one
alternative embodiment to use machine learning, such as a logistic regression
model,
for generating a combination perfusion map at act 108b as was described for
method
100. For, example act 108b can result in perfusion functional maps that are
created
by at least one of: (1) applying a mapping function to the time density curve
data
without deconvolving or non-deconvolving; (2) applying deconvolution to the
time
density curve data and (3) applying non-deconvolution to the time density
curve data.
The generated functional maps can then be input to the machine learning
algorithm,
which generates the best combination perfusion functional map by applying
weighting
factors to all of the input maps. A check for collinearity of the various
input maps may
CA 03127833 2021-07-26
WO 2020/154807
PCT/CA2020/050108
- 36 -
be performed to avoid providing redundant data to the machine learning model.
The
combination perfusion functional map can be considered as being a
probabilistic map
for tissue outcome. Thresholds can then be applied to the combination
perfusion
functional map to obtain volumes of infarct and/or penumbra to estimate what
tissue
will die with and without reperfusion. As the machine learning algorithm is
trained on
more data the weighting factors will change and may eventually create patient
specific
maps when the machine learning algorithm is trained on enough patients with
the
same demographics and the same type of stroke such that there may be
completely
different combination functional maps for different sub-sets of patients.
STUDY #1
[00153] A study was performed to determine whether TRH-CTA image data can be
used to provide perfusion maps upon which thresholds can be applied to predict
the
final infarct volume.
[00154] The study was performed on 44 stroke patients with occlusion that was
visible on CIA. The inclusion criteria for these patients in the study were:
(a) the
patients presented to the emergency department with symptoms that were
consistent
with ischemic stroke, (b) the patients were older than 18 years, and (c) the
baseline
imaging included TRH-CTA imaging performed within 12 hours of stroke symptom
onset and initiated before recanalization therapy. Patients were excluded from
the
study if: (a) an intracranial hemorrhage was identified in the baseline CT,
(b) there was
a previous moderate to large stroke in the ipsilesional hemisphere, (c) the
modified
Rankin scale (mRS) score was greater than 2 at baseline; (d) the patient was
unable
to undergo CT angiography because of recent estimated creatinine clearance of
less
than 60 mL/min, contrast material allergy or other reasons, (e) the patient
participated
in another study that resulted in the patient receiving an investigational
drug or
therapy; and (f) any the patient had a terminal illness (Le. the patient was
not expected
to survive longer than 1 year).
[00155] The patients were acutely imaged using the three-phase TRH-CTA imaging
protocol (the temporal sampling was 8 seconds). MR diffusion weighted imaging
(DWI)
between 24-48 hours was used to measure the final infarct volume. The TRH-CTA
perfusion functional maps were filtered using a 3D Gaussian blurring
technique. Two
CA 03127833 2021-07-26
WO 2020/154807
PCT/CA2020/050108
- 37 -
perfusion functional maps, a Delay perfusion functional map and a Flow Average
perfusion functional map, were generated for all patients in the study.
[00156] A Receiver Operating Characteristic (ROC) curve was generated for the
merged patient data, comparing infarct vs. normal tissue. Thresholds were
determined
using the ROC curves by optimizing for sensitivity and specificity. This
involved
performing ROC analysis on a voxel-by-voxel basis for all patients in the
study, which
basically combined all voxels in all of the patients' perfusion maps into a
single vector,
and divided them into "infarct" vs "healthy". This is represented by the
histogram in
FIG. 3D. Then, a threshold was optimized between those two distributions by
maximizing specificity and sensitivity equally. This can be done by generating
the ROC
curves by recording specificity and sensitivity for thresholds moving from
left to right
across the two distributions, in small increments. At a certain point, the
sensitivity and
specificity are maximized, which is the optimal threshold.
[00157] Another metric was implemented by comparing individual infarct volumes
directly (on a patient-by-patient basis). This gives another performance
measure (e.g.
accuracy in terms of mL). For example, the lesions within the patient cohort
may be
binned into size ranges (i.e. 1m1 to 5 ml, 5m1 to 10 ml, etc.) to determine an
accuracy
vs. infarct volume size relationship. This is where the filtering to remove
small-infarct
regions may be done.
[00158] Referring now to FIGS. 3A-3D, shown therein are case study results for
a
single patient in the study. FIG. 3A is a delay perfusion functional map, FIG.
38 is a
flow average perfusion functional map, and FIG. 3C is an MR diffusion weighted
image. FIG. 3D is an amalgamated histogram of all patients in the case study
which
may be used to determine an optimal threshold for generating the Delay
perfusion
functional map as was just explained.
[00159] The "Delay" map generated an ROC curve with an Area-Under-Curve (AUC)
of 0.82 (Sensitivity = 0.74, Specificity = 0.76). The "Flow Average" map
generated an
ROC curve with an Area-Under-Curve (AUC) of 0.76 (Sensitivity = 0.72,
Specificity =
0.73).
[00160] Therefore, the proposed "Delay" and "Flow Average" perfusion
functional
maps determined from the TRH-CTA image data predicted final infarct volume to
a
high degree of accuracy, which is close to CTP accuracies reported in the
literature
CA 03127833 2021-07-26
WO 2020/154807
PCT/CA2020/050108
- 38 -
(d'Esterre et al., 2015). These results show the capability of the TRH-CTA
protocol to
generate quantitative perfusion functional maps which will be useful for non-
tertiary
centers that do not have access to expensive post-processing software.
[00161] Referring now to FIGS. 4A-4C, shown therein are examples of pairs of
perfusion functional maps determined for a patient where the first column of
images
(FIG. 4A) are obtained using the CTP framework, the second column of images
(FIG.
4B) are obtained using the TRH-CTA framework described in accordance with the
teachings herein and the last column of images (FIG. 40) are 24 hour diffusion
weighted images (DWI).FIGS. 4A-40. The patient was an ischemic stroke patient
with
a large ischemic lesion from a left middle cerebral artery occlusion. At
admission CT
perfusion (CTP) "TO" functional perfusion imaging was performed (see FIG. 4A)
and
is shown in two slices, and temporally resolved helical CTA (TRH-CTA) derived
perfusion "Delay" maps were obtained (see FIG. 4B), while 24 hour diffusion
weighted
images (DWI) are shown (see FIG. 40) after successful fast and quality
recanalization
(removal of clot). The bright area on the DWI represents dead tissue (infarct)
which
correlates with the brighter values on the CTP and TRH-CTA functional images.
Both
the CTP and TRH-CTA correlates with final infarct volume.
[00162] Referring now to FIGS. 5A-50, shown therein are an example of pairs of
perfusion functional maps determined for a second patient where the first
column of
images (FIG. 5A) are obtained using the CTP framework, the second column of
images (FIG. 5B) are obtained using the TRH-CTA framework described in
accordance with the teachings herein and the last column of images (FIG. 50)
are 24
hour diffusion weighted images (DWI). The second patient is an ischemic stroke
patient with a small ischemic lesion from a left middle cerebral artery
occlusion. At
admission CT perfusion (CTP) "TO" functional perfusion imaging was performed
and
is shown in two slices (see FIG. 5A)and temporally resolved helical CTA (TRH-
CTA)
derived perfusion "Delay" maps were obtained (see FIG. 5B), while 24 hour
diffusion
weighted images (DWI) were also obtained (see FIG. 50). The patient did not
reperfuse (blood clot remained). The bright area on the DWI represents dead
tissue
(infarct) which correlates with the brighter values on the CTP and TRH-CTA
functional
images. Both the CTP and TRH-CTA correlates with final infarct volume.
CA 03127833 2021-07-26
WO 2020/154807
PCT/CA2020/050108
- 39 -
[00163] Accordingly, the inventors have found that TRH-CTA image data can
provide information on parenchymal hemodynamics distal to the occlusion,
similar to
CT perfusion (CTP). In fact, the inventors have discovered that the
effectiveness of
the TRH-CTA perfusion technique is generally within 5-10% of the accuracy of
CTP
when identifying penumbra. However, TRH-CTA is a less expensive and a more
widely available modality while perfusion CT requires 8-30 minutes from image
acquisition to interpretation and needs costly computational hardware and
software
for postprocessing images that are vendor specific, not standardized, and
therefore
variable across centers.
[00164] Furthermore, CTP has a number of drawbacks that TRH-CTA does not
have. For example, with CTP it is more likely that patient motion can affect
results
since more image data needs to be acquired. CTP also additional radiation
exposure
to the patient and the need for additional contrast agents. CTp also has
variations in
technique with different vendor equipment and significant variability across
vendors
for the degree of coverage of the brain with CTP (e.g. 4 to 16 cm). Also some
vendors
have the option of covering 8 cm using a 'toggle table' technique that may
introduce
additional errors. Finally, there is still a lack of consensus in the medical
community
regarding the interpretation and best practices for treatments based on CTP
perfusion
maps.
STUDY #2
Patients
[00165] A post-hoc analysis was also performed using data from the Calgary
Stroke
Program's PRove-IT and ESCAPE studies (Goyal et al., 2015; Menon et al.,
2015).
AIS patients were included in the study if they presented within 12 hours from
last
seen normal. Inclusion criteria for the patient in the study were as follows:
1) patient
age >18 years; 2) known symptom onset time; 3) any occlusion of the anterior
circulation, which could be targeted for EVT; 4) patients had successful
reperfusion
assessed by digital subtraction angiography at the end of the EVT, and 5)
patients had
next day follow-up diffusion-weighted MR imaging (DWI) between 24-48 hours of
admission. A modified Thrombolysis in Cerebral Infarction (mTICI) score of 2b
or 3
was considered successful reperfusion (Saver et al, 2015; Campbell et al.,
2015;
CA 03127833 2021-07-26
WO 2020/154807
PCT/CA2020/050108
- 40 -
Albers et al., 2018; Haussen et al., 2016; Nogueira et al., 2018a; Nogueira et
al.,
2018b; d'Esterre et al., 2015; Goyal et al., 2015; and Menon etal., 2015).
Demographic
and clinical characteristics, medical history, and any relevant workflow time
intervals
were collected prospectively. The study was approved by the local ethics
board.
Image Acquisition
[00166] At admission, all patients had a standard non-contrast CT (NCCT) scan
(5mm slice thickness), a head/neck multi-phase CTA (i.e. TRH-CTA), and eine CT
perfusion (CTP) with a craniocaudal coverage of 8 cm. The acquisition of raw
image
data for TRH-CTA imaging has been described previously (Menon et al., 2015).
Briefly, 80 ml of an iodinated contrast agent was injected at a rate of
5m1/sec followed
by a saline flush of 50 ml at 6 ml/sec. For the first phase (7 seconds), the
aortic arch-
to-vertex helical scan was timed to be in the peak arterial phase by
triggering the scan
with contrast bolus tracking. The second phase was acquired after a delay of 4
seconds allowing the table to reposition to the skull base. Scan duration for
the next 2
additional phases was 3.4 seconds. TRH-CTA acquisition data was reconstructed
into
axial image slices of 0.625 mm thickness. For the cine CTP protocol, 45 ml CT
contrast
agent (Optiray 320; Mallinckrodt Pharmaceuticals; Dublin, Ireland) was power
injected at 4.5 ml/s followed by a saline chase of 40 ml at 6 ml/s. Images for
a section
of 8 cm thickness were acquired at 5 mm slice thickness. Scanning began after
a delay
of 5 seconds from contrast injection for up to two phases (scanning
intervals): 1st
phase every 2.8 s for 60 seconds and an additional 2nd phase every 15 seconds
for
90 seconds (total scan time = 150 seconds).
[00167] Between 24-48 hours after treatment, a clinical DWI scan was acquired
using a 3T MRI (Signa VH/i; GE Healthcare) flip angle 90 single-shot echo-
planar
sequence (b = 0 s/mm-2 and isotropic b = 1000 s/mm-2; repetition time = 9000
ms;
echo time = 80-90 ms; 240 mm field-of-view; 5.0 mm slice thickness with a 0 or
2 mm
gap).
Image Processing
[00168] The Perfusion Functional Map Processing: To generate functional images
from the TRH-CTA image data, each phase of the mCTA was registered to the NCCT
using a rigid registration. The NCCT was used to determine the baseline
Hounsfield
Unit for each region of the brain in a respective patient. The dynamic series
generated
CA 03127833 2021-07-26
WO 2020/154807
PCT/CA2020/050108
- 41 -
from the NCCT and mCTA were post-processed with the following steps: i) the
skull
and ventricles were removed using per patient HU thresholds on the NCCT
(ventricles
= 0-12 HU, Skull > 60 HU). Time-attenuation curves (TAC) were created for each
voxel
after subtraction of the baseline NCCT HU values, which is a normalization
technique
that is common in perfusion processing (d'Esterre et al.; 2015).
[00169] Deconvolution (Fourier based) (Weiner, 1964) and non-deconvolution
approaches were applied to the data from the time-attenuation density curves
to
generate the single metric hemodynamic functional maps (d'Esterre et al.,
2015;
Konstas et al., 2009). For the non-deconvolution approach, five hemodynamic
functional maps were created: 1) time to peak (TIP) = the mCTA phase with the
highest magnitude HU; 2) phase 1 blood flow = the slope of the first and
second HU
magnitude from the mCTA; 3) phase 2 blood flow= the slope of the second and
third
HU magnitude from the mCTA; 4) Flow average = the average of phase 1 blood
flow
and phase 2 blood flow; and 5) Blood volume = integral of the of TAC. For the
deconvolution approach, a cerebral blood flow map was created. All of these
functional
maps can then be used inputs for a machine learning algorithm, to generate an
optimized combination functional map.
[00170] A backwards step-wise logistic regression model was then trained using
the
remaining functional maps to create a combination functional map from the TRH-
CTA
image data. The logistic regression coefficients were varied inside of an
exponential
function to iteratively evaluate the discriminatory ability of the model to
distinguish
infarction and non-infarction at a voxel-level. The equation that was fit to
the data is
shown in equation (1):
P = _______________________________________________________ (1)
1+ e- (A+BX+CY+DZ+EW)
where P is probability of a binomial outcome (between 0 and 1), A is a scaling
constant,
W, X, Y, Z are single metric functional maps, and B, C, D, E are the
respective
coefficients. Any combination of initial perfusion maps can be used, but these
maps
can also be first assessed to determine which are the best performing maps for
detection and then the best performing maps can be provided to the logistic
regression
model, to obtain the coefficients and generate the optimized TRH-CTA-based
perfusion map. Alternatively, other combinations of initial perfusion maps may
be
used, but there will be varying detection accuracies as well as depending on
different
CA 03127833 2021-07-26
WO 2020/154807
PCT/CA2020/050108
- 42 -
characteristics of the stroke such as the type of stroke that occurs and the
location
where the stroke occurs.
[00171] In a sub-set of 40 patients, GE-CTP functional maps were processed by
an
expert using commercially available deconvolution software (CT Perfusion 4D,
General Electric Healthcare, Waukesha, WI). For each study, the arterial input
function
(AIF) was manually selected from the basilar artery or contralateral ICA using
a 2 voxel
x 2 voxel (in-slice) region-of-interest (ROI). The AIF is a function that
results from
measuring the Hounsfield units in each phase of TRH-CTA image data from the
ICA
or basilar arteries. It may be measured by recording the 3 data points in the
ICA during
each of the 3 phases of the TRH-CTA image data and then deconvolving those
from
the rest of the TRH-CTA image data. The optimal AIF, chosen from the basilar
artery
or ICA, will have the earliest contrast arrival time (i.e. when a signal is
starting to be
shown by a rise in Hounsfield Units) and have the highest magnitude (i.e.
height of the
TDC). The latter indicates that there's minimal partial volume averaging.
[00172] For all AlFs, baseline to peak height Hounsfield unit (HU) differences
matched those from the respective sagittal sinus. Absolute maps of cerebral
blood
flow [CBF; ml=min-1.(100g)-1], mean transit time (MIT; seconds), start time of
the
impulse residue function (i.e., delay of the tissue time-density curve with
respect to the
AIF) (To; s), and Tmax=To+0.5*MTT (s) were calculated by deconvolution of
tissue
time-density curves and the AIF using a delay-insensitive algorithm (CT
Perfusion 4D,
GE Healthcare). Average maps were created by averaging the serial (dynamic)
CTP
images over the duration of the first pass of contrast. These average maps
have
suitable anatomical detail for gray/white matter segmentation and as the
source image
for registration with follow-up imaging. In-plane patient motion was corrected
in the
x/y-axis using automated software (CT Perfusion 4D), and in cases with extreme
motion, time points were manually removed as needed (Menon et al., 2015).
[00173] Perfusion map registration: All perfusion parameter maps generated
from
the mCTA and CT perfusion studies respectively were registered to the follow-
up DWI
dataset. Therefore, the optimal rigid transformation was computed between the
follow-
up DWI and average CTP or NCCT dataset, respectively, using the mutual-
information
image similarity metric within a multi-resolution approach (Studholme et al.,
1196;
Gobbi et al., 2003). The resulting transformations were then used to transform
the
CA 03127833 2021-07-26
WO 2020/154807
PCT/CA2020/050108
- 43 -
perfusion maps to the follow-up DWI dataset using linear interpolation to
validate the
logistic regression model.
[00174] Infarct segmentation and perfusion data extraction: Delineation of the
follow-up infarct volume (R01-1) was performed on the follow-up DWI by
applying a
single standardized intensity (Sah et al., 2017). A non-infarct region of
interest (ROI-
2) encompassed any brain tissue outside of R01-1, including voxels from the
contralateral hemisphere. Subcortical structures (i.e. basal ganglia,
including caudate,
lentiform and internal capsule) were manually segmented and analyzed
separately
from cortical gray/white matter.
[00175] Histograms were generated for all R01-1 and R01-2 segmentations,
respectively, from the TRH-CTA based -perfusion images as well as the CTP Tmax
and CBF maps, as these maps have been previously shown by the inventors to
have
the highest accuracy for final infarction (d'Esterre et al., 2017). Patient-
level
histograms from R01-1 and R01-2 were amalgamated to create a single "all
patient"
R01-1 and R01-2 to perform a cohort-level analysis.
[00176] An additional analysis was undertaken to evaluate the effect of lesion
size
on the TRH-CTA-based lesion detection method described. Lesions at different
size
intervals were chosen, while larger or smaller lesions were eliminated from
the
analysis. This interval mean was shifted from 0.015 ml to 1000 ml, with the
upper and
lower bounds on the interval being 10% of the mean (i.e. 100 ml mean, 90 ¨ 110
ml
interval). This analysis was completed to determine if smaller petechial
lesions were
not identified by the TRH-CTA imaging protocol.
Statistical Analysis
[00177] Clinical data were summarized using standard descriptive statistics. A
patient-level analysis and cohort-level analysis was performed using receiver
operator
characteristic curve analysis. At the patient level, the area under the ROC
curve (AUC)
was determined for each patient. At the cohort level, an AUC-ROC was
determined
for all infarct voxels and non-infarct voxels from all patients in an
amalgamated
histogram. Youden's method was used to determine optimal thresholds most
associated with follow-up MRI infarct volume along with respective
sensitivities and
specificities for each threshold (Akobeng, 2007). AUC values were compared
between
the TRH-CTA-based and CTP-based cerebral blood flow and Tmax maps.
CA 03127833 2021-07-26
WO 2020/154807
PCT/CA2020/050108
- 44 -
[00178] A cross validation for the TRH-CTA-based map (derived from the
logistic
regression model) was performed as it was the best performing map from the
patient-
and cohort-level analysis. The analysis was performed on the cohort-level
histograms
using a 10-fold cross validation to assess the performance and consistency of
the
TRH-CTA-based map. Each training set formed 90%, with replacement, of the
total
population and trained the ROC analysis to determine an optimal threshold. The
optimal threshold was then applied to the remaining 10% of the total
population to
assess sensitivity, specificity, AUC, and optimal threshold. This process was
completed 10 times to determine a mean and standard deviation in each of the
above
metrics.
[00179] A two sided p-value <0.05 was considered as statistically significant
for all
statistical tests. All analyses were performed using R (version 3.2.1), STATA
(version13, StataCorp LP, College Station, TX) and MATLAB (R2015a, version
8.5,
Mathworks Inc, Natick, MA) statistical packages.
Results
[00180] Of a total of n=80 patients satisfying study inclusion/exclusion
criteria, n=72
were included in the study. Some patients (N=8) had inadequate registration
results
due to severe motion of one of the NCCT or mCTA series. Clinical demographics,
including are summarized in Table 1. Median(IQR) DWI volume (m1) was 12 ml
(with
a range of 2.2-41.8 m1). The optimal TRH-CTA-based functional map derived from
the
logistic regression was generated from the deconvolution TO, and non-
deconvolution
TTP, CBF and MTT. This optimized TRH-CTA-based functional map was used in the
patient and cohort level analysis as well the cross validation analysis.
Table 1. Admission demographics, site of occlusion and workflow metrics
Variables Total included patients, n=72
I Age, y, median (minimum-maximum) 68 (32-89)
I Men, n (%) 37 (51.4)
Stroke on awakening, n (%) 27 (46.6)
Site of occlusion, n (%)
CA 03127833 2021-07-26
WO 2020/154807
PCT/CA2020/050108
- 45 -
MCA 29 (40.3)
ACA 3(4.0)
ICA 16 (22.2)
Tandem 5 (6.9)
Affected hemisphere, n (/0)
Right 30 (41.7)
Left 39 (54.2)
Coronary Artery Disease, n (%) 12 (16.7)
Congestive Heart Failure, n (%) 6 (8.3)
Valvular Disease, n (`)/0) 2 (3.4)
Hypertension, n (/o) 38 (52.8)
Dyslipidemia, n (%) 24 (33.3)
Diabetes, n ( /0) 1 (1.4)
Smoking, n (%) 20 (27.8)
Statin, n (%) 22 (37.9)
EVT Treatment, n ( /0) 72 (100)
tPA (alteplase) Treatment, n(%) 55(76)
Reperfusion CRF (TICI2B/3), n (%) 72 (100)
Blood Glucose, mmol, median (minimum- 6 (4.4-20.0)
maximum)
NIHSS baseline, median (minimum-maximum) 17(1-29)
NIHSS 24-hours, median (minimum-maximum) 6 (0-24)
MRS baseline, median (minimum-maximum) 0 (0-3)
MRS 90-days, median (minimum-maximum) 2 (0-6)
CT to Reperfusion Time, hh:mm, median 1:28 (0:27-3:06)
(minimum-maximum)
[00181] Comparing ROC-AUC in patients with early and late reperfusion for
cortical
gray matter + white matter, there was no significant difference at the patient-
level (0.83
vs. 0.84 respectively), the cohort-level (0.82 vs. 0.81 respectively) or the
cross-
CA 03127833 2021-07-26
WO 2020/154807
PCT/CA2020/050108
- 46 -
validation (0.77 vs. 0.74 respectively) (see Table 2). Comparing ROC-AUC in
patients
with early and late reperfusion for basal ganglia tissue, there was no
significant
difference at the patient-level (0.82 vs. 0.84 respectively), the cohort-level
(0.81 vs.
0.80 respectively) or the cross-validation (0.82 vs. 0.78 respectively) (see
Table 3).
Table 2. Receiver operator characteristic curve AUG for TRH-CTA-based map,
stratified by CT to reperfusion time for cortical gray + white matter tissue
TRH-CTA - Early Reperfusion , <90 mins (n = 49 patients)
AUC- AUC- Cross Cross
Cross Validation
Statistic Patient Cohort validation Validation
Accuracy
Level Level Sensitivity Specificity
Mean 0.83 0.82 0.82 0.72 0.77
Stdev 0.14 N/A 0.06 0.03 0.06
TRH-CTA - Late Reperfusion, > 90 mins (n = 24 patients)
AUC- AUC- Cross Cross
Cross Validation
Statistic Patient Cohort validation Validation
Accuracy
Level Level Sensitivity Specificity
Mean 0.84 0.81 0.79 0.70 0.74
Stdev 0.11 N/A 0.08 0.06 0.07
Table 3. Receiver operator characteristic curve AUC for TRH-CTA-based map,
stratified by CT to reperfusion time for basal ganglia regions
TRH-CTA - Early Reperfusion, > 90 mins (21 patients)
AUC- AUC- Cross Cross Cross
Statistic Patient Cohort Validation Validation Validation
Level Level Sensitivity Specificity Accuracy
Mean 0.82 0.81 0.82 0.81 0.82
Stdev 0.11 N/A 0.05 0.06 0.06
-----------------
TRH-CTA- Late Reperfusion, <90 mins (7 patients)
AUC- AUC- Cross validation Cross
Cross
Statistic
Patient Cohort Sensitivity Validation Validation
CA 03127833 2021-07-26
WO 2020/154807
PCT/CA2020/050108
- 47 -
Level Level Specificity Accuracy
Mean 0.84 0.80 0.86 0.71 0.78
Stdev 0.1 N/A 0.08 0.09 0.09
[00182] In the patient-level ROC analysis, the SPIRAL map had a slightly
higher,
though non-significant (p <0.05) average ROC-AUC (cortical GM/white matter =
0.82;
Basal ganglia = 0.79 respectively) than both the CTP-Tmax (cortical GM/white
matter
= 0.82; Basal ganglia = 0.78 respectively) and CTP-CBF (cortical GM/white
matter =
0.74; Basal ganglia = 0.78 respectively) perfusion maps. The same relationship
was
observed at the cohort level (see Table 4).
Table 4. Receiver operator characteristic curve AUC for TRH-CTA-based map
comparison with cine CTP maps for a 40 patient sub-cohort
TRH-CTA-based Map
Mean (stdev) Mean (stdev)
Statistic
Cortical GM + white matter Basal ganglia
AUC-Patient Level 0.83 (0.14) 0.79 (0.08)
AUC-Cohort Level 0.82 0.80
CTP T-MAX Map
AUG-Patient Level 0.82 (0.13) 0.78 (0.11)
AUC-Cohort Level 0.81 0.74
CTP Blood Flow Map
AUG-Patient Level 0.74(0.14) 0.78(0.09)
A UC-Cohort Level 0.72 0.77
[00183] The TRH-CTA-based map was significantly less accurate to detect
smaller
lesions (1-10mL) while equally as accurate to identify larger lesions (>100mL)
compared to GE-CTP (see FIG. 6). This may be due to using less data points
since
the spatial resolution in the TRH-CTA image data is decreased in order to
increase
the signal-to-noise ratio by "smoothing" out noise. Therefore, if there are
small lesions,
those may be smoothed out. This might be improved by optimizing the filtering
process.
CA 03127833 2021-07-26
WO 2020/154807
PCT/CA2020/050108
- 48 -
[00184] Perfusion from low temporally sampled contrast enhanced imaging has
been previously shown in a seminal paper by Heinz et al. 1979 (Reid et al,
2018).
Similarly, it is shown herein that perfusion maps can be successfully
generated from
a temporally sampled helical CTA, potentially obviating the need for an
additional cine
CTP scan in the future. The accuracy, sensitivity, and specificity for follow-
up infarct
volume is similar to reported values from the CTP literature and the current
CTP
paradigm available at the inventors' institute (d'Esterre et al., 2013). The
inventors
have recently shown that perfusion measured on mCTA source images can better
predict follow-up infarction and clinical outcomes when compared to NCCT and
.. mCTA-rLMC (pial collateral scoring), the current paradigm used by the
Calgary Stroke
Program (Zerna et al., 2016; Shamy et al., 2013). Furthermore, NCCT and CTA
collateral score for stroke decision making requires expert interpretation,
contributing
diagnostic uncertainty among non-experts (Shamy et al., 2013; Moeller et al.,
2008).
[00185] Advantageously, the TRH-CTA imaging workflow of the present teachings
provide an objective, easy to interpret, inexpensive, and time-sensitive
imaging
paradigm to characterize the ischemic lesion at admission with the TRH-CTA
imaging
protocol. For example, FIGS. 7A-7C provide three case study examples of images
obtained with the TRH-CTA imaging protocol versus GE-CTP Tmax functional maps.
[00186] Improving patient outcome in acute stroke patients depends on fast
treatment, high diagnostic accuracy, and confidence among non-expert
physicians
because stroke patient outcomes are heavily dependent on these factors. Brain
imaging plays a key role in decision making that has required expert
interpretation
(Wintermark et al., 2013; Goyal et al., 2013; Sheth et al., 2012; Menon et
al., 2014;
Kudo et al., 2010; Bivard et al., 2013; Menon et al., 2015; Nambiar et al.,
2014; Mishra
et al., 2014), but among non-stroke experts it is a major cause for treatment
delays
(Shamy et al., 2013; Barber et al., 2001). CT angiography (CTA) is required to
identify
large vessel occlusion that may be amenable to remove via endovascular
thrombectomy (EVT). Canadian guidelines strongly recommend use of CT Perfusion
(CTP) to select acute ischemic stroke patients for EVT in the late time window
at about
6-24 hours after symptom onset (Boulanger et al., 2018), and also has the
advantage
that it can improve diagnostic accuracy for the identification of ischemic
stroke (Hoang
et al., 2013). Although, CTP is a required modality for all Comprehensive
Stroke
Centres, CTP has significant limitations; CTP requires a separate image
acquisition
CA 03127833 2021-07-26
WO 2020/154807
PCT/CA2020/050108
- 49 -
and post processing (delaying treatment), another contrast injection
(increasing risk of
acute nephropathy), and additional exposure to ionizing radiation (increased
cancer
risk). Finally, CTP has not been widely adopted in rural stroke centres (Menon
et al.,
2015; Davenport et al., 2013). However, the study results included herein,
show that
TRH-CTA-based functional maps can accurately identify infarct core, and is
faster,
less expensive, and likely safer technique for obtaining brain blood flow
perfusion
maps from a time resolved helical CT angiogram.
[00187] It should be noted that study #2 used highly selected patients with
moderate
to severe stroke symptoms that were treated with EVT and achieved very good
and
fast reperfusion to achieve an operational definition of "infarct core".
Several patients
were removed from study #2 due to the inability to register the images (motion
correction to obtain the time attenuation curve. Nevertheless, the number of
patients
removed due to this error is consistent with other studies (d'Esterre et al.,
2015). In
study #2, the gray and white matter tissue compartments were not separated to
determine respective accuracies ¨ compared to CTP where an "Average Map"
provides adequate gray/white differentiation, a low temporally resolved CTA
cannot
provide this.
[00188] As described herein, the TRH-CTA imaging protocol has the potential
for
reducing the time for image acquisition and radiological interpretation
compared to
NCCT, CTA collateral scores, and cine CT perfusion techniques. It is also
believed
that standardized TRH-CTA automation will maintain the diagnostic accuracy of
cine
CTP based paradigms, thus providing the potential for supporting significant
improvements in stroke triaging, both in comprehensive and primary stroke
centres.
The TRH-CTA imaging protocol may also improve the generalizability of stroke
reperfusion treatments outside the comprehensive tertiary care centres in both
urban
and rural communities. Other potential effects of the TRH-CTA imaging protocol
are
improved resource utilization and cost of imaging as TRH-CTA imaging does not
require sophisticated processing or trained personnel beyond the acquisition
of a
dynamic helical CTA.
[00189] While the applicant's teachings described herein are in conjunction
with
various embodiments for illustrative purposes, it is not intended that the
applicant's
teachings be limited to such embodiments as the embodiments described herein
are
CA 03127833 2021-07-26
WO 2020/154807
PCT/CA2020/050108
- 50 -
intended to be examples. On the contrary, the applicant's teachings described
and
illustrated herein encompass various alternatives, modifications, and
equivalents,
without departing from the embodiments described herein, the general scope of
which
is defined in the appended claims.
CA 03127833 2021-07-26
WO 2020/154807
PCT/CA2020/050108
- 51 -
REFERENCES
AbeIs B, Klotz E, Tomandl BF, Kloska SP, LeII MM, (2010), "Perfusion CT in
Acute
Ischemic Stroke: A Qualitative and Quantitative Comparison of Deconvolution
and
Maximum Slope Approach", American Journal of Neuroradiology, October, 31(9):
1690-
1698.
Akobeng AK. (2007), 'Understanding diagnostic tests 3: Receiver operating
characteristic curves", Acta Paediatr. 96:644-647.
Barber PA, Zhang J, Demchuk AM, Hill MD, Buchan AM, (2001), "Why are stroke
patients excluded from tpa therapy? An analysis of patient eligibility",
Neurology,
56:1015-1020.
Bivard A, Levi C, Spratt N, Parsons M., (2013), "Perfusion ct in acute stroke:
A
comprehensive analysis of infarct and penumbra", Radiology, 267:543-550.
Boulanger JM, Lindsay MP, Gubitz G, Smith EE, Stotts G, Foley N, et al.,
(2018),
"Canadian stroke best practice recommendations for acute stroke management:
Prehospital, emergency department, and acute inpatient stroke care, 6th
edition,
update 2018", International journal of stroke: official journal of the
International Stroke
Society, 13:949-984.
Davenport MS, Khalatbari S, Dillman JR, Cohan RH, Caoili EM, Ellis JH.,
(2013),
"Contrast material-induced nephrotoxicity and intravenous low-osmolality
iodinated
contrast material", Radiology, 267:94-105.
d'Esterre CD, Boesen ME, Ahn SH, Pordeli P, Najm M, Minhas P, Davari P,
Fainardi
E, Rubiera M, Khaw AV, Zini A, Frayne R, Hill MD, Demchuk AM, Sajobi TT,
Forkert
ND, Goyal M, Lee TY, Menon BK, (2015), "Time-Dependent Computed Tomographic
Perfusion Thresholds for Patients With Acute Ischemic Stroke", Stroke, 46:3390-
3397.
CA 03127833 2021-07-26
WO 2020/154807
PCT/CA2020/050108
- 52 -
Fang R, Zhang S, Chen T, SaneIli PC, (2015), "Robust Low-dose CT Perfusion
Deconvolution via Tensor Total-Variation Regularization" IEEE Trans. Med.
Imaging,
Jul; 34(7): 1533-1548.
Frolich AM, Wolff SL, Psychogios MN, et al. (2014), "Time-resolved assessment
of
collateral flow using 4D CT angiography in large-vessel occlusion stroke" Eur.
Radiol.;24(2), pp. 390-396.
Gobbi DG, Peters TM., (2003), "Generalized 3d nonlinear transformations for
medical
imaging: An object-oriented implementation in vtk'', Comput Med Imaging Graph,
27:255-265.
Goyal M, Menon BK, Derdeyn CP., (2013), "Perfusion imaging in acute ischemic
stroke: Let us improve the science before changing clinical practice",
Radiology,
266:16-21.
Goyal M, Demchuk AM, Menon BK, Eesa M, Rempel JL, Thornton J, et al. (2015),
"Randomized assessment of rapid endovascular treatment of ischemic stroke" New
England Journal of Medicine. 372:1019-1030.
Hoang JK, Wang C, Frush DP, Enterline DS, Samei E, Toncheva G, et al., (2013),
"Estimation of radiation exposure for brain perfusion ct: Standard protocol
compared
with deviations in protocol", American journal of roentgenology, 201:W730-734.
Horn J, Dankbaar JW, Schneider T., Cheng SC, Bredno J, Wintermark M, (2009),
"Optimal Duration of Acquisition for Dynamic Perfusion CT Assessment of Blood-
Brain
Barrier Permeability Using the Patlak Model", American Journal of
Neuroradiology,
August, 30(7):1366-1370.
Konstas AA, Goldmakher GV, Lee T-Y, and Lev MH. (2009), "Theoretic basis and
technical implementations of ct perfusion in acute ischemic stroke, part 2:
Technical
implementations", American Journal of Neuroradiology, 30:885-892.
CA 03127833 2021-07-26
WO 2020/154807
PCT/CA2020/050108
- 53 -
Kudo K, Sasaki M, Yamada K, Momoshima S, Utsunomiya H, Shirato H, et al.,
(2010),
"Differences in ct perfusion maps generated by different commercial software:
Quantitative analysis by using identical source data of acute stroke
patients",
Radiology, 254:200-209.
Menon BK, O'Brien B, Bivard A, et al. (2013), "Assessment of leptomeningeal
collaterals using dynamic CT angiography in patients with acute ischemic
stroke", J.
Cereb. Blood Flow Metab.;33(3), pp. 365-371.
Menon BK, Almekhlafi MA, Pereira VM, GraIla J, Bonafe A, Davalos A, et al.,
(2014),
"Optimal workflow and process-based performance measures for endovascular
therapy in acute ischemic stroke: Analysis of the solitaire fr thrombectomy
for acute
revascularization study", Stroke, 45:2024-2029.
Menon BK, d'Esterre CD, Qazi EM, Almekhlafi M, Hahn L, Demchuk AM, and Goyal,
M. (2015), "Multiphase CT Angiography: A New Tool for the Imaging Triage of
Patients
with Acute Ischemic Stroke", Radiology, Vol. 275, No. 2, May, pp. 510-520.
Mishra SM, Dykeman J, Sajobi TT, Trivedi A, Almekhlafi M, Sohn SI, et al.,
(2014),
"Early reperfusion rates with iv tpa are determined by cta clot
characteristics", Am J
Neuroradiol, Dec; 35(12):2265-72.
Moeller JJ, Kurniawan J Fau - Gubitz GJ, Gubitz Gj Fau - Ross JA, Ross Ja Fau -
Bhan V, Bhan V., (2008), "Diagnostic accuracy of neurological problems in the
emergency department",Can J. Neurol. Sci., Jul; 35(3):335-41.
Nambiar V, Sohn SI, Almekhlafi MA, Chang HW, Mishra S, Qazi E, et al., (2014),
"Cta
collateral status and response to recanalization in patients with acute
ischemic stroke",
American journal of neuroradiology, 35:884-890.
Reid M, Famuyide AO, Forkert ND, Sahand Talai A, Evans JW, Sitaram A, et al.,
(2018), "Accuracy and reliability of multiphase cta perfusion for identifying
ischemic
core", Clinical neuroradiology, Sep; 29(3):543-552.
CA 03127833 2021-07-26
WO 2020/154807
PCT/CA2020/050108
- 54 -
Sah RG, d'Esterre CD, Hill MD, Hafeez M, Tariq S, Forkert ND, et at., (2017),
"Diffusion-weighted mri stroke volume following recanalization treatment is
threshold-
dependent", Clinical neuroradiology, Mar; 29( 1):135-141.
Shamy MC, Jaigobin CS., (2013), "The complexities of acute stroke decision-
making:
A survey of neurologists", Neurology, 81:1130-1133.
Sheth KN, Terry JB, Nogueira RG, Horev A, Nguyen TN, Fong AK, et at., (2012),
"Advanced modality imaging evaluation in acute ischemic stroke may lead to
delayed
endovascular reperfusion therapy without improvement in clinical outcomes",
Journal
of neurointerventional surgery., May; 5 Suppl. 1:i62-5
Studholme C, Hill DL, Hawkes DJ., (1996), "Automated 3-d registration of mr
and ct
images of the head", Med Image Anal.1:163-175.
Volny 0, Cimflova P, Kadlecova P, Vanek P, Vanicek J, Menon BK, Mikulik R,
(2017),
"Single-Phase Versus Multiphase CT Angiography in Middle Cerebral Artery Clot
Detection-Benefits for Less Experienced Radiologists and Neurologists", J
Stroke
Cerebrovasc Dis.; Jan;26(1):19-24.
Weiner, N., (1964), Extrapolation, Interpolation and Smoothing of Stationary
Time
Series, Cambridge, Mass: MIT Press. ISBN 0-262-73005-7.
Wintermark M, Albers GW, Broderick JP, Demchuk AM, Fiebach JB, Fiehler J, et
at.,
(2013), "Acute stroke imaging research roadmap ii", Stroke, 44:2628-2639.
Zerna C, Assis Z, d'Esterre CD, Menon BK, Goyal M., (2016), "Imaging,
intervention,
and workflow in acute ischemic stroke: The calgary approach", American journal
of
neuroradiology, 37:978-984.