Note: Descriptions are shown in the official language in which they were submitted.
CA 03153677 2022-03-07
WO 2020/051327 PCT/US2019/049739
1
SYSTEM AND METHOD OF TREATING A PATIENT BY A HEALTHCARE PROVIDER
USING A PLURALITY OF N-OF-1 MICRO-TREATMENTS
CROSS REFERENCE TO RELATED APPLICATIONS
100011 This application claims the benefit of U.S. Provisional Patent
Application Serial
No. 62/727,296, filed September 5, 2018, the entirety of which is hereby
incorporated by
reference.
TECHNICAL FIELD
100021 The present disclosure pertains to a system and method of treatment
of a patient
by a healthcare provider by using a plurality of N-of-1 micro-treatments.
BACKGROUND
100031 After many centuries and millennia of "snake oil" sales people and
witch doctors
offering treatments to diseases, the advent of scientist, medical
professionals, and statisticians
developed expensive random control trials gold standard to bring scientific
rigor to validate
treatment effect. When a drug or treatment works for nearly everyone, such as
cures for strep
throat or many pain medications, there is a high confidence that most people
can be successfully
treated with these treatments, i.e., population-based science.
100041 This population-based science led to the growth of the
pharmaceutical industry and
many blockbuster drug successes and other medical/surgical treatments. The
otherwise expensive
cost of random control trials is amortized across a large number of patients,
which has made these
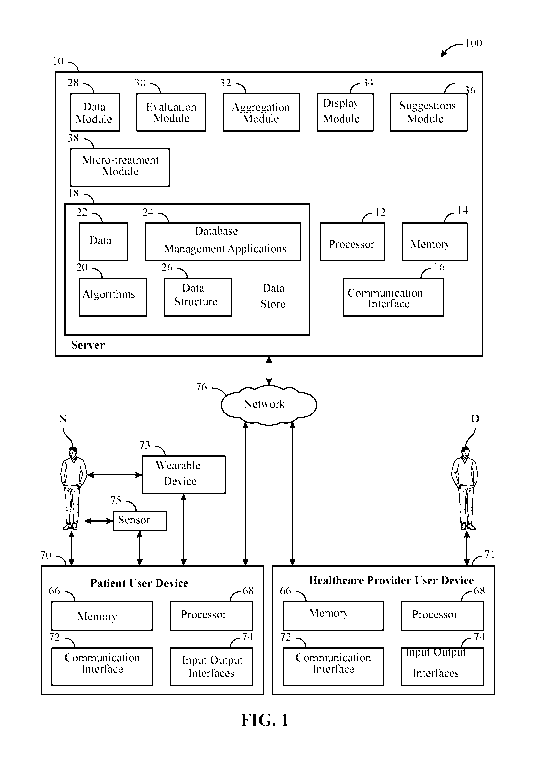
high confidence, complex studies affordable. This approach works well when the
assumption is
made that all humans are largely the same and will respond to treatment
similarly. However, at
the same time, science has learned that humans are also very different from
one another, where
each human has a unique genetic makeup, has a unique brain, exists in a unique
environment, with
different learning histories, habits, values and lifestyle, etc.
100051 Society's more challenging diseases, such as diabetes, COPD, mental
health,
Alzheimer's Disease, etc., are complex and chronic. Many of these chronic
diseases have
beneficial treatment population effect sizes that are less than 50%, as
compared to placebo or
current standard of care control groups. For example, many depression
medicines, on average,
work for about 20% of patients, as compared to placebo, while experiencing
only minimal side
effects. As another example, there are currently only four FDA approved
compounds for the
treatment of Alzheimer's Disease. Only 4% of Alzheimer's Disease patients
receive moderate or
significant benefit when treated with these four compounds, as compared to
placebo, while
experiencing only minimal side effects.
CA 03153677 2022-03-07
WO 2020/051327 PCT/US2019/049739
2
SUMMARY
10006) A system of one or more computers can be configured to perform
particular
operations or actions by virtue of having software, firmware, hardware, or a
combination of
them installed on the system that in operation causes or cause the system to
perform the actions.
One or more computer programs can be configured to perform particular
operations or actions
by virtue of including instructions that, when executed by data processing
apparatus, cause the
apparatus to perform the actions. One general aspect includes a method of
using a patient
treatment system to actively monitor and treat a patient. The method includes:
receiving, by a
computing device, first and second order response data corresponding to a
respective first and
second micro-treatment prescribed to a patient, where the first and second
order response data
represents results of the respective first and second micro-treatment for the
patient at each of a
plurality of intervals in time. The method also includes where the second
micro-treatment
occurs after the first micro-treatment. The method also includes recording the
first and second
order response data into a database that includes time series response data
for each of the first
and second micro-treatments; calculating, by the computing device: a first
data score and a
second data score by applying an N-of-1 statistical analysis respectively to
each of the first and
second order response data, where the first and second data scores
statistically represent an
effectiveness of the respective first and second micro-treatment; a trend of
the first and second
data scores; and a statistical confidence associated with each of the first
and second data scores.
The method also includes recording the first and second data scores into the
database and
generating, by the computing device, a graphical user interface on a display
screen of a user
device.
[0007) The graphical user interface includes at least one of an
effectiveness display that
displays at least one of the response level to each of the first and second
micro-treatments and a
trend line representing the trend of the first and second data scores; the
first and second data
scores and a confidence display that displays the statistical confidence
associated with each of
the first and second data scores; first and second graphical elements, where
the first and second
graphical element represent the statistical confidence associated with each of
the first and second
data scores. The method also includes generating, by the computing device, a
graphical user
interface on the display screen of the user device including at least one
third micro-treatment
option to be prescribed to the patient.
100081 Another general aspect includes a method of treating a patient with
a patient
treatment system, the method including: receiving, by a computing device,
first and Xth order
response data corresponding a respective first and Xth micro-treatment
prescribed to a patient,
CA 03153677 2022-03-07
WO 2020/051327
PCT/US2019/049739
3
where the first and Xth order response data corresponds to the results of the
respective first and
Xth micro-treatment for the patient at each of a plurality of intervals in
time; where the Xth
micro-treatment occurs after the first micro-treatment; recording the first
and Xth order response
data into a database that includes time series response data for each of the
first and Xfil micro-
treatments; calculating, by the computing device, a first data score and an
Xth data score by
applying an N-of-1 statistical analysis respectively to each of the first and
Xth order response
data, where the first and Xth data scores statistically represent an
effectiveness of the respective
first and Xth micro-treatment; calculating, by the computing device, a first-
to-Nth delta
representing a difference between the Xth data score and the first data score,
where the first-to-
Xth delta represents an amount of change of the micro-treatment effectiveness
from the first to
the Xth micro-treatment; and generating, by the computing device, a graphical
user interface on a
display screen of a user device, where the graphical user interface includes:
a change display that
displays an X-Y plot of the first data score and the Xth data score to
graphically represent an
amount of change of the micro-treatment effectiveness from the first micro-
treatment to the Xth
micro-treatment; and displaying the generated graphical user interface. Other
embodiments of
this aspect include corresponding computer systems, apparatus, and computer
programs
recorded on one or more computer storage devices, each configured to perform
the actions of the
methods.
10009] Yet
another general aspect includes a method of treating a patient with a patient
treatment system, the method including: recording at least one health
attribute and at least one
health condition of a patient into a database, such that the at least one
health attribute and the at
least one health condition is associated with a patient profile of the
patient; recording first and
second order response data into a database that includes time series response
data for each of a
first and second micro-treatment, such that the first and second order
response data is associated
with the patient profile of the patient; calculating, by the computing device,
a first data score and
a second data score by respectively applying an N-of-1 statistical analysis to
each of the first and
second order response data, where the first and second data scores
statistically represent an
effectiveness of the respective first and second micro-treatment; recording
the first and second
data scores into the database, such that the first and second data scores are
associated with the
patient profile of the patient; calculating, by the computing device, a first-
to-second delta
representing a difference between the second data score and the first data
score, where the first-
to-second delta represents an amount of change of the micro-treatment
effectiveness from the
first to the second micro-treatment; recording the first-to-second delta into
the database, such
that the first-to-second delta is associated with the patient profile of the
patient; where the
database further includes another patient profile corresponding to one other
patient, where the
CA 03153677 2022-03-07
WO 2020/051327 PCT/US2019/049739
4
patient profile of the one other patient includes a health attribute, a health
condition, first and
second order response data corresponding to a first and second micro-treatment
prescribed to the
other patient, where the first and second order response data corresponds to
the results of the
respective first and second micro-treatments at each of a plurality of time
intervals, and first and
second data scores that statistically represent an effectiveness of each of
the first and second
micro-treatments for the other patient; generating, by the computing device, a
graphical user
interface on a display screen of a user device, where the graphical user
interface includes: a
change display that displays an X-Y plot of for the patient representing the
first order and second
order response data at each of the plurality of intervals during the
respective first and second
micro-treatment and that displays an X-Y plot for the other patient
representing the first order
and second order response data at each of the plurality of intervals during
the respective first and
second micro-treatment; and displaying the generated graphical user interface.
Other
embodiments of this aspect include corresponding computer systems, apparatus,
and computer
programs recorded on one or more computer storage devices, each configured to
perform the
actions of the methods.
100101 In one aspect of the disclosure, a treatment system is provided for
blending
known population-based treatment effects (group averages) with N-of-1 measures
(of the
individual patient).
10011] In another aspect of the disclosure, a treatment system is provided
for blending
known population-based treatment effects with N-of-1 science for displaying
intervention
insights and group clusters.
100121 In yet another aspect of the disclosure, a treatment system is
provided for drug
and trial treatment enhancement with environmental sensor data.
[0013] Another aspect of the disclosure provides a treatment system for
crowdsourcing
(i.e. a model by which individuals data and/or activity) is organized to
optimize the value or
goods and/or services. These services include ideas and finances, from a
large, relatively open
and often rapidly-evolving group of individuals and their inputs) new
treatment insights.
100141 Evidence-based medicine (EBM) is the application of scientific
evidence to
clinical practice. In most medical trials and treatments, global evidence
("average effects" or
"population-based treatment effects" measured as population means) is applied
to individual
patients, regardless of whether those individual patients depart from the
population average. In
getting drugs approved for treatment of a medical condition during clinical
trials, the benefit or
harm can be misleading and fail to reveal the potentially complex mixture of
substantial benefits
for some, little benefit for many, and harm for a few.
100151 With nearly a 100% standard of care, a doctor's treatment of a
patient having a
CA 03153677 2022-03-07
WO 2020/051327 PCT/US2019/049739
complex chronic disease is based solely on population-based science and based
on the
probability of helping the most people the most based on known effects, even
when known
current recommended treatment only has a 1:25 population effect size. Further,
the current
standard of care is typically a medical assessment that occurs at a single
point in time, and then a
single one to twelve-month follow-up assessment in nearly all chronic health
cases. Typically,
this level of follow up leads to infrequent subsequent visits and assessments
of treatment
response. This long standing, long-interval approach reduces the opportunity
to find the best or
optimized treatment for each patient. Statistically, this long-interval
approach creates a high
number of false positives or false negative effects for chronic health care.
In many cases,
placebo or other non-medical treatments, e.g., exercise or diet change, would
have a higher
positive effect with less side effects. For many ailments, this long-interval
approach not only
reduces positive outcomes for individual patients, but in many cases, this
reduces positive
outcomes for much of the disease population. There is a big opportunity by
providing more
evidenced-based personalized care in more scalable, cost-effective approach
for collecting data
more frequently and displaying easy to understand standardized N-of-1 decision
support data
fast enough and often enough.
100161 Some patients will experience more or less benefit from treatment
than the
averages reported from clinical trials; such variation in therapeutic outcome
is termed
heterogeneity of treatment effects (HTE). Identifying HTE is necessary to
individualize
treatment, since HTE reflects patient diversity in risk of disease,
responsiveness to treatment,
vulnerability to adverse effects, and utility for different outcomes. By
recognizing these factors,
customized treatments can be prescribed and documented at the individual (N-of-
1) patient level
to effectively determine which treatment is most effective for an individual.
[0017) These individual differences need the application of individual
science, or N-of-1
statistics based off of N-of-1 trials, to have rigor or confidence. Just like
population-based
science, the goal with N-of-1 trials is to gain confidence in the likelihood
of a true cause and
effect relationship, or reduce Type 1 or Type 2 errors (false positive or
false negative
observations), while providing individualized treatment. In population
studies, a high
confidence is achieved by increasing the number of participants (a high N).
For individuals (N-
of-1), a study needs more measurements per treatment time period (or
"segment").
100181 There is a need to better understand the true treatment effect on
an individual (N-
of-1), with a high confidence. N-of-1 (single subject) trials consider an
individual patient as the
sole unit of observation in a study investigating the efficacy or side-effects
of different
treatments. The ultimate goal of an N-of-1 trial is to determine the optimal
or best intervention
for an individual patient using objective data-driven criteria. However, due
to the high costs
CA 03153677 2022-03-07
WO 2020/051327 PCT/US2019/049739
6
associated with individualized attention to a patient, N-of-1 trials have been
used sparingly in
medical and general clinical settings.
[0019] Also, wide adoption has been limited due to the burden in overseeing
longitudinal
data collection (i.e., track the same sample at different points in time), low
patient data
completeness, the inability to do analysis of the data fast enough to generate
impact, a lack of
standards, and a difficulty in getting payment from insurance providers for
this higher cost
approach. These, and other challenges, continue to limit the use of this more
accurate
personalized scientific treatment approach. Therefore, there exists a need for
a simple, fast,
practical, cost effective, standardized, and reliable indicator of individual
patient treatment
effectiveness, or lack of effectiveness, with less decision errors (i.e., more
confidence).
[0020] There is a need for diagnosing root cause issues and accurate
treatment effect
decision making for other complex systems, not just patients, for example, but
not limited to,
humans, animals, plants, smart systems, mechanical systems, computer systems,
and the like.
[0021] The above noted and other features and advantages of the present
disclosure are
readily apparent from the following detailed description when taken in
connection with the
accompanying drawings.
BRIEF DESCRIPTION OF THE DRAWINGS
10022] FIG. 1 provides a schematic illustration of an exemplary treatment
system for a
treatment system for treating a patient by a healthcare provider.
100231 FIG. 2 is a flow chart describing an example method the treatment
system of Fig.
1.
100241 FIG. 3A is a schematic illustrative graphical user interface of an
exemplary chart
representing a quality score of three different micro-treatments, across three
segments.
100251 FIG. 3B is a schematic illustrative graphical user interface of
another exemplary
chart or digital dashboard representing multiple patients, and their names,
associated current
micro-treatment, micro-treatment trends, recommended micro-treatments,
compliance, an
outcome variable being measured throughout the micro-treatments, compliance
percentage, an
IAQ score, and a delectable details link to allow a healthcare provide to open
a.
100261 FIG. 3C is a schematic illustrative graphical user interface of yet
another
exemplary chart representing a quality score of three different micro-
treatments, across three
segments for the patient "Raymond" represented in FIG. 3B.
10027] FIG. 4 is a schematic block diagram illustrating patient data.
10028] FIGS. 5-10 represent a schematic series of X-Y graphical journey
maps showing
depression versus quality of life for a patient over an interval of time.
CA 03153677 2022-03-07
WO 2020/051327 PCT/US2019/049739
7
[0029] FIGS. 11-15 represent a schematic series of X-Y graphical journey
maps showing
depression versus quality of life for four different patients over an interval
of time for each of
three different micro-treatment phases, i.e., Phase A, Phase, B, and Phase C.
100301 FIGS. 16-21 represent a schematic series of X-Y graphical journey
maps showing
depression versus quality of life for four different treatment clusters, with
each treatment cluster
including 1000 patients, over an interval of time for each of three different
micro-treatment
phases, i.e., Phase A, Phase B, and Phase C.
[0031] FIG. 22-28 represent a schematic series of X-Y graphical journey
maps showing
depression versus quality of life for five different treatment clusters, with
each treatment cluster
including 1000 patients, over an interval of time for each cluster over three
different micro-
treatment phases, i.e., Phase A, Phase B, and Phase C.
100321 FIG. 29-35 represent a schematic series of X-Y graphical journey
maps showing
depression versus quality of life for a single treatment cluster, as compared
with a single patient
from the treatment cluster, over an interval of time over three different
micro-treatments, i.e.,
Phase A, Phase B, and Phase C.
[0033] FIG. 36-40 represent a schematic series of X-Y graphical journey
maps showing
depression versus quality of life for a patient over an interval of time and
over three different
micro-treatment phases, i.e., Phase A, Phase B, and Phase C, while showing a
confidence score
for the patient at each of the intervals in time, over each of the phases.
DESCRIPTION
[0034] Figure 1 shows an exemplary schematic illustration of a treatment
system 100 for
executing an exemplary treatment process 200 illustrated by the block diagram
shown in FIG. 2.
The treatment system 100 is configured to quickly and efficiently blend known
population-based
treatment effects ("group average science" or GAS) with individual science (N-
of-1) to support
individual and population health outcomes and enable better personalized care,
while reducing
medical system costs in the treatment of, or development of cures for,
diseases, disorders,
injuries, complex system problems, and the like ("ailments"). The ailments
capable of being
targeted by the treatment system 100 include, but should not be limited to,
allergic disease,
autoimmune disease, cardiac disease, dermatologic disease, endocrine disease,
gastrointestinal
disease, genetic disease, hematologic disease, immunodeficiency disease,
infectious disease,
neurologic disease, oncologic disease, pulmonary disease, renal disease,
emotional issues,
behavioral risk and rheumatologic disease. The disorders capable of receiving
effective
treatment by the treatment system 100 may include mental health disorders,
such as depression,
along with other complex chronic diseases, such as Alzheimer's Disease,
dementia, rheumatoid
CA 03153677 2022-03-07
WO 2020/051327 PCT/US2019/049739
8
arthritis, diabetes, multiple sclerosis, lupus, cancer, and the like can be
realized.
100351 The treatment system 100 allows a healthcare team, consisting of a
patient and
the healthcare providers, to achieve personalized treatment outcomes, with
high confidence,
while significantly reducing the burdens associated with treatment of the
individual using
individual science (N-of-1) alone. The treatment system 100 frequently
captures data from a
patient N in real-time, and the data is presented on a dashboard 40, i.e., a
digital dashboard, as
different treatment segments or "phases", e.g., micro-treatments 42, to
determine which, if any,
treatment interventions may be required. Referring to FIGS. 3A-3C, exemplary
Phases 52 may
include Phase A, Phase B, and Phase C are shown on a personal treatment plan
for a single
patient. The treatment plan for Phase A is different from Phase B and Phase C,
that outcome
results 44 are shown on an X-Y graph in terms of depression 46 and a quality
of life (QoL) 48
(on a Y-axis) along intervals of time (on an X-axis). The visualization of the
results of the
different treatment interventions assist healthcare providers with providing
better informed, and
more efficient, treatment decisions for the patient. In one non-limiting
example, the treatment
system 100 may capture data for a particular micro-treatment from the patient
daily, with the
segment of the micro-treatment lasting for one-month. It should be
appreciated, however, that
the Phases 52 are not limited to A, B, and C, as any number of Phases 52 A-Xth
may be included.
100361 Patients N are medical patients, individual humans, or other complex
systems,
like but not limited to animals, plants, artificial intelligence devices,
weather, etc. Healthcare
providers may include, but should not be limited to, physicians, medical
physicians, nurses,
psychologists, pharmacists, physician assistants, or other professional care
providers or complex
system specialists, scientists, self-scientists, and the like. The healthcare
provides may also
include the actual patient and/or the caregiver to the patient, due to the
intimate knowledge
associated with the conditions being treated and their effects. The treatment
team may also
include home care providers, such as nurses, family members, friends, and the
like who may
assist the patient N with compliance with their treatments and/or data entry.
[0037] The treatment system 100 includes a data server 10 in communication,
via a
network 76, with a patient user device 70, a healthcare provider user device
71 and the like. In
the example shown, the treatment system 100 can include a wearable device 73
in
communication, via the network 76, with the data server 10. The example shown
in FIG. 1 is
non-limiting, such that treatment system 100 can be configured such that the
data server 10 can
include other user devices, and other devices suitable for monitoring,
measuring, and/or
recording physiological data, psychophysiological data, environmental data,
and/or geographic
attributes, relevant to the patient, in real time, to provide a patient's
digital health knowledge.
Alternatively, in another non-limiting example, the treatment system 73 may be
encapsulated
CA 03153677 2022-03-07
WO 2020/051327 PCT/US2019/049739
9
within the wearable device 73 as a standalone system.
100381 With many ailments, relief and/or a cure may be provided to a
patient N through
treatments that may include, but should not be limited to, the adoption of a
particular diet, the
adoption of a particular lifestyle, taking a prescribed medication, and/or the
like. The advent of
personal computing devices, i.e., user devices 70, 71, and wearable devices 73
have improved
the ability of patients N and/or the patient's caregivers to self-monitor the
effectiveness (or lack
of effectiveness) of a particular treatment of the ailment on the patient N,
or lack of adherence to
the particular treatment by the patient N, when not in the continued presence
of the healthcare
provider D. However, the concept of self-monitoring faces significant
challenges because self-
monitoring, by itself, does not often lead to a sustained behavior change and
self-monitoring
requires a behavior to be operationalized and recorded for analysis,
presentation, and
interpretation at a later point in time. This historically has been a labor-
intensive prospect for
the person doing the self-observation (e.g., the patient N and/or the non-
professional or
professional caregiver) and adherence to good data collection can be
difficult. For example,
Alzheimer's Disease patients typically require significant support with
medication monitoring
due to confusion and forgetfulness, associated with cognitive decline.
100391 Digitally enabled mobile tracking applications (typically embodied
in wearable
devices 73 or other patient user devices 70), can help solve both of the
challenges otherwise
faced by self-monitoring, by tracking and recording digital health knowledge
relating to the
patient N being treated. When designed properly, mobile tracking applications
associated with
such devices 70, 73 can be pre-programmed with structure to alert the patient
N or the caregiver
about activities to be performed, operationalization goals, and related target
behaviors (i.e. sub-
goals), data analysis, recording of the data, and presentation of the
collected data.
Operationalization is the process of defining the measurement of a phenomenon
that is not
directly measurable, though its existence is indicated by other phenomena. By
way of a non-
limiting example, in medicine, a health phenomenon might be operationalized by
one or more
indicators like a body mass index, amount of alcoholic beverages consumed per
day, the amount
of exercise attained per day, the amount of sleep per night, happiness on a
particular day,
perception of a quality of life on a particular day, and the like. The health
of the patient N may
be monitored and measured by setting one or more operationalization goals,
such as requiring at
least 8 hours of sleep per night, walking one mile per day, drinking one glass
of wine per day,
and the like. In doing so, a relationship between the operationalization goals
and one or more
health outcomes may be observed and recorded, such as, the patient's happiness
each day, the
patient's perception of a quality of life, heart rate, and the like.
100401 However, it should be appreciated that treatments for patients N
with many
CA 03153677 2022-03-07
WO 2020/051327 PCT/US2019/049739
ailments are not universal. For example, with respect to Alzheimer's Disease,
the current
medications provide meaningful relief to less than five percent of patients.
Some studies have
suggested that some patients receive benefit from merely taking a placebo,
while other patients
receive benefit from a combination of the medication and receiving a certain
amount of exercise
each day or other non-medication treatments. However, as already discussed,
the ability to
determine which treatment, or combination of treatments, would work best for a
specific patient
N through only the application of N-of-1 science is typically time consuming.
100411 In comparison, the treatment system 100 of Figure 1 is configured to
combine
existing, validated group/aggregated data (e.g., clinical guidelines, evidence-
based treatment
goals, etc.) with individual patient N data points to place the individual
patient's N response in a
context of within the individual comparison (i.e., N-of-1 patient N level
change across two or
more conditions) and between the individual and population based comparator
(e.g., guidelines,
goals, etc.). The treatment system 100 then aggregates response data 22 from
the patient N up in
a building series of N-of-1 replications in order to identify unique patient
groups, with unique
outcome pathways. The identification of unique patient groups is accomplished
via the
application of a combination of inductive, abductive, and deductive logic to
place a given patient
N within a segment. A segment is defined as the use of any number of
techniques intended to
create subgroups based on optimized homogeneity within a segment and optimized
heterogeneity between segments. A segment can be also defined with inclusion
or exclusion
attributes. Once identified, the treatment system 100 is configured to track
that given patient N
relative to their assigned segment, and based on their time-series response
data 22. The
treatment system 100 is further configured to track the progress of the
patient N, relative to each
of the identified segments, thereby determining the individual change of the
patient N, relative to
more positive/negative segment pathways. As such, by combining self-monitoring
of the patient
N through the incorporation of the patient user devices 70, wearable devices
73, sensors 75,
healthcare provider user devices 71, and the like, by implementing the
treatment process 200
(Figure 2), the treatment system 100 allows for real-time individual patient N
monitoring and
evaluation of treatment response, over time, to rigorously evaluate treatment
effectiveness.
100421 In one embodiment, the treatment process is configured to evaluate
patient N
response data 22, e.g., time-series data, gathered at a minimum of two points
in time, at the level
of the individual unit (e.g., N-of-1 evaluation using inductive reasoning for
individual patient N
level time-series response data 22). Such an evaluation will be able to
determine whether there
has been a meaningful change between two or more evaluative conditions (as
will be explained
in more detail below).
100431 In another embodiment, the treatment process may be configured to
aggregate the
CA 03153677 2022-03-07
WO 2020/051327
PCT/US2019/049739
11
individual patient's N N-of-1 evaluations (i.e., replication of conditions and
the outcomes),
based on deductive reasoning for the determination of collective outcomes,
based on
configurable thresholds for sufficient/significant replications to determine
"collective" outcomes
of the N-of-1 replications.
100441 Additionally, the treatment process may be configured to track time-
series
response data 22 recorded in the data store structure 18, collective on an
individual patient N,
relative to a comparator data point/path, over time (e.g., nature or a disease
or treatment, EBM
guideline, personal treatment plan or goal, and the like). The time series-
response data 22
includes a person-level data signature.
100451 Therefore, the treatment process 200 applied by the treatment system
100 is
configured to provide the individual application of established group data, in
combination with
the individual patient N-of-1 evaluations, relative to established group data.
The established
group data may include, but should not be limited to, best practices,
guidelines, clinical trials,
etc. The N-of-1 replications associated with the individual application of
established group data
is aggregated and inductively evaluated in order to identify an outcome
pathway (i.e., segment
pathway development) relative to established deductively reasoned group data.
The treatment
process is further configured to identify and evaluate a combined personalized
care pathway for
a patient N, based on a combination of the group data and individual treatment
response. It
should be appreciated that the system 100 may be configured to record the
outcomes to further
grow and refine the established group data.
100461 As shown in Figure 1, the data server 10 of the treatment system 100
includes a
central processing unit (CPU) 12, which may also be referred to herein as a
processor 12. The
data server 10 can employ any of a number of computer operating systems,
including, but not
limited to, versions and/or varieties of the Microsoft Windows RTM operating
system, the iOS
by Apple Computer, Inc., Android by Google, Inc., the Unix operating system
(e.g., the Solaris
RTM operating system distributed by Sun Microsystems of Menlo Park, Calif.),
the AIX UNIX
operating system distributed by International Business Machines (IBM) of
Armonk, N.Y., and
the Linux operating system or any other CPU operating system. The processor 12
receives
instructions from a memory, such as memory 14, a computer-readable medium,
etc., and
executes these instructions, thereby performing one or more processes,
including one or more of
the processes described herein. The computer-executable instructions may be
compiled or
interpreted from computer programs created using a variety of programming
languages and/or
technologies, including, without limitation, and either alone or in
combination, Java.TM., C,
C++, Visual Basic, Java Script, Perl, html, etc. Such instructions and other
data may be stored
and transmitted using a variety of computer-readable media. By way of non-
limiting example,
CA 03153677 2022-03-07
WO 2020/051327 PCT/US2019/049739
12
the memory 14 of the CM server 10 can include Read Only Memory (ROM), Random
Access
Memory (RAM), electrically-erasable programmable read only memory (EEPROM),
non-
volatile memory, etc., i.e., non-transient/tangible machine memory of a size
and speed sufficient
for storing a data store 18 including a data structure 26, algorithms 20,
response data 22, and one
or more database management applications 24, which can include, for example, a
relational
database management system (RDBMS), a non-relational database management
system, and the
like. The data structure 26 can include one or more databases, data tables,
arrays, links, pointers,
etc. for storing and manipulating the response data 22. The response data 22
can include, by
way of non-limiting example, patient profile data, patient raw data, pre-
processed time series
data, patient micro-treatment confidence score data, micro-treatment
suggestion data, etc. for
one or more patients N, as required to allow the treatment system 100 to
perform the treatment
processes 200 described herein. The memory 14 is of a size and speed
sufficient for
manipulating the data structure 26, for executing algorithms 20 and/or
applications 24, and to
execute instructions as required to perform the treatment processes 200
described herein. The
data server 10 includes a communication interface 16, which in an illustrative
example can be
configured as a modem, browser, or similar means suitable for accessing a
network 76. In one
example, the network 76 provides data communications that may include, but
should not be
limited to, the internet, cellular phone data networks, satellite data
networks, etc.
10047] With continued reference to Figure 2, the data server 10 can include
various
modules, such as a data module 28, an evaluation module 30, an aggregation
module 32, a
display module 34, a suggestions module 36, a micro-treatment module 38, and
the like,
described in further detail herein. The various modules 28, 30, 32, 34, 36, 38
can process, link,
and analyze different types of data, generate static displays, generate
animated displays, generate
reports, generate models, recommend micro-treatments, etc., using algorithms
20 and/or
instructions which may be stored within the different modules 28, 30, 32, 34,
36, 38, in the data
store 18, and/or in one or more of the user devices 70, 71, wearable devices
73, and the like, in
communication with the data server 10.
100481 The algorithms 20 can include, by way of a non-limiting example, one
or more
algorithms 20 for organizing time series data from a patient for optimal
processing or
standardized presentation, one or more algorithms 20 for aggregation of N-of-1
replications, one
or more algorithms 20 for generating one or more types of displays on display
screens
(input/output interfaces 74) of one or more user devices 70, 71 associated
with the time-series
data from the patient N, one or more algorithms 20 for generating one or more
micro-treatment
recommendations, one or more algorithms 20 for prescribing a micro-treatment
to the patient N,
as described in further detail herein. The examples describing the data server
10 provided herein
CA 03153677 2022-03-07
WO 2020/051327 PCT/US2019/049739
13
are illustrative and non-limiting. For example, it would be understood that
the functions of the
data server 10 may be provided by a single server, or may be distributed among
multiple servers,
including third party servers, and that the data within the system 100 may be
distributed among
multiple data stores, including data stores accessible by the data server 10
via the network 76.
For example, it would be understood that the plurality of modules shown in
Figure 1, and the
distribution of functions among the various modules 28, 30, 32, 34, 36, 38
described herein, is
for illustrative purposes, and the module functions as described herein may be
provided by a
single module, distributed among several modules, performed by modules
distributed among
multiple servers, including modules distributed on multiple servers accessible
by the data server
via the network 76, and/or performed by the data server 10.
100491 With continued reference to Figure 1, as already discussed, the
treatment system
100 may include one or more user devices 70, 71 (i.e., one or more patient
user devices 70, one
or more healthcare provider user devices 71, and the like), which can be in
communication with
one or more data servers 10, via the network 76. The user devices 70, 71 each
include a memory
66, a central processing unit (CPU) 68, which can also be referred to herein
as a processor 68, a
communication interface 72, and one or more input/output interfaces 74. The
user devices 70,
71 may be a computing device such as a mobile phone, a personal digital
assistant (PDA), a
handheld or portable device (iPhone , Blackberry , etc.), a wearable device 73
(i.e., a Fitbit ,
Garmin , smartwatch, etc.), a notebook computer, a laptop computer, a personal
computer, a
tablet, a note pad, or other user device configured for mobile communications,
including
communication with the network 76, with other user devices, the data server,
and the like.
100501 It should be appreciated that one or more of these patient user
devices 70 may be
in communication with one or more electronic and/or MEMS sensors, actuators,
and/or other
computing devices configured to capture digital health knowledge data from the
patient N.
These may be wearable devices that are configured to provide digital health
knowledge and/or
are therapeutic. The sensors 75 are used to measure certain parameters of the
human body,
either externally or internally. Examples include, but should not be limited
to, measuring the
heartbeat, body temperature, or recording a prolonged electrocardiogram (ECG).
By way of a
non-limiting example, these sensors 75 may be incorporated into one or more
wearable sensors
75 (e.g., earring, tattoo, smart textiles, wristbands, glasses, ring, etc.),
implantable devices (e.g.,
pacemaker, etc.), smart pills, injectable devices, ingestible devices, etc.
100511 The actuators may be configured to take one or more specific
actions, in
response to data received from the sensors 75, or through interaction with the
patient N,
caregiver, healthcare provider, and the like. By way of a non-limiting
example, the actuator may
be equipped with a built-in reservoir and pump that administers the correct
dose of insulin to the
CA 03153677 2022-03-07
WO 2020/051327 PCT/US2019/049739
14
patient N, based on the glucose level measurements. Interaction with the
patient N may be
regulated by a personal device, e.g. the user device 70, the wearable device
73, and the like.
10052) The user device 70, 71 may be configured to communicate with the
network 76
through the communication interface 72, which may be a modem, mobile browser,
wireless
intern& browser or similar means suitable for accessing the network 76. The
memory 66 of the
user device can include, by way of example, Read Only Memory (ROM), Random
Access
Memory (RAM), electrically-erasable programmable read only memory (EEPROM),
etc., i.e.,
non-transient/tangible machine memory of a size and speed sufficient for
executing one or more
data management applications which may be activated on the user device 70. The
input/output
interfaces 74 of the user device 70 can include, by way of example, one or
more of a keypad, a
display, a touch screen, one or more graphical user interfaces (GUIs), a
camera, an audio
recorder, a bar code reader, an image scanner, an optical character
recognition (OCR) interface,
a biometric interface, an electronic signature interface, etc. input, display,
and/or output, for
example, data as required to perform elements of the treatment process 200.
The example
shown in Figure 2 is non-limiting, such that it would be understood that the
treatment system
100 can include multiple patient user devices 70, multiple healthcare provider
user devices 71,
multiple wearable devices 73, user devices associated with a caregiver, and
the like, each in
communication with the network 76. For example, the treatment system 100 can
include patient
user devices 70 used by one or more patients and one or more healthcare
provider user devices
71 used by one or more healthcare providers D in the treatment of one or more
patients N, as
described in further detail herein.
100531 Referring to the data server 10 shown in FIG. 1, in one example, the
data module
28 can be configured to receive, record, and organize data submitted to the
treatment system 100
by the patient and/or a caregiver of the patient associated with the act of
self-monitoring, via one
or more user devices 70. The data module 28 can include algorithms 20 for
parsing, formatting,
and recording data associated with the patient.
10054] Response data 22 recorded from the act of self-monitoring can be
made more
accurate if data error associated with behavioral architecture of the wearable
device 73 is dealt
with. In one embodiment, the patient N response data 22 is automatically
collected in real-time.
Potential error is introduced into the data when the patient's recall is
required, and this error may
be eliminated or significantly reduced by virtue of automatic data collection
(or by virtue of
required minimal engagement), in real-time (i.e., in the moment, or near real
time) data
collection. By automating data collection, to the degree that the patient N
need not engage in a
specific behavior to actually initiate recordation of the data, the data
fidelity is enhanced (e.g.,
steps, circadian rhythm, heart rate, amount of ultraviolet light (UV) light
exposure, medication
CA 03153677 2022-03-07
WO 2020/051327 PCT/US2019/049739
taking, etc.). The automatic data collection should also include the time the
data was collected
to provide time series data. If the patient N does need to take action (e.g.,
enter a number, press
a button, take a medication, etc.) to initiate the recordation of response
data 22, the recording
should occur contiguously with the act, in real-time (and have the time
recorded or time
stamped) to provide time series data. In some instances, the time recordation
is the time and
date, in other instances, the time recordation may be more general, such as a
date, a month, and
the like. In other instances, the data recordation may also include a
geographic location,
temperature, weather conditions, and the like.
100551 Since the act of simply presenting the collected data from the
wearable device 73
to the patient, no matter how clearly and creatively presented, is typically
insufficient for
enacting a sustaining change, a display on the wearable device 73 and/or user
device 70 may be
configured to display a direction to the patient N regarding insights about
triggers of behaviors
so as to assist the patient N with distinguishing between internal and
external triggers. The
triggers may include, thoughts, feelings, actions, and the like, including
somatic behaviors (e.g.,
pain, palpitations, stomach pain, diarrhea, etc.). These triggers are temporal
connections (i.e.,
correlations, prediction models, etc.) between antecedent and behavior.
100561 Changing of relevant metrics for a patient N may be built around
frequency,
intensity, duration, and course (trend), as relevant to a target behavior(s).
Further, internal
triggers and external triggers may be distinguished. The data associated with
contiguous
relationships (i.e., high cause/effect probability) among variables may be
arranged and presented
to the patient N in meaningful ways. To do so, an understanding is made
regarding patient's
level of motivation (e.g., 2 to 6 levels) and confidence (e.g., high or low).
All of the latest data
status and trend implications for the patient may be assessed. Further, the
display on the display
device 70 and/or the wearable device 73 may encourage the patient to select
self-determined
experiments from a library of treatment options that are most suitable for a
main health goal
and/or a main quality of life goal (e.g., the ability to optimize up to five
total variables outcomes
in a future segment).
100571 In one embodiment, an expert system may be provided to balance
(i.e., score) the
treatment options available in the library, suggestions module 36, to provide
a library of the best
or preferred treatment options. The library of treatment options may be used
based on a
relationship to the patient, e.g., level of motivation, level of confidence,
set-limit of presented
options (e.g., 1 to 5), best self-experiment segment micro-treatment
recommendation design
(AB, ABAAB, ABCA, multiple baseline, others with time duration of each
segment), and the
like which when aggregated would get smarter via volume of N-of-1
replications. The library of
treatment options may include best or preferred group average science
treatments, N-of-1
CA 03153677 2022-03-07
WO 2020/051327 PCT/US2019/049739
16
science input from the patient, N-of-1 science input from friends or others
within the population,
ideas/theories, reference data, and the like.
10058) The best or preferred group average science treatments are cited
science studies
that may include, but should not be limited to, pharmaceuticals with FDA
approval and non-
pharmaceutical. The best or preferred group average science treatments may be
based off of
established group data (e.g., best practices, guidelines, clinical trials,
etc.). The N-of-1 science
from the patient or the friends/crowds or others within the population may be
categorized as
weak to none (e.g., under 49%), some (e.g., 50%-69%), moderate (e.g., 70%-
89%), or strong
(90%400%) or the like. The ideas/theories may initially have an unknown value,
or may have a
possible value with some supporting theory. The reference data may include
links to science
articles and the like to provide support and general how-to information.
100591 Functional components of a behavioral analytical architecture, may
include, but
should not be limited to, triggers, actions, instrumental behavior, biological
behavior, cognitive
behavior consequences, psycho-social behavior, exercise behavior, diet
behavior, and the like.
The triggers (i.e., antecedents, stimuli, etc.) are any perceptible cue
occurring temporally prior to
a target (i.e., behavioral, biological, cognitive/emotional) and often
"triggers" the target.
Triggers can be external to the observed (in the environment) or internal to
the observed
(subjective states). Actions (i.e., overt acts, cognitive, emotional or
biological actions) are a
change in the status of the observed in the target in response to contextual
factors (internal and
external to the observed). Instrument behavior is any overt act made by the
observed (e.g.,
smoke a cigarette, run, take a medication, etc.).
100601 Item response theory (IRT) (i.e., latent trait theory, strong true
score theory,
modern mental test theory, and the like) is a model for the design, analysis,
and scoring
of tests, questionnaires, surveys etc., based on the relationship between and
individuals' response
to a given test item and their score or performance on an overall measure. IRT
does necessarily
treat each item with equal weight, but rather uses the weight of each item
(i.e., the item
characteristic curves, or ICCs) as information to be incorporated in scaling
items. IRT can be
used to measure human behavior in online social networks whereby the views
expressed by
different people can be aggregated and studied.
100611 Biological behavior is any physiological or psychophysiological
change in
response to the status of the biological functioning of the observed (e.g.
heart rate, BMI, Al C,
sleep architecture, etc.). Cognitive behavior is the processes of knowing,
including attending,
remembering, reasoning or others; also the content of the processes, such as
but not limited to
concepts and memories. This includes but is not limited to interpretations of
cause and effect
relationships, motivations, self-perceptions, and moral reasoning.
Consequences may include
CA 03153677 2022-03-07
WO 2020/051327 PCT/US2019/049739
17
changes in the internal and/or external environment of the observed that
meaningfully follows an
act.
10062) The treatment system 100 is configured to provide a display 40 and
interpretation
relating to a patient's progress, periodically assesses goals and motivations
to recommend goal
changes (up or down), compare an opted-in group's progress, compare known
population-based
progress, compare a patient's data to a friend's progress who has "opted-in"
and/or others,
compare crowd progress, and the like. This type of display and interpretation
may make is easy
to spot or see trends; make it easy to keep on a treatment journey if good
value is being realized
by the patient, make it easy to switch to a different journey if poor value is
being realized by the
patient or no value is determined.
100631 The treatment system 100 may provide many features, including, but
not limited
to, initial onboarding, an express lane startup, a major infrequent stressor
event recording, multi-
channel support structure, and the like. The initial onboarding is configured
to allow easy and
progressive surveying that is flexible to gather up front, first time data.
Each use case will be
prioritized differently, and few people will have to complete everything in
the survey initially.
The express lane startup is configured to provide the ability to pull
information from a patient's
electronic health records (EHR) and/or to exercise device data. The emergency
off ramp
provides a special triage for a patient's emergency risks, e.g., no pulse,
falls, left a geo-fence
area, fire at location, etc. The major infrequent stressor event recording is
configured to provide
a simple and easy way to log births, deaths, job end, job start, theft,
accidents, etc. Further, the
multi-channel support structure is configured to provide support outside of an
application
integrated communication, uses an integrated communication application to
support streams of
automated conversations with text, video, audio, tele-specialists, email (with
web links), and the
like. Uses "double helix" (friend/family/community) connections to help
support the user.
100641 An application program interface (API) may be provided to "strategic
partners",
such as support specialists in disease, disorder, and health science with
better experience,
behavior science, social support, care team communications, and artificial
intelligence (AI)
expert decision support, N-of-1 individual science analytics, and small and
large group analytics.
Providing the API to these strategic partners, allows for the leverage of
specialist user interaction
with specialized knowledge, special outlier cases, exceptions, and
gamification knowledge.
100651 Wearable device 73 and sensor API integration may also be configured
to be
friendly to top devices and sensors 75, while providing flexibility to add new
devices and
sensors 75, over time. The FDA and various medical standards of recording an
identification
(ID) of the wearable device 73, along with its calibration steps and history,
may be linked to a
period of patient data. There is a level of accuracy associated with the
ability of the wearable
CA 03153677 2022-03-07
WO 2020/051327 PCT/US2019/049739
18
device 73 to learn and distinguish between and noise. As such, the wearable
device 73 may be
configured to only record and/or transmit a patient data feed associated with
signals, while
ignoring noise.
100661 The system 100 is configured to receive, process, and record data
feeds from the
patient. A patient data feed may be an ongoing stream of structured and
unstructured data that
provides updates of current information (i.e., time series) from one or more
sources. "Big" data
(i.e. data that is complicated to store, organize, evaluate, and present in a
context that requires
the consumption of large volumes of data (data that exceeds natural human
capacity), analysis of
that data using complicated mathematical processes with significant speed such
that findings can
be meaningfully displayed back to an end user device for timely decision
making.
100671 Several non-limiting examples of big data feeds provided by the
treatment system
100 may include, but should not be limited to, geolocation and weather by the
hour with the
ability to roll up into summaries by day linked to users and their location;
drug data linked to
side effects and risks (allows the spotting of N-of-1 early issues earlier);
other known science
databases, such as, known EMI maps, earthquake maps, pollution maps, etc.;
digital map API
(e.g., Google, NavTec, and the like) to assist with finding healthy activities
or food (e.g.,
FitCare); healthcare portal partners work with patient and/or mainstream
employee health portals
(e.g., major EHR like EPIC) to share data and ultimately increase the value of
the portals.
10068] The treatment system 100 provides the treatment process 200 shown in
Figure 2.
The treatment system 100 combines inductive, abductive, and deductive logical
inference, and
related analytical methods to evaluate and analyze a plurality of time series
data and/or repeated
measures data (i.e., continuously collected and evaluated over a specified
time period) at the
individual unit N (e.g., single patient, single complex system, or N-of-1),
based on the
assignment of a discrete micro-treatment at each segment. A micro-treatment
42, corresponding
to a Phase 52, may be defined as a blend of a specific dosed medication or non-
drug treatment or
any behavior, life style, environment or system change or combination (or any
other prescribed,
defined, known, or unknown variable) for a certain period of time (relative to
a baseline or other
comparative state). The system 100 evaluates a plurality of N-of-1 "segmented"
evaluation
methods that compare change in the patient data between two (or more)
distinctly characterized
segments, i.e., discrete micro-treatments administered during fixed time
periods, with at least
two measures per segment. A segment has one or more dependent variables and
one or more
independent variables, measured across time.
100691 There are many N-of-1 analysis tools and methods. It should be
appreciated that
any one of these N-of-1 analysis tools, in combination with a design of an
individual system for
experimenting with changes between segments, by varying one or more
independent variables in
CA 03153677 2022-03-07
WO 2020/051327
PCT/US2019/049739
19
order to measure the effect on one or more dependent variables. The sensors
75, wearable
devices 73, data server 10, user devices 70, 71 are configured to gather
response data 22 and
calculate a level of change as measured against normal or well-researched
ranges (GAS) and to
calculate a level of association that the independent variable cause (or did
not cause) a change to
the dependent variable. The level of change and level of association can be
shared via wired or
wireless electronic communication and with or without a computer server to
support additional
analytics and to provide summary visualization to one or more users, including
the patient N, the
doctor D, the caregivers, and the like. In one non-limiting example, with
reference to Figure 2,
the independent variable may be the elements of the micro-treatment prescribed
(assigned) to the
patient N. The elements (independent variables) of the micro-treatment may
include a
regimented amount of exercise, a specific diet, and a specific medication.
With continuing
reference to Figure 3, the dependent variables may be measured in terms of
depression and a
quality of life. For each of these, an IAQ score 22D is assigned and may
displayed on the
display screen in terms of the overall treatment segment, and at each time
unit (e.g., daily).
100701 With
reference between Figure 1 and Figure 2, the system 100 is configured to
calculate and generate a metric, such as a measure of change in the patient
data and/or a
confidence score (i.e., "IndividuALLytics Quotient" (IAQ) score) from one
segment to another
segment, in terms of valance (i.e. positive/negative impact), direction
(up/down), and effect size
and/or calculated standardized measures and/or a relative level of micro-
treatment compliance
46 during each segment and/or confidence intervals for balancing Type I and
Type II errors. In
statistical hypothesis testing, a Type I error is known as a "false positive"
finding, while a Type
II error is known as a "false negative" finding. A Type I error is to falsely
infer the existence of
some relationship that is not there, while a Type II error is to falsely infer
the absence of some
relationship that is there. The IAQ score provides a user of the treatment
system 100 with a
score that represents the statistical confidence associated of the effect of a
micro-treatment on a
patient N for a particular segmented time-period (e.g., one-month) and/or at a
particular interval
(e.g., one day). With specific reference to Figure 3, the IAQ score may be
graphically
represented in terms of "++", "+", "0", "-", and "- -", where an IAQ score of
"++" may indicate
a confidence level of greater than e.g., 80% (the specific confidence
percentage would be
configurable based on the end user's preferred balance of Type I and Type II
error) that the
micro-treatment was effective, an IAQ score of "- -" may indicate a confidence
level of greater
than or equal to 80% that the micro-treatment was ineffective and provided a
negative impact on
the patient N, an IAQ score of "0" may indicate a confidence level of under
50% that the micro-
treatment provided no impact on the patient N. Likewise, an IAQ score of "+"
and "-" may
indicate a predefined confidence level of between 50% and the 79.9% that the
micro-treatment
CA 03153677 2022-03-07
WO 2020/051327 PCT/US2019/049739
likely had some impact on the patient N either positively or negatively. It
should be appreciated,
however, that the disclosure is not limited to having these confidence levels,
only five levels of
IAQ scores, and/or having IAQ scores represented in the form of "+", "-", and
"0", as any other
suitable indicator of a confidence score may be graphically represented on the
display of the user
device 70, 71. Such a graphical representation allows a healthcare provider
(such as a doctor D),
the patient N, the caregiver(s), and the like, to quickly determine the
effectiveness/ineffectiveness of a particular micro-treatment and/or the level
of decision
confidence.
100711 With reference to Figures 5-45, the system 100 may also present
evaluated time
series data 82 in an animated fashion on a graphical user interface (GUI), at
each of the level of
the individual unit N (single patient), the defined groups of the individual
units N, and the
overall population. The determination of defined groups of the individual
units, when combined
with the graphical representation of such associations, based on IAQ scores,
provides a graphical
representation of treatment effects that allows a user to quickly and easily
make a visual
determination of the effectiveness/ineffectiveness of a particular treatment.
A healthcare
provider or patient can use menus 60 to further evaluate level of confidence
and
effectiveness/ineffectiveness of micro-treatments for one patient, several
patients, many patients
or all patients. The menus can include but not limited to select persons,
display segments,
display micro-treatments, display IAQs, select other views, and drill down to
FIG. 3. An
example treatment process 200 will now be described with reference to Figure
2.
100721 The treatment process 200 according to an example embodiment
commences at
step 202, wherein a patient profile 22A (Figure 4) regarding a patient N is
created and recorded
in the database 18 to become part of the response data 22. The patient profile
22A may include,
but should not be limited to, a patient's name, age, current diagnosis,
current prescribed
medications, past surgeries, mental health status, hospitalizations, genetic
profile, allergies,
health goals, life goals, family care givers, family medical history, medical
record identifier,
anonymous record identifier, and the like. The process 200 then proceeds to
step 204.
100731 At step 204, the server 10 receives raw response data 22B (Figure 4)
from the
patient N. The raw response data 22B may be received from one or more patient
user devices
70, wearable devices 73, sensors 75, healthcare provider user devices 71, and
the like, via the
network 76. The raw response data 22B corresponds to the effects on the
patient N over a time-
period (i.e., treatment segment) for a discrete micro-treatment. The raw
response data 22B may
be recorded in the database 18 at step 206. The process 200 then proceeds to
step 208.
10074] At step 208, one or more algorithms 20 may be initiated by the
processor 12 to
pre-process the raw response data 22B to provide a time-series data set 22C
(Figure 4). In pre-
CA 03153677 2022-03-07
WO 2020/051327 PCT/US2019/049739
21
processing the raw response data 22B in order to provide the time-series data
set 22C, the
algorithm 20 may be configured to standardize or normalize the raw response
data 22B and/or
identify and correct for any missing data within the raw response data 22B. In
doing so, the
algorithm 20 may use any of a variety of known techniques, based on optimal
methods for
managing data gaps, such as auto-correlation, mean substitution, max value,
and the like. The
time-series data set 22C may be recorded in the database 18 at step 210. The
process 200 then
proceeds to step 212.
100751 The process 200 entails the optional step 212 of incrementing a
counter C. The
process 200 then proceeds to step 214.
100761 Optional step 214 entails determining whether a predefined number of
treatment
segments (C=CAL) have been pre-processed and recorded as a time-series data
set 22C in the
database 18. For instance, the processor 12 may increment a counter (C)
following the
completion the recordation of the time-series data set 22C in the database 18
at step 210. It
should be appreciated, however, that the process 200 may be configured to
increment the
counter (C) following any of the data steps 204, 206, 208, 210, without
departing from the scope
of the disclosure. If the value of C exceeds a predefined integer count, the
process 200 proceeds
to step 216. In one embodiment, the predefined integer count may be 2. In
other embodiments,
the predefined integer count may be a larger integer, in order to achieve a
desired amount of
statistical confidence when analyzing the data set 22C in the steps outlined
below. If, however,
the predefined integer is not achieved at step 214, process 200 repeats at
step 204.
100771 At step 216, the processor 12 receives instructions for applying an
N-of-1
evaluation on the response data 22. The algorithm 20 may be configured to
determine the
particular N-of-1 technique to apply to the response data 22, based on a
family of N-of-1
evaluation techniques that may be recorded in the memory 14. The N-of-1
techniques may be
selected based on an optimal method, such as but not limited to PND, PEM,
Kendall Tau, and
the like, to evaluate segment change on one or more variables at the level of
the individual unit
patient N. The process 200 proceeds to step 218.
100781 At step 218, the N-of-1 evaluation technique is applied to the
response data 22,
e.g., the pre-processed time-series response data 22C to determine one or more
confidence
scores 22D (e.g., IAQ score) associated with the time-series response data
22C. In determining
the IAQ scores 22D, the evaluation technique may also take into account one or
more items of
information stored in the patient profile 22A. The IAQ score 22D is recorded
in the database 18
at step 220. The process 200 is configured to repeat at step 204 to receive
additional raw
response data 22B associated with a new treatment segment. The process 200 may
be
configured to transmit the IAQ score 22D to any user device 70, 71, wearable
device 73, and the
CA 03153677 2022-03-07
WO 2020/051327 PCT/US2019/049739
22
like, on-demand. At the completion of step 218, the process 200 also proceeds
to step 222.
100791 At step 222, the algorithm 20 may be configured to analyze the
response data 22,
including the time-series response data 22C, the patient profile response data
22A, the IAQ
scores 22D, and the like, in order to identify and assign the individual unit
to a segment
pertaining to the patient's N treatment response to one or more micro-
treatments. The
information pertaining to the assigned segments of the individual units may be
recorded in the
database 18 at step 224. The process 200 may next proceed to step 226.
100801 At step 226, the algorithm 20 may be configured such that a signal S
is
selectively transmitted to one of the user devices 70, 71 and/or the wearable
device 75, via the
network 76, in order to generate a graphical user interface (GUI) on a visual
display that
represents the change of the individual unit and segment, over time. In one
non-limiting
example, with reference to the Figures, the display may represent the segments
along two or
more variables, over time, on a GUI or a display screen, and superimpose a
visualization of the
individual unit's time series data on the time series paths of the segments.
As represented in
Figures 5-40, the visual displays may be configured to essentially create
motion pictures
representing changes (sequence) of the data, over time. The virtual displays
may be generated
based on crowd sourcing of the aggregated and replicated N-of-1 experiments
(discrete micro-
treatments) the application of rules for degree of replication of findings
within a particularly
similar set of test context that would place the individual unit into the most
probably segment.
[0081] At step 226, the algorithm 20 may be configured to generate the
visual display
based on specific data display parameters, received by the processor 12, 68
via a GUI wizard at
input 300, to be represented on the visual display. The system 100 provides
the GUI wizard to
collect, from the user, the requested display and/or animation display
parameters in order to
determine which data needs to be retrieved from the database and processed to
display the
requested animation display, with the requested parameters. The unique
animation of time series
data may include, but should not be limited to, the time-series display of
treatment responses for
a patient, the time-series display of the IAQ scores 22D, the time-series
display of information
regarding highly replicated findings as treatment suggestions, an animation
display of the time-
series progression of the data, and the like. A "wizard" is one or more
interactive display
screens that present selectable or configurable options to collect information
from the user (i.e.,
patient, caregiver, doctor, and the like) and then use that information to
perform some task.
Information may be may be collected by the GUI wizard. The information
collected may
include, but should not be limited a selection of a range of segments to
display, a selection of
micro-treatment segments to display, a selection level of IAQ to display, a
selection of advice on
a best next micro-treatment, a selection of data animation attribute
groupings, a selection of data
CA 03153677 2022-03-07
WO 2020/051327
PCT/US2019/049739
23
animation summaries (i.e., ranges of the subgroups/groups over time), a
selection of patient
profile attributes, and the like. The method next proceeds to step 228.
10082) At step 228, the algorithm 20 may apply an analysis to determine
whether one or
more recommended micro-treatments may be available within the data store 18
that would be
suitable for trial by the patient N. The determination may be based on what N-
of-1 experiments
exist within the database 18, by way of recommendations (i.e., machine
learning, artificial
intelligence, or other algorithms, and the like). An increase in the number of
replications
aggregate the power of this step in the analysis. Any recommended micro-
treatments 22E may
be recorded in the database 18 at step 230 for selective retrieval.
100831 Therefore, the treatment system 100 may be configured to provide
data
processing and evaluation steps that include, but should not be limited to,
data acquisition and
organization; N-of-1 evaluation system building blocks; N-of-1 aggregation
visualization; N-of-
1 aggregation segmentation operationalization; and tracking and crowdsourcing
N-of-1
aggregation (visualization and animation).
100841 With respect to the data acquisition and organization, the system
100 is
configured to accept and utilize all forms of time ordered data (i.e., time
series, repeated
measures, etc.), independent of the data collection methodology and
technology. In one non-
limiting example, the system may be configured to accept time series data with
varying time
collection intervals using either parametric or non-parametric data and will
order said data in a
pre-defined manner (e.g., standardize, normalize, correct for missing data,
local time
synchronization, universal time synchronization, etc.).
100851 The N-of-1 evaluation is a system building block. When performing
the N-of-1
evaluation, a family of evaluative methods for N-of-1 analysis are applied to
the patient N data,
based on optimized decision rules for such an application to evaluate segment
changes (change
on one or more independent variables within the individual unit patient N)
under two or more
segment conditions. More specifically, a method for performing the N-of-1
analysis is selected
to evaluate the effectiveness/ineffectiveness of the discrete micro-
treatments, based on the
measures (data) recorded at spaced time intervals during the fixed time period
of the segment.
In one non-limiting example, the fixed time periods are one-month intervals,
and the measures
per segment are daily. It should be appreciated that intervals having longer
or shorter lengths of
time and more or less measures per segment may also be used without departing
from the scope.
The N-of-1 evaluation provides the IAQ score.
100861 N-of-1 aggregation provides a visualization and evaluation of the
IAQ score
relative to a change in a time series data trend 50 (FIG. 3B for example) of
the N-of-1 level data
and results, which may be aggregated for two or more individual units patient
N. Further, the
CA 03153677 2022-03-07
WO 2020/051327 PCT/US2019/049739
24
patient data and/or IAQ scores may evaluated in terms of the degree of co-
relationships (e.g.
trends) for two or more variables that may also be based on an aggregation of
N-of-1 findings.
10087) The N-of-1 aggregation segmentation operationalization is based on
optimized
decision rules. As such, the system 100 is configured to evaluate and
aggregate the results of the
N-of-1 evaluation (based on aggregated N-of-1 results) into groups (i.e.,
"segments") based at
least in part, on unique data attributes of the individual unit patient N
(static and/or cross-
sectional data), the unique trend over time, and the unique responses to the
same or similar
segment changes. Further, decision rules may be provided for the aggregation
segmentation
operationalization of the data and/or IAQ score to optimize the homogeneity
within the group
and/or heterogeneity between the groups.
[0088] The tracking and crowdsourcing or friendsourcing N-of-1 aggregation
(i.e.,
visualization and animation) uses the time series data, renders an animated
visualization of the
time-series data over time (data in motion) on the display of the GUI.
Friendsourcing is similar
to crowdsourcing, but use is generally limited to a set of "friends", or a
grouping of selected
other patients N. This visualization can be rendered at the entire sample
(population) level,
segment (group) level, or individual level separately or collectively.
Providing such a
visualization and underlying evaluation on a display as a GUI will test one or
more variables at
the level of the individual unit patient N and relative to a defined
comparator (e.g., goal,
guideline, ideal, population norms, normal limits, etc.) and evaluation of an
individual unit
patient N trend (and/or outcome), relative to the comparator. As such, a
statistical and visual
comparison between the individual unit patient N trend over time and the
comparator change
over time both within and between segments may be realized.
100891 The tracking and crowdsourcing N-of-1 aggregation (i.e.,
segmentation
experimentation) is based on optimized decision rule. As such, the system
promotes (i.e.,
recommends, offers, reinforces) segment changes based on aggregating (dynamic
data) to
individual units N to further test and validate patterns in segment change.
[0090] Crowdsourcing and/or friendsourcing sharing of N-of-1 micro-
treatments and
IAQ's across the patient N and healthcare provider D community is enabled by
the
communication interface 72 and the suggestions module 36 to provide
opportunity to visualize
and identify potentially new micro-treatments that might have high positive
outcomes with good
statistical confidence from other patient N. The communication interface 72
provides the
healthcare providers D and the patients N with the opportunity to add
particular micro-treatment
to the suggestions module 36, in the event the outcome of a particular micro-
treatment was
positive. To add the particular micro-treatment to the suggestions module 36,
the healthcare
provider D and/or the patient P may make a selection on a menu generated by
the GUI wizard on
CA 03153677 2022-03-07
WO 2020/051327 PCT/US2019/049739
the display screen. Alternatively, the system 100 may be configured such that
micro-treatments
are automatically added to the suggestions module 36 if the micro-treatment
results in a certain
confidence score. Conversely, the communication interface 72 and suggestions
module 36 may
also provide the opportunity to identify micro-treatments where the outcome
was not positive.
100911 Referring again to Figure 2, the treatment process 200 executed
through the
treatment system 100 is configured to evaluate a plurality of time series data
and/or repeated
measures data (i.e., data that is continuously collected and evaluated over a
specified time
period), at the individual unit N (i.e., single patient or N-of-1) level of
analysis. The treatment
process 200 is then configured to detect a change in an individual unit N
(i.e., the single patient
or N-of-1) under two or more distinct conditions (i.e., a treatment and/or an
intervention
response by the single patient). The system 100 is configured to apply and
evaluate a plurality
of N-of-1 "segmented" evaluation method, including, but not limited to, PEM,
PND, Kendal
Tau; comparing change between two (or more) distinctly characterized segments
(e.g., treatment
conditions) with at least 2 measures per segment; and animate and visualize
the time series
"segment change" data over time (e.g., clinical response), via a display on
the GUI. It should be
appreciated that there may be any number of segments, and the distinctly
characterized segments
are not limited to being sequentially ordered. As such, the distinctly
characterized segments
may be spaced, with other distinctly characterized segments in between that
are not being
evaluated.
10092] The treatment process 200 is also configured to aggregate collective
time series
"segment change" data, over time, and use a plurality of segmentation
identification and
evaluation methods to identify unique groupings of individual units N based on
decision rules
designed to optimize the homogeneity within the group and heterogeneity
between the groups
both in terms of static (unchanging) attributes and their N-of-1 evaluated
change of time. The
segmentation identification and evaluation methods may include, but should not
be limited to,
LGMM, Cluster Analysis, etc.
10093] The treatment process 200 may be configured to evaluate an
individual unit
patient N relative to the attributes that make up a given segment and place
using a plurality of
evaluative methods (e.g. nearest neighbor, etc.) to define a membership of the
individual unit
patient N relative to the defined segments. A time series course of both an
individual and their
relationship to the unique segments, over time, may be superimposed within
animated data
displayed on the display.
100941 In another aspect of the disclosure, the treatment process may be
configured to
evaluate a plurality of cross-sectional data and time-series/repeated measures
data (i.e., data
continuously collected and evaluated over a specified time period) at the
individual unit patient
CA 03153677 2022-03-07
WO 2020/051327 PCT/US2019/049739
26
N (single patient) and aggregated (segment) grouping of patient N's level that
identifies and
evaluates the individual units patient N unique attribute, relative the unique
attributes of defined
segments (including an overall course). The treatment process 200 is
configured to inform the
patient (individual unit N) of those self-attributes and the strength of those
attributes that
contribute to the patient's placement within a specifically defined segment
and the contribution
of those attributes to a predicted time-series course, based on the segments
established course.
The N-of-1 change is evaluated within the individual unit N in those
attributes contributing to
the placement in a particular segment, relative to segment membership, and
changed predicted
time-series course.
100951 A collective N-of-1 change within a given sample/population is
evaluated, based
on a defined set of rules, and based on feedback via data, tables, and
visualization information
regarding highly replicated findings as treatment suggestions for those
individual units (patient
Ns) from within the larger database that have not yet been exposed to the
favorably identified
treatment condition(s).
100961 In another aspect of the disclosure, a treatment process 200 is
provided for
evaluating a plurality of cross-sectional and time-series/repeated measures
data (i.e., data that is
continuously collected and evaluated over a specified time period) at the
individual unit patient
N and within small (practice level) patient N groups undergoing similar or
competitive treatment
options. The treatment process 200 is configured to provide practitioners with
standard, but
customizable, N-of-1 segment and micro-treatment designs (e.g., ABAB, multiple
baseline, etc.)
for optimized application of N-of-1 segments, data collection, and evaluation
based on, and
specific to, a given clinical context for conducting alternative treatment
evaluation within a
small set of individual units patient Ns. The treatment process 200 may also
be configured to
provide practice level (or clinician level) evaluation and visualization of
treatment responses in
each individual unit N (single patient), including the display on a display
screen of unique
animation of time series data for optimized care.
10097] In some implementations, the computer executable code may include
multiple
portions or modules, with each portion designed to perform a specific function
described in
connection with FIGS. 1-4 above. In some implementations, the techniques may
be
implemented using hardware such as a microprocessor, a microcontroller, an
embedded
microcontroller with internal memory, application specific integrated-circuit
(ASIC), internet of
things (IoT) device, or an erasable programmable read only memory (EPROM)
encoding
computer executable instructions for performing the techniques described in
connection with
FIGS. 1-4. In other implementations, the techniques may be implemented using a
combination
of software and hardware.
CA 03153677 2022-03-07
WO 2020/051327 PCT/US2019/049739
27
[0098] It should be appreciated that the treatment system 100 and treatment
process 200
is not limited to the examples as described herein. Other applications of the
system 100 and
process 200 are also contemplated, including, but not limited to, use with
artificial intelligence
(Al) engines to personalize or recommend actions; use with applications to
share historical
treatment (independent variable) insights on health and life outcomes
(dependent variables); use
IAQ scores 22D as digital phenotypes to connect with physical phenotypes
(e.g., blue eyes, red
hair, etc.) and genotype and disease/health history for new level of improved
health and life
management; use with quadrant or matrices for other multi-dimensional mapping
to be displayed
on the display screen to see endpoint or data movie (i.e., animation)
patterns, and the like; use
with multi-variable analysis to see combinations of co-independent variable
and/or co-dependent
variable relationships; use to add lag and/or lead time analytics; use
additional N-of-1
mathematics of known science to offer and graphically display predictive, next-
segment or other
future segment insights, based on receiving, by the processor 12, 68 via the
GUI wizard, data
display parameters; use the response data 22, including the IAQ scores 22D and
the data movies
in conjunction with a digital or personal health/life coach to support
behavior change
management of the patient N; use with reminders to improve the patient's N
treatment
(independent variable) plan compliance, and the like.
100991 Time-series data comes in for key health and life
attributes/variables. The time-
series data may be collected via sensors or digital health diaries on user
devices 70, 71 and/or
devices 74. As explained above, this time-series response data 22 for the
patient N is stored in
the database 18 and converted to a time ordered structure (standardize
frequency), with a
relationship to the segmented interventions (micro-treatments). Then, by way
of a non-limiting
example, with reference to FIGS. 3A and 3C, two or more of the patient N
attributes/variables
are plotted against other, as a GUI on the display screen 74, based on the
time ordered
relationship and unique colors/shading/coding to show transitions of the
segmented interventions
(micro-treatments). This plotting may be combined with multiple other patients
N to see a
trajectory of the group and/or sub-groups versus the individual patient N. The
data can be
displayed as a movie or a snapshot in time (of the data movie), as illustrated
in FIGS. 5-40. To
improve viewability, the IAQ values 22D may be shown in any color, shade,
symbol, code, and
the like.
1001001 While the best modes for carrying out the disclosure have been
described in
detail, those familiar with the art to which this disclosure relates will
recognize various
alternative designs and embodiments that fall within the scope of the appended
claims.