Note: Descriptions are shown in the official language in which they were submitted.
WO 2021/237225
PCT/US2021/033947
1
SYSTEMS, DEVICES, AND METHODS FOR ANALYTE MONITORING AND
BENEFITS THEREOF
CROSS-REFERENCE TO RELATED APPLICATIONS
This application claims priority to and the benefit of U.S. Provisional Patent
Application No. 63/029,339, filed May 22, 2020, and U.S. Provisional Patent
Application No. 63/104,282, filed October 22, 2020, which are incorporated by
reference
herein in their entirety for all purposes.
FIELD
The subject matter described herein relates generally to systems, devices, and
methods for in vivo analyte monitoring and benefits thereof
BACKGROUND
The detection and/or monitoring of analyte levels, such as glucose, ketones,
lactate, oxygen, hemoglobin AlC, albumin, alcohol, alkaline phosphatase,
alanine
transaminase, aspartate aminotransferase, bilirubin, blood urea nitrogen,
calcium, carbon
dioxide, chloride, creatinine, hematocrit, lactate, magnesium, oxygen, pH,
phosphonts,
potassium, sodium, total protein, uric acid, etc., or the like, can be
important to the health
of an individual having diabetes. Patients suffering from diabetes mellitus
can experience
complications including loss of consciousness, cardiovascular disease,
retinopathy,
neuropathy, and nephropathy. Diabetics are generally required to monitor their
glucose
levels to ensure that they are being maintained within a clinically safe
range, and may
also use this information to determine if and/or when insulin is needed to
reduce glucose
levels in their bodies, or when additional glucose is needed to raise the
level of glucose
in their bodies.
Growing clinical data demonstrates a strong correlation between the frequency
of
glucose monitoring and glycemic control and a strong correlation between use
glucose
monitoring regimen and reduced hospitalizations. Despite such correlation,
however,
many individuals diagnosed with a diabetic condition do not monitor their
glucose levels
as frequently as they should due to a combination of factors including
convenience,
testing discretion, pain associated with glucose testing, and cost.
To increase patient adherence to a plan of frequent glucose monitoring, in
vivo
analyte monitoring systems can be utilized, in which a sensor control device
may be
worn on the body of an individual who requires analyte monitoring. To increase
comfort
and convenience for the individual, the sensor control device may have a small
form-
CA 03179837 2022- 11- 22
WO 2021/237225 PCT/US2021/033947
2
factor and can be applied by the individual with a sensor applicator. The
application
process includes inserting at least a portion of a sensor that senses a user's
analyte level
in a bodily fluid located in a layer of the human body, using an applicator or
insertion
mechanism, such that the sensor comes into contact with a bodily fluid. The
sensor
control device may also be configured to transmit analyte data to another
device, from
which the individual, her health care provider ("HCP"), or a caregiver can
review the
data and make therapy decisions.
Despite their advantages, however, some people are reluctant to use analyte
monitoring systems for various reasons, including the complexity and volume of
data
presented, a learning curve associated with the software and user interfaces
for analyte
monitoring systems, and an overall paucity of actionable information
presented.
Thus, needs exist for analyte monitoring systems, as well as methods and
devices
relating thereto, for improving clinical outcomes.
SUMMARY
The purpose and advantages of the disclosed subject matter will be set forth
in
and apparent from the description that follows, as well as will be learned by
practice of
the disclosed subject matter. Additional advantages of the disclosed subject
matter will
be realized and attained by the methods and systems particularly pointed out
in the
written description and claims hereof, as well as from the appended drawings.
To achieve these and other advantages and in accordance with the purpose of
the
disclosed subject matter, as embodied and broadly described, the disclosed
subject matter
is directed to systems, devices, and methods of analyte monitoring and
benefits thereof.
According to an embodiment, a method of treatment of type 2 diabetic patient
can
include selecting a type 2 diabetic patient having a predetermined comorbidity
for
treatment, initiating a continuous glucose monitor regimen for the selected
type 2
diabetic patient, wherein after six months of initiation of the continuous
glucose monitor
regimen, a rate of hospitalization for a predetermined diagnostic category of
the selected
patient having the predetermined comorbidity can be reduced by at least 12%
relative to
an average rate of hospitalization for the predetermined diagnostic category
of selected
patients having the predetermined comorbidity without the continuous glucose
monitor
regimen.
According to embodiments, the predetermined comorbidity can be anemia.
CA 03179837 2022- 11- 22
WO 2021/237225
PCT/US2021/033947
3
As embodied herein, the selected patient can receive basal-bolus insulin
therapy.
As embodied herein, the predetermined diagnostic category is infectious and
parasitic
diseases, and the rate of hospitalization for infectious and parasitic
diseases of the
selected patient after six months can be reduced by 51% relative to an average
rate of
hospitalization for infectious and parasitic diseases of selected patients
having anemia
without the continuous glucose monitor regimen.
As embodied herein, the predetermined diagnostic category is respiratory
diseases, and the rate of hospitalization for respiratory diseases of the
selected patient
after six months can be reduced by 38% relative to an average rate of
hospitalization for
respiratory diseases of selected patients having anemia without the continuous
glucose
monitor regimen. As embodied herein, the predetermined diagnostic category is
kidney
and urinary tract diseases, and the rate of hospitalization for kidney and
urinary tract
diseases of the selected patient after six months can be reduced by 57%
relative to an
average rate of hospitalization for kidney and urinary tract diseases of
selected patients
having anemia without the continuous glucose monitor regimen
As embodied herein, the predetermined diagnostic category is hepatobiliary and
pancreatic diseases, and the rate of hospitalization for hepatobiliary and
pancreatic
diseases of the selected patient after six months can be reduced by 55%
relative to an
average rate of hospitalization for hepatobiliary and pancreatic diseases of
selected
patients having anemia without the continuous glucose monitor regimen.
As embodied herein, the selected patient can be receiving non-multiple daily
insulin injection therapy. As embodied herein, the predetermined diagnostic
category is
infectious and parasitic diseases, and the rate of hospitalization for
infectious and
parasitic diseases of the selected patient after six months can be reduced by
48% relative
to an average rate of hospitalization for infectious and parasitic diseases of
selected
patients having anemia without the continuous glucose monitor regimen. As
embodied
herein, the predetermined diagnostic category is respiratory diseases, and the
rate of
hospitalization for respiratory diseases of the selected patient after six
months can be
reduced by 59% relative to an average rate of hospitalization for respiratory
diseases of
selected patients having anemia without the continuous glucose monitor
regimen. As
embodied herein, the predetermined diagnostic category is kidney and urinary
tract
diseases, and the rate of hospitalization for kidney and urinary tract
diseases of the
selected patient after six months can be reduced by 51% relative to an average
rate of
CA 03179837 2022- 11- 22
WO 2021/237225 PCT/US2021/033947
4
hospitalization for kidney and urinary tract diseases of selected patients
having anemia
without the continuous glucose monitor regimen. As embodied herein, the
predetermined
diagnostic category is hepatobiliary and pancreatic diseases, and the rate of
hospitalization for hepatobiliary and pancreatic diseases of the selected
patient after six
months can be reduced by 44% relative to an average rate of hospitalization
for
hepatobiliary and pancreatic diseases of selected patients having anemia
without the
continuous glucose monitor regimen.
According to embodiments, the predetermined diagnostic category is infectious
and parasitic diseases, and the rate of hospitalization for infectious and
parasitic diseases
of the selected patient after six months can be reduced by at least 33%
relative to an
average rate of hospitalization for infectious and parasitic diseases of
selected patients
having the predetermined comorbidity without the continuous glucose monitor
regimen.
As embodied herein, the selected patient can be receiving basal-bolus insulin
therapy. As embodied herein, the predetermined comorbidity is a fluid and
electrolyte
disorder, and the rate of hospitalization for infectious and parasitic
diseases of the
selected patient having fluid and electrolyte disorder after six months can be
reduced by
at least 59% relative to an average rate of hospitalization for infectious and
parasitic
diseases of selected patients having fluid and electrolyte disorder without
the continuous
glucose monitor regimen. As embodied herein, the predetermined comorbidity is
a
valvular disorder, and the rate of hospitalization for infectious and
parasitic diseases of
the selected patient having a valvular disorder after six months can be
reduced at least by
58% relative to an average rate of hospitalization for infectious and
parasitic diseases of
selected patients having a valvular disorder without the continuous glucose
monitor
regimen. As embodied herein, the predetermined comorbidity is liver disease,
and the
rate of hospitalization for infectious and parasitic diseases of the selected
patient having
liver disease after six months can be reduced by at least 50% relative to an
average rate
of hospitalization for infectious and parasitic diseases of selected patients
having liver
disease without the continuous glucose monitor regimen.
As embodied herein, the selected patient can be receiving non-multiple daily
insulin injection therapy. As embodied herein, the predetermined comorbidity
is a fluid
or electrolyte disorder, and the rate of hospitalization for infectious and
parasitic diseases
of the selected patient having a fluid or electrolyte disorder after six
months can be
reduced by at least 68% relative to an average rate of hospitalization for
infectious and
CA 03179837 2022- 11- 22
WO 2021/237225 PCT/US2021/033947
parasitic diseases of selected patients having fluid or electrolyte disorders
without the
continuous glucose monitor regimen. As embodied herein, the predetermined
comorbidity is a valvular disorder, and the rate of hospitalization for
infectious and
parasitic diseases of the selected patient having a valvular disorder after
six months can
5 be reduced by at least 53% relative to an average rate of hospitalization
for infectious
and parasitic diseases of selected patients having valvular disorders without
the
continuous glucose monitor regimen. As embodied herein, the predetermined
comorbidity is liver disease, and the rate of hospitalization for infectious
and parasitic
diseases of the selected patient having liver disease after six months can be
reduced by at
least 54% relative to an average rate of hospitalization for infectious and
parasitic
diseases of selected patients having liver disease without the continuous
glucose monitor
regimen.
In accordance with the disclosed subject matter, to some embodiments, a system
to establish an analyte monitor regimen is also provided The system includes a
sensor
control device comprising an analyte sensor coupled with sensor electronics,
the sensor
control device configured to transmit data indicative of an analyte level,
and, a reader
device comprising a display, wireless communication circuitry configured to
receive the
data indicative of the analyte level, and one or more processors coupled with
a memory,
the memory configured to store instructions that, when executed by the one or
more
processors, cause the one or more processors to output to the display an
analyte level
measurement, wherein after six months of initiating an analyte monitor regimen
using
the system for a type 2 diabetic patient having a predetermined comorbidity, a
rate of
hospitalization for a predetermined diagnostic category of the selected
patient having the
predetermined comorbidity can be reduced by at least 12% relative to an
average rate of
hospitalization for a predetermined diagnostic category of selected patients
having the
predetermined comorbidity without the continuous glucose monitor regimen. The
system can include any of the features described hereinabove for the method of
treatment.
In accordance with the disclosed subject matter, a method of treatment of a
type 2
diabetic patient can include selecting a type 2 diabetic patient having a
predetermined
comorbidity for treatment, initiating a continuous glucose monitor regimen for
the
selected type 2 diabetic patient, wherein after six months of initiation of
the continuous
glucose monitor regimen, an average rate of hospitalization for a
predetermined
CA 03179837 2022- 11- 22
WO 2021/237225 PCT/US2021/033947
6
diagnostic category of the selected patient having the predetermined
comorbidity can be
reduced by at least 12% relative to an average rate of hospitalization for the
predetermined diagnostic category of the selected patient having the
predetermined
comorbidity during a period of six months prior to initiating the continuous
glucose
monitor regimen.
As embodied herein, the selected patient can be receiving basal-bolus insulin
therapy. As embodied herein, the predetermined diagnostic category is
infectious and
parasitic diseases, and the average rate of hospitalization for infectious and
parasitic
diseases of the selected patient after six months can be reduced by 51%
relative to an
average rate of hospitalization for infectious and parasitic diseases of the
selected patient
having anemia during a period of six months prior to initiating the continuous
glucose
monitor regimen. As embodied herein, the predetermined diagnostic category is
respiratory diseases, and the average rate of hospitalization for respiratory
diseases of the
selected patient after six months can be reduced by 38% relative to an average
rate of
hospitalization for respiratory diseases of the selected patient having anemia
during a
period of six months prior to initiating the continuous glucose monitor
regimen. As
embodied herein, the predetermined diagnostic category is kidney and urinary
tract
diseases, and the average rate of hospitalization for kidney and urinary tract
diseases of
the selected patient after six months can be reduced by 57% relative to an
average rate of
hospitalization for kidney and urinary tract diseases of the selected patient
having anemia
during a period of six months prior to initiating the continuous glucose
monitor regimen.
As embodied herein, the predetermined diagnostic category is hepatobiliary and
pancreatic diseases, and the average rate of hospitalization for hepatobiliary
and
pancreatic diseases of the selected patient after six months can be reduced by
55%
relative to an average rate of hospitalization for hepatobiliary and
pancreatic diseases of
the selected patient having anemia during a period of six months prior to
initiating the
continuous glucose monitor regimen.
As embodied herein, the selected patient can be receiving non-multiple daily
insulin injection therapy. As embodied herein, the predetermined diagnostic
category is
infectious and parasitic diseases, and the average rate of hospitalization for
infectious
and parasitic diseases of the selected patient after six months can be reduced
by 48%
relative to an average rate of hospitalization for infectious and parasitic
diseases of the
selected patient having anemia during a period of six months prior to
initiating the
CA 03179837 2022- 11- 22
WO 2021/237225
PCT/US2021/033947
7
continuous glucose monitor regimen. As embodied herein, the predetermined
diagnostic
category is respiratory diseases, and the average rate of hospitalization for
respiratory
diseases of the selected patient after six months can be reduced by 59%
relative to an
average rate of hospitalization for respiratory diseases of the selected
patient having
anemia during a period of six months prior to initiating the continuous
glucose monitor
regimen. As embodied herein, the predetermined diagnostic category is kidney
and
urinary tract diseases, and the average rate of hospitalization for kidney and
urinary tract
diseases of the selected patient after six months can be reduced by 51%
relative to an
average rate of hospitalization for kidney and urinary tract diseases of the
selected
patient having anemia during a period of six months prior to initiating the
continuous
glucose monitor regimen. As embodied herein, the predetermined diagnostic
category is
hepatobiliary and pancreatic diseases, and the average rate of hospitalization
for
hepatobiliary and pancreatic diseases of the selected patient after six months
can be
reduced by 44% relative to an average rate of hospitalization for
hepatobiliary and
pancreatic diseases of the selected patient having anemia during a period of
six months
prior to initiating the continuous glucose monitor regimen.
According to embodiments, the predetermined diagnostic category is infectious
and parasitic diseases, and the average rate of hospitalization for infectious
and parasitic
diseases of the selected patient after six months can be reduced by at least
33% relative
to an average rate of hospitalization for infectious and parasitic diseases of
the selected
patient having the predetermined comorbidity during a period of six months
prior to
initiating the continuous glucose monitor regimen.
As embodied herein, the selected patient can be receiving basal-bolus insulin
therapy. As embodied herein, the predetermined comorbidity is a fluid and
electrolyte
disorder, and the average rate of hospitalization for infectious and parasitic
diseases of
the selected patient having fluid and electrolyte disorder after six months
can be reduced
by at least 59% relative to an average rate of hospitalization for infectious
and parasitic
diseases of the selected patient having fluid and electrolyte disorder during
a period of
six months prior to initiating the continuous glucose monitor regimen. As
embodied
herein, the predetermined comorbidity is a valvular disorder, and the average
rate of
hospitalization for infectious and parasitic diseases of the selected patient
having a
valvular disorder after six months can be reduced at least by 58% relative to
an average
rate of hospitalization for infectious and parasitic diseases of the selected
patient having
CA 03179837 2022- 11- 22
WO 2021/237225 PCT/US2021/033947
8
a valvular disorder during a period of six months prior to initiating the
continuous
glucose monitor regimen. As embodied herein, the predetermined comorbidity is
liver
disease, and the average rate of hospitalization for infectious and parasitic
diseases of the
selected patient having liver disease after six months can be reduced by at
least 50%
relative to an average rate of hospitalization for infectious and parasitic
diseases of the
selected patient having liver disease during a period of six months prior to
initiating the
continuous glucose monitor regimen.
As embodied herein, the selected patient can be receiving non-multiple daily
insulin injection therapy. As embodied herein, the predetermined comorbidity
is a fluid
or electrolyte disorder, and the average rate of hospitalization for
infectious and parasitic
diseases of the selected patient having a fluid or electrolyte disorder after
six months can
be reduced by at least 68% relative to an average rate of hospitalization for
infectious
and parasitic diseases of the selected patient having fluid or electrolyte
disorders during a
period of six months prior to initiating the continuous glucose monitor
regimen. As
embodied herein, the predetermined comorbidity is a valvular disorder, and the
average
rate of hospitalization for infectious and parasitic diseases of the selected
patient having
a valvular disorder after six months can be reduced by at least 53% relative
to an average
rate of hospitalization for infectious and parasitic diseases of the selected
patient having
valvular disorders during a period of six months prior to initiating the
continuous glucose
monitor regimen. As embodied herein, the predetermined comorbidity is liver
disease,
and the average rate of hospitalization for infectious and parasitic diseases
of the selected
patient having liver disease after six months can be reduced by at least 54%
relative to an
average rate of hospitalization for infectious and parasitic diseases of the
selected patient
having liver disease during a period of six months prior to initiating the
continuous
glucose monitor regimen.
BRIEF DESCRIPTION OF THE FIGURES
The details of the subject matter set forth herein, both as to its structure
and
operation, may be apparent by study of the accompanying figures, in which like
reference numerals refer to like parts. The components in the figures are not
necessarily
to scale, emphasis instead being placed upon illustrating the principles of
the subject
matter. Moreover, all illustrations are intended to convey concepts, where
relative sizes,
shapes and other detailed attributes may be illustrated schematically rather
than literally
or precisely.
CA 03179837 2022- 11- 22
WO 2021/237225
PCT/US2021/033947
9
FIG. 1 is a system overview of an analyte monitoring system comprising a
sensor
applicator, a sensor control device, a reader device, a network, a trusted
computer
system, and a local computer system.
FIG. 2A is a block diagram depicting an example embodiment of a reader device.
FIGS. 2B and 2C are block diagrams depicting example embodiments of sensor
control devices.
FIGS. 2D to 21 are example embodiments of GUIs comprising sensor results
interfaces.
FIGS. 3A to 3F are example embodiments of GUIs comprising time-in-ranges
interfaces.
FIGS. 4A to 40 are example embodiments of GUIs comprising analyte level and
trend alert interfaces.
FIGS. 5A and 5B are example embodiments of GUIs comprising sensor usage
interfaces.
1 5 FIGS 5C to 5F are example embodiments of report GUIs including sensor
usage
information.
FIGS. 5G-5L are example embodiments of GUIs relating to an analyte monitoring
software application.
FIGS. 6A and 6B are flow diagrams depicting example embodiments of methods
for data backfilling in an analyte monitoring system.
FIG. 6C is a flow diagram depicting an example embodiment of a method for
aggregating disconnect and reconnect events in an analyte monitoring system.
FIG. 7 is a flow diagram depicting an example embodiment of a method for
failed or expired sensor transmissions in an analyte monitoring system.
FIGS. 8A and 8B are flow diagrams depicting example embodiments of methods
for data merging in an analyte monitoring system.
FIGS. 8C to 8E are graphs depicting data at various stages of processing
according to an example embodiment of a method for data merging in an analyte
monitoring system.
FIG. 9A is a flow diagram depicting an example embodiment of a method for
sensor transitioning in an analyte monitoring system.
CA 03179837 2022- 11- 22
WO 2021/237225 PCT/US2021/033947
FIGS. 9B to 9D are example embodiments of GUIs to be displayed according to
an example embodiment of a method for sensor transitioning in an analyte
monitoring
system.
FIG. 10A is a flow diagram depicting an example embodiment of a method for
5 generating a sensor insertion failure system alarm.
FIGS. 10B to 10D are example embodiments of GUIs to be displayed according
to an example embodiment of a method for generating a sensor insertion failure
system
alarm.
FIG. HA is a flow diagram depicting an example embodiment of a method for
10 generating a sensor termination system alarm.
FIGS. 11B to 11D are example embodiments of GUIs to be displayed according
to an example embodiment of a method for generating a sensor termination
system
alarm.
FIGS. 12A-12Q show the results of an exemplary study demonstrating reduction
in acute diabetes events and all cause hospitalizations associated with
continuous glucose
monitoring.
FIGS. 13A-13E show the results of an exemplary retrospective study showing
reduction
in acute diabetes complications in patients associated with continuous glucose
monitoring.
FIGS. 14A-14J the results of a real world study, using the Swedish National
Diabetes
register, comparing HbAl c levels in patients before and after use of a
continuous glucose
monitoring system.
FIGS. 15A-15K show the results of a cost impact analysis on adults using
continuous
flash glucose monitoring systems with optional alarms.
FIGS. 16A-16E show the results of a retrospective observational analysis which
indicates reduction of HbAl c levels in adults using a flash glucose
monitoring system.
FIGS. 17A-17E illustrate an exemplary kinetic model for predicting RBC
lifespan and
glucose uptake.
FIGS. 18A-18C show an analysis of several studies indicating HbAl c reduction
in
patients using a continuous glucose monitor system.
FIGS. 19A-19E show the results of a study analysis HbAlc reduction in patients
after
prescription of the FreeStyle Libre system.
CA 03179837 2022- 11- 22
WO 2021/237225 PCT/US2021/033947
11
FIGS. 20A-20C show the results of a study which examined the effects of a
continuous
glucose monitor on acute diabetes events and all cause hospitalizations.
FIGS. 21A-21J show a comparison of healthcare costs associated with use of
various
glycemic products, such as a continuous glucose monitor system.
FIGS. 22A-22C show the results of a meta-analysis of various studies which
indicate
improvement in several glycemic parameters in users with a continuous glucose
monitor
system.
FIGS. 23A-23I show an analysis of several studies which illustrate the
clinical effects of
diabetes management using flash glucose monitoring.
FIGS. 24A-24S show collected data from a plurality of patients with Type-2
diabetes
who were treated with non-MDI therapy.
FIGS. 25A-25V show collected data from a plurality of patients with Type-2
diabetes
who were treated with basal-bolus therapy.
DETAILED DESCRIPTION
Before the present subject matter is described in detail, it is to be
understood that
this disclosure is not limited to the particular embodiments described, as
such may, of
course, vary. It is also to be understood that the terminology used herein is
for the
purpose of describing particular embodiments only, and is not intended to be
limiting,
since the scope of this disclosure will be limited only by the appended
claims.
As used herein and in the appended claims, the singular forms "a," "an," and
"the" include plural referents unless the context clearly dictates otherwise.
The publications discussed herein are provided solely for their disclosure
prior to
the filing date of this application. Nothing herein is to be construed as an
admission that
this disclosure is not entitled to antedate such publication by virtue of
prior disclosure.
Further, the dates of publication provided may be different from the actual
publication
dates which may need to be independently confirmed.
Generally, embodiments of this disclosure include GUIs and digital interfaces
for
analyte monitoring systems, and methods and devices relating thereto.
Accordingly,
many embodiments include in vivo analyte sensors structurally configured so
that at least
a portion of the sensor is, or can be, positioned in the body of a user to
obtain
information about at least one analyte of the body. It should be noted,
however, that the
embodiments disclosed herein can be used with in vivo analyte monitoring
systems that
CA 03179837 2022- 11- 22
WO 2021/237225 PCT/US2021/033947
12
incorporate in vitro capability, as well as purely in vitro or ex vivo analyte
monitoring
systems, including systems that are entirely noninvasive.
Furthermore, for each and every embodiment of a method disclosed herein,
systems and devices capable of performing each of those embodiments are
covered
within the scope of this disclosure. For example, embodiments of sensor
control devices,
reader devices, local computer systems, and trusted computer systems are
disclosed, and
these devices and systems can have one or more sensors, analyte monitoring
circuits
(e.g., an analog circuit), memories (e.g., for storing instructions), power
sources,
communication circuits, transmitters, receivers, processors and/or controllers
(e.g., for
executing instructions) that can perform any and all method steps or
facilitate the
execution of any and all method steps.
As previously described, a number of embodiments described herein provide for
improved GUIs for analyte monitoring systems, wherein the GUIs are highly
intuitive,
user-friendly, and provide for rapid access to physiological information of a
user.
According to some embodiments, a Time-in-Ranges GUT of an analyte monitoring
system is provided, wherein the Time-in-Ranges GUI comprises a plurality of
bars or bar
portions, wherein each bar or bar portion indicates an amount of time that a
user's
analyte level is within a predefined analyte range correlating with the bar or
bar portion.
According to another embodiment, an Analyte Level/Trend Alert GUI of an
analyte
monitoring system is provided, wherein the Analyte Level/Trend Alert GUI
comprises a
visual notification (e.g., alert, alarm, pop-up window, banner notification,
etc.), and
wherein the visual notification includes an alarm condition, an analyte level
measurement associated with the alarm condition, and a trend indicator
associated with
the alarm condition. In sum, these embodiments provide for a robust, user-
friendly
interfaces that can increase user engagement with the analyte monitoring
system and
provide for timely and actionable responses by the user, to name a few
advantages.
In addition, a number of embodiments described herein provide for improved
digital interfaces for analyte monitoring systems. According to some
embodiments,
improved methods, as well as systems and device relating thereto, are provided
for data
backfilling, aggregation of disconnection and reconnection events for wireless
communication links, expired or failed sensor transmissions, merging data from
multiple
devices, transitioning of previously activated sensors to new reader devices,
generating
sensor insertion failure system alarms, and generating sensor termination
system alarms.
CA 03179837 2022- 11- 22
WO 2021/237225
PCT/US2021/033947
13
Collectively and individually, these digital interfaces improve upon the
accuracy and
integrity of analyte data being collected by the analyte monitoring system,
the flexibility
of the analyte monitoring system by allowing users to transition between
different reader
devices, and the alarming capabilities of the analyte monitoring system by
providing for
more robust inter-device communications during certain adverse conditions, to
name
only a few. Other improvements and advantages are provided as well. The
various
configurations of these devices are described in detail by way of the
embodiments which
are only examples.
Before describing these aspects of the embodiments in detail, however, it is
first
desirable to describe examples of devices that can be present within, for
example, an in
vivo analyte monitoring system, as well as examples of their operation, all of
which can
be used with the embodiments described herein.
There are various types of in vivo analyte monitoring systems. "Continuous
Analyte Monitoring" systems (or "Continuous Glucose Monitoring" systems), for
example, can transmit data from a sensor control device to a reader device
continuously
without prompting, e.g., automatically according to a schedule. "Flash Analyte
Monitoring" systems (or "Flash Glucose Monitoring" systems or simply "Flash"
systems), as another example, can transfer data from a sensor control device
in response
to a scan or request for data by a reader device, such as with a Near Field
Communication (NFC) or Radio Frequency Identification (RFID) protocol. In vivo
analyte monitoring systems can also operate without the need for finger stick
calibration.
In vivo analyte monitoring systems can be differentiated from "in vitro-
systems
that contact a biological sample outside of the body (or "ex vivo") and that
typically
include a meter device that has a port for receiving an analyte test strip
carrying bodily
fluid of the user, which can be analyzed to determine the user's blood sugar
level.
In vivo monitoring systems can include a sensor that, while positioned in
vivo,
makes contact with the bodily fluid of the user and senses the analyte levels
contained
therein. The sensor can be part of the sensor control device that resides on
the body of
the user and contains the electronics and power supply that enable and control
the
analyte sensing. The sensor control device, and variations thereof, can also
be referred to
as a "sensor control unit," an "on-body electronics" device or unit, an "on-
body" device
or unit, or a "sensor data communication" device or unit, to name a few.
CA 03179837 2022- 11- 22
WO 2021/237225
PCT/US2021/033947
14
In vivo monitoring systems can also include a device that receives sensed
analyte
data from the sensor control device and processes and/or displays that sensed
analyte
data, in any number of forms, to the user. This device, and variations
thereof, can be
referred to as a "handheld reader device," "reader device" (or simply a
"reader"),
"handheld electronics" (or simply a "handheld"), a "portable data processing"
device or
unit, a "data receiver," a "receiver" device or unit (or simply a "receiver"),
or a "remote"
device or unit, to name a few. Other devices such as personal computers have
also been
utilized with or incorporated into in vivo and in vitro monitoring systems.
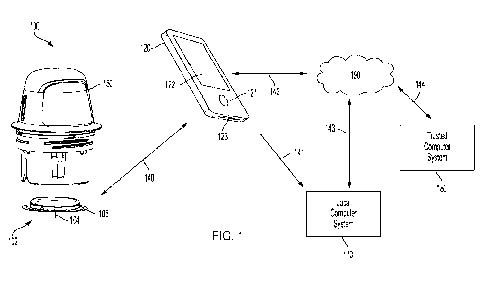
Example Embodiment of In Vivo Analyte Monitoring System
FIG. 1 is a conceptual diagram depicting an example embodiment of an analyte
monitoring system 100 that includes a sensor applicator 150, a sensor control
device 102,
and a reader device 120. Here, sensor applicator 150 can be used to deliver
sensor
control device 102 to a monitoring location on a user's skin where a sensor
104 is
maintained in position for a period of time by an adhesive patch 105. Sensor
control
device 102 is further described in FIGS 2B and 2C, and can communicate with
reader
device 120 via a communication path 140 using a wired or wireless technique.
Example
wireless protocols include Bluetooth, Bluetooth Low Energy (BLE, BTLE,
Bluetooth
SMART, etc.), Near Field Communication (NFC) and others. Users can view and
use
applications installed in memory on reader device 120 using screen 122 (which,
in many
embodiments, can comprise a touchscreen), and input 121. A device battery of
reader
device 120 can be recharged using power port 123. While only one reader device
120 is
shown, sensor control device 102 can communicate with multiple reader devices
120.
Each of the reader devices 120 can communicate and share data with one
another. More
details about reader device 120 is set forth with respect to FIG. 2A below.
Reader device
120 can communicate with local computer system 170 via a communication path
141
using a wired or wireless communication protocol. Local computer system 170
can
include one or more of a laptop, desktop, tablet, phablet, smartphone, set-top
box, video
game console, or other computing device and wireless communication can include
any of
a number of applicable wireless networking protocols including Bluetooth,
Bluetooth
Low Energy (BTLE), Wi-Fi or others. Local computer system 170 can communicate
via
communications path 143 with a network 190 similar to how reader device 120
can
communicate via a communications path 142 with network 190, by a wired or
wireless
communication protocol as described previously. Network 190 can be any of a
number
CA 03179837 2022- 11- 22
WO 2021/237225
PCT/US2021/033947
of networks, such as private networks and public networks, local area or wide
area
networks, and so forth. A trusted computer system 180 can include a cloud-
based
platform or server, and can provide for authentication services, secured data
storage,
report generation, and can communicate via communications path 144 with
network 190
5 by wired or wireless technique. In addition, although FIG. 1 depicts
trusted computer
system 180 and local computer system 170 communicating with a single sensor
control
device 102 and a single reader device 120, it will be appreciated by those of
skill in the
art that local computer system 170 and/or trusted computer system 180 are each
capable
of being in wired or wireless communication with a plurality of reader devices
and
10 sensor control devices.
Additional details of suitable analyte monitoring devices, systems, methods,
components and the operation thereof along with related features are set forth
in U.S.
Patent No. 9,913,600 to Taub et. al., International Publication No.
W02018/136898 to
Rao et. al., International Publication No. W02019/236850 to Thomas et. al.,
and U.S.
15 Patent Publication No. 2020/01969191 to Rao et al., each of which is
incorporated by
reference in its entirety herein.
Example Embodiment of Reader Device
FIG. 2A is a block diagram depicting an example embodiment of a reader device
120, which, As embodied herein, can comprise a smart phone. Here, reader
device 120
can include a display 122, input component 121, and a processing core 206
including a
communications processor 222 coupled with memory 223 and an applications
processor
224 coupled with memory 225. Also included can be separate memory 230, RF
transceiver 228 with antenna 229, and power supply 226 with power management
module 238. Further, reader device 120 can also include a multi-functional
transceiver
232, which can comprise wireless communication circuitry, and which can be
configured
to communicate over Wi-Fi, NFC, Bluetooth, BTLE, and GPS with an antenna 234.
As
understood by one of skill in the art, these components are electrically and
communicatively coupled in a manner to make a functional device.
Example Embodiments of Sensor Control Devices
FIGS. 2B and 2C are block diagrams depicting example embodiments of sensor
control devices 102 having analyte sensors 104 and sensor electronics 160
(including
analyte monitoring circuitry) that can have the majority of the processing
capability for
rendering end-result data suitable for display to the user. In FIG. 2B, a
single
CA 03179837 2022- 11- 22
WO 2021/237225 PCT/US2021/033947
16
semiconductor chip 161 is depicted that can be a custom application specific
integrated
circuit (ASIC). Shown within ASIC 161 are certain high-level functional units,
including
an analog front end (AFE) 162, power management (or control) circuitry 164,
processor
166, and communication circuitry 168 (which can be implemented as a
transmitter,
receiver, transceiver, passive circuit, or otherwise according to the
communication
protocol). In this embodiment, both AFE 162 and processor 166 are used as
analyte
monitoring circuitry, but in other embodiments either circuit can perform the
analyte
monitoring function. Processor 166 can include one or more processors,
microprocessors, controllers, and/or microcontrollers, each of which can be a
discrete
chip or distributed amongst (and a portion of) a number of different chips.
A memory 163 is also included within ASIC 161 and can be shared by the
various functional units present within ASIC 161, or can be distributed
amongst two or
more of them. Memory 163 can also be a separate chip. Memory 163 can be
volatile
and/or non-volatile memory. In this embodiment, ASIC 161 is coupled with power
source 170, which can be a coin cell battery, or the like AFE 162 interfaces
with in vivo
analyte sensor 104 and receives measurement data therefrom and outputs the
data to
processor 166 in digital form, which in turn processes the data to arrive at
the end-result
glucose discrete and trend values, etc. This data can then be provided to
communication
circuitry 168 for sending, by way of antenna 171, to reader device 120 (not
shown), for
example, where minimal further processing is needed by the resident software
application to display the data. According to some embodiments, for example, a
current
glucose value can be transmitted from sensor control device 102 to reader
device 120
every minute, and historical glucose values can be transmitted from sensor
control device
102 to reader device 120 every five minutes.
As embodied herein, to conserve power and processing resources on sensor
control device 102, digital data received from AFE 162 can be sent to reader
device 120
(not shown) with minimal or no processing. In still other embodiments,
processor 166
can be configured to generate certain predetermined data types (e.g., current
glucose
value, historical glucose values) either for storage in memory 163 or
transmission to
reader device 120 (not shown), and to ascertain certain alarm conditions
(e.g., sensor
fault conditions), while other processing and alarm functions (e.g., high/low
glucose
threshold alarms) can be performed on reader device 120. Those of skill in the
art will
understand that the methods, functions, and interfaces described herein can be
performed
CA 03179837 2022- 11- 22
WO 2021/237225 PCT/US2021/033947
17
¨ in whole or in part -- by processing circuitry on sensor control device 102,
reader
device 120, local computer system 170, or trusted computer system 180.
FIG. 2C is similar to FIG. 2B but instead includes two discrete semiconductor
chips 162 and 174, which can be packaged together or separately. Here, AFE 162
is
resident on ASIC 161. Processor 166 is integrated with power management
circuitry 164
and communication circuitry 168 on chip 174. AFE 162 can include memory 163
and
chip 174 includes memory 165, which can be isolated or distributed within. In
one
example embodiment, AFE 162 is combined with power management circuitry 164
and
processor 166 on one chip, while communication circuitry 168 is on a separate
chip. In
another example embodiment, both AFE 162 and communication circuitry 168 are
on
one chip, and processor 166 and power management circuitry 164 are on another
chip. It
should be noted that other chip combinations are possible, including three or
more chips,
each bearing responsibility for the separate functions described, or sharing
one or more
functions for fail-safe redundancy.
Example Embodiments of Graphical User InterfOces fOr Analyte Monitoring-
,S'ysterns
Described herein are example embodiments of GUIs for analyte monitoring
systems. As an initial matter, it will be understood by those of skill in the
art that the
GUIs described herein comprise instructions stored in a memory of reader
device 120,
local computer system 170, trusted computer system 180, and/or any other
device or
system that is part of, or in communication with, analyte monitoring system
100. These
instructions, when executed by one or more processors of the reader device
120, local
computer system 170, trusted computer system 180, or other device or system
'of analyte
monitoring system 100, cause the one or more processors to perform the method
steps
and/or output the GUIs described herein. Those of skill in the art will
further recognize
that the GUIs described herein can be stored as instructions in the memory of
a single
centralized device or, in the alternative, can be distributed across multiple
discrete
devices in geographically dispersed locations.
Example Embodiments of Sensor Results Interfaces
FIGS. 2D to 21 depict example embodiments of sensor results interfaces or GUIs
for analyte monitoring systems. In accordance with the disclosed subject
matter, the
sensor results GUIs described herein are configured to display analyte data
and other
health information through a user interface application (e.g., software)
installed on a
reader device, such as a smart phone or a receiver, like those described with
respect to
CA 03179837 2022- 11- 22
WO 2021/237225 PCT/US2021/033947
18
FIG. 2B. Those of skill in the art will also appreciate that a user interface
application
with a sensor results interface or GUI can also be implemented on a local
computer
system or other computing device (e.g., wearable computing devices, smart
watches,
tablet computer, etc.).
Referring first to FIG. 2D, sensor results GUI 235 depicts an interface
comprising
a first portion 236 that can include a numeric representation of a current
analyte
concentration value (e.g., a current glucose value), a directional arrow to
indicate an
analyte trend direction, and a text description to provide contextual
information such as,
for example, whether the user's analyte level is in range (e.g., "Glucose in
Range"). First
portion 236 can also comprise a color or shade that is indicative of an
analyte
concentration or trend. For example, as shown in FIG. 2D, first portion 236 is
a green
shade, indicating that the user's analyte level is within a target range.
According to some
embodiments, for example, a red shade can indicate an analyte level below a
low analyte
level threshold, an orange shade can indicate an analyte level above a high
analyte level
threshold, and an yellow shade can indicate an analyte level outside a target
range
In addition, according to some embodiments, sensor results GUI 235 also
includes a second portion 237 comprising a graphical representation of analyte
data. In
particular, second portion 237 includes an analyte trend graph reflecting an
analyte
concentration, as shown by the y-axis, over a predetermined time period, as
shown by the
x-axis. As embodied herein, the predetermined time period can be shown in five-
minute
increments, with a total of twelve hours of data. Those of skill in the art
will appreciate,
however, that other time increments and durations of analyte data can be
utilized and are
fully within the scope of this disclosure. Second portion 237 can also include
a point 239
on the analyte trend graph to indicate the current analyte concentration
value, a shaded
green area 240 to indicate a target analyte range, and two dotted lines 238a
and 238b to
indicate, respectively, a high analyte threshold and a low analyte threshold.
According to
some embodiments, GUI 235 can also include a third portion 241 comprising a
graphical
indicator and textual information representative of a remaining amount of
sensor life.
Referring next to FIG. 2E, another example embodiment of a sensor results GUI
245 is depicted. In accordance with the disclosed subject matter, first
portion 236 is
shown in a yellow shade to indicate that the user's current analyte
concentration is not
within a target range. In addition, second portion 237 includes: an analyte
trend line 241
which can reflect historical analyte levels over time and a current analyte
data point 239
CA 03179837 2022- 11- 22
WO 2021/237225 PCT/US2021/033947
19
to indicate the current analyte concentration value (shown in yellow to
indicate that the
current value is outside the target range).
According to another aspect of the embodiments, data on sensor results GUI 245
is automatically updated or refreshed according to an update interval (e.g.,
every second,
every minute, every 5 minutes, etc.). For example, according to many of the
embodiments, as analyte data is received by the reader device, sensor results
GUI 245
will update: (1) the current analyte concentration value shown in first
portion 236, and
(2) the analyte trend line 241 and current analyte data point 239 show in
second portion
237. Furthermore, As embodied herein, the automatically updating analyte data
can
cause older historical analyte data (e.g., in the left portion of analyte
trend line 241) to no
longer be displayed.
FIG. 2F is another example embodiment of a sensor results GUI 250. According
to the depicted embodiment, sensor results GUI 250 includes first portion 236
which is
shown in an orange shade to indicate that the user's analyte levels are above
a high
glucose threshold (e g , greater than 250 mg/dL) Sensor results GUI 250 also
depicts
health information icons 251, such as an exercise icon or an apple icon, to
reflect user
logged entries indicating the times when the user had exercised or eaten a
meal.
FIG. 2G is another example embodiment of a sensor results GUI 255. According
to the depicted embodiments, sensor results GUI 255 includes first portion 236
which is
also shown in an orange shade to indicate that the user's analyte levels are
above a high
glucose threshold. As can be seen in FIG. 2G, first portion 236 does not
report a numeric
value but instead displays the text "Hr. to indicate that the current analyte
concentration
value is outside a glucose reporting range high limit. Although not depicted
in FIG. 2G,
those of skill in the art will understand that, conversely, an analyte
concentration below a
glucose reporting range low limit will cause first portion 236 not to display
a numeric
value, but instead, the text "LO".
FIG. 2H is another example embodiment of a sensor results GUI 260. According
to the depicted embodiments, sensor results GUI 260 includes first portion 236
which is
shown in a green shade to indicate that the user's current analyte level is
within the target
range. In addition, according to the depicted embodiments, first portion 236
of GUI 260
includes the text, "GLUCOSE GOING LOW," which can indicate to the user that
his or
her analyte concentration value is predicted to drop below a predicted low
analyte level
threshold within a predetermined amount of time (e.g., predicted glucose will
fall below
CA 03179837 2022- 11- 22
WO 2021/237225
PCT/US2021/033947
75 mg/dL within 15 minutes). Those of skill in the art will understand that if
a user's
analyte level is predicted to rise above a predicted high analyte level
threshold within a
predetermined amount of time, sensor results GUI 260 can display a "GLUCOSE
GOING HIGH" message.
5 FIG.
21 is another example embodiment of a sensor results GUI 265. According
to the depicted embodiments, sensor results GUI 265 depicts first portion 236
when there
is a sensor error. In accordance with the disclosed subject matter, first
portion 236
includes three dashed lines 266 in place of the current analyte concentration
value to
indicate that a current analyte value is not available. As embodied herein,
three dashed
10 lines 266 can indicate one or more error conditions such as, for
example, (1) a no signal
condition; (2) a signal loss condition; (3) sensor too hot/cold condition; or
(4) a glucose
level unavailable condition. Furthermore, as can be seen in FIG. 21, first
portion 236
comprises a gray shading (instead of green, yellow, orange, or red) to
indicate that no
current analyte data is available. In addition, according to another aspect of
the
15 embodiments, second portion 237 can be configured to display the
historical analyte data
in the analyte trend graph, even though there is an error condition preventing
the display
of a numeric value for a current analyte concentration in first portion 236.
However, as
shown in FIG. 21, no current analyte concentration value data point is shown
on the
analyte trend graph of second portion 237.
20 Example Embodiments of Time-in-Ranges Interfaces
FIGS. 3A to 3F depict example embodiments of GUIs for analyte monitoring
systems. In particular, FIGS. 3A to 3F depict Time-in-Ranges (also referred to
as Time-
in-Range and/or Time-in-Target) GUIs, each of which comprise a plurality of
bars or bar
portions, wherein each bar or bar portion indicates an amount of time that a
user's
analyte level is within a predefined analyte range correlating with the bar or
bar portion.
As embodied herein, for example, the amount of time can be expressed as a
percentage
of a predefined amount of time.
Turning to FIGS. 3A and 3B, an example embodiment of a Time-in-Ranges GUI
305 is shown, wherein Time-in-Ranges GUI 305 comprises a "Custom" Time-in-
Ranges
view 305A and a "Standard" Time-in-Ranges view 305B, with a slidable element
310
that allows the user to select between the two views. In accordance with the
disclosed
subject matter, Time-in-Ranges views 305A, 305B can each comprise multiple
bars,
wherein each bar indicates an amount of time that a user's analyte level is
within a
CA 03179837 2022- 11- 22
WO 2021/237225
PCT/US2021/033947
21
predefined analyte range correlating with the bar. As embodied herein, Time-in-
Ranges
views 305A, 305B further comprise a date range indicator 308, showing relevant
dates
associated with the displayed plurality of bars, and a data availability
indicator 314,
showing the period(s) of time in which analyte data is available for the
displayed analyte
data (e.g., "Data available for 7 of 7 days").
Referring to FIG. 3A, "Custom" Time-in-Ranges view 305A includes six bars
comprising (from top to bottom): a first bar indicating that the user's
glucose range is
above 250 mg/dL for 10% of a predefined amount of time, a second bar
indicating that
the user's glucose range is between 141 and 250 mg/dL for 24% of the
predefined
amount of time, a third bar 316 indicating that the user's glucose range is
between 100
and 140 mg/dL for 54% of the predefined amount of time, a fourth bar
indicating that the
user's glucose range is between 70 and 99 mg/dL for 9% of the predefined
amount of
time, a fifth bar indicating that the user's glucose range is between 54 and
69 mg/dL for
2% of the predefined amount of time, and a sixth bar indicating that the
user's glucose
range is less than 54 mg/dI, for 1% of the predefined amount of time
Those of skill in the art will recognize that the glucose ranges and
percentages of
time associated with each bar can vary depending on the ranges defined by the
user and
the available analyte data of the user. Furthermore, although FIGS. 3A and 3B
show a
predefined amount of time 314 equal to seven days, those of skill in the art
will
appreciate that other predefined amounts of time can be utilized (e.g., one
day, three
days, fourteen days, thirty days, ninety days, etc.), and are fully within the
scope of this
disclosure.
According to another aspect of the embodiments, "Custom- Time-in-Ranges
view 305A also includes a user-definable custom target range 312 that includes
an
actionable "edit" link that allows a user to define and/or change the custom
target range.
As shown in "Custom" Time-in-Ranges view 305A, the custom target range 312 has
been defined as a glucose range between 100 and 140 mg/dL and corresponds with
third
bar 316 of the plurality of bars. Those of skill in the art will also
appreciate that, in other
embodiments, more than one range can be adjustable by the user, and such
embodiments
are fully within the scope of this disclosure.
Referring to FIG. 3B, "Standard" Time-in-Ranges view 305B includes five bars
comprising (from top to bottom): a first bar indicating that the user's
glucose range is
above 250 mg/dL for 10% of a predefined amount of time, a second bar
indicating that
CA 03179837 2022- 11- 22
WO 2021/237225 PCT/US2021/033947
22
the user's glucose range is between 181 and 250 mg/dL for 24% of the
predefined
amount of time, a third bar indicating that the user's glucose range is
between 70 and 180
mg/dL for 54% of the predefined amount of time, a fourth bar indicating that
the user's
glucose range is between 54 and 69 mg/dL for 10% of the predefined amount of
time,
and a fifth bar indicating that the user's glucose range is less than 54 mg/dL
for 2% of
the predefined amount of time. As with the "Custom" Time-in-Ranges view 305A,
those
of skill in the art will recognize that the percentages of time associated
with each bar can
vary depending on the available analyte data of the user. Unlike the "Custom"
Time-in-
Ranges view 305A, however, the glucose ranges shown in "Standard" view 305B
cannot
be adjusted by the user.
FIGS. 3C and 3D depict another example embodiment of Time-in-Ranges GUI
320 with multiple views, 320A and 320B, which are analogous to the views shown
in
FIGS. 3A and 3B, respectively. According to some embodiments, Time-in-Ranges
GUI
320 can further include one or more selectable icons 322 (e.g., radio button,
check box,
slider, switch, etc.) that allow a user to select a predefined amount of time
over which the
user's analyte data will be shown in the Time-in-Range GUI 320. For example,
as shown
in FIGS. 3C and 3D, selectable icons 322 can be used to select a predefined
amount of
time of seven days, fourteen days, thirty days, or ninety days. Those of skill
in the art
will appreciate that other predefined amounts of time can be utilized and are
fully within
the scope of this disclosure.
FIG. 3E depicts an example embodiment of a Time-in-Target GUI 330, which
can be visually output to a display of a reader device (e.g., a dedicated
reader device, a
meter device, etc.). In accordance with the disclosed subject matter, Time-in-
Target GUI
330 includes three bars comprising (from top to bottom): a first bar
indicating that the
user's glucose range is above a predefined target range for 34% of a
predefined amount
of time, a second bar indicating that the user's glucose range is within the
predefined
target range for 54% of the predefined amount of time, and a third bar
indicating that the
user's glucose range is below the predefined target range for 12% of the
predefined
amount of time. Those of skill in the art will recognize that the percentages
of time
associated with each bar can vary depending on the available analyte data of
the user.
Furthermore, although FIG. 3E shows a predefined amount of time 332 equal to
the last
seven days and a predefined target range 334 of 80 to 140 mg/dL, those of
skill in the art
will appreciate that other predefined amounts of time (e.g., one day, three
days, fourteen
CA 03179837 2022- 11- 22
WO 2021/237225 PCT/US2021/033947
23
days, thirty days, ninety days, etc.) and/or predefined target ranges (e.g.,
70 to 180
mg/dL) can be utilized, and are fully within the scope of this disclosure.
FIG. 3F depicts another example embodiment of a Time-in-Ranges GUI 340,
which includes a single bar comprising five bar portions including (from top
to bottom):
a first bar portion indicating that the user's glucose range is "Very High" or
above 250
mg/dL for 1% (14 minutes) of a predefined amount of time, a second bar portion
indicating that the user's glucose range is "High" or between 180 and 250
mg/dL for
18% (4 hours and 19 minutes) of the predefined amount of time, a third bar
portion
indicating that the user's glucose range is within a "Target Range" or between
70 and
180 mg/dL for 78% (18 hours and 43 minutes) of the predefined amount of time,
a fourth
bar portion indicating that the user's glucose range is "Low" or between 54
and 69
mg/dL for 3% (43 minutes) of the predefined amount of time, and a fifth bar
portion
indicating that the user's glucose range is "Very Low" or less than 54 mg/dL
for 0% (0
minutes) of the predefined amount of time. As shown in FIG. 3F, according to
some
embodiments, Time-in-Ranges GUT 340 can display text adjacent to each bar
portion
indicating an actual amount of time, e.g., in hours and/or minutes.
According to one aspect of the embodiment shown in FIG. 3F, each bar portion
of Time-in-Ranges GUI 340 can comprise a different color. As embodied herein,
bar
portions can be separated by dashed or dotted lines 342 and/or interlineated
with numeric
markers 344 to indicate the ranges reflected by the adjacent bar portions. As
embodied
herein, the time in ranges reflected by the bar portions can be further
expressed as a
percentage, an actual amount of time (e.g., 4 hours and 19 minutes), or, as
shown in FIG.
3F, both. Furthermore, those of skill in the art will recognize that the
percentages of time
associated with each bar portion can vary depending on the analyte data of the
user. In
some embodiments of Time-in-Ranges GUI 340, the Target Range can be configured
by
the user. In other embodiments, the Target Range of Time-in-Ranges GUI 340 is
not
modifiable by the user.
Example Embodiments of Analyte Level and Trend Alert Interfaces
FIGS. 4A to 40 depict example embodiments of Analyte Level/Trend Alert GUIs
for analyte monitoring systems. In accordance with the disclosed subject
matter, the
Analyte Level/Trend Alert GUIs comprise a visual notification (e.g., alert,
alarm, pop-up
window, banner notification, etc.), wherein the visual notification includes
an alarm
CA 03179837 2022- 11- 22
WO 2021/237225 PCT/US2021/033947
24
condition, an analyte level measurement associated with the alarm condition,
and a trend
indicator associated with the alarm condition.
Turning to FIGS. 4A to 4C, example embodiments of a High Glucose Alarm 410,
Low Glucose Alarm 420, and a Serious Low Glucose Alarms 430 are depicted,
respectively, wherein each alarm comprises a pop-up window 402 containing an
alarm
condition text 404 (e.g., "Low Glucose Alarm"), an analyte level measurement
406 (e.g.,
a current glucose level of 67 mg/dL) associated with the alarm condition, and
a trend
indicator 408 (e.g., a trend arrow or directional arrow) associated with the
alarm
condition. As embodied herein, an alarm icon 412 can be adjacent to the alarm
condition
text 404.
Referring next to FIGS. 4D to 4G, additional example embodiments of Low
Glucose Alarms 440, 445, Serious Low Glucose Alarm 450, and High Glucose Alarm
455 are depicted, respectively. As shown in FIG. 4D, Low Glucose Alarm 440 is
similar
to the Low Glucose Alarm of FIG. 4B (e.g., comprises a pop-up window
containing an
alarm condition text, an analyte level measurement associated with the alarm
condition,
and a trend indicator associated with the alarm condition), but further
includes an alert
icon 442 to indicate that the alarm has been configured as an alert (e.g.,
will display, play
a sound, vibrate, even if the device is locked or if the device's "Do Not
Disturb" setting
has been enabled). With respect to FIG. 4E, Low Glucose Alarm 445 is also
similar to
the Low Glucose Alarm of FIG. 4B, but instead of including a trend arrow, Log
Glucose
Alarm 445 includes a textual trend indicator 447. According to one aspect of
some
embodiments, textual trend indicator 447 can be enabled through a device's
Accessibility
settings such that the device will "read" the textual trend indicator 447 to
the user via the
device's text-to-speech feature (e.g., Voiceover for iOS or Select-to-Speak
for Android).
Referring next to FIG. 4F, Low Glucose Alarm 450 is similar to the Low Glucose
Alarm of FIG. 4D (including the alert icon), but instead of displaying an
analyte level
measurement associated with an alarm condition and a trend indicator
associated with
the alarm condition, Low Glucose Alarm 450 displays a out-of-range indicator
452 to
indicate that the current glucose level is either above or below a
predetermined
reportable analyte level range (e.g., "HI" or "LO"). With respect to FIG. 4G,
High
Glucose Alarm 455 is similar to the High Glucose Alarm of FIG. 4A (e.g.,
comprises a
pop-up window containing an alarm condition text, an analyte level measurement
associated with the alarm condition, and a trend indicator associated with the
alarm
CA 03179837 2022- 11- 22
WO 2021/237225 PCT/US2021/033947
condition), but further includes an instruction to the user 457. As embodied
herein, for
example, the instruction can be a prompt for the user to "Check blood
glucose." Those of
skill in the art will appreciate that other instructions or prompts can be
implemented
(e.g., administer a corrective bolus, eat a meal, etc.).
5 Furthermore, although FIGS. 4A to 4G depict example embodiments of
Analyte
Level/Trend Alert GUIs that are displayed on smart phones having an iOS
operating
system, those of skill in the art will also appreciate that the Analyte
Level/Trend Alert
GUIs can be implemented on other devices including, e.g., smart phones with
other
operating systems, smart watches, wearables, reader devices, tablet computing
devices,
10 blood glucose meters, laptops, desktops, and workstations, to name a
few. FIGS. 4H to
4J, for example, depict example embodiments of a High Glucose Alarm, Low
Glucose
Alarm, and a Serious Low Glucose Alarm for a smart phone having an Android
Operating System. Similarly, FIGS. 4K to 40 depict, respectively, example
embodiments of a Serious Low Glucose Alarm, Low Glucose Alarm, High Glucose
15 Alarm, Serious Low Glucose Alarm (with a Check Blood Glucose icon), and
High
Glucose Alarm (with an out-of-range indicator) for a reader device.
Example Embodiments of Sensor Usage Interfaces
FIGS. 5A to 5F depict example embodiments of sensor usage interfaces relating
to GUIs for analyte monitoring systems. In accordance with the disclosed
subject matter,
20 sensor usage interfaces provide for technological improvements including
the capability
to quantify and promote user engagement with analyte monitoring systems.
According to
some embodiments, for example, a sensor usage interface can include the visual
display
of one or more "view" metrics, each of which can be indicative of a measure of
user
engagement with the analyte monitoring system. A "view" can comprise, for
example, an
25 instance in which a sensor results interface is rendered or brought into
the foreground.
According to other embodiments, a "view" can be defined as an instance when a
user
views a sensor results interface with a valid sensor reading for the first
time in a sensor
lifecount. As embodied herein, a sensor user interface can include a visual
display of a
"scan" metric indicative of another measure of user engagement with the
analyte
monitoring system. A "scan" can comprise, for example, an instance in which a
user uses
a reader device (e.g., smart phone, dedicated reader, etc.) to scan a sensor
control device,
such as, for example, in a Flash Analyte Monitoring system.
CA 03179837 2022- 11- 22
WO 2021/237225 PCT/US2021/033947
26
FIG. 5A and 5B depict example embodiments of sensor usage interfaces 500 and
510, respectively. In accordance with the disclosed subject matter, sensor
usage
interfaces 500 and 510 can be rendered and displayed, for example, by a mobile
app or
software residing in non-transitory memory of reader device 120, such as those
described
with respect to FIGS. 1 and 2A. Referring to FIG. 5A, sensor user interface
500 can
comprise: a predetermined time period interval 508 indicative of a time period
(e.g., a
date range) during which view metrics are measured, a Total Views metric 502,
which is
indicative of a total number of views over the predetermined time period 508;
a Views
Per Day metric 504, which is indicative of an average number of views per day
over the
predetermined time period 508; and a Percentage Time Sensor Active metric 506,
which
is indicative of the percentage of predetermined time period 508 that reader
device 120 is
in communication with sensor control device 102, such as those described with
respect to
FIGS. 1, 2B, and 2C. Referring to FIG. 5B, sensor user interface 510 can
comprise a
Views per Day metric 504 and a Percentage Time Sensor Active metric 508, each
of
which is measured for predetermined time period 508
According to another aspect of the embodiments, although predetermined time
period 508 is shown as one week, those of skill in the art will recognize that
other
predetermined time periods (e.g., 3 days, 14 days, 30 days) can be utilized.
In addition,
predetermined time period 508 can be a discrete period of time -- with a start
date and an
end date -- as shown in sensor usage interface 500 of FIG. 5A, or can be a
time period
relative to a current day or time (e.g., "Last 7 Days," "Last 14 Days," etc.),
as shown in
sensor usage interface 510 of FIG. 5B.
FIG. 5C depicts an example embodiment of sensor usage interface 525, as part
of
analyte monitoring system report GUI 515. In accordance with the disclosed
subject
matter, GUI 515 is a snapshot report covering a predetermined time period 516
(e.g., 14
days), and comprising a plurality of report portions on a single report GUI,
including: a
sensor usage interface portion 525, a glucose trend interface 517, which can
include an
glucose trend graph, a low glucose events graph, and other related glucose
metrics (e.g.,
Glucose Management Indicator); a health information interface 518, which can
include
information logged by the user about the user's average daily carbohydrate
intake and
medication dosages (e.g., insulin dosages); and a comments interface 519,
which can
include additional information about the user's analyte and medication
patterns presented
in a narrative format. According to another aspect of the embodiments, sensor
usage
CA 03179837 2022- 11- 22
WO 2021/237225 PCT/US2021/033947
27
interface 525 can comprise a Percentage Time Sensor Active metric 526, an
Average
Scans/Views metric 527 (e.g., indicative of an average sum of a number of
scans and a
number of views), and a Percentage Time Sensor Active graph 528. As can be
seen in
FIG. 5C, an axis of the Percentage Time Sensor Active graph can be aligned
with a
corresponding axis of one or more other graphs (e.g., average glucose trend
graph, low
glucose events graph), such that the user can visually correlate data between
multiple
graphs from two or more portions of the report GUI by the common units (e.g.,
time of
day) from the aligned axes.
FIG. 5D depicts an example embodiment of another analyte monitoring system
report GUI 530 including sensor usage information. In accordance with the
disclosed
subject matter, GUI 530 is a monthly summary report including a first portion
comprising a legend 531, wherein legend 531 includes a plurality of graphical
icons each
of which is adjacent to a descriptive text. As shown in FIG. 5D, legend 531
includes an
icon and descriptive text for "Average Glucose," an icon and descriptive text
for
"Scans/Views," and an icon and descriptive text for "Low Glucose Events." GUI
530
also includes a second portion comprising a calendar interface 532. For
example, as
shown in FIG. 5D, GUI 530 comprises a monthly calendar interface, wherein each
day of
the month can include one or more of an average glucose metric, low glucose
event
icons, and a sensor usage metric 532. As embodied herein, such as the one
shown in FIG.
5D, the sensor usage metric ("scans/views") is indicative of a total sum of a
number of
scans and a number of views for each day.
FIG. 5E depicts an example embodiment of another analyte monitoring system
report GUI 540 including sensor usage information. In accordance with the
disclosed
subject matter, GUI 540 is a weekly summary report including a plurality of
report
portions, wherein each report portion is representative of a different day of
the week, and
wherein each report portion comprises a glucose trend graph 541, which can
include the
user's measured glucose levels over a twenty-four hour period, and a health
information
interface 543, which can include information about the user's average daily
glucose,
carbohydrate intake, and/or insulin dosages. As embodied herein, glucose trend
graph
541 can include sensor usage markers 542 to indicate that a scan, a view, or
both had
occurred at a particular time during the twenty-four hour period.
FIG. 5F depicts an example embodiment of another analyte monitoring system
report GUI 550 including sensor usage information. In accordance with the
disclosed
CA 03179837 2022- 11- 22
WO 2021/237225 PCT/US2021/033947
28
subject matter, GUI 550 is a daily log report comprising a glucose trend graph
551,
which can include the user's glucose levels over a twenty-four hour period. As
embodied
herein, glucose trend graph 551 can include sensor usage markers 552 to
indicate that a
scan, a view, or both had occurred at a particular time during the twenty-four
hour
period. Glucose trend graph 551 can also include logged event markers, such as
logged
carbohydrate intake markers 553 and logged insulin dosage markers 554, as well
as
glucose event markers, such as low glucose event markers 555.
FIGS. 51 to 5L depict various GUIs for improving usability and user privacy
with
respect to analyte monitoring software. FIG. 5G, GUI 5540 depicts a research
consent
interface 5540, which prompts the user to choose to either decline or opt in
(through
buttons 5542) with respect to permitting the user's analyte data and/or other
product-
related data to be used for research purposes. According to embodiments of the
disclosed
subject matter, the analyte data can be anonymized (de-identified) and stored
in an
international database for research purposes.
Referring next to FTC 514, GUT 5550 depicts a "Vitamin C" warning interface
5550 which displays a warning to the user that the daily use of more than 500
mg of
Vitamin C supplements can result in falsely high sensor readings.
FIG. 51 is GUI 5500 depicting a first start interface which can be displayed
to a
user the first time the analyte monitoring software is started. In accordance
with the
disclosed subject matter, GUI 5500 can include a "Get Started Now" button 5502
that,
when pressed, will navigate the user to GUI 5510 of FIG. 5.1. GUI 5510 depicts
a country
confirmation interface 5512 that prompts the user to confirm the user's
country.
According to another aspect of the embodiments, the country selected can limit
and/or
enable certain interfaces within the analyte monitoring software application
for
regulatory compliance purposes.
Turning next to FIG. 5K, GUI 5520 depicts a user account creation interface
which allows the user to initiate a process to create a cloud-based user
account. In
accordance with the disclosed subject matter, a cloud-based user account can
allow the
user to share information with healthcare professionals, family and friends;
utilize a
cloud-based reporting platform to review more sophisticated analyte reports;
and back up
the user's historical sensor readings to a cloud-based server. As embodied
herein, GUI
5520 can also include a "Skip" link 5522 that allows a user to utilize the
analyte
monitoring software application in an "accountless mode" (e.g., without
creating or
CA 03179837 2022- 11- 22
WO 2021/237225
PCT/US2021/033947
29
linking to a cloud-based account). Upon selecting the "Skip- link 5522, an
information
window 5524 can be displayed to inform that certain features are not available
in
"accountless mode." Information window 5524 can further prompt the user to
return to
GUI 5520 or proceed without account creation.
FIG. 5L is GUI 5530 depicting a menu interface displayed within an analyte
monitoring software application while the user is in "accountless mode." In
accordance
with the disclosed subject matter, GUI 5530 includes a "Sign in" link 5532
that allows
the user to leave "accountless mode" and either create a cloud-based user
account or
sign-in with an existing cloud-based user account from within the analyte
monitoring
software application.
It will be understood by those of skill in the art that any of the GUIs,
reports
interfaces, or portions thereof, as described herein, are meant to be
illustrative only, and
that the individual elements, or any combination of elements, depicted and/or
described
for a particular embodiment or figure are freely combinable with any elements,
or any
combination of elements, depicted and/or described with respect to any of the
other
embodiments.
Example Embodiments of Digital Interfaces for Analyte Monitoring Systems
Described herein are example embodiments of digital interfaces for analyte
monitoring systems. In accordance with the disclosed subject matter, a digital
interface
can comprise a series of instructions, routines, subroutines, and/or
algorithms, such as
software and/or firmware stored in a non-transitory memory, executed by one or
more
processors of one or more devices in an analyte monitoring system, wherein the
instructions, routines, subroutines, or algorithms are configured to enable
certain
functions and inter-device communications. As an initial matter, it will be
understood by
those of skill in the art that the digital interfaces described herein can
comprise
instructions stored in a non-transitory memory of a sensor control device 102,
reader
device 120, local computer system 170, trusted computer system 180, and/or any
other
device or system that is part of, or in communication with, analyte monitoring
system
100, as described with respect to FIGS. 1, 2A, and 2B. These instructions,
when
executed by one or more processors of the sensor control device 102, reader
device 120,
local computer system 170, trusted computer system 180, or other device or
system of
analyte monitoring system 100, cause the one or more processors to perform the
method
steps described herein. Those of skill in the art will further recognize that
the digital
CA 03179837 2022- 11- 22
WO 2021/237225
PCT/US2021/033947
interfaces described herein can be stored as instructions in the memory of a
single
centralized device or, in the alternative, can be distributed across multiple
discrete
devices in geographically dispersed locations.
Example Embodiments of Methods for Data Backfilling
5
Example embodiments of methods for data backfilling in an analyte monitoring
system will now be described. In accordance with the disclosed subject matter,
gaps in
analyte data and other information can result from interruptions to
communication links
between various devices in an analyte monitoring system 100. These
interruptions can
occur, for example, from a device being powered off (e.g., a user's smart
phone runs out
10 of battery), or a first device temporarily moving out of a wireless
communication range
from a second device (e.g., a user wearing sensor control device 102
inadvertently leaves
her smart phone at home when she goes to work). As a result of these
interruptions,
reader device 120 may not receive analyte data and other information from
sensor
control device 102. It would thus be beneficial to have a robust and flexible
method for
15 data backfilling in an analyte monitoring system to ensure that once a
communication
link is re-established, each analyte monitoring device can receive a complete
set of data,
as intended.
FIG. 6A is a flow diagram depicting an example embodiment of a method 600 for
data backfilling in an analyte monitoring system. In accordance with the
disclosed
20 subject matter, method 600 can be implemented to provide data
backfilling between a
sensor control device 102 and a reader device 120. At Step 602, analyte data
and other
information is autonomously communicated between a first device and a second
device
at a predetermined interval. As embodied herein, the first device can be a
sensor control
device 102, and the second device can be a reader device 120, as described
with respect
25 to FIGS. 1, 2A, and 2B. In accordance with the disclosed subject matter,
analyte data and
other information can include, but is not limited to, one or more of: data
indicative of an
analyte level in a bodily fluid, a rate-of-change of an analyte level, a
predicted analyte
level, a low or a high analyte level alert condition, a sensor fault
condition, or a
communication link event. According to another aspect of the embodiments,
autonomous
30 communications at a predetermined interval can comprise streaming
analyte data and
other information according to a standard wireless communication network
protocol,
such as a Bluetooth or Bluetooth Low Energy protocol, at one or more
predetermined
rates (e.g., every minute, every five minutes, every fifteen minutes, etc.).
As embodied
CA 03179837 2022- 11- 22
WO 2021/237225 PCT/US2021/033947
31
herein, different types of analyte data or other information can be
autonomously
communicated between the first and second devices at different predetermined
rates
(e.g., historical glucose data every 5 minutes, current glucose value every
minute, etc.).
At Step 604, a disconnection event or condition occurs that causes an
interruption
to the communication link between the first device and the second device. As
described
above, the disconnection event can result from the second device (e.g., reader
device
120, smart phone, etc.) running out of battery power or being powered off
manually by a
user. A disconnection event can also result from the first device being moved
outside a
wireless communication range of the second device, from the presence of a
physical
barrier that obstructs the first device and/or the second device, or from
anything that
otherwise prevents wireless communications from occurring between the first
and
second devices.
At Step 606, the communication link is re-established between the first device
and the second device (e.g., the first device comes back into the wireless
communication
range of the second device) Upon reconnection, the second device requests
historical
analyte data according to a last lifecount metric for which data was received.
In
accordance with the disclosed subject matter, the lifecount metric can be a
numeric value
that is incremented and tracked on the second device in units of time (e.g.,
minutes), and
is indicative of an amount of time elapsed since the sensor control device was
activated.
For example, As embodied herein, after the second device (e.g., reader device
120, smart
phone, etc.) re-establishes a Bluetooth wireless communication link with the
first device
(e.g., sensor control device 120), the second device can determine the last
lifecount
metric for which data was received. Then, according to some embodiments, the
second
device can send to the first device a request for historical analyte data and
other
information having a lifecount metric greater than the determined last
lifecount metric
for which data was received.
As embodied herein, the second device can send a request to the first device
for
historical analyte data or other information associated with a specific
lifecount range,
instead of requesting historical analyte data associated with a lifecount
metric greater
than a determined last lifecount metric for which data was received.
At Step 608, upon receiving the request, the first device retrieves the
requested
historical analyte data from storage (e.g., non-transitory memory of sensor
control device
102), and subsequently transmits the requested historical analyte data to the
second
CA 03179837 2022- 11- 22
WO 2021/237225
PCT/US2021/033947
32
device at Step 610. At Step 612, upon receiving the requested historical
analyte data, the
second device stores the requested historical analyte data in storage (e.g.,
non-transitory
memory of reader device 120). In accordance with the disclosed subject matter,
when the
requested historical analyte data is stored by the second device, it can be
stored along
with the associated lifecount metric. As embodied herein, the second device
can also
output the requested historical analyte data to a display of the second
device, such as, for
example to a glucose trend graph of a sensor results GUI, such as those
described with
respect to FIGS. 2D to 21. For example, As embodied herein, the requested
historical
analyte data can be used to fill in gaps in a glucose trend graph by
displaying the
requested historical analyte data along with previously received analyte data.
Furthermore, those of skill in the art will appreciate that the method of data
backfilling can be implemented between multiple and various devices in an
analyte
monitoring system, wherein the devices are in wired or wireless communication
with
each other.
FIG 613 is a flow diagram depicting another example embodiment of a method
620 for data backfilling in an analyte monitoring system. In accordance with
the
disclosed subject matter, method 620 can be implemented to provide data
backfilling
between a reader device 120 (e.g., smart phone, dedicated reader) and a
trusted computer
system 180, such as, for example, a cloud-based platform for generating
reports. At Step
622, analyte data and other information is communicated between reader device
120 and
trusted computer system 180 based on a plurality of upload triggers. In
accordance with
the disclosed subject matter, analyte data and other information can include,
but are not
limited to, one or more of: data indicative of an analyte level in a bodily
fluid (e.g.,
current glucose level, historical glucose data), a rate-of-change of an
analyte level, a
predicted analyte level, a low or a high analyte level alert condition,
information logged
by the user, information relating to sensor control device 102, alarm
information (e.g.,
alarm settings), wireless connection events, and reader device settings, to
name a few.
According to another aspect of the embodiments, the plurality of upload
triggers
can include (but is not limited to) one or more of the following: activation
of sensor
control device 102; user entry or deletion of a note or log entry; a wireless
communication link (e.g., Bluetooth) reestablished between reader device 120
and sensor
control device 102; alarm threshold changed; alarm presentation, update, or
dismissal;
internet connection re-established; reader device 120 restarted; a receipt of
one or more
CA 03179837 2022- 11- 22
WO 2021/237225
PCT/US2021/033947
33
current glucose readings from sensor control device 102; sensor control device
120
terminated; signal loss alarm presentation, update, or dismissal; signal loss
alarm is
toggled on/off; view of sensor results screen GUI; or user sign-in into cloud-
based
platform.
According to another aspect of the embodiments, in order to track the
transmission and receipt of data between devices, reader device 120 can "mark"
analyte
data and other information that is to be transmitted to trusted computer
system 180. As
embodied herein, for example, upon receipt of the analyte data and other
information,
trusted computer system 180 can send a return response to reader device 120,
to
acknowledge that the analyte data and other information has been successfully
received.
Subsequently, reader device 120 can mark the data as successfully sent. As
embodied
herein, the analyte data and other information can be marked by reader device
120 both
prior to being sent and after receipt of the return response. In other
embodiments, the
analyte data and other information can be marked by reader device 120 only
after receipt
of the return response from trusted computer system 180
Referring to FIG. 6B, at Step 624, a disconnection event occurs that causes an
interruption to the communication link between reader device 120 and trusted
computer
system 180. For example, the disconnection event can result from the user
placing the
reader device 120 into "airplane mode" (e.g., disabling of the wireless
communication
modules), from the user powering off the reader device 120, or from the reader
device
120 moving outside of a wireless communication range.
At Step 626, the communication link between reader device 120 and trusted
computer system 180 (as well as the internet) is re-established, which is one
of the
plurality of upload triggers. Subsequently, reader device 120 determines the
last
successful transmission of data to trusted computer system 180 based on the
previously
marked analyte data and other information sent. Then, at Step 628, reader
device 120 can
transmit analyte data and other information not yet received by trusted
computer system
180. At Step 630, reader device 120 receives acknowledgement of successful
receipt of
analyte data and other information from trusted computer system 180.
Although FIG. 6B is described above with respect to a reader in communication
with a trusted computer system, those of skill in the art will appreciate that
the data
backfilling method can be applied between other devices and computer systems
in an
analyte monitoring system (e.g., between a reader and a local computer system,
between
CA 03179837 2022- 11- 22
WO 2021/237225 PCT/US2021/033947
34
a reader and a medical delivery device, between a reader and a wearable
computing
device, etc.). These embodiments, along with their variations and
permutations, are fully
within the scope of this disclosure.
In addition to data backfilling, example embodiments of methods for
aggregating
disconnect and reconnect events for wireless communication links in an analyte
monitoring system are described. In accordance with the disclosed subject
matter, there
can be numerous and wide-ranging causes for interruptions to wireless
communication
links between various devices in an analyte monitoring system. Some causes can
be
technical in nature (e.g., a reader device is outside a sensor control
device's wireless
communication range), while other causes can relate to user behavior (e.g., a
user leaving
his or her reader device at home). In order to improve connectivity and data
integrity in
analyte monitoring systems, it would therefore be beneficial to gather
information
regarding the disconnect and reconnect events between various devices in an
analyte
monitoring system.
FIG 6C is a flow diagram depicting an example embodiment of a method 640 for
aggregating disconnect and reconnect events for wireless communication links
in an
analyte monitoring system. As embodied herein, for example, method 640 can be
used to
detect, log, and upload to trusted computer system 180, Bluetooth or Bluetooth
Low
Energy disconnect and reconnect events between a sensor control device 102 and
a
reader device 120. In accordance with the disclosed subject matter, trusted
computer
system 180 can aggregate disconnect and reconnect events transmitted from a
plurality
of analyte monitoring systems. The aggregated data can then by analyzed to
determine
whether any conclusions can be made about how to improve connectivity and data
integrity in analyte monitoring systems.
At Step 642, analyte data and other information are communicated between
reader device 120 and trusted computer system 180 based on a plurality of
upload
triggers, such as those previously described with respect to method 620 of
FIG. 6B. At
Step 644, a disconnection event occurs that causes an interruption to the
wireless
communication link between sensor control device 102 and reader device 120.
Example
disconnection events can include, but are not limited to, a user placing the
reader device
120 into "airplane mode," the user powering off the reader device 120, the
reader device
120 running out of power, the sensor control device 102 moving outside a
wireless
CA 03179837 2022- 11- 22
WO 2021/237225 PCT/US2021/033947
communication range of the reader devices 120, or a physical barrier
obstructing the
sensor control device 102 and/or the reader device 120, to name only a few.
Referring still to FIG. 6C, at Step 646, the wireless communication link
between
the sensor control device 102 and reader device 120 is re-established, which
is one of the
5 plurality of upload triggers. Subsequently, reader device 120 determines
a disconnect
time and a reconnect time, wherein the disconnect time is the time that the
interruption to
the wireless communication link began, and the reconnect time is the time that
the
wireless communication link between the sensor control device 102 and reader
device
120 is re-established. According to some embodiments, the disconnection and
10 reconnection times can also be stored locally in an event log on reader
device 120. At
Step 648, reader device 120 transmits the disconnect and reconnect times to
trusted
computer system 180.
According to some embodiments, the disconnect and reconnect times can be
stored in non-transitory memory of trusted computer system 180, such as in a
database,
15 and aggregated with the disconnect and reconnect times collected from
other analyte
monitoring systems. As embodied herein, the disconnect and reconnect times can
also be
transmitted to and stored on a different cloud-based platform or server from
trusted
computer system 180 that stores analyte data. In still other embodiments, the
disconnect
and reconnect times can be anonymized.
20 In addition, those of skill in the art will recognize that method 640
can be utilized
to collect disconnect and reconnect times between other devices in an analyte
monitoring
system, including, for example: between reader device 120 and trusted computer
system
180; between reader device 120 and a wearable computing device (e.g., smart
watch,
smart glasses); between reader device 120 and a medication delivery device
(e.g., insulin
25 pump, insulin pen); between sensor control device 102 and a wearable
computing device;
between sensor control device 102 and a medication delivery device; and any
other
combination of devices within an analyte monitoring system. Those of skill in
the art will
further appreciate that method 640 can be utilized to analyze disconnect and
reconnect
times for different wireless communication protocols, such as, for example,
Bluetooth or
30 Bluetooth Low Energy, NEC, 802.11x, UHF, cellular connectivity, or any
other standard
or proprietary wireless communication protocol.
CA 03179837 2022- 11- 22
WO 2021/237225 PCT/US2021/033947
36
Example Embodiments of _Improved Expired/Failed Sensor Transmissions
Example embodiments of methods for improved expired and/or failed sensor
transmissions in an analyte monitoring system will now be described. In
accordance with
the disclosed subject matter, expired or failed sensor conditions detected by
a sensor
control device 102 can trigger alerts on reader device 120. However, if the
reader device
120 is in "airplane mode," powered off, outside a wireless communication range
of
sensor control device 102, or otherwise unable to wirelessly communicate with
the
sensor control device 102, then the reader device 120 may not receive these
alerts. This
can cause the user to miss information such as, for example, the need to
replace a sensor
control device 102. Failure to take action on a detected sensor fault can also
lead to the
user being unaware of adverse glucose conditions (e.g., hypoglycemia and/or
hyperglycemia) due to a terminated sensor.
FIG. 7 is a flow diagram depicting an example embodiment of a method 700 for
improved expired or failed sensor transmissions in an analyte monitoring
system. In
accordance with the disclosed subject matter, method 700 can be implemented to
provide
for improved sensor transmissions by a sensor control device 102 after an
expired or
failed sensor condition has been detected. At Step 702, an expired or failed
sensor
condition is detected by sensor control device 102. As embodied herein, the
sensor fault
condition can comprise one or both of a sensor insertion failure condition or
a sensor
termination condition. According to some embodiments, for example, a sensor
insertion
failure condition or a sensor termination condition can include, but is not
limited to, one
or more of the following: a FIFO overflow condition detected, a sensor signal
below a
predetermined insertion failure threshold, moisture ingress detected, an
electrode voltage
exceeding a predetermined diagnostic voltage threshold, an early signal
attenuation
(ESA) condition, or a late signal attenuation (LSA) condition, to name a few.
Referring again to FIG. 7, at Step 704, sensor control device 102 stops
acquiring
measurements of analyte levels from the analyte sensor in response to the
detection of
the sensor fault condition. At Step 706, sensor control device 102 begins
transmitting an
indication of a sensor fault condition to reader device 120, while also
allowing for the
reader device 120 to connect to the sensor control device 102 for purposes of
data
backfilling. In accordance with the disclosed subject matter, the transmission
of the
indication of the sensor fault condition can comprise transmitting a plurality
of Bluetooth
or Bluetooth Low Energy advertising packets, each of which can include the
indication
CA 03179837 2022- 11- 22
WO 2021/237225
PCT/US2021/033947
37
of the sensor fault condition. As embodied herein, the plurality of Bluetooth
or BLE
advertising packets can be transmitted repeatedly, continuously, or
intermittently. Those
of skill in the art will recognize that other modes of wirelessly broadcasting
or
multicasting the indication of the sensor fault condition can be implemented.
According
to another aspect of the embodiments, in response to receiving the indication
of the
sensor fault condition, reader device 120 can visually display an alert or
prompt for a
confirmation by the user.
At Step 708, sensor control device 102 can be configured to monitor for a
return
response or acknowledgment of receipt of the indication of the sensor fault
condition
from reader device 120. As embodied herein, for example, a return response or
acknowledgement of receipt can be generated by reader device 120 when a user
dismisses an alert on the reader device 120 relating to the indication of the
sensor fault
condition, or otherwise responds to a prompt for confirmation of the
indication of the
sensor fault condition. If a return response or acknowledgement of receipt of
the
indication of the sensor fault condition is received by sensor control device
102, then at
Step 714, sensor control device 102 can enter either a storage state or a
termination state.
According to some embodiments, in the storage state, the sensor control device
102 is
placed in a low-power mode, and the sensor control device 102 is capable of
being re-
activated by a reader device 120. By contrast, in the termination state, the
sensor control
device 102 cannot be re-activated and must be removed and replaced.
If a receipt of the fault condition indication is not received by sensor
control
device 102, then at Step 710, the sensor control device 102 will stop
transmitting the
fault condition indication after a first predetermined time period. As
embodied herein,
for example, the first predetermined time period can be one of: one hour, two
hours, five
hours, etc. Subsequently, at Step 712, if a receipt of the fault condition
indication is still
not received by sensor control device 102, then at Step 712, the sensor
control device
102 will also stop allowing for data backfilling after a second predetermined
time period.
As embodied herein, for example, the second predetermined time period can be
one of:
twenty-four hours, forty-eight hours, etc. Sensor control device 102 then
enters a storage
state or a termination state at Step 714.
By allowing sensor control device 102 to continue transmissions of sensor
fault
conditions for a predetermined time period, the embodiments of this disclosure
mitigate
the risk of unreceived sensor fault alerts. In addition, although the
embodiments
CA 03179837 2022- 11- 22
WO 2021/237225 PCT/US2021/033947
38
described above are in reference to a sensor control device 102 in
communication with a
reader device 120, those of skill in the art will recognize that indications
of sensor fault
conditions can also be transmitted between a sensor control device 102 and
other types
of mobile computing devices, such as, for example, wearable computing devices
(e.g.,
smart watches, smart glasses) or tablet computing devices.
Example Embodiments of Data Merging in Analyte Monitoring Systems
Example embodiments of methods for merging data received from one or more
analyte monitoring systems will now be described. As described earlier with
respect to
FIG. 1, a trusted computer system 180, such as a cloud-based platform, can be
configured to generate various reports based on received analyte data and
other
information from a plurality of reader devices 120 and sensor control devices
102. A
large and diverse population of reader devices and sensor control devices,
however, can
give rise to complexities and challenges in generating reports based on the
received
analyte data and other information. For example, a single user can have
multiple reader
devices and/or sensor control devices, either simultaneously or serially over
time, each of
which can comprise different versions. This can lead to further complications
in that, for
each user, there may be sets of duplicative and/or overlapping data. It would
therefore be
beneficial to have methods for merging data at a trusted computer system for
purposes of
report generation.
FIG. 8A is a flow diagram depicting an example embodiment of a method 800 for
merging data associated with a user and generating one or more report metrics,
wherein
the data originates from multiple reader devices and multiple sensor control
devices. In
accordance with the disclosed subject matter, method 800 can be implemented to
merge
analyte data in order to generate different types of report metrics utilized
in various
reports. At Step 802, data is received from one or more reader devices 120 and
combined
for purposes of merging. At Step 804, the combined data is then de-duplicated
to remove
historical data from multiple readers originating from the same sensor control
device. In
accordance with the disclosed subject matter, the process of de-duplicating
data can
include (1) identifying or assigning a priority associated with each reader
device from
which analyte data is received, and (2) in the case where there is "duplicate"
data,
preserving the data associated with the reader device with a higher priority.
As embodied
herein, for example, a newer reader device (e.g., newer model, having a more
recent
version of software installed) is assigned a higher priority than an older
reader device
CA 03179837 2022- 11- 22
WO 2021/237225 PCT/US2021/033947
39
(e.g., older model, having an older version of software installed). As
embodied herein,
priority can be assigned by device type (e.g., smart phone having a higher
priority over a
dedicated reader).
Referring still to FIG. 8A, at Step 806, a determination is made as to whether
one
or more of the report metrics to be generated requires resolution of
overlapping data. If
not, at Step 808, a first type of report metric can be generated based on de-
duplicated
data without further processing. As embodied herein, for example, the first
type of report
metric can include average glucose levels used in reports, such as a snapshot
or monthly
summary report (as described with respect to FIGS. 5C and 5D). If it is
determined that
one or more of the report metrics to be generated requires resolution of
overlapping data,
then at Step 810, a method for resolving overlapping regions of data is
performed. An
example embodiment method for resolving overlapping regions of data is
described
below with respect to FIG. 8B. Subsequently, at Step 812, a second type of
report metric
based on data that has been de-duplicated and processed to resolve overlapping
data
segments, is generated As embodied herein, for example, the second type of
report
metric can include low glucose event calculations used in reports, such as the
daily log
report (as described with respect to FIG. 5F).
FIG. 8B is a flow diagram depicting an example embodiment of a method 815 for
resolving overlapping regions of analyte data, which can be implemented, for
example,
in Step 810 of method 800, as described with respect to FIG. 8A. At Step 817,
the de-
duplicated data from each reader (resulting from Step 804 of method 800, as
described
with respect to FIG. 8A) can be sorted from earliest to most recent. At Step
819, based
on the report metric to be generated, the de-duplicated and sorted data is
then isolated
according to a predetermined period of time. As embodied herein, for example,
if the
report metric is a graph reflecting glucose values over a specific day, then
the de-
duplicated and sorted data can be isolated for that specific day. Next, at
Step 821,
contiguous sections of the de-duplicated and sorted data for each reader
device are
isolated. In accordance with the disclosed subject matter, non-contiguous data
points can
be discarded or disregarded (e.g., not used) for purposes of generating report
metrics. At
Step 823, for each contiguous section of de-duplicated and sorted data of a
reader device,
a determination is made as to whether there are any overlapping regions with
other
contiguous sections of de-duplicated and sorted data from other reader
devices. At Step
825, for each overlapping region identified, the de-duplicated and sorted data
from the
CA 03179837 2022- 11- 22
WO 2021/237225
PCT/US2021/033947
reader device with the higher priority is preserved. At Step 827, if it is
determined that
all contiguous sections have been analyzed according to the previous steps,
then method
815 ends at Step 829. Otherwise, method 815 then returns to Step 823 to
continue
identifying and resolving any overlapping regions between contiguous sections
of de-
5 duplicated and sorted data for different reader devices.
FIGS. 8C to 8E are graphs (840, 850, 860) depicting various stages of de-
duplicated and sorted data from multiple reader devices, as the data is
processed
according to method 815 for resolving overlapping regions of data. Referring
first to
FIG. 8C, graph 840 depicts de-duplicated and sorted data from three different
reader
10 devices: a first reader 841 (as reflected by the circular data points),
a second reader 842
(as reflected by diamond-shaped data points), and a third reader 843 (as
reflected by the
square-shaped data points). According to one aspect of graph 840, the data is
depicted at
Step 821 of method 815, after it has been de-duplicated, sorted, and isolated
to a
predetermined time period. As can be seen in FIG. 8C, a contiguous section of
data for
15 each of the three reader devices (841, 842, and 843) has been
identified, and three traces
are shown. According to another aspect of the graph 840, non-contiguous points
844 are
not included in the three traces.
Referring next to FIG. 8D, graph 850 depicts the data from readers 841, 842,
843
at Step 823 of method 815, wherein three overlapping regions between the
contiguous
20 sections of data have been identified: a first overlapping region 851
between all three
contiguous sections of data; a second overlapping region 852 between two
contiguous
sections of data (from reader device 842 and reader device 843); and a third
overlapping
region 853 between two contiguous sections of data (also from reader device
842 and
reader device 843).
25 FIG. 8E is a graph 860 depicting data at Step 825 of method 815,
wherein a
single trace 861 indicates the merged, de-duplicated, and sorted data from
three reader
devices 841, 842, 843 after overlapping regions 851, 852, and 853 have been
resolved by
using the priority of each reader device. According to graph 860, the order of
priority
from highest to lowest is: reader device 843, reader device 842, and reader
device 841.
30 Although FIGS. 8C, 8D, and 8E depict three contiguous sections of
data with
three discrete overlapping regions identified, those of skill in the art will
understand that
either fewer or more contiguous sections of data (and non-contiguous data
points) and
overlapping regions are possible. For example, those of skill in the art will
recognize that
CA 03179837 2022- 11- 22
WO 2021/237225 PCT/US2021/033947
41
where a user has only two reader devices, there may be fewer contiguous
sections of data
and overlapping regions, if any at all. Conversely, if a user has five reader
devices, those
of skill in the art will understand that there may be five contiguous sections
of data with
three or more overlapping regions.
Example Embodiments of Sensor Transitioning
Example embodiments of methods for sensor transitioning will now be described.
In accordance with the disclosed subject matter, as mobile computing and
wearable
technologies continue to advance at a rapid pace and become more ubiquitous,
users are
more likely to replace or upgrade their smart phones more frequently. In the
context of
analyte monitoring systems, it would therefore be beneficial to have sensor
transitioning
methods to allow a user to continue using a previously activated sensor
control device
with a new smart phone. In addition, it would also be beneficial to ensure
that historical
analyte data from the sensor control device could be backfilled to the new
smart phone
(and subsequently uploaded to the trusted computer system) in a user-friendly
and secure
manner
FIG. 9A is a flow diagram depicting an example embodiment of a method 900 for
transitioning a sensor control device. In accordance with the disclosed
subject matter,
method 900 can be implemented in an analyte monitoring system to allow a user
to
continue using a previously activated sensor control device with a new reader
device
(e.g., smart phone). At Step 902, a user interface application (e.g., mobile
software
application or app) is installed on reader device 120 (e.g., smart phone),
which causes a
new unique device identifier, or "device ID," to be created and stored on
reader device
120. At Step 904, after installing and launching the app, the user is prompted
to enter
their user credentials for purposes of logging into trusted computer system
180 (e.g.,
cloud-based platform or server). An example embodiment of a GUI 930 for
prompting
the user to enter their user credentials is shown in FIG. 9B. In accordance
with the
disclosed subject matter, GUI 930 can include a username field 932, which can
comprise
a unique usemame or an e-mail address, and a masked or unmasked password field
934,
to allow the user to enter their password.
Referring again to FIG. 9A, at Step 906, after user credentials are entered
into the
app, a prompt is displayed requesting user confirmation to login to trusted
computer
system 180. An example embodiment of GUI 940 for requesting user confirmation
to
login to trusted computer system 180 is shown in FIG. 9D. In accordance with
the
CA 03179837 2022- 11- 22
WO 2021/237225 PCT/US2021/033947
42
disclosed subject matter, GUI 940 can also include a warning, such as the one
shown in
FIG. 9D, that confirming the login will cause the user to be logged off from
other reader
devices (e.g., the user's old smart phone).
If the user confirms login, then at Step 908, the user's credentials are sent
to
trusted computer system 180 and subsequently verified. In addition, according
to some
embodiments, the device ID can also be transmitted from the reader device 120
to trusted
computer system 180 and stored in a non-transitory memory of trusted computer
system
180. According to some embodiments, for example, in response to receiving the
device
ID, trusted computer system 180 can update a device ID field associated with
the user's
record in a database.
After the user credentials are verified by trusted computer system 180, at
Step
910, the user is prompted by the app to scan the already-activated sensor
control device
102. In accordance with the disclosed subject matter, the scan can comprise
bringing the
reader device 120 in close proximity to sensor control device 102, and causing
the reader
device 120 to transmit one or more wireless interrogation signals according to
a first
wireless communication protocol. As embodied herein, for example, the first
wireless
communication protocol can be a Near Field Communication (NFC) wireless
communication protocol. Those of skill in the art, however, will recognize
that other
wireless communication protocols can be implemented (e.g., infrared, UHF,
802.11x,
etc.). An example embodiment of GUI 950 for prompting the user to scan the
already-
activated sensor control device 102 is shown in FIG. 9D.
Referring still to FIG. 9A, at Step 912, scanning of sensor control device 102
by
reader device 120 causes sensor control device 102 to terminate an existing
wireless
communication link with the user's previous reader device, if there is
currently one
established. In accordance with the disclosed subject matter, the existing
wireless
communication link can comprise a link established according to a second
wireless
communication protocol that is different from the first wireless communication
protocol.
As embodied herein, for example, the second wireless communication protocol
can be a
Bluetooth or Bluetooth Low Energy protocol. Subsequently, sensor control
device 102
enters into a "ready to pair" state, in which sensor control device 102 is
available to
establish a wireless communication link with reader device 120 according to
the second
wireless communication protocol.
CA 03179837 2022- 11- 22
WO 2021/237225 PCT/US2021/033947
43
At Step 914, reader device 120 initiates a pairing sequence via the second
wireless communication protocol (e.g., Bluetooth or Bluetooth Low Energy) with
sensor
control device 102. Subsequently, at Step 916, sensor control device 102
completes the
pairing sequence with reader device 120. At Step 918, sensor control device
102 can
begin sending current glucose data to reader device 120 according to the
second wireless
communication protocol. As embodied herein, for example, current glucose data
can be
wirelessly transmitted to reader device 120 at a predetermined interval (e.g.,
every
minute, every two minutes, every five minutes).
Referring still to FIG. 9A, at Step 920, reader device 120 receives and stores
current glucose data received from sensor control device 102 in a non-
transitory memory
of reader device 120. In addition, according to some embodiments, reader
device 120 can
request historical glucose data from sensor control device 102 for backfilling
purposes.
According to some embodiments, for example, reader device 120 can request
historical
glucose data from sensor control device 102 for the full wear duration, which
is stored in
a non-transitory memory of sensor control device 102 In other embodiments,
reader
device 120 can request historical glucose data for a specific predetermined
time range
(e.g., from day 3 to present, from day 5 to present, last 3 days, last 5 days,
lifecount > 0,
etc.). Those of skill will appreciate that other backfilling schemes can be
implemented
(such as those described with respect to FIGS. 6A and 6B), and are fully
within the scope
of this disclosure.
Upon receipt of the request at Step 922, sensor control device 102 can
retrieve
historical glucose data from a non-transitory memory and transmit it to reader
device
120. In turn, at Step 924, reader device 120 can store the received historical
glucose data
in a non-transitory memory. In addition, according to some embodiments, reader
device
120 can also display the current and/or historical glucose data in the app
(e.g., on a
sensor results screen). In this regard, a new reader can display all available
analyte data
for the full wear duration of a sensor control device. As embodied herein,
reader device
120 can also transmit the current and/or historical glucose data to trusted
computer
system 180. At Step 926, the received glucose data can be stored in a non-
transitory
memory (e.g., a database) of trusted computer system 180.
As embodied herein, the received glucose data can also be de-duplicated prior
to
storage in non-transitory memory.
CA 03179837 2022- 11- 22
WO 2021/237225
PCT/US2021/033947
44
Example Embodiments of Check Sensor and Replace Sensor System Alarms
Example embodiments of autonomous check sensor and replace sensor system
alarms, and methods relating thereto, will now be described. In accordance
with the
disclosed subject matter, certain adverse conditions affecting the operation
of the analyte
sensor and sensor electronics can be detectable by the sensor control device.
For
example, an improperly inserted analyte sensor can be detected if an average
glucose
level measurement over a predetermined period of time is determined to be
below an
insertion failure threshold. Due to its small form factor and a limited power
capacity,
however, the sensor control device may not have sufficient alarming
capabilities. As
such, it would be advantageous for the sensor control device to transmit
indications of
adverse conditions to another device, such as a reader device (e.g., smart
phone), to alert
the user of those conditions.
FIG. 10A is a flow diagram depicting an example embodiment of a method 1000
for generating a sensor insertion failure system alarm (also referred to as a
"check
sensor" system alarm) At Step 1002, a sensor insertion failure condition is
detected by
sensor control device 102. As embodied herein, for example, a sensor insertion
failure
condition can be detected when an average glucose value during a predetermined
time
period (e.g., average glucose value over five minutes, eight minutes, 15
minutes, etc.) is
below an insertion failure glucose level threshold. At Step 1004, in response
to the
detection of the insertion failure condition, sensor control device 102 stops
taking
glucose measurements. At Step 1006, sensor control device 102 generates a
check sensor
indicator and transmits it via wireless communication circuitry to reader
device 120.
Subsequently, as shown at Steps 1012 and 1014, sensor control device 102 will
continue
to transmit the check sensor indicator until either: (1) a receipt of the
indicator is
received from reader device 120 (step 1012); or (2) a predetermined waiting
period has
elapsed (Step 1014), whichever occurs first.
According to another aspect of the embodiments, if a wireless communication
link is established between sensor control device 102 and reader device 120,
then reader
device 120 will receive the check sensor indicator at Step 1008. In response
to receiving
the check sensor indicator, reader device 120 will display a check sensor
system alarm at
Step 1010. FIGS. 10B to 10D are example embodiments of check sensor system
alarm
interfaces, as displayed on reader device 120. As embodied herein, for
example, the
check sensor system alarm can be a notification box, banner, or pop-up window
that is
CA 03179837 2022- 11- 22
WO 2021/237225 PCT/US2021/033947
output to a display of a smart phone, such as interfaces 1020 and 1025 of
FIGS. 10B and
10C. As embodied herein, the check sensor alarm can be output to a display on
a reader
device 120, such as a glucose meter or a receiver device, such as interface
1030 of FIG.
10D. According to the embodiments, reader device 120 can also transmit a check
sensor
5 indicator receipt back to sensor control device 102. As embodied herein,
for example, the
check sensor indicator receipt can be automatically generated and sent upon
successful
display of the check sensor system alarm 1020, 1025, or 1030. In other
embodiments, the
check sensor indicator receipt is generated and/or transmitted in response to
a
predetermined user input (e.g., dismissing the check sensor system alarm,
pressing a
10 confirmation 'OK' button 1032, etc.).
Subsequently, at Step 1011, reader device 120 drops sensor control device 102.
In
accordance with the disclosed subject matter, for example, Step 1011 can
comprise one
or more of: terminating an existing wireless communication link with sensor
control
device 102; unpairing from sensor control device 102; revoking an
authorization or
15 digital certificate associated with sensor control device 102; creating
or modifying a
record stored on reader device 120 to indicate that sensor control device 102
is in a
storage state; or transmitting an update to trusted computer system 180 to
indicate that
sensor control device 102 is in a storage state.
Referring back to FIG. 10A, if either the check sensor indicator receipt is
20 received (at Step 1012) by sensor control device 102 or the
predetermined wait period
has elapsed (Step 1014), then at Step 1016, sensor control device 102 stops
the
transmission of check sensor indicators. Subsequently, at Step 1018, sensor
control
device 102 enters a storage state in which sensor control device 102 does not
take
glucose measurements and the wireless communication circuitry is either de-
activated or
25 transitioned into a dormant mode. According to one aspect, while in a
'storage state,'
sensor control device 102 can be re-activated by reader device 120.
Although method 1000 of FIG. 10A is described with respect to glucose
measurements, those of skill in the art will appreciate that sensor control
device 102 can
be configured to measure other analytes (e.g., lactate, ketone, etc.) as well.
In addition,
30 although method 1000 of FIG. 10A describes certain method steps
performed by reader
device 120 (e.g., receiving check sensor indicator, displaying a check sensor
system
alarm, and sending a check sensor indicator receipt), those of skill in the
art will
understand that any or all of these method steps can be performed by other
devices in an
CA 03179837 2022- 11- 22
WO 2021/237225 PCT/US2021/033947
46
analyte monitoring system, such as, for example, a local computer system, a
wearable
computing device, or a medication delivery device. It will also be understood
by those of
skill in the art that method 1000 of FIG. 10A can combined with any of the
other
methods described herein, including but not limited to method 700 of FIG. 7,
relating to
expired and or failed sensor transmissions.
FIG. 11A is a flow diagram depicting an example embodiment of a method 1100
for generating a sensor termination system alarm (also referred to as a
"replace sensor"
system alarm). At Step 1102, a sensor termination condition is detected by
sensor control
device 102. As described earlier, a sensor termination condition can include,
but is not
limited to, one or more of the following: a FIFO overflow condition detected,
a sensor
signal below a predetermined insertion failure threshold, moisture ingress
detected, an
electrode voltage exceeding a predetermined diagnostic voltage threshold, an
early signal
attenuation (ESA) condition, or a late signal attenuation (LSA) condition, to
name a few.
At Step 1104, in response to the detection of a sensor termination condition,
sensor control device 102 stops taking glucose measurements At Step 1106,
sensor
control device 102 generates a replace sensor indicator and transmits it via
wireless
communication circuitry to reader device 120. Subsequently, at Step 1112,
sensor control
device 102 will continue to transmit the replace sensor indicator while
determining
whether a replace sensor indicator receipt has been received from reader
device 102. In
accordance with the disclosed subject matter, sensor control device 102 can
continue to
transmit the replace sensor indicator until either: (1) a predetermined
waiting period has
elapsed (Step 1113), or (2) a receipt of the replace sensor indicator is
received (Step
1112) and sensor control device 102 has successfully transmitted backfill data
(Steps
1116, 1120) to reader device 120.
Referring still to FIG. 11A, if a wireless communication link is established
between sensor control device 102 and reader device 120, then reader device
120 will
receive the replace sensor indicator at Step 1108. In response to receiving
the replace
sensor indicator, reader device 120 will display a replace sensor system alarm
at Step
1110. FIGS. 11B to 11D are example embodiments of replace sensor system alarm
interfaces, as displayed on reader device 120. As embodied herein, for
example, the
replace sensor system alarm can be a notification box, banner, or pop-up
window that is
output to a display of a smart phone, such as interfaces 1130 and 1135 of
FIGS. 11B and
11C. As embodied herein, the check sensor alarm can be output to a display on
a reader
CA 03179837 2022- 11- 22
WO 2021/237225
PCT/US2021/033947
47
device 120, such as a glucose meter or a receiver device, such as interface
1140 of FIG.
11D. According to the embodiments, to acknowledge receipt of the indicator,
reader
device 120 can also transmit a replace sensor indicator receipt back to sensor
control
device 102. As embodied herein, for example, the replace sensor indicator
receipt can be
automatically generated and sent upon successful display of the replace sensor
system
alarm 1130, 1135, or 1140. In other embodiments, the replace sensor indicator
is
generated and/or transmitted in response to a predetermined user input (e.g.,
dismissing
the check sensor system alarm, pressing a confirmation 'OK' button 1142,
etc.).
At Step 1114, after displaying the replace sensor system alarm and
transmitting
the replace sensor indicator receipt, reader device 120 can then request
historical glucose
data from sensor control device 102. At Step 1116, sensor control device 102
can collect
and send to reader device 120 the requested historical glucose data. In
accordance with
the disclosed subject matter, the step of requesting, collecting, and
communicating
historical glucose data can comprise a data backfilling routine, such as the
methods
described with respect to FIGS 6A and 6R
Referring again to FIG. 11A, in response to receiving the requested historical
glucose data, reader device 120 can send a historical glucose data received
receipt to
sensor control device 102 at Step 1118. Subsequently, at Step 1119, reader
device 120
drops sensor control device 102. In accordance with the disclosed subject
matter, for
example, Step 1119 can comprise one or more of. terminating an existing
wireless
communication link with sensor control device 102; unpairing from sensor
control
device 102; revoking an authorization or digital certificate associated with
sensor control
device 102; creating or modifying a record stored on reader device 120 to
indicate that
sensor control device 102 has been terminated; or transmitting an update to
trusted
computer system 180 to indicate that sensor control device 102 has been
terminated.
At Step 1120, sensor control device 102 receives the historical glucose data
received receipt. Subsequently, at Step 1122, sensor control device 102 stops
the
transmission of the replace sensor indicator and, at Step 1124, sensor control
device 102
can enter into a termination state in which sensor control device 102 does not
take
glucose measurements and the wireless communication circuitry is either de-
activated or
in a dormant mode. In accordance with the disclosed subject matter, when in a
termination state, sensor control device 102 cannot be re-activated by reader
device 120.
CA 03179837 2022- 11- 22
WO 2021/237225 PCT/US2021/033947
48
Although method 1100 of FIG. 11A is described with respect to glucose
measurements, those of skill in the art will appreciate that sensor control
device 102 can
be configured to measure other analytes (e.g., lactate, ketone, etc.) as well.
In addition,
although method 1100 of FIG. 11A describes certain method steps performed by
reader
device 120 (e.g., receiving replace sensor indicator, displaying a replace
sensor system
alarm, and sending a replace sensor indicator receipt), those of skill in the
art will
understand that any or all of these method steps can be performed by other
devices in an
analyte monitoring system, such as, for example, a local computer system, a
wearable
computing device, or a medication delivery device. It will also be understood
by those of
skill in the art that method 1100 of FIG. 11A can combined with any of the
other
methods described herein, including but not limited to method 700 of FIG. 7,
relating to
expired and or failed sensor transmissions.
Examples of Improved Clinical Outcomes Based on Continuous Glucose Monitoring
Described herein are example embodiments of improved clinical outcomes based
on analyte monitoring systems as described herein In accordance with disclosed
subject
matter, a continuous glucose monitor regimen can include standard approved use
of an
analyte monitoring system. For example, and not limitation, continuous glucose
monitor
can be available by prescription and a regimen can be prescribed by a health
care
professional or as otherwise approved by a regulatory authority. In an
exemplary
embodiment, a regimen can include using a reader device (e.g., smart phone,
dedicated
reader, etc.) to scan a sensor control device, such as, for example, in a
Flash Analyte
Monitoring system. In an exemplary embodiment, a regimen can include rendering
or
brining into the foreground a sensor results interface as described herein.
The presently disclosed subject matter will be better understood by reference
to
the following Examples. These Examples are merely illustrative of the
presently
disclosed subject matter and should not be considered as limiting the scope of
the subject
matter in any way.
Effects of User Engagement on Clinical Outcomes
In diabetes treatment, strict glycemic control can have an effect on
preventing the
development of microvascular complications as well as on the development and
progression of long-term macrovascular complications.
Therefore, being aware of glycemic variability in everyday life facilitates
high-
quality self-management and helps the patient aim toward stricter glycemic
control. Self-
CA 03179837 2022- 11- 22
WO 2021/237225
PCT/US2021/033947
49
monitoring of blood glucose (SMBG) by finger-stick measurement is the most
common
monitoring method, and the Japanese Clinical Practice Guideline for Diabetes
2019
states that SMBG is effective in glycemic control in patients with type 1
diabetes and
insulin-treated patients with type 2 diabetes and recommends it as Grade A.
Although
the recommended timing and frequency of SMBG depend on the disease type and
treatment goals, the American Diabetes Association (ADA) requires testing 6-10
times
daily, although individual needs may vary, for patients using intensive
insulin regimens.
Further, with SMBG it can be difficult to detect nocturnal/early morning
hypoglycemia
or hyperglycemia immediately after meals and impossible to monitor glucose
fluctuations.
Continuous glucose monitoring (CGM), as disclosed in embodiments of the
disclosed subject matter, which periodically displays data (e.g., every 1-5
minutes), was
shown to significantly reduce HbAlc levels compared with SMBG in a systematic
review and meta-analysis. According to embodiments disclosed herein, the CGM
can be
a CGM with 10, 14, 21, or 30 day wear. In some embodiments, the CGM can be a
14-
day in-vivo CGM, for example, not limitation, a CGM using a redox mediator and
flux
limiting membrane as described in US6,605,200, US6,932,894, US8,280,474. This
is
one way to describe Libre without mentioning it by name.
According to a report by Bailey et al., The Performance and Usability of a
Factory-Calibrated Flash Glucose Monitoring System, Diabetes Tech. Ther.,
2015,
17(11): p. 787-794 which is herein incorporated by reference in its entirety,
the mean
absolute relative difference (MARD) can be 11.4% for flash glucose monitoring
sensor
glucose levels against capillary blood glucose reference values, with accuracy
remaining
stable over 14 days of wear and unaffected by patient characteristics such as
body mass
index (BMI), age, clinical site, insulin administration, or HbAlc. Other
studies
comparing flash glucose monitoring with different methods (arterial blood
glucose,
venous Yellow Springs Instrument (YSI) reference, laboratory random blood
sugar)
reported MARD within the range of 9.56-15.4%, and this accuracy was considered
clinically acceptable.
In one exemplary embodiment, thirteen clinical studies investigating the
efficacy
of flash glucose monitoring and discussed in this exemplary embodiment are
summarized in FIGS. 23A-23B. Each of these clinical studies is herein
incorporated by
reference in its entirety.
CA 03179837 2022- 11- 22
WO 2021/237225 PCT/US2021/033947
SHIFT, by Ogawa et al., Effect of the FreeStyle Libre Tm Flash Glucose
Monitoring System on Glycemic Control in Subjects with Type 2 Diabetes Treated
with
Basal-Bolus Insulin Therapy: An Open Label, Prospective, Multicenter Trial in
Japan, J.
Diabetes Investigation, 2021, 12(1): p. 82-90, which is herein incorporated by
reference
5 in its entirety, was a multicenter, single-arm, prospective study to
evaluate the effect of
flash glucose monitoring on glycemic control in 94 Japanese patients with type
2
diabetes treated with basal-bolus insulin therapy, in which a 2-week baseline
phase was
followed by an 11-week flash glucose monitoring intervention. One endpoint was
the
change from baseline of time in hypoglycemia at 2.5 months. Other studies in
Japanese
10 patients include a randomized controlled trial (RCT) by Wada et al.,
Flash glucose
monitoring helps achieve better glycemic control than conventional self-
monitoring of
blood glucose in non-insulin-treated type 2 diabetes: a randomized controlled
trial, BMJ
Open Diabetes Res. Care, 2020, 8(1), which is herein incorporated by reference
in its
entirety ,that compared the effects of flash glucose monitoring and SMBG on
glycemic
15 control in 100 patients with non-insulin-treated type 2 diabetes and an
observational
study by Ida et al., Effects of Flash Glucose Monitoring on Dietary Variety,
Physical
Activity, and Self-Care Behaviors in Patients with Diabetes, J. Diabetes Res.,
2020,
which is herein incorporated by reference in its entirety that evaluated the
effects of flash
glucose monitoring on dietary variety, physical activity, and self-care
behavior in 90
20 patients with type 1 and type 2 diabetes.
IMPACT, a study by Bolinder et al., Novel glucose-sensing technology and
hypoglycaemia in type I diabetes: a multicentre, non-masked, randomised
controlled
trial, Lancet, 2016, 388(10057): p. 2254-63, which is herein incorporated by
reference in
its entirety,was a non-masked RCT in patients with type 1 diabetes, in which
239 type 1
25 diabetes patients with HbAl c < 7.5% from 23 European centers were
enrolled and
randomly assigned to the flash glucose monitoring group and the SMBG group in
a 1:1
ratio. With an outcome of change in time in hypoglycemia from baseline to 6
months, the
trial compared the effectiveness of flash glucose monitoring for glycemic
control with
that of SMBG.
30 In the REPLACE study, by Haak et al, Use of Flash Glucose-Sensing
Technology for 12 months as a Replacement for Blood Glucose Monitoring in
Insulin-
treated Type 2 Diabetes, Diabeter Therapy, 2017, 8(3): p. 573-586, which is
herein
incorporated by reference in its entirety, an open-label RCT in patients with
type 2
CA 03179837 2022- 11- 22
WO 2021/237225 PCT/US2021/033947
51
diabetes, 224 type 2 diabetes patients with HbAlc between 7.5 and 12.0% from
26
European centers were enrolled and randomly assigned to the flash glucose
monitoring
group and the SMBG group in a 2:1 ratio. One outcome was change in HbAl c from
baseline to 6 months. Then, 139 flash glucose monitoring patients who
completed the 6-
month treatment phase of this study continued into an additional 6-month
prospective
observational study (open-access phase). In both RCTs, participants had a
review of
their glycemic control during their visits.
Kroger et al., Three European Retrospective Real-World Chart Review Studies to
Determine the Effectiveness of Flash Glucose Monitoring on HbAl c in Adults
with
Type 2, Diabetes Therapy, 2020, 11: p. 279-291, which is herein incorporated
by
reference in its entirety reported a retrospective chart review of patients
with type 2
diabetes using flash glucose monitoring in 18 centers in France, Austria, and
Germany.
The 363 patients included in the review had switched from SMBG to flash
glucose
monitoring at least 3 months before the start of the study and had a baseline
HbAlc
(measurement within 3 months prior to starting flash glucose monitoring use)
between
8.0 and 12.0%. One outcome was change in HbAlc from baseline at 3-6 months
after
starting flash glucose monitoring use.
An open-label RCT reported by Yaron et al., Effect of Flash Glucose Monitoring
Technology on Glycemic Control and Treatment Satisfaction in Patients With
Type 2
Diabetes, Diabetes Care, 2019, 42(7), which is herein incorporated by
reference in its
entirety, was conducted in 101 patients with type 2 diabetes (baseline HbAl c
7.5-10.0%)
from 2 centers in Israel. Patients were randomly assigned to the flash glucose
monitoring
group and the SMBG group in a 1:1 ratio and treated for 10 weeks. Patients in
the flash
glucose monitoring group were instructed to perform a scan at least every 8
hours, and
all patients were frequently instructed to adjust their insulin doses. One
outcome was
satisfaction with treatment; other measures including quality of life (QOL),
HbAl c,
comfort using flash glucose monitoring, and frequency of hypoglycemic events
were
also evaluated.
Evans et al., The Impact of Flash Glucose Monitoring on Glycaemic Control as
Measured by HbAlc: A Meta-analysis of Clinical Trials and Real-World
Observational
Studies, Diabetes Therapy, 2020, 11(1): p. 83-95, which is herein incorporated
by
reference in its entirety, reported a meta-analysis of 25 studies (n ¨ 1,723)
that reported
change in HbAl c in adult and pediatric patients with type 1 or type 2
diabetes using flash
CA 03179837 2022- 11- 22
WO 2021/237225 PCT/US2021/033947
52
glucose monitoring. A meta-analysis was performed using a random effects model
on the
21 studies where HbAlc levels at baseline and 2-4 months after starting flash
glucose
monitoring use were available, and random effects meta-regression of change in
HbAlc
was performed versus baseline HbAlc. In addition, a longitudinal analysis was
performed in 1,276 adult patients with type 1 and type 2 diabetes whose HbAlc
was
continuously measured 1-12 months after starting flash glucose monitoring use.
FLARE-NL4, by Fokkert et al, Improved well-being and decreased disease
burden after I-year use offlash glucose monitoring (FLARE-NL4), BMJ Open
Diabetes
Research & Care, 2020, 7(1), which is herein incorporated by reference in its
entirety,
was a 1-year prospective registry study that included 1,277 patients with type
1 and type
2 diabetes using flash glucose monitoring in the Netherlands. One endpoint was
change
in HbAl c; other endpoints evaluated included frequency and severity of
hypoglycemia,
health-related QOL, and disease burden including hospital admission and work
absenteeism.
Dunn et al., Real-world flash glucose monitoring patterns and associations
between self-monitoring frequency and glycaemic measures: A European analysis
of
over 60 million glucose tests, Diabetes Res. & Clinical Practice, 2017, 137:
p. 37-46,
which is herein incorporated by reference in its entirety, analyzed real-world
data of
flash glucose monitoring use from 50,831 readers in Europe stored in a cloud
database
between September 2014 and May 2016. Patients were grouped by scan frequency,
and
the relationship between scan frequency and estimated HbAlc (eAlc) was
evaluated.
Other studies that used real-world data include a report investigating the
relationship
between scan frequency and CGM measures in clinical practice in Spain, and a
report
investigating the use of flash glucose monitoring in Brazil.
The HbAl c test can be used for the diagnosis and management of diabetes.
Although HbAl c does not detect glucose variability or hypoglycemic events, it
is known
to reflect the average blood glucose levels over the previous 2 to 3 months,
and equations
have been described to calculate the estimated average glucose levels from the
HbAlc
levels or the eAlc from the average glucose levels. In addition, HbAl c
correlates with
the risk of long-term diabetes complications and is considered a reliable
biomarker for
diagnosing and evaluating the long-term prognosis of diabetes.
IMPACT and REPLACE did not show a significant difference in the mean
change in HbAl c from baseline between the flash glucose monitoring group and
the
CA 03179837 2022- 11- 22
WO 2021/237225 PCT/US2021/033947
53
SMBG group at 6 months after the start of the study (IMPACT, difference in
mean
HbAl c between the 2 groups at 6 months after the start of the study: 0.00, p
= 0.9556;
REPLACE, change in HbAlc at 6 months after the start of the study, SMBG group:
¨0.31, flash glucose monitoring group: ¨0.29, p = 0.8222).
In FIG. 23C, as observed by Yaron et al.'s RCT, the mean change (standard
deviation [SD]) in HbAl c from baseline at 10 weeks after the start of the
study was
significantly lower at ¨0.82 (0.84)% in the flash glucose monitoring group
compared
with ¨0.33 (0.78)% in the SMBG group (p = 0.005). In a non-prespecified post
hoc
analysis, the proportion of patients whose HbAl c was reduced by > 0.5% was
68.6% in
the flash glucose monitoring group compared with 30.2% in the SMBG group,
showing a
significant difference (p < 0.001); a significant difference was similarly
seen in the
proportion of patients whose HbAl c was reduced by > 1% (SMBG group: 18.6%,
flash
glucose monitoring group: 39.2%, p = 0.0023).
As illustrated in FIG. 23D, in Kroger et al.'s chart review, HbAlc levels
significantly decreased from baseline with the mean (standard error) change of
¨0.9
(0.05)% in patients with type 2 diabetes who used flash glucose monitoring
continuously
for 3-6 months (p <0.0001), and this pattern was consistent across the 3
countries in the
study.
As illustrated in FIG. 23E, Evans et al.'s meta-regression analysis
demonstrated
that the higher the baseline HbAlc, the greater the reduction in HbAl c after
treatment
using flash glucose monitoring. A longitudinal analysis in 1,276 adults showed
that
HbAl c fell markedly within 2 months of starting flash glucose monitoring use
and the
changes were sustained up to 12 months. Although mostly studied in type 1
diabetes
patients, flash glucose monitoring is shown to improve and maintain HbAlc in
many
studies.
In the SHIFT study conducted in Japanese patients, a significant improvement
was observed in eAlc at the end of the study (11 weeks) when compared with
baseline
(-0.39 0.81%, p < 0.0001). According to Ida et al.'s report, no significant
changes in
HbAl c were observed at the end of the study (12 weeks) when compared with
baseline
in patients with type 1 diabetes (7.7 1.2 vs. 7.7 1.3, p = 0.921), but a
significant
improvement was observed in patients with type 2 diabetes (7.4 0.8 vs. 7.7
1.2, p =
0.025). 20). Wada et al. reported that HbAl c was significantly improved
compared with
CA 03179837 2022- 11- 22
WO 2021/237225 PCT/U52021/033947
54
baseline in both the flash glucose monitoring group (-0.43%, p < 0.001) and
the SMBG
group (-0.30%, p = 0.001).
Beyond a change a HbAl c, certain studies analyzed according to this
embodiment also indicate time in hypoglycemia for the subjects studied.
Hypoglycemia
is an emergency that occurs during diabetes treatment, and it has been
suggested that
severe hypoglycemia or hypoglycemia unawareness may become risk factors for
macroangiopathy and dementia. Flash glucose monitoring incorporates an
ambulatory
glucose profile (AGP), and patients can graphically see the trends in their
glucose level
over a day. In addition, sensor glucose levels <70 mg/dL persisting for > 15
minutes are
recorded as hypoglycemic events.
As illustrated in FIG. 23F, in the IMPACT study, conducted in patients with
type
1 diabetes, one outcome of mean time in hypoglycemia (< 70 mg/dL) at 6 months
was
2.03 h/day (-1.39 h/day from baseline) in the flash glucose monitoring group,
which was
38% lower than 3.27 h/day (-0.14 h/day from baseline) in the SMBG group (p <
00001)
In the REPLACE study conducted in patients with type 2 diabetes, although
there
was no difference in at least outcome of change in HbAl c from baseline at 6
months
between the flash glucose monitoring group and the SMBG group, mean time in
hypoglycemia (< 70 mg/dL) at 6 months was reduced by 43% in the flash glucose
monitoring group compared with the SMBG group (p = 0.0006). During the open-
access
extension phase of REPLACE, mean time in hypoglycemia at 12 months was reduced
by
50% compared with baseline for the flash glucose monitoring group (p =
0.0002).
In SHIFT, time in hypoglycemia at the end of the study (11 weeks) was not
significantly different compared with baseline (p = 0.6354), but eAlc was
significantly
decreased (p <0.0001). Overall, it was suggested that the use of flash glucose
monitoring
can improve eAlc without increasing time in hypoglycemia and can improve time
in
range (TIR) and reduce time above range (TAR).
In IMPACT and REPLACE, with target sensor glucose levels of 70-180 mg/dL,
TIR at 6 months was compared between the flash glucose monitoring group and
the
SMBG group. As a result, the IMPACT study in patients with type 1 diabetes
showed a
significant increase in TIR compared with the SMBG group, but the REPLACE
study in
patients with type 2 diabetes did not show a difference in T1R between the
groups (p ¨
0.7925). 21), 22) In the SHIFT study, with a treatment target range of 70-180
mg/dL,
CA 03179837 2022- 11- 22
WO 2021/237225 PCT/US2021/033947
TIR at 11 weeks was 16.7 3.7 h/day (mean SD), showing a significant
improvement
from baseline (15.0 4.0 h/day) (p <0.0001).
Analysis according to the above outlined studies show certain benefits of
flash
glucose monitoring within a clinical setting, specifically, results from
certain RCTs such
5 as IMPACT and REPLACE support the clinical benefits of flash glucose
monitoring in
glycemic control. Here, further studies are reviewed that used real-world data
from
Europe, Spain, and Brazil.
As illustrated in FIG. 23F, the use and clinical benefits of flash glucose
monitoring from the real-world data of 50,831 readers in Europe, users
performed a total
10 of 86.4 million hours of readings, 345.6 million automatically stored
readings, and 63.8
million scans, with a median of 14 scans (interquartile range: 10-20 scans).
FIG. 23G illustrates an analysis wherein the readers were allocated to 20
equally
sized groups by scan frequency, the lowest scan rate group (mean, 4.4
times/day) had an
eAlc of 8.0%, while the highest scan rate group (mean, 48.1 times/day) had an
eAlc of
15 6.7%, showing a reduction in eAlc with increasing number of scans. TIR
(sensor
glucose levels 70-180 mg/dL) significantly increased from 12.0 h/day to 16.8
h/day
when comparing the lowest with the highest scan rate groups (p <0.001). Both
TAR and
TBR significantly decreased in the highest scan rate group compared with the
lowest
scan rate group (p < 0.001 each). These patterns can be consistent across
different
20 countries.
Similar results were obtained from the real-world data of 22,949 readers in
Spain:
eAlc was significantly lower at 6.9% (95% CI: 6.9-7.0%) in the highest scan
rate group
(mean, 39.6 scans/day) compared with 8.0% (95% CI: 8.0-8.1%) in the lowest
scan rate
group (3.9 scans/day; p < 0.001); and Tilt (sensor glucose levels 70-180
mg/dL)
25 significantly increased from 11.5 h/day in the lowest scan rate group to
15.6 h/day in the
highest scan rate group (p <0.001). 29) A real-world data study in Brazil also
showed
that eAlc was significantly lower at 6.71% (95% CI: 6.63-6.80%) in the highest
scan
rate group (mean, 43.1 times/day) compared with 7.56% (95% CI: 7.44-7.68%) in
the
lowest scan rate group (mean, 3.56 times/day; p < 0.01), and TIP. (sensor
glucose levels
30 70-180 mg/dL) increased in the highest rate group compared with the
lowest rate group
(p <0.01).
These results suggest that increased scan frequency with flash glucose
monitoring
can improve glycemic control conditions including HbAl c and CGM metrics.
CA 03179837 2022- 11- 22
WO 2021/237225
PCT/US2021/033947
56
Glycemic control using flash glucose monitoring can reduce the daily burden
for
patients with diabetes by reducing the frequency of SMBG with finger-stick
measurement. As illustrated in FIG. 23H, according to the IMPACT study, the
mean
(SD) number of SMBG tests performed in the flash glucose monitoring group
decreased
from 5.5 (2.0) tests/day at baseline to 0.5 (0.7) tests/day at 6 months. No
change was
seen in the SMBG group, with 5.8 (1.7) tests/day at baseline and 5.6 (2.2)
tests/day at 6
months. Further, as illustrated in FIG. 231, during the 6-month study period
of
REPLACE, the mean (SD) SMBG frequency for the flash glucose monitoring group
also
fell from 3.8 (1.4) tests/day to 0.3 (0.7) tests/day, whereas no change was
seen for the
SMBG group (3.9 [1.5] tests/day to 3.8 [1.9] tests/day). The average scan
frequency
(SD) for the flash glucose monitoring group was 15.1 (6.9) times/day in IMPACT
and
8.3 (4.4) times/day in REPLACE, and the flash glucose monitoring group tended
to
perform more frequent monitoring than the SMBG group. REPLACE showed no
significant difference in the number of scans performed by those <65 years and
> 65
years of age
Patient reported outcome measures (PROMs), which contain both QOL and
treatment satisfaction, are also a common metric and the goals of diabetes
treatment
include maintaining the same everyday QOL as healthy people and improvements
of
treatment satisfaction. One of the typical measures used to assess QOL in the
treatment
of diabetes is the Diabetes Quality of Life (DQoL) Questionnaire, which was
developed
by the Diabetes Control and Complications Trial (DCCT) Research Group, can
assess
the impact of disease on the lifestyle and daily lives of patients with
insulin-dependent
diabetes mellitus.
Diabetes Treatment Satisfaction Questionnaire (DTSQ) was developed in the UK
and can be used globally as a tool to quantify treatment satisfaction. It can
be applied to
all patients with diabetes and is useful for comparison between treatments.
The DTSQ
change version (DTSQc), which can be used to assess changes in satisfaction
pre- and
post-intervention, has also been developed.
In IMPACT and REPLACE, the DTSQ score was improved significantly in the
flash glucose monitoring group compared with the SMBG group (both p <0.0001);
however, there was no difference in the DQoL score between the groups in
EVIPACT.
Yaron et al.'s RCT showed significant differences between the SMBG and flash
glucose
monitoring groups in the DTSQc score items flexibility of treatment and
willingness to
CA 03179837 2022- 11- 22
WO 2021/237225 PCT/U52021/033947
57
recommend treatment to someone else (p = 0.019, 0.023). A 1-year registry
study,
FLARE-NL4, used non-diabetes-specific QOL measures; the 12-Item Short Form
Health
Surveyv2 (SF-12v2) mental component summary score of QOL and the 3-level
version
of EuroQol (EQ-5D-3L) showed significant improvement from baseline to the end
of the
study (95% CIs for each difference: 2.1-4.4, 0.01-0.05), whereas the SF-12v2
physical
component summary score of QOL showed no significant change. The percentage of
patients with diabetes-related hospital admissions in the past 12 months
decreased
significantly from 13.7% at baseline to 4.7% (p < 0.01), and the work
absenteeism rate in
the past 6 months also decreased significantly from 18.5% to 7.7% (p < 0.05)
(Table 3).
27)
In SHIFT, scores for the DTSQ, including treatment satisfaction, significantly
improved from baseline to the end of the study (p < 0.0001), and participants'
perception
of episodes of hypoglycemia and hyperglycemia also significantly improved (p =
0.0062
and p = 0.0310, respectively).
Overall, although different PROMs were used, flash glucose monitoring use was
shown to have favorable effects on patient QOL and treatment satisfaction.
Beyond the different objective analysis outline above, safety related to
actual
device use is also a factor in technique uptake and effectiveness of
treatment. The most
common device-related adverse events on flash glucose monitoring include
sensor
insertion site reactions (e.g., pain, hemorrhage, swelling, induration,
bruise) and sensor-
wear reactions (e.g., erythema, itching, rash). In IMPACT, 13 device-related
adverse
events were reported by 10 participants in the flash glucose monitoring group,
including
4 events each of allergic reaction and insertion site reaction, 2 events of
erythema, and 1
event each of itching, rash, and edema. In addition, 248 sensor insertion/wear-
related
findings or symptoms were observed in 65 participants in both groups. Seven
participants discontinued the study due to device-related adverse events or
repetitive
occurrences of sensor insertion-related symptoms. During the 6-month treatment
phase
of REPLACE, 6 participants in the flash glucose monitoring group reported 9
sensor-
wear reactions as device-related adverse events, all of which were resolved at
the end of
the study. In addition, 50 participants from both groups reported 158 symptoms
associated with sensor insertion/wear or finger-stick measurement, and 63% of
these
symptoms were due to the sensor adhesive. These symptoms resolved without
medical
intervention. In SHIFT, a total of 273 adverse events were experienced by 60
of 94
CA 03179837 2022- 11- 22
WO 2021/237225
PCT/U52021/033947
58
participants (63.8%), including serious adverse events reported for 5
participants. Of
these, 257 adverse events were related to symptomatic hypoglycemia. No
episodes of
diabetic ketoacidosis (DKA) or hyperosmolar hyperglycemic state (HHS) were
reported.
Serious acute complications of diabetes can also occur, including DKA and
FIRS,
but there were no reported events of DKA or HHS in IMPACT, REPLACE, or SHIFT.
As discussed above, information displayed on the flash glucose monitoring
reader
includes the glucose level trend arrow, which indicates the direction and
velocity of
changing glucose levels over the previous 15 minutes; it is expected that
determination
of the timing and the dose of insulin based on this information will lead to
prevention of
acute complications.
At the American Diabetes Association's 80th Scientific Sessions held in June
2020 (ADA 2020), results were reported from a large clinical trial in patients
with type 1
and type 2 diabetes on intensive insulin therapy in countries including the
US, Sweden,
and France, showing in particular an improvement in rates of acute diabetes
events and
hospitalizations.
Clinical studies of flash glucose monitoring reviewed in this embodiment
investigated the efficacy of flash glucose monitoring in glycemic control of
insulin-
treated diabetic patients using various outcome measures including change in
HbAl c,
time in hypoglycemia, and PROMs. IMPACT and REPLACE showed a significant
decrease in time in hypoglycemia, but did not show any significant changes in
HbAl c.
On the other hand, Yaron et al.'s RCT and Kroger et al.'s chart review
demonstrated a
significant reduction in HbAl c; the SHIFT study, which was conducted in
Japanese
patients, demonstrated a significant reduction in eAlc, although no
significant change
was observed in time in hypoglycemia.
A report from the Committee on a Survey of Severe Hypoglycemia in the Japan
Diabetes Society indicates that as long as HbAlc is not extremely low,
hypoglycemia is
inversely correlated with HbAl c; therefore, the fact that either the decrease
in time in
hypoglycemia or the reduction in HbAl c was significant suggests that flash
glucose
monitoring has generally contributed to the stabilization of glucose control.
Baseline
characteristics and number of scans can affect the efficacy of flash glucose
monitoring.
Discussions are needed in the future on creating standard protocols in order
to increase
the clinical efficacy of flash glucose monitoring.
CA 03179837 2022- 11- 22
WO 2021/237225 PCT/US2021/033947
59
With regard to the assessment of QOL, in Yaron et al.'s RCT with an outcome
measure of DTSQ, although there was no significant improvement in the overall
DTSQc
score, significant improvement was seen in scores for the items flexibility of
treatment
and willingness to recommend treatment to someone else for the flash glucose
monitoring group compared with the SMBG group. Although the DTSQ score was not
the primary outcome measure for IMPACT and REPLACE, it improved significantly
in
the flash glucose monitoring group compared with the SMBG group. These results
suggest that the use of flash glucose monitoring may contribute more to the
improvement
of QOL in diabetes treatment than SMBG.
Reduction in Acute Diabetic Events and All-Cause Hospitalizations
Hospitalizations and unplanned readmissions are prevalent among individuals
with type 2 diabetes, who account for 90% to 95% of all diabetes cases. Adults
with type
2 diabetes can be hospitalized and readmitted for numerous health conditions.
Among
these conditions, emergency department utilizations and hospitalizations for
severe
hyperglycemia and hypoglycemia can be common and associated with high
readmission
rates, particularly among patients with large fluctuations in glycated
hemoglobin
(HbAlc) and very high or very low average HbAl c levels.
According to an embodiment, a continuous glucose monitor regimen as described
herein can be used to reduce the rate of hospitalization in select type 2
diabetic patients.
The examples provided below further demonstrate benefits of methods and
systems as
described herein.
Example
In accordance with an embodiment as described herein, the effects of
continuous
glucose analyte monitoring system regimen on inpatient and emergency
outpatient acute
diabetes-related event (ADE) and all-cause hospitalization (ACH) rates, in a
large
population of patients with type 2 diabetes who were treated with basal-bolus
insulin
therapy was studied. Additional details of this embodiment are disclosed in
Flash CGIII
Is Associated With Reduced Diabetes Events and Hospitalizations in Insulin-
Treated
Type 2 Diabetes, which was originally published in the Journal of the
Endocrine Society,
Volume 5, Issue 4, Pages 1-9, 2021, Oxford University Press and can be
accessed at the
web site https://academic.oup.corn/jes/article/5/4/bvab013/6126709, and is
incorporated
by reference herein in its entirety.
CA 03179837 2022- 11- 22
WO 2021/237225
PCT/US2021/033947
Patient data can be obtained, for example, from the IBM Watson Health
MarketScan Commercial Claims and Medicare Supplemental databases, which
capture
paid and adjudicated billing claims from inpatient hospital stays, outpatient
encounters,
and pharmacy prescriptions for privately insured and Medicare Supplemental
patients
5 throughout the United States. This nationally-representative database can
be used to
support publications in the field of diabetes research.
Patients can be included if they had a diagnosis of type 2 diabetes, were >18
years old, received a prescription for short- or rapid-acting insulin, were
naïve to CGM,
and acquired either the 10-day or 14-day sensor system between November 2017
and
10 September 2018. In addition, patients were continuously enrolled in the
inpatient,
outpatient, and pharmacy databases for at least 6 months prior to system
regimen. In
total, a cohort of 2,463 type 2 diabetes patients was identified for
assessment. Most
patients were over the age of 50. The majority of patients had hypertension
and
dyslipidemia, and over half were obese. Patient characteristics are presented
in FIG.
15 12A
Diabetes type can be determined from the closest relevant diagnosis claim
prior
to flash CGM regimen, as shown in FIG. 12F. In exemplary cases wherein the
closest
claim had billing codes related to both type 1 and type 2 diabetes, the
patient was not
included. In addition, patients with a gestational diabetes diagnosis in the
six months
20 prior to flash CGM regimen were excluded.
International Classification of Diseases, 9th and 10th Revision (ICD-10) codes
were used to identify patients with diagnosed type 2 diabetes. ICD-9 and ICD-
10 codes
were used to identify prevalence of co-morbidities within the study cohort, as
shown in
FIGS. 12G-12L. As embodied herein, existence of a comorbidity was defined by
the
25 presence of a related diagnosis code in either inpatient or outpatient
claims at any time
from beginning of each patient's data availability through the day of flash
CGM
regimen. Within the identified population, National Drug Code (NDC) data can
be used
to identify patients who acquired a flash CGM system during the required
observation
period. Patients who were treated with basal-bolus insulin therapy can be
identified, for
30 example, by short- or rapid-acting insulin regimen in the NDC data
within 6-months
prior to system regimen, as shown in FIGS. 12M-12P. Basal insulin was not
specifically
identified because patients with a record of short- or rapid-acting insulin
regimen were
likely treated with basal-bolus therapy.
CA 03179837 2022- 11- 22
WO 2021/237225 PCT/US2021/033947
61
To ensure that patients were naive to CGM, patients with evidence of prior CGM
purchase can be excluded, for example, by identifying users with sensor,
transmitter, or
receiver according to either NDC codes or Healthcare Common Procedure Coding
System (HCPCS) codes, which are illustrated in FIGS. 12M-12P.
One outcome measure was change in ADE during the 6 months following system
regimen compared with 6 months prior to use. Acute events included:
hypoglycemia,
hypoglycemic coma, clinical hyperglycemia, diabetic ketoacidosis (DKA), and
hyperosmolarity. These were identified as either inpatient events with the
associated
ICD-10 code as a diagnosis code or emergency outpatient events, which included
emergency department services, urgent care, or ambulance services with the
associated
ICD-10 code in any position. For each patient, medical billing codes
associated with the
same service or admit date were counted as a single event, as illustrated in
FIGS. 12M-
12P. The change in ACH rates was assessed as a secondary outcome.
In this exemplary embodiment, the analysis can be structured as patient-as-own-
control Rates for all primary and secondary measures were calculated in the 6-
month
windows pre- and post-system purchase but are reported in units of events per
patient
year (ev/pt-yr). Rates can be adjusted for variable follow-up after system
purchase. In
this example, cumulative events figures are based on Nelson-Aalen estimator,
though the
use of other estimators known in the art is contemplated. Hazard ratios, 95%
confidence
bounds, and p-values can be based on Cox regression with Andersen-Gill
extension for
repeated events. All p-values are reported without correction for multiple
comparisons.
RStudio version 1Ø153 (Boston, MA, USA) with R version 3.4.0 was used in
this
example for statistical analysis.
Reductions in ACH can also be observed, from 0.420 to 0.283 events/patient-
year
(FIR: 0.67 [0.58, 0.771; P<0.001), as shown in FIG. 12B. As illustrated in
FIG. 12C, the
number of ADE, ACH, and patients experiencing these events dropped during the
6-
month post-regimen period. Circulatory system disorders can be a cause of ACH
after
flash CGM regimen. However, Endocrine, Nutritional and Metabolic system
disorders,
which a category related to diabetes, fell from the second to fifth most
common major
diagnostic category. Substantial decreases in infectious and parasitic
diseases,
respiratory system events, and kidney and urinary tract conditions were also
observed.
As embodied herein, a notable reduction in ADE and ACH within the first 45
days of the flash CGM post-regimen period was found. Results from the current
analysis
CA 03179837 2022- 11- 22
WO 2021/237225
PCT/US2021/033947
62
showed an association between a regimen of flash CGM and reductions in ADE
requiring emergency outpatient/inpatient hospital services and all-cause
events requiring
inpatient hospitalization. During the six-month assessment period, a reduction
in ADE
from 0.180 to 0.072 events/patient-year (HR: 0.40 [0.31, 0.51]; P<0.001) can
be
observed, as illustrated in FIG. 12B. Illustrated in FIG. 12C, the change in
the number of
events per patient, particularly in ADE, suggests a corresponding reduction in
readmissions. Moreover, although the rate of hypoglycemic ADE was extremely
low
prior to the flash CGM regimen, the reduction in hyperglycemic ADE with
reductions in
hypoglycemia is a strong indicator of overall improved glycemic control. Both
of these
findings hold clinical and financial implications. For example, extreme
hyperglycemia at
hospital admission can be a predictor of poor clinical outcomes for coronary
artery
bypass graft and ischemic stroke. Each hypoglycemic event is statistically
significant
(p<0.001) associated with increased risk for poor cardiovascular outcomes and
all-cause
mortality.
As illustrated in FTC 12D, risk reductions can be significant regardless of
gender
or age, but most notable among female patients (RR 0.31 [0.21 0.45], p <
0.001) and
patients age >50 years (HR 0.35 [0.26 0.49], p < 0.001).
Because surveillance of hypoglycemia in the United States can rely on data
from
electronic health records (EHR) or administrative claims from hospital
admissions and
emergency department utilization, the actual incidence of severe hypoglycemia
may be
substantially underreported. In a recent survey of 13,359 individuals with
diabetes who
were treated with glucose-lowering medications, 11.7% reported having one or
more
severe hypoglycemic events requiring third-party assistance in the previous 12
months;
however, 0.8% had a documented hypoglycemia-related emergency department or
hospital utilization during the same time period.
Apart from acute clinical outcomes, episodes of severe hypoglycemia can impact
patient adherence to therapy, which can lead to poor glycemic control and
increased risk
of long-term complications. An international survey of 27,585 diabetes
patients found
that 25.8% to 46.7% of people with type 2 diabetes reduced their insulin
dosages in
response to hypoglycemia.
Results also highlight a desire to reduce hyperglycemia without increasing the
incidence and severity of hypoglycemia. Although recent data show similar
rates for
hypoglycemic- and hyperglycemic ADE in the general diabetes population (8.8
vs. 9.7
CA 03179837 2022- 11- 22
WO 2021/237225 PCT/US2021/033947
63
per/1,000 patients, respectively), the substantially larger number of
hyperglycemic vs.
hypoglycemic ADE prior to flash CGM regimen suggests that many study patients
historically maintained elevated glucose levels.
As shown in FIG. 12E, notable decreases in hospitalizations for selected
predetermined comorbidities are provided by a CGM regimen in accordance with
the
disclosed subject matter. For example, hospitalization decreased more than
expected for
infections (41.7%), renal disease (48.5%) and liver disease (41.7). In an
embodiment, as
can be in seen in FIG. 12E, the overall (or "baseline") rate of
hospitalizations among all
type 2 diabetic patients on basal-bolus therapy irrespective in, for example,
the infectious
and parasitic disease major diagnostic category (MDC), for six months prior to
initiation
of continuous glucose monitor regimen was 4.8 events per 100 patient-years and
2.8
events per 100 patient-years for six months after initiation of continuous
glucose monitor
regime. Accordingly, the rate of hospitalization for infectious and parasitic
diseases in
type 2 diabetic patients on basal-bolus therapy with continuous glucose
monitor regimen
after six months unexpectedly reduced by approximately 41.67% relative to an
average
rate of hospitalization for infectious and parasitic diseases of type 2
diabetic patients on
basal bolus therapy without continuous glucose monitor regimen.
One advantage of analysis according to this subject matter is use of claims
data
from a large dataset, which can provide reliable information about flash CGM
system
regimen over time in 2,463 patients with insulin-treated type 2 diabetes.
Similarly,
assessments of complications and utilization of healthcare resources (e.g.,
emergency
room visits, inpatient hospitalizations) based on ICD-10 codes allows accurate
quantification of actual events and utilization without reliance on patient-
reported data.
Other exemplary embodiments show reductions in time spent with glucose levels
<70 mg/dL (<3.9 mmol/L) among flash CGM users compared with controls.
These exemplary findings provide support for the potential of using flash CGM
in insulin-treated type 2 diabetes to both improve clinical outcomes and
reduce the
financial costs associated with hospitalizations and emergency department
utilization due
to ADE. Moreover, wider use of flash CGM can address the changing trends of
increasing all-cause hospitalizations among younger and middle-age adults and
the
newly emerging trends of increased mortality due to infections, respiratory
illness and
renal and hepatic complications.
Example 2
CA 03179837 2022- 11- 22
WO 2021/237225
PCT/US2021/033947
64
In accordance with an embodiment as described herein, the effects of a flash
CGM system regimen on inpatient and emergency outpatient acute diabetes-
related event
(ADE) and all-cause hospitalization (ACH) rates, in a large population of
patients with
type 2 diabetes who were treated with non-MDI therapy were examined.
Patient data can be obtained from the IBM MarketScanTM administrative claims
database, which captures paid and adjudicated billing claims from inpatient
hospital
stays, outpatient encounters, and pharmacy prescriptions for over 30 million
privately
insured and Medicare Supplemental patients throughout the United States. This
nationally-representative database has been used to support publications in
the field of
diabetes research. The database allows for longitudinal patient follow-up, but
patients
can be lost to follow-up for a variety of reasons including switching
employers,
switching insurance, losing a job, or death. The dataset does not need to
contain
information on why a patient is no longer under observation.
Patients were included who had a diagnosis of T2D, age >18 years, were naive
to
continuous glucose monitoring, and who acquired their flash CGM system during
the
period between October 2017 and March 2019. To select patients on non-MIDI
insulin or
non-insulin therapy, the cohort was further limited to those without a
purchase of short-
or rapid-acting insulin in the 6 months prior to flash CGM regimen. Patients
without
observed diabetes medications can be included in the non-insulin therapy
subgroup.
Patients were excluded if they did not have at least 6 months of database
enrollment prior
to the flash CGM system purchase or had gestational diabetes in the same time
frame.
Using the above outline criteria, a cohort of 10,282 adult T2D patients were
identified
for assessment. In this exemplary embodiment, the majority of patients were
under age
65, had hypertension, and over half were obese. Patient characteristics are
illustrated in
FIG. 13A.
International Classification of Diseases, 9th and 10th Revision (ICD-10) codes
can be used to identify patients with diagnosed T2D. In the rare case the
closest claim
had billing codes related to both T1D and T2D, the patient was not included.
ICD-9 and
ICD-10 codes were also used to identify prevalence of co-morbidities within
the study
cohort.
Within the selected population, National Drug Code (NDC) data can be used to
identify patients who acquired a flash CGM system and to exclude patients who
were
treated with short- or rapid-acting insulin therapy within 6-months prior to
system
CA 03179837 2022- 11- 22
WO 2021/237225 PCT/US2021/033947
regimen. Patients with evidence of prior CGM purchase, including sensor,
transmitter, or
receiver, were excluded. NDC code sets compiled through medical expert review
were
also used to estimate non-insulin diabetes medication usage in the same time
window.
One outcome measure was change in ADE during the 6 months following CMG
5 regimen compared with 6 months prior to use. Acute events can include:
hypoglycemia,
hypoglycemic coma, clinical hyperglycemia, diabetic ketoacidosis (DKA), and
hyperosmolarity. These were identified as either inpatient events with the
associated
ICD-10 code as a diagnosis code or emergency outpatient events, which included
emergency department services, urgent care, or ambulance services with the
associated
10 ICD-10 code in any position. For each patient, medical billing codes
associated with the
same service or admit date were counted as a single event. The change in ACH
rates was
assessed as a secondary outcome. Event rates were calculated by dividing the
number of
observed events by the total observation time.
In this exemplary embodiment, the analysis was structured as patient-as-own-
15 control Rates for all primary and secondary measures were calculated in
the 6-month
windows pre- and post-system purchase but are reported in units of events per
patient
year (ev/pt-yr). Rates adjust for variable follow-up after system purchase.
Cumulative
events figures are based on the Nelson-Aalen estimator. All hazard ratios, 95%
confidence bounds, and p-values are based on weighted Cox regression with
Andersen-
20 Gill extension for repeated events, adjusted for all comorbidities and
insulin usage status
listed in FIG. 13A. Weighted Cox regression is used to account for non-
proportionality
of hazards, as tested via Schoenfeld residuals. All p-values are reported
without
correction for multiple comparisons. RStudio version 1Ø153 (Boston, MA, USA)
with
R version 3.4.0 was used for statistical analysis.
25 Results from the analysis showed an association between flash CGM
regimen and
reductions in acute diabetes-related events requiring emergency
outpatient/inpatient
hospital services and all-cause events requiring inpatient hospitalization.
These results
are particularly noteworthy given that patients treated with non-MDI therapies
tend to
have lower rates of microvascular and macrovascular complications than
patients treated
30 with intensive insulin therapy.
As illustrated in FIG. 13D, during the post-CGM regimen period (171 days
average follow-up) the rate of ADE decreased from 0.076 to 0.052 events/pt-yr
(HR:
CA 03179837 2022- 11- 22
WO 2021/237225 PCT/US2021/033947
66
0.68 10.58 0.80]; P<0.001). As illustrated in FIG. 13D, ACH decreased from
0.177 to
0.151 events/pt-yr (HR: 0.85 [0.77 0.94]; P=0.002).
The majority of ADEs were outpatient emergency events as shown in FIG. 13B.
In addition, an examination of the unique patients impacted by these events
indicates that
repeated events need not dominate. In this exemplary embodiment, less than
0.7% of
patients experienced more than one acute diabetes event in a given pre- or
post-CGM
regimen period.
A further exploratory analysis of all-cause inpatient hospitalizations
subdivided
by major diagnostic category (MDC) is presented in descending order of
frequency in
FIG. 13C. There are small decreases in the rates of circulatory system,
nervous system,
infectious disease, and kidney/urinary tract hospitalizations. The biggest
drop is in the
endocrine, nutritional, and metabolic system category (MDC 10), the one most
closely
associated with diabetes. Surgical procedures for obesity increased from <11
to 22
events.
As shown in FTC 13C, notable decreases in hospitalizations for selected
predetermined comorbidities are provided by a CGM regimen in accordance with
the
disclosed subject matter, for example, hospitalizations decreased more than
expected for
infections (33.33%) and renal disease (30.8%). In an embodiment, as can be
seen in FIG.
13C, the overall (or "baseline") rate of hospitalizations among all type 2
diabetic patients
on non-MIDI therapy in, for example, the infectious and parasitic disease
major
diagnostic category, for six months prior to initiation of continuous glucose
monitor
regimen is 1.8 events per 100 patient-years and 1.2 events per 100 patient-
years for six
months after initiation of continuous glucose monitor regimen. Accordingly,
the rate of
hospitalization for infectious and parasitic diseases in type 2 diabetic
patients on non-
MDI therapy after six months is reduced by approximately 33.33% relative to an
average
rate of hospitalization for infectious and parasitic diseases of type 2
diabetic patients on
non-MDI therapy without CGM regimen.
Further analyses by gender, age, and insulin usage show a reduction in ADEs
across all sub-groups, as shown in FIG. 13E. Interaction terms with treatment
were not
significant for all three sub-groups. Baseline rates of ADEs trended higher
for both
patients under 50 years old and insulin users.
Acute diabetes events and hospitalizations can be reduced according to the
disclosed subject matter. According to the Centers for Disease Control and
Prevention
CA 03179837 2022- 11- 22
WO 2021/237225
PCT/US2021/033947
67
(CDC), approximately 460,000 emergency department visits for hyperglycemic
crises
(n=224,000) and severe hypoglycemia (n=235,000) were reported in 2016. One
advantage of analysis according to the present subject matter is use of claims
data from a
large dataset, which included 10,282 T2D patients treated with non-MIDI
insulin and
non-insulin therapy. Moreover, the dataset provided reliable information about
flash
CGM system regimen over time with 4,817 years of patient follow-up post-flash
CGM
system regimen. Use of ICD-10 codes allowed accurate quantification of
complications
and utilization of healthcare resources (e.g., emergency room visits,
inpatient
hospitalizations) without reliance on patient-reported data.
Example 3
In accordance with embodiments disclosed here, a method of treatment of type 2
diabetic patient can include selecting a type 2 diabetic patient having a
predetermined
comorbidity for treatment, initiating a continuous glucose monitor regimen for
the
selected type 2 diabetic patient, wherein after six months of initiation of
the continuous
glucose monitor regimen, a rate of hospitalization for a predetermined
diagnostic
category of the selected patient having the predetermined comorbidity can be
unexpectedly reduced by at least 12% relative to an average rate of
hospitalization for
the predetermined diagnostic category of selected patients having the
predetermined
comorbidity without the continuous glucose monitor regimen.
For example, as can be seen in FIG. 25D, in the infectious and parasitic
diseases
major diagnostic category, 30 hospitalizations were reported among anemic type
2
diabetic patients on basal-bolus therapy in the six months prior to the CGM
regimen
versus 14 hospitalizations in the six months after CGM regimen. As can be seen
in FIG.
25D, this corresponds to a hospitalization rate, as measured in events per 100
patient-
years, of 9.5 and 4.7, respectively. Accordingly, as can be seen in FIG. 25D,
the rate of
hospitalization for infectious and parasitic diseases of type 2 diabetic
patients on basal-
bolus therapy having anemia with CGM regimen after six months unexpectedly
reduced
by approximately 51% relative to an average rate of hospitalization for
infectious and
parasitic diseases of type 2 diabetic patients on basal-bolus therapy having
anemia but
without CGM regimen.
As can be seen in FIG. 24D, in the infectious and parasitic diseases major
diagnostic category, 51 hospitalizations were reported among anemic type 2
diabetic
patients on non-multiple daily insulin injection (non-MDI) therapy in the six
months
CA 03179837 2022- 11- 22
WO 2021/237225
PCT/US2021/033947
68
prior to CGM regimen versus 25 hospitalizations in the six months after CGM
regimen.
As can be seen in FIG. 24D, this corresponds to a hospitalization rate, as
measured in
events per 100 patient-years, of 5.2 and 2.7, respectively. Accordingly, as
can be seen in
FIG. 24D, the rate of hospitalization for infectious and parasitic diseases of
type 2
diabetic patients on non-MDI therapy having anemia with CGM regimen after six
months is unexpectedly reduced by approximately 48% relative to an average
rate of
hospitalization for infectious and parasitic diseases of patients on non-MDI
therapy
having anemia without CGM regimen.
According to embodiments, the predetermined comorbidity can be anemia. As
embodied herein, the anemic patient can receive basal-bolus insulin therapy.
As can be
seen in FIG. 25D, the predetermined diagnostic category can be infectious and
parasitic
diseases, and the rate of hospitalization for infectious and parasitic
diseases of the
selected patient after six months can be unexpectedly reduced by 51% relative
to an
average rate of hospitalization for infectious and parasitic diseases of
selected patients
having anemia without the continuous glucose monitor regimen As can be seen in
FTC
25E, the predetermined diagnostic category can be respiratory diseases, and
the rate of
hospitalization for respiratory diseases of the selected patient after six
months can be
unexpectedly reduced by 38% relative to an average rate of hospitalization for
respiratory diseases of selected patients having anemia without the continuous
glucose
monitor regimen. As can be seen in FIG. 25E, the predetermined diagnostic
category can
be kidney and urinary tract diseases, and the rate of hospitalization for
kidney and
urinary tract diseases of the selected patient after six months can be
unexpectedly
reduced by 57% relative to an average rate of hospitalization for kidney and
urinary tract
diseases of selected patients having anemia without the continuous glucose
monitor
regimen. As can be seen in FIG. 25G, the predetermined diagnostic category can
be
hepatobiliary and pancreatic diseases, and the rate of hospitalization for
hepatobiliary
and pancreatic diseases of the selected patient after six months can be
unexpectedly
reduced by 55% relative to an average rate of hospitalization for
hepatobiliary and
pancreatic diseases of selected patients having anemia without the continuous
glucose
monitor regimen.
As embodied herein, the anemic patient can be receiving non-multiple daily
insulin injection therapy. As can be seen in FIG. 24D, the predetermined
diagnostic
category is infectious and parasitic diseases, and the rate of hospitalization
for infectious
CA 03179837 2022- 11- 22
WO 2021/237225 PCT/US2021/033947
69
and parasitic diseases of the selected patient after six months can be
unexpectedly
reduced by 48% relative to an average rate of hospitalization for infectious
and parasitic
diseases of selected patients having anemia without the continuous glucose
monitor
regimen. As can be seen in FIG. 24D, the predetermined diagnostic category is
respiratory diseases, and the rate of hospitalization for respiratory diseases
of the selected
patient after six months can be unexpectedly reduced by 59% relative to an
average rate
of hospitalization for respiratory diseases of selected patients having anemia
without the
continuous glucose monitor regimen. As can be seen in FIG. 24E, the
predetermined
diagnostic category is kidney and urinary tract diseases, and the rate of
hospitalization
for kidney and urinary tract diseases of the selected patient after six months
can be
unexpectedly reduced by 51% relative to an average rate of hospitalization for
kidney
and urinary tract diseases of selected patients having anemia without the
continuous
glucose monitor regimen. As can be seen in FIG. 24F, the predetermined
diagnostic
category is hepatobiliary and pancreatic diseases, and the rate of
hospitalization for
hepatobiliary and pancreatic diseases of the selected patient after six months
can be
unexpectedly reduced by 44% relative to an average rate of hospitalization for
hepatobiliary and pancreatic diseases of selected patients having anemia
without the
continuous glucose monitor regimen.
As can be seen in FIGS. 12E and 13C, the predetermined diagnostic category can
be infectious and parasitic diseases, and the rate of hospitalization for
infectious and
parasitic diseases of the selected patient after six months can be
unexpectedly reduced by
at least 33% relative to an average rate of hospitalization for infectious and
parasitic
diseases of selected patients having the predetermined comorbidity without the
continuous glucose monitor regimen.
As embodied herein, the selected patient can be receiving basal-bolus insulin
therapy. As can be seen in FIG. 25D, the predetermined comorbidity is a fluid
and
electrolyte disorder, and the rate of hospitalization for infectious and
parasitic diseases of
the selected patient having fluid and electrolyte disorder after six months
can be
unexpectedly reduced by at least 59% relative to an average rate of
hospitalization for
infectious and parasitic diseases of selected patients having fluid and
electrolyte disorder
without the continuous glucose monitor regimen. As can be seen in FIG. 25D,
the
predetermined comorbidity is a valvular disorder, and the rate of
hospitalization for
infectious and parasitic diseases of the selected patient having a valvular
disorder after
CA 03179837 2022- 11- 22
WO 2021/237225 PCT/US2021/033947
six months can be unexpectedly reduced at least by 58% relative to an average
rate of
hospitalization for infectious and parasitic diseases of selected patients
having a valvular
disorder without the continuous glucose monitor regimen. As can be seen in
FIG. 25D,
the predetermined comorbidity is liver disease, and the rate of
hospitalization for
5 infectious and parasitic diseases of the selected patient having liver
disease after six
months can be unexpectedly reduced by at least 50% relative to an average rate
of
hospitalization for infectious and parasitic diseases of selected patients
having liver
disease without the continuous glucose monitor regimen.
As embodied herein, the selected patient can be receiving non-multiple daily
10 insulin injection therapy. As can be seen in FIG. 24D, the predetermined
comorbidity is a
fluid or electrolyte disorder, and the rate of hospitalization for infectious
and parasitic
diseases of the selected patient having a fluid or electrolyte disorder after
six months can
be unexpectedly reduced by at least 68% relative to an average rate of
hospitalization for
infectious and parasitic diseases of selected patients having fluid or
electrolyte disorders
15 without the continuous glucose monitor regimen As can be seen in FIG
24D, the
predetermined comorbidity is a valvular disorder, and the rate of
hospitalization for
infectious and parasitic diseases of the selected patient having a valvular
disorder after
six months can be unexpectedly reduced by at least 53% relative to an average
rate of
hospitalization for infectious and parasitic diseases of selected patients
having valvular
20 disorders without the continuous glucose monitor regimen. As can be seen
in FIG. 24D,
the predetermined comorbidity is liver disease, and the rate of
hospitalization for
infectious and parasitic diseases of the selected patient having liver disease
after six
months can be unexpectedly reduced by at least 54% relative to an average rate
of
hospitalization for infectious and parasitic diseases of selected patients
having liver
25 disease without the continuous glucose monitor regimen.
In accordance with the disclosed subject matter, a system to establish an
analyte
monitor regimen is also provided. The system includes a sensor control device
comprising an analyte sensor coupled with sensor electronics, the sensor
control device
configured to transmit data indicative of an analyte level, and, a reader
device
30 comprising a display, wireless communication circuitry configured to
receive the data
indicative of the analyte level, and one or more processors coupled with a
memory, the
memory configured to store instructions that, when executed by the one or more
processors, cause the one or more processors to output to the display an
analyte level
CA 03179837 2022- 11- 22
WO 2021/237225 PCT/US2021/033947
71
measurement, wherein after six months of initiating an analyte monitor regimen
using
the system for a type 2 diabetic patient having a predetermined comorbidity, a
rate of
hospitalization for a predetermined diagnostic category of the selected
patient having the
predetermined comorbidity can be unexpectedly reduced by at least 12% relative
to an
average rate of hospitalization for a predetermined diagnostic category of
selected
patients having the predetermined comorbidity without the continuous glucose
monitor
regimen. The system can include any of the features described hereinabove for
the
method of treatment.
In accordance with the disclosed subject matter, a method of treatment of a
type 2
diabetic patient can include selecting a type 2 diabetic patient having a
predetermined
comorbidity for treatment, initiating a continuous glucose monitor regimen for
the
selected type 2 diabetic patient, wherein after six months of initiation of
the continuous
glucose monitor regimen, an average rate of hospitalization for a
predetermined
diagnostic category of the selected patient having the predetermined
comorbidity can be
unexpectedly reduced by at least 12% relative to an average rate of
hospitalization for
the predetermined diagnostic category of the selected patient having the
predetermined
comorbidity during a period of six months prior to initiating the continuous
glucose
monitor regimen.
According to embodiments, the predetermined comorbidity can be anemia. As
embodied herein, the anemic patient can receive basal-bolus insulin therapy.
As can be
seen in FIG. 25D, the predetermined diagnostic category is infectious and
parasitic
diseases, and the average rate of hospitalization for infectious and parasitic
diseases of
the selected patient after six months can be unexpectedly reduced by 51%
relative to an
average rate of hospitalization for infectious and parasitic diseases of the
selected patient
having anemia during a period of six months prior to initiating the continuous
glucose
monitor regimen. As can be seen in FIG. 25E, the predetermined diagnostic
category is
respiratory diseases, and the average rate of hospitalization for respiratory
diseases of the
selected patient after six months can be unexpectedly reduced by 38% relative
to an
average rate of hospitalization for respiratory diseases of the selected
patient having
anemia during a period of six months prior to initiating the continuous
glucose monitor
regimen. As can be seen in FIG. 25E, the predetermined diagnostic category is
kidney
and urinary tract diseases, and the average rate of hospitalization for kidney
and urinary
tract diseases of the selected patient after six months can be unexpectedly
reduced by
CA 03179837 2022- 11- 22
WO 2021/237225 PCT/US2021/033947
72
57% relative to an average rate of hospitalization for kidney and urinary
tract diseases of
the selected patient having anemia during a period of six months prior to
initiating the
continuous glucose monitor regimen. As can be seen in FIG. 25G, the
predetermined
diagnostic category is hepatobiliary and pancreatic diseases, and the average
rate of
hospitalization for hepatobiliary and pancreatic diseases of the selected
patient after six
months can be unexpectedly reduced by 55% relative to an average rate of
hospitalization for hepatobiliary and pancreatic diseases of the selected
patient having
anemia during a period of six months prior to initiating the continuous
glucose monitor
regimen.
As embodied herein, the anemic patient can be receiving non-multiple daily
insulin injection therapy. As can be seen in FIG. 24D, the predetermined
diagnostic
category is infectious and parasitic diseases, and the average rate of
hospitalization for
infectious and parasitic diseases of the selected patient after six months can
be
unexpectedly reduced by 48% relative to an average rate of hospitalization for
infectious
and parasitic diseases of the selected patient having anemia during a period
of six months
prior to initiating the continuous glucose monitor regimen. As can be seen in
FIG. 24D,
the predetermined diagnostic category is respiratory diseases, and the average
rate of
hospitalization for respiratory diseases of the selected patient after six
months can be
unexpectedly reduced by 59% relative to an average rate of hospitalization for
respiratory diseases of the selected patient having anemia during a period of
six months
prior to initiating the continuous glucose monitor regimen. As can be seen in
FIG. 24E,
the predetermined diagnostic category is kidney and urinary tract diseases,
and the
average rate of hospitalization for kidney and urinary tract diseases of the
selected
patient after six months can be unexpectedly reduced by 51% relative to an
average rate
of hospitalization for kidney and urinary tract diseases of the selected
patient having
anemia during a period of six months prior to initiating the continuous
glucose monitor
regimen. As can be seen in FIG. 24F, the predetermined diagnostic category is
hepatobiliary and pancreatic diseases, and the average rate of hospitalization
for
hepatobiliary and pancreatic diseases of the selected patient after six months
can be
unexpectedly reduced by 44% relative to an average rate of hospitalization for
hepatobiliary and pancreatic diseases of the selected patient having anemia
during a
period of six months prior to initiating the continuous glucose monitor
regimen.
CA 03179837 2022- 11- 22
WO 2021/237225 PCT/US2021/033947
73
As can be seen in FIGS. 12E and 13C, the predetermined diagnostic category is
infectious and parasitic diseases, and the average rate of hospitalization for
infectious
and parasitic diseases of the selected patient after six months can be
unexpectedly
reduced by at least 33% relative to an average rate of hospitalization for
infectious and
parasitic diseases of the selected patient having the predetermined
comorbidity during a
period of six months prior to initiating the continuous glucose monitor
regimen.
As embodied herein, the selected patient can be receiving basal-bolus insulin
therapy. As can be seen in FIG. 25D, the predetermined comorbidity is a fluid
and
electrolyte disorder, and the average rate of hospitalization for infectious
and parasitic
diseases of the selected patient haying fluid and electrolyte disorder after
six months can
be unexpectedly reduced by at least 59% relative to an average rate of
hospitalization for
infectious and parasitic diseases of the selected patient having fluid and
electrolyte
disorder during a period of six months prior to initiating the continuous
glucose monitor
regimen. As can be seen in FIG. 25D, the predetermined comorbidity is a
valvular
disorder, and the average rate of hospitalization for infectious and parasitic
diseases of
the selected patient having a valvular disorder after six months can be
unexpectedly
reduced at least by 58% relative to an average rate of hospitalization for
infectious and
parasitic diseases of the selected patient having a valvular disorder during a
period of six
months prior to initiating the continuous glucose monitor regimen. As can be
seen in
FIG. 25D, the predetermined comorbidity is liver disease, and the average rate
of
hospitalization for infectious and parasitic diseases of the selected patient
having liver
disease after six months can be unexpectedly reduced by at least 50% relative
to an
average rate of hospitalization for infectious and parasitic diseases of the
selected patient
having liver disease during a period of six months prior to initiating the
continuous
glucose monitor regimen.
As embodied herein, the selected patient can be receiving non-multiple daily
insulin injection therapy. As can be seen in FIG. 24D, the predetermined
comorbidity is a
fluid or electrolyte disorder, and the average rate of hospitalization for
infectious and
parasitic diseases of the selected patient having a fluid or electrolyte
disorder after six
months can be unexpectedly reduced by at least 68% relative to an average rate
of
hospitalization for infectious and parasitic diseases of the selected patient
having fluid or
electrolyte disorders during a period of six months prior to initiating the
continuous
glucose monitor regimen. As can be seen in FIG. 24D, the predetermined
comorbidity is
CA 03179837 2022- 11- 22
WO 2021/237225
PCT/US2021/033947
74
a valvular disorder, and the average rate of hospitalization for infectious
and parasitic
diseases of the selected patient having a valvular disorder after six months
can be
unexpectedly reduced by at least 53% relative to an average rate of
hospitalization for
infectious and parasitic diseases of the selected patient having valvular
disorders during a
period of six months prior to initiating the continuous glucose monitor
regimen. As can
be seen in FIG. 24D, the predetermined comorbidity is liver disease, and the
average rate
of hospitalization for infectious and parasitic diseases of the selected
patient having liver
disease after six months can be unexpectedly reduced by at least 54% relative
to an
average rate of hospitalization for infectious and parasitic diseases of the
selected patient
having liver disease during a period of six months prior to initiating the
continuous
glucose monitor regimen.
As can be seen in FIGS. 24B-S and 25B-V, the same analysis can be performed
for any of the disclosed major diagnostic categories using any of the
disclosed sub-
groups (e.g., comorbi diti es, age, gender, non-insulin diabetes medications,
medication
therapy group, or other diabetic therapy) for type 2 diabetic patients on
basal-bolus
therapy and non-MDI therapy.
All percentage reductions in rate of hospitalizations shown in FIGS. 24B-S and
25B-V illustrate minimum percentage reduction (i.e., at least a reduction of
the
percentage shown in FIGS. 24B-S and 25B-V). For example, and not limitation,
the rate
of hospitalization for infectious and parasitic diseases of type 2 diabetic
patients on
basal-bolus therapy having anemia with CGM regimen after six months
unexpectedly
reduced by at least 51% (i.e., reduction in rate of hospitalization could be
greater than
51%) relative to an average rate of hospitalization for infectious and
parasitic diseases of
type 2 diabetic patients on basal-bolus therapy having anemia but without CGM
regimen.
Additionally, reductions in rate of hospitalization could be achieved earlier
than 6
months (e.g., 12 weeks, 3 months, 4 months, or any other period of time
reasonably
understood by a person of skill in the art) in all percentage reductions in
rate of
hospitalizations shown in FIGS. 24B-S and 25B-V.
Example 4
In accordance with an embodiment as described herein, risk of hospitalization
for
acute diabetes events ("ADE") 12 months-before and 12 months-after access to a
CGM
in accordance with the disclosed subject matter herein above (e.g., in certain
embodiments, the FreeStyle Libre system) was studied. In this exemplary
embodiment,
CA 03179837 2022- 11- 22
WO 2021/237225
PCT/US2021/033947
the analysis was done upon a cohort of persons in France, wherein each person
had been
diagnosed with either Type-1 or Type-2 diabetes.
In selecting the persons to be included in the analysis, inclusion criteria
can be
defined. For example, an inclusion period can be defined, such as August 1,
2017 to
5 December 31, 2017, within which a person who has used a CGM system can be
included. Further inclusion criteria can include whether persons have at least
1 full year
of follow up data available. In this exemplary embodiment, within France,
74,076
persons were identified as fitting the inclusion criteria. Further, of that
group, 33,165
were diagnosed with Type-1 diabetes and 40,486 were diagnosed with Type-2
diabetes.
10 Further, within that group, 88% were treated with MDS or CSII, while 12%
were treated
with basal only therapy, OAD, or did not received treatment.
As illustrated in FIG. 20B, 6.4% of persons in the cohort with Type-1 diabetes
and 2.7% of persons in the cohort with Type-2 diabetes experienced at least
one
hospitalization for any ADE in the year prior to prescription of the CGM
system. In
15 contrast, 3.3% of persons in the cohort with Type-1 diabetes and 1.6% of
persons in the
cohort with Type-2 diabetes experienced at least one hospitalization for any
ADE in the
year after prescription (and use) of the CGM system. In this exemplary
embodiment, the
decrease is largely driven by a decrease in DKA related hospitalization
(excluding
comas) for both Type-1 and Type-2 diabetes. A decrease can also be observed
for
20 diabetes related comas in both group. Further, a decrease can also be
observed in
subgroups of CSII and MDI patients.
As illustrated in FIG. 20C, in the subgroup of CSII and MDI patients (88% of
total population), this exemplary analysis can show that before initiation of
a CGM
system (e.g., in certain embodiments, the FreeStyle Libre system), the
variables age (<25
25 years old), universal health coverage for people with low socioeconomic
status and type
of insulin therapy (pens vs pump) were independently associated with higher
rates of
hospitalizations for acute complications. After initiation, only age and
universal health
coverage remained independent risk factors.
Reduction in HbA I c Levels
30 According to an embodiment, a continuous glucose monitor regimen as
described
herein can reduce levels of HbAlc in patients with diabetes. In preferred
embodiments, a
CGM regimen can help reduce levels of HbAl c in patients with Type-2 diabetes.
The
CA 03179837 2022- 11- 22
WO 2021/237225 PCT/US2021/033947
76
examples provided below further demonstrate benefits of methods and systems as
described herein.
Hemoglobin AlC, also known as "glycated hemoglobin" and "HbAlc," refers to
hemoglobin that has been joined with glucose within the blood stream. It can
be used to
provide an average value for glucose levels in a patient's blood, as the
amount of HbAl c
within a blood stream is directly proportional to the total amount of sugar in
a patient's
blood. Further, given that the lifetime of red blood cells within a human body
(which
contain hemoglobin) is approximately 8-12 weeks, the measure of HbAl c also
gives an
indication of glucose values over these periods. While the specific ideal
level of HbAl c
a patient should aim for can vary, generally levels under 6.5% are a goal for
patients with
diabetes. As discussed below, higher levels of HbAl c can pose greater risk of
ADEs as
well as hospitalization due to other causes.
Example 1
In accordance with an embodiment as described herein, outcome measures
include- (a) assessing the data collected within the NDR, regarding both the
incident and
prevalent users of FreeStyle Libre system in Sweden since mid-2016, stratified
by type
of diabetes, type of diabetes treatment and method of administering insulin;
(b) analyzing
changes in recorded HbAlc levels in people with T1DM or T2DM before and after
initiating a CGM system (e.g., in certain embodiments, the FreeStyle Libre
system),
including subgroup analyses according to prior metabolic control, gender and
age.
In Sweden, approximately 5.5% of the population have diabetes, the majority of
whom have type 2 diabetes (T2DM). The Swedish National Diabetes Register
(NDR),
covering both primary and secondary care, aims to monitor and improve diabetes
care,
reducing diabetes-related morbidity and enabling comparisons between a number
of
clinical outcome measures. Nationwide registration of people with diabetes in
Sweden is
encouraged at least once a year. By January 2019, the register covered 435,093
adults
recorded as having diabetes during the preceding 12 months, constituting 90-
95% of all
people with diabetes in Sweden. Children up to 18 years of age with diabetes
are
registered in the SWEDIABKIDS Swedish Childhood Diabetes Registry. In June
2016,
the NDR initiated documentation of the usage of sensor-based continuous
glucose
monitoring (CGM) including the FreeStyle Libre system (Abbott Diabetes Care,
Witney,
Oxon, UK) amongst adults with diabetes and thus created the opportunity to
CA 03179837 2022- 11- 22
WO 2021/237225 PCT/US2021/033947
77
systematically investigate the impact of a CGM system (e.g., in certain
embodiments, the
FreeStyle Libre system) in Sweden.
Data can be extracted from the NDR covering the period from 1st January 2014
to the 25th June 2019. In an embodiment, the study population included adults
(> 18
years old) with T1DM or with T2DM with a diabetes clinic visit recorded in the
NDR
after 1st January 2014 and recorded use of the FreeStyle Libre system with an
index date
of June 2016 or later. The Index date is the date of the first registration
where the
FreeStyle Libre system use is recorded in the NDR for a person with diabetes.
There
need not be any specific exclusion criteria.
One focus of this embodiment is understanding the association between new
incident users of the FreeStyle Libre system and three distinct variables
within the NDR:
type of diabetes; HbAl c values; prior use of CGM. Data was collected in line
with
international consensus standards on HbAl c reporting in mmol/mol and
converted into
% units according to the IFCC reference system for national standardization.
As with all
registries, missing values in each of these categories will occur if the
information is
unknown, or if the assessment was not conducted or recorded by the responsible
healthcare professional. Within the NDR cohort of interest the relevant data
completeness is provided in FIG. 141.
Certain individuals with an NDR index date from June 2016 to June 2019 can be
identified within each calendar year. These new incident users were then
categorized
based on their known or possible use of CGM (other than FreeStyle Libre) prior
to their
FreeStyle Libre index date. These categories can include: (a) truly naive,
with confirmed
absence of use of CGM prior to the index date; (b) new incident users with
unknown
prior status; (c) new incident users with documented use of CGM prior to the
index date.
The identification and selection process for new incident users is illustrated
in FIG. 14F.
FreeStyle Libre users can be considered to be new incident users for the first
12
months after their initial index date. Thereafter they can be deemed as
prevalent users
and not included in further analysis. This study is focused on new incident
users of the
FreeStyle Libre system within the 12 months following their index date.
Individuals were
deemed to be naive to use of a CGM device if they were recorded on the
registry as not
exposed to CGM prior to their first registration with the FreeStyle Libre
system in the
NDR. Individuals were deemed to have prior use of CGM if the relevant variable
within
the NDR regarding CGM experience was selected. All other new incident users
were
CA 03179837 2022- 11- 22
WO 2021/237225
PCT/US2021/033947
78
classified as prior use unknown. Based on this identification and selection
criteria the
number of incident new users and prevalent users for FreeStyle Libre during
the study
period is illustrated in FIG. 14A.
HbAl c can be a recorded variable for people with diabetes in the NDR. The
latest
laboratory measured HbAlc value within 6 months prior to index date per person
can be
compared with the HbAlc value recorded between day 91 ¨ day 272 after the
index date
that was closest to the 6-month timepoint (day 181.5) and also between day
272¨ day
455 after the Index date that was closest to the 12 month timepoint (day
363.5). HbAlc
measurements were available within the defined before and after periods for a
subset of
the total study population who were incident FreeStyle Libre users. Based on
these
criteria, change in HbAl c can be evaluated for all new incident users based
on, for
example: type of diabetes; baseline HbAl c prior to the index date; and age.
Data for
change in HbAl c are presented as absolute mean change in % HbAl c units from
baseline at 6 months, not % change as a proportion of baseline.
During the period of this embodiment, 36,352 individuals with Type 1 diabetes
(T1DM) and 3,202 adults with Type 2 diabetes (T2DM) were identified as having
at
least one registration of FreeStyle Libre use. HbAlc measurements were
available for a
subset (n=9,898) of the total population of these incident FreeStyle Libre
users. The
relevant medication status for the total population of new incident users of
the FreeStyle
Libre system are provided in FIG. 14H. Certain subjects can have been
diagnosed with
T1DM or 12DM before or during 2013. Data completeness for the variables under
consideration was high for the variables under consideration, especially for
T1DM, as
shown in FIG. 141, and intra-patient coherence for type of diabetes was 100%,
such that
interpretation of our study outcomes is not confounded by errors in
classification of
diabetes type.
As illustrated in FIG. 14A, in the 11DM category, there were 9481 (26% of
incident users) truly naive adults identified with no prior use of FreeStyle
Libre or CGM,
as defined by the selection process in FIG. 14F. In the T2DM category there
were 827
(26%) truly naive adults. The most common profile for people with an index
date in the
NDR was as new to FreeStyle Libre but with unknown prior status, both in T1DM
(n=25540, 70%) and in 12DM (n=2243, 72%). The number of users who were new to
FreeStyle Libre but with prior experience of CGM was 1328 (4%) in T1DM and 60
(2%)
in T2DM.
CA 03179837 2022- 11- 22
WO 2021/237225
PCT/US2021/033947
79
As illustrated in FIG. 14B, based on the definitions above, this embodiment
can
identify 9187(25%) incident users with T1DM who had HbAlc measurements
registered in NDR that aligned with the 6-month post-index timepoint and 8316
(23%)
with HbAl c readings at the 12-month timepoint. For incident users with T2D,
there were
711(22%) and 538 (17%) incident users with 6-month and 12-month post-index
HbAl c
values, respectively. In this embodiment, analysis of the 9187 incident T1DM
users with
recorded HbAl c before and after the index date shows a reduction in HbAl c
following
first registration of the FreeStyle System in the NDR, as illustrated in FIG.
14G.
Amongst the total incident users, there was a -0.33% (95% CI -0.36, -0.31)
reduction at
12 months (p<0.0001). The fall was most notable for truly naive users, with a
reduction
in HbAl c of -0.44% (95% CI -0.48, -0.41; p<0.0001). The users with prior use
of CGM
also observed a decrease in HbAlc at 12 months using the FreeStyle Libre
system (-
0.18%; p<0.0001). Observed falls in HbAl c across all incident users with T1DM
were
evident at 6 months, as shown in FIG. 14J and sustained to the 12-month end
point.
In this embodiment, amongst the 711 incident users with T2DM a reduction in
HbAl c at 12 months after initiating the FreeStyle Libre system was also
shown, as can
be seen in FIG. 14G. The fall across the total incident users, was -0.52% (95%
CI -0.63,
-0.40; p<0.0001). As in T1DM, the fall was greatest for truly naive users,
with a
reduction in HbAlc of -0.66% (95% CI -0.84, -0.49; p<0.0001). In common with
T1DM,
the observed falls in HbAlc across all incident users with T2DM were evident
at 6
months, as illustrated in FIG. 14J, and sustained to the 12-month end point.
Both in the T1DM and in the T2DM categories, illustrated in FIGS. 14C and
15D, respectively, the benefits of FreeStyle Libre at 6 months after the index
date were
greatest in the subset of users who had the highest baseline HbAl c
measurements. In the
T1DM category, for the subgroup with baseline HbAl c <8.0%, there was a small
but
statistically significant fall of -0.05% (95% CI -0.08, -0.02; p=0.0017) only
amongst
truly naive users. As shown in FIG. 14C, reductions in HbAlc were evident in
T1DM for
all incident users with HbAlc >8.0%, after initiation of FreeStyle Libre.
These were
largest amongst users with baseline HbAl c >12.0%, with a fall of -3.1% (95%
CI -3.5, -
2.7) across all users, but reductions were also present for those with
baseline HbAlc 9.0-
<12% (-0.98%, 95%CI -1.00, -0.92) and 8.0-<9.0% (-0.42%, 95% CI -0.45, -0.39;
Table
3). These falls in T1DM can be seen for all incident users, including truly
naive users,
those with unknown prior status and also for subjects with prior use of CGM.
CA 03179837 2022- 11- 22
WO 2021/237225 PCT/US2021/033947
As illustrated in FIG. 14D, no significant change in HbAl c was observed in
the
T2DM category for users with baseline HbAlc <8.0%, whereas reductions were
observed for naive users and users with unknown prior status with baseline
HbAlc 8.0%
or above. As with T1DM, falls in HbAl c were evident as baseline HbAl c
increased,
5 with reductions of -3.4% (95% CI -4.4, -2.5) for all incident users with
HbAl c >12.0%.
As illustrated in FIG. 14E, in the T1DM category reductions for incident users
aged 18-24 years (-0.37%, 95% CI -0.45, -0.30; p<0.0001) or aged 25-65 years (-
0.39%,
95% CI -0.42, -0.37; p<0.0001), who together comprised 82% of the incident
group with
T1DM, can be observed. People aged 66-74 years and those >74 years each
achieved
10 smaller reductions (-0.20% and -0.19% respectively, p<0.0001 in each
case. In T2DM,
observed reductions in HbAl c at 6 months were skewed towards older subjects,
such
that no significant change in HbAl c was noted for the 18-24 year age group.
The
subgroup aged 25-65 years recorded a -0.70% fall in HbAl c at 6 months after
the index
date (p<0.0001) and those aged 66-74 years had a -0.34% reduction (p<0.0001).
No
15 change was observed for adults with T2DM aged >74 years
As illustrated in FIG. 14G, for incident users of FreeStyle Libre, a
correlation can
be observed between FreeStyle Libre use after the index date and reductions in
HbAlc.
For people with T1DM, there was an observed fall in HbAlc across the total
incident
population of -0.33% at 12 months. Reductions in HbAl c at 12 months after the
20 FreeStyle Libre index date were also evident for incident users with
T2DM, who
achieved a -0.52% reduction. The greater reduction observed in T2DM may be
explained
by the higher baseline mean HbAl c of this group, which was 8.6% for all
incident users
with T2DM prior to the index date, compared to a mean HbAl c of 8.1% in T1DM.
Both
in T1DM and in T2DM, the reductions in HbAl c were observed at 6 months, as
shown
25 in FIG. 14J, and sustained to 12 months.
As illustrated in FIG. 14G, within the incident user groups, those truly naive
to
prior use of CGM experienced the most benefit from initiating FreeStyle Libre,
with
reductions in HbAl c of -0.44% in T1DM and -0.66% in T2DM at 12 months. People
with unknown prior use of CGM can achieve reductions, both in T1DM (-0.28%)
and in
30 T2DM (-0.49%). An observation of note was that people with T1DM who were
registered as prior users of CGM also experienced reductions in HbAl c at 12
months
after the index date (-0.18%, p<0.0001).
CA 03179837 2022- 11- 22
WO 2021/237225
PCT/US2021/033947
81
The value of good glucose-control behaviors independent of the application of
FreeStyle Libre can be supported by the data on HbAlc change observed for the
separate
groups of users stratified by baseline HbAl c prior to the index date, as
shown by FIGS.
14C and 15D. Incident users of the FreeStyle Libre system with better initial
control, as
evidenced by baseline HbAlc <8.0%, achieved reductions 6 months after the
index date
and not at all in T2DM. Both in T1DM and in T2DM, reductions in HbAl c at 6
months
after the index date were more notable for incident users with higher starting
baseline
values >8.0% and greatest for those with HbAlc >12.0%. The data according to
this
embodiment supports that reductions in HbAlc across the total population of
incident
users at 6 months after the FreeStyle Libre index date are driven by those
individuals
with higher baseline HbAlc measurements.
Analysis of the data from the NDR can also confirm that the benefits of
reduced
HbAl c after initiating the FreeStyle Libre system can be extended across all
age groups
with T1DM and in the majority of those with T2DM The reduction observed in
young
adults (aged 18-24 years) with T1DM following intervention with FreeStyle
Libre is
worthy of note, since this age group can be identified as having the poorest
glycemic
control as measured by HbAl c as a consequence of psychosocial factors and
poor
adherence with insulin therapy. This embodiment did show a reduction in HbAlc
for the
18-24 years old study group in T2DM, though the population size was small
(n=12).
Another outcome from this embodiment is that improvements in glycemic control
amongst adults with T1DM or T2DM, aged 66-74 years and older, are achievable
using
the FreeStyle Libre system. This extends previous studies reporting reductions
in HbAlc
using CGM in subjects with a mean age of 67 years with T1DM or T2DM. This
embodiment also shows reductions in HbAlc in T1DM for people aged 74 year or
more,
in a sizeable study group (n=463) starting from a mean baseline of 8.1%. Use
of sensor-
based glucose monitoring systems in older and elderly people with diabetes has
focused
on reducing the risk of hypoglycemia and severe hypoglycemia in this high-risk
population rather than directly reducing HbAl c. The data indicates that
improvements in
long-term glycemic control are possible for older people with T1DM or T2DM.
Example 2
In accordance with an embodiment as described herein, the experience of two
treatment centres in Germany, where the FreeStyle Libre system was introduced
to
patients with either T1D or T2D on insulin as part of standard care, and HbAlc
values
CA 03179837 2022- 11- 22
WO 2021/237225
PCT/US2021/033947
82
recorded over 12 months following initiation was analyzed. According to this
embodiment, the retrospective observational analysis of diabetes management in
a real-
world setting shows that there can be a reduction in HbAlc in patients with
either T1D
or T2D on insulin following the introduction of the FreeStyle Libre system to
their
standard care. Additional details of this embodiment are disclosed in
Improving HbA I c
Control in Type I or Type 2 Diabetes Using Flash Glucose Monitoring: A
Retrospective
Observational Analysis in Two German Centres, which was originally published
in
Diabetes Therapy, Volume 12, Pages 363-72, 2021, Springer and can be accessed
at the
web site https://link.springer.com/article/10.1007/s13300-020-00978-9, and is
incorporated by reference herein in its entirety.
Patient data can be obtained from two German clinical centers, the
Gemeinschaftspraxis Drs. Klausmann in Aschaffenburg and Zentrum fin- Diabetes
und
GefaBerkrankungen Munster. Both centers are established in delivering standard
outpatient care for people with diabetes within the German healthcare system.
De-
identified patient records were examined to select subjects with either T1D or
T2D on
insulin who were initiated on the FreeStyle Libre system as part of standard
care. No
selection criteria were applied other than treatment with FreeStyle Libre as
part of
standard care. The data reflect consecutive adult patients started on
FreeStyle Libre
between November 2015 and September 2018. Laboratory tested HbAlc values were
recorded for all patients prior to the start of FreeStyle Libre using standard
clinical
laboratory reference analyzers, with at least one HbAlc value that was
established after
starting. Not all subjects had data recorded at each interval across the 12-
month analysis
period, as a consequence of the time of their start of FreeStyle Libre or a
missed
attendance. A total of 131 patients with T1D and 176 patients with T2D on
insulin met
the inclusion criteria and were included in the analysis. The age of patient
ranged from
24-92 years. All patients were recorded as being on insulin therapy for the
duration of
the analysis, either on multiple daily doses of insulin (MDI), mealtime
insulin only or
continuous subcutaneous insulin infusion (CSII). The baseline characteristics
of the
study population are illustrated in FIG. 16A.
Matched paired data can be analyzed using both the data analysis tools in
Microsoft Excel 2016 and the R Project for Statistical Computing (www.r-
project.org)
software version 3.6.2. The level of significance was set at 0.05 or better. A
linear model
can be used to investigate the trend of mean HbAl c values across the
measurement time
CA 03179837 2022- 11- 22
WO 2021/237225 PCT/US2021/033947
83
points from baseline onwards. Student's t-test was used to compare means of
matched
paired data and unmatched data as appropriate to the analysis. Tukey's
contrast analysis
was used to compare the means of every outcome timepoint from 3 months
onwards.
Linear regression was used to identify the predicted change in HbAl c given
the input
baseline HbAlc.
A statistically significant reduction in mean HbAl c from baseline was
detected at
all timepoints in 131 patients with T1D, as shown in FIG. 16B. Mean starting
baseline (+
SE), was 8.15% (+0.15%). HbAl c values decreased by -0.75% (+0.15%) at 3
months, by
-0.76% (+0.17%) at 6 months, by -0.72% (+0.19%) at 9 months and by 0.74%
(+0.21%)
at 12 months (p<0.001 in all cases). A similar trend was seen in 176 patients
with T2D
on insulin, as shown in FIG. 16C, with a mean baseline HbAl c of 7.76%
(+0.12%).
HbAl c was reduced by -0.54% (+0.11%) at 3 months, by 0.43% (+0.11%) at 6
months,
by -0.39% (+0.13%) at 9 months and by -0.38% (+0.17%) at 12 months (P<0.001 at
3, 6
months, P<0.002 at 9 months; P=0.014 at 12 months).
Tukey contrast analysis both in T1D and T21) can show a difference between
timepoints after 3 months that was not significant, indicating that the
greatest impact on
HbAl c values was observed within the first 3 months of use of the FreeStyle
Libre
system and sustained for 12 months.
As illustrated in FIG. 16D, in an exemplary subgroup analysis centered on
metabolic control, patients can be stratified into those with baseline HbAl c
<7.5% (58
mmol/mol), those with baseline HbAl c >7.5-10% (>58-86 mmol/mol) and those
with
HbAl c >10% (>86 mmol/mol). This can show that patients with T1D or T2D on
insulin,
with a baseline HbAl c >7.5% (>58 mmol/mol), can achieve a reduction in HbAl c
over
time with FreeStyle Libre whereas those with HbAl c levels <7.5% (58 mmol/mol)
did
not. For all patients with HbAl c in the range >7.5-10% (>58-86 mmol/mol) the
change
at 12 months was significant but was considerably greater amongst patients
with HbAl c
>10% (86 mmol/mol). For people with T1D, those with mean HbAlc >7.5-10% (>58-
86
mmol/mol) achieved a clinically significant reduction of 0.59% (+0.19%) after
12
months, from a mean HbAl c from 8.49% to 7.90% (Fig. 3a; p<0.01). For those
with a
baseline HbAlc >10% (86 mmol/mol) there was a mean 4.66% (+0.87%) reduction,
from 11.83% to 7.17% (Fig. 3a; p<0.001). In people with T2D on insulin and
HbAlc
>7.5-10% (>58-86 mmol/mol), the reduction in mean HbAlc 12 months after
starting
FreeStyle Libre was 0.62% (+0.22%), from 8.43% to 7.81% (Fig 3b; p<0.01) and
for
CA 03179837 2022- 11- 22
WO 2021/237225 PCT/US2021/033947
84
patients with HbAl c >10% (86 mmol/mol) the reduction at 12 months was 3.73%
(from
11.4% to 7.67%; p<0.01).
Linear regression can be used to predict a change in HbAl c at 3 months, given
the input baseline HbAl c. Therefore, baseline HbAl c can be strongly
negatively
correlated with subsequent change in HbAl c, both in T1D (R2=0.602, p<0.001)
as
shown in FIG. 16E, and in T2D (R2=0.698, p<0.001), as also shown in FIG. 16E.
In
T1D, on average, for each percentage increase in mean initial HbAl c, the mean
change
in final HbAlc at 3 months falls by an additional 0.72% (95% CI -0.83 to -
0.62). In T2D,
for each percentage increase in mean initial HbAl c, the mean change in final
HbAlc
falls by an additional 0.71% (95% CI -0.79 to -0.64).
The outcomes from data collected by two German diabetes treatment centers
show improvements in HbAl c for patients with either T1D or T2D on insulin.
The
reductions in HbAl c occur within the first 3 months and are sustained over a
12-month
period. Linear regression can show that a predictor of a reduction in HbAl c
after starting
the FreeStyle Libre system is HbAlc at baseline For each percentage increase
in mean
initial HbAl c, the mean change in final HbAlc at 3 months in T1D falls by an
additional
0.72%, and by 0.71% in T2D on insulin. As illustrated in FIG. 16D, the
subgroup
analysis of subjects based in prior metabolic control can show that a
reduction in HbAl c
from baseline is achievable for people with T1D or T2D on insulin with mean
HbAl c
>7.5 - 10% (>58-86 mmol/mol) after starting the FreeStyle Libre system, with
greater
reductions for patients with HbAlc above 10% (>86 mmol/mol). People with T1D
or
T2D on insulin and good prior glucose control (mean HbAl c < 7.5% at baseline)
do not
see a significant change in their HbAl c over 3-12 months.
Those patients with tighter long-term glucose control, as evidenced by a
starting
HbAlc level below 7.5%, are likely to be improving their metabolic control
using the
FreeStyle Libre system, but not by reducing the HbAl c.
One consequence of immediate access for users of the FreeStyle Libre system to
a range of glycemic information that can improve their decision making during
daily
diabetes self-care. These can include their glucose status in real time, the
trend arrows
that indicate the direction and speed of change in their glucose status and
the summary
reports that are available to them via the readers or smartphone apps that
they use to scan
and collect glucose data. This information can facilitate an in-depth
awareness of their
daily life and allows for effective treatment decisions that are not possible
with SMBG
CA 03179837 2022- 11- 22
WO 2021/237225 PCT/US2021/033947
testing. The intuitive nature of CGM systems mean that this improvement in
self-care
behavior starts following the application of the first glucose sensor and is
sufficient for a
change in long-term HbAl c to be evident after 3 months. Persons with T2D on
insulin
therapy can see a considerable benefit in long-term HbAl c when managed with
flash
5 glucose monitoring.
The results according to the disclosed embodiment support improved glucose
control, as measured by HbAlc, using flash glucose monitoring in patients with
either
T1D or T2D on insulin. The retrospective observational analysis, according to
this
embodiment, shows that the introduction of the FreeStyle Libre system is
associated with
10 a reduction in HbAl c levels in people with diabetes on insulin within 3
months of
initiation and the results are sustainable over 12 months. Furthermore,
patients whose
baseline HbAlc levels are above 7.5% (58 mmol/mol) can see an HbAl c
reduction.
These improvements in glucose control can contribute to a reduction in the
long-term
risk of microvascular and macrovascular complications and the consequent costs
of
15 morbidity and mortality associated with diabetes
Example 3
In accordance with an embodiment as described herein, a kinetic model is
disclosed which can incorporate the patient-specific parameters of red blood
cell
production, elimination (i.e. RBC lifespan) and the apparent hemoglobin
glycation rate
20 governed by the glucose transport across red blood cell ("RBC") membrane
and
glycation of the hemoglobin molecule intracellularly. The model has been
developed
and validated with data from European clinical trial cohorts and one specific
continuous
glucose monitor (CGM) technology (FreeStyle Libre , Abbott Diabetes Care).
Additional details of this embodiment are disclosed in Accurate prediction of
HbA lc by
25 continuous glucose monitoring using a kinetic model with patient-
specific parameters for
red blood cell lifespan and glucose uptake, which was originally published in
Diabetes
and Vascular Disease Research, Volume 18, Issue 3, 2021, Sage Journals and can
be
accessed at the web site
https://j ournals.sagepub.com/doi/ful1/10.1177/14791641211013734, and is
incorporated
30 by reference herein in its entirety.
RBC production and removal are in balance during homeostasis, with the
production in the bone marrow stimulated by erythropoietin released by the
kidney in
response to detected oxygen levels. Removal and recycling of RBCs are
primarily
CA 03179837 2022- 11- 22
WO 2021/237225
PCT/US2021/033947
86
performed by macrophages in the spleen, with a selectivity for damaged and
aged RBCs
that have decreased motility and flexibility, necessary to traverse across the
capillary
bed. In addition, there is a variable and dynamic response available in the
liver by
monocytes to remove RBCs under conditions of degraded RBC integrity. These
complex mechanisms can result in varying RBC survival, and thus their exposure
to
circulating glucose levels that drive the intracellular hemoglobin glycation
detected by
the HbAlc assay. Certain experimental evidence has shown there is a variation
of mean
RBC lifespan between hematologically normal individuals, but accurate
assessment of
RBC lifespan is both difficult and time-consuming, and therefore beyond the
capability
of routine diabetes management. Further, besides individual variation, there
are growing
indications that there are consistent differences in RBC survival across
ethnic groups,
making further understanding and elucidation imperative in order to deliver
effective
care for all individuals.
Beyond RBC survival, a second variable factor in determining HbA lc is the
facilitated cross-membrane transport of glucose into RTICs by GLUT'
transporters The
majority of glucose is consumed by the Embden¨Meyerhof¨Parnas pathway to
support
energy requirements of the RBC. The fraction of glucose that binds
irreversibly to
hemoglobin, resulting in "glycated hemoglobin", is detected via the HbAl c
assay.
The kinetic model according to this exemplary embodiment can take one or more
data sections to estimate the patient-specific kinetic parameters. Each data
section
consists of a frequent glucose trace (at least every 15 minutes) between two
lab HbAl c
values at least two weeks apart. To ensure acceptable accuracy of estimates,
it can be
required that at least 80% of CGM data points be present, and any continuous
gap be less
than 24-hours within a data section. The final data section of each subject
was excluded
from the parameter estimation. The parameters can then be fixed and used to
prospectively calculate an HbAl c value (termed "cHbAlc") for comparison to
the final
lab HbAlc. It can be required that each subject had a total of three or more
data-sections,
therefore at least two for parameter estimation. FIG. 17A is an example of
data sections
and prospective evaluation for an individual.
In this exemplary embodiment, all selected subjects had type 1 diabetes
treated
with the sensor-augmented pump (SAP) from Kobe University Hospital in Japan.
All
glucose readings were collected by a fingerstick-calibrated CGM sensor
(EnliteTM,
Metronic). HbAlc values were measured by a central laboratory (Kobe University
CA 03179837 2022- 11- 22
WO 2021/237225 PCT/US2021/033947
87
Hospital, HPLC with Arkray HA8181). Within available data collected by Kobe
University, 51 subjects met the quality and sufficiency criteria for analysis,
as shown in
FIG. 17B.
For each individual, two kinetic parameters can be calculated using the
kinetic
model with all data sections except the last. These parameters are RBC
turnover rate
kage (or RBC lifespan = 1/ kage) and the apparent hemoglobin glycation rate
kgly
(dominated by cross-membrane glucose uptake). As illustrated in FIG. 17A, the
prospective use of the model with the kinetic parameters on the final data
section
produced cHbAlc throughout the data section and comparison was at the end
value that
aligned with the lab HbAl c. Both kinetic parameter estimation and prospective
cHbAlc
calculations were performed with equation 8 reported previously, which is
listed below
for convenience.
A1cz = EAz(1¨ D2) +1[EAi(1¨ Di) Fi + A1c0 flDj
=1
pki
Where Di can represent e -(kjibgi+kaµye)tand EAf can represent gi/(kage/
kgb, + gi). The value A lcz is equivalent to cHbAlc at the end of time
interval G. And
the intra-RBC glucose level gi can represent (Km * GL)/(KM + Gi) depends on
the
blood glucose level Gi and glucose binding affinity to GLUT1, wherein Km can
equal
approximately 26.2 mM.
For comparison to the final lab HbAl c, the corresponding estimated HbAl c
(eHbAlc) and glucose management indicator GMI values were determined by 14-day
average CGM glucose (AG). The performances of these methods were compared by
the
agreements between the estimated and lab HbAl c values. Specifically, the
absolute
deviation distributions and R2 values from Pearson's correlation of linear
regression can
be compared. Estimated HbAlc (eHbAlc) and Glucose Management Indicator (GMI)
can be calculated from average glucose with the following regression
equations:
GMI% AGrng/a, * 0.02392+ 3.31
eHbAlc% = (AGmg/dL + 46.7)/28.7
Distributions can be further characterized by the mean and standard deviation
for
normally distributed data and by median and interquartile range for non-
normally
distributed data. Any glucose trace gaps less than 45 minutes had missing
values imputed
with the nearest observation or average of nearest observations if both were
available
(the observations immediately before or after the gap). For a longer gap, each
missing
CA 03179837 2022- 11- 22
WO 2021/237225 PCT/US2021/033947
88
value was imputed with the average of the observations at the same time in
previous and
next days. Python/SciPy can used for all analyses, though other known
programming
languages are contemplated.
Based on the exemplary model, HbAl c is sensitive to kw, and kage during or
after
a day-to-day glucose change. In a period of steady day-to-day glucose, HbAl c
is
sensitive to the ratio of kgiy or kage. For this reason, it can be more
difficult to estimate
kinetic parameters than their ratio. As a consequence, a reasonable HbAlc
prediction, for
steady state, can be provided when only the ratio of kgiy and 'cage is
available. Therefore,
less data sections can be required for HbAl c prediction than RBC lifespan (or
kage)
estimation.
Since the exemplary model also assumes no kgiy and 'fug, change during the
study
period, a higher confidence group was defined for subjects with more day-to-
day glucose
change (top 2/3 or between-day glucose CV > 17%), and no major
life/therapeutic
changes that can affect RBC metabolism. These changes can include, but are not
limited
to, childbirth, iron deficiency treatment, hospitalization, and major drug
changes From
the higher confidence group, those with more than 10 data sections were
evaluated
further to examine the effect of increasing the number of data sections to
improve the
accuracy of kinetic parameter and HbAl c estimations. By sequentially
including
additional data sections, the mean absolute deviations to the final RBC
lifespan and lab
HbAl c for each individual can be calculated. This can set an expectation on
the numbers
of data section one will need to collect for good estimations on the RBC
lifespan and
HbA 1 c.
Prospective use of the exemplary model according to this embodiment with
patient-specific kinetic constants produced more accurate predictions of the
lab HbAlc
compared to eHbAlc and GMI. FIG. 17C illustrates the comparison metrics of
HbAlc
estimation using the kinetic model, eHbAlc and GMI. The kinetic model can have
the
smallest median and mean absolute deviation of 0.10% and 0.11% (1.1 and 1.2
mmol/mol). The mean absolute deviations from eHbAlc and GMI were larger
(p<0.001), approximately four to five times as large. As an HbAl c difference
of 0.5%
(5.5 mmol/mol) is usually considered clinically relevant, the rates of
correspondence
within this range was evaluated. The cHbAlc has minimal clinically relevant
deviation
with 92.3% within 0.5% (5.5 mmol/mol), compared to eHbAlc and GMI at 65.5% and
73.1%, respectively.
CA 03179837 2022- 11- 22
WO 2021/237225
PCT/US2021/033947
89
FIG. 17D illustrates the improved agreement between cHbAlc and laboratory
HbAl c, compared to eHbAlc and GMI. The cHbAlc had no overall bias, whereas
the
eHbAlc and GMI had biases of -0.4% and -0.3%, respectively. The superior
accuracy of
cHbAlc was also indicated by a tighter association with the laboratory HbAl c,
with
coefficient of determination (R2) of 0.91 compared to 0.65 for both eHbAlc and
GMI.
Laboratory HbAl c ranged from 4.9% to 9.9% (30 to 85 mmol/mol), with a mean
value
of 7.1% (54 mmol/mol). At this mean value, cHbAlc had a 95% prediction
confidence
interval range from 6.9% to 7.3% (52 to 56 mmol/mol), which is a 78% reduction
compared to eHbAlc (6.5% to 8.3% or 48 to 67 mmol/mol) and GMI (6.5% to 8.3%
or
48 to 67 mmol/mol).
According to this exemplary model, RBC lifespans in the higher confidence
group of 26 subjects can be calculated. This subgroup has a similar age
distribution to
the overall study cohort with a median (IQR) of 44 (37-55) years and a range
of 10-70
years. The gender distribution was also similar, with 7 males and 19 females.
In the
subgroup of this embodiment, the median (TQR) RBC lifespan was 74 (66-88) days
with
a range of 56-120 days. Two subjects had compromised kidney function measured
by
eGFR less than 44, and one pediatric subject less than 20 years old. All three
individuals
showed short RBC lifespans less than 70 days.
Within the 26 higher confidence subjects with relatively larger day-to-day
glucose variability and without major life/therapeutic changes during the data
collection,
there were 12 subjects that have at least 10 data sections. FIG. 17E
illustrates the
prospective absolute deviations of cHbAlc with the last lab HbAl c as well as
the
absolute deviations of RBC lifespan compared to the final RBC lifespan
estimated with
all data sections. The average absolute deviations of the cHbAl c predictions
decrease
sharply and then stabilize after the third data section. The absolute
deviations of RBC
lifespan also decreased longitudinally, reaching stability after the fifth
data section.
Within this cohort, RBC lifespans in the higher confidence group of 26
subjects
can be calculated. This subgroup has a similar age distribution to the overall
study cohort
with a median (IQR) of 44 (37-55) years and a range of 10-70 years. The gender
distribution was also similar, with 7 males and 19 females. In this subgroup,
the median
(IQR) RBC lifespan was 74 (66-88) days with a range of 56-120 days. Two
subjects had
compromised kidney function measured by eGFR less than 44, and one pediatric
subject
CA 03179837 2022- 11- 22
WO 2021/237225 PCT/US2021/033947
less than 20 years old. All three individuals showed short RBC lifespans less
than 70
days.
Within the 26 higher confidence subjects with relatively larger day-to-day
glucose variability and without major life/therapeutic changes during the data
collection,
5 there were 12 subjects that have at least 10 data sections. FIG. 17E
shows the prospective
absolute deviations of cHbAlc with the last lab HbAl c as well as the absolute
deviations
of RBC lifespan compared to the final RBC lifespan estimated with all data
sections. The
average absolute deviations of the cHbAl c predictions decrease sharply and
then
stabilize after the third data section. The absolute deviations of RBC
lifespan also
10 decreased longitudinally, reaching stability after the fifth data
section.
The exemplary model can provide estimates for the kinetic parameters
associated
with RBC lifespan and RBC glucose uptake rate. The longitudinal analysis
disclosed
above shows that the kinetic parameter estimation usually converges after 5
data
sections. The median RBC lifespan in this cohort was relatively short, around
74 days. In
15 a previous study with a European cohort, a similar median RBC lifespan
of 78 days (or
RBC turnover rate kage=1.29%/day) was observed. These medium RBC lifespans are
within or lower than the reported range of mean RBC age by Cohen and
colleague, who
are herein incorporated by reference in their entireties. In that exemplary
study, a mean
RBC age range of 38 to 56 days, or RBC lifespans of 76 to 112 days, was found
in six
20 people with diabetes. The observed short RBC lifespans might be related
to the disease
stage of both Japan and European cohorts. In this embodiment, the three
subjects
expected to have shortened RBC lifespans (either pediatric or with kidney
disease) had
the lowest RBC lifespans of 55-68 days. Having a routine manner of monitoring
RBC
lifespan and glucose uptake has the promise of aiding in documenting risk for
25 development and progression of complications due to diabetes and other
conditions.
This model identifies underlying variation of RBC lifespan in those without
identified conditions which could impact the clinical interpretation of HbAl
c. Those
with reduced RBC lifespan may be at risk of hyperglycemic damage in those
tissues
sensitive to elevated circulating glucose levels, as the HbAl c could
underreport mean
30 hyperglycemia exposure. Conversely, those with extended RBC lifespan may
be at risk
of hypoglycemia if treatment decisions are escalated to reduce HbAlc that is
elevated
due to extended exposure time (rather than glucose level) to circulating
glucose. This
embodiment has several points of interest. First, it has a consistent and high-
quality
CA 03179837 2022- 11- 22
WO 2021/237225 PCT/US2021/033947
91
laboratory HbAlc data. The precision of the laboratory HbAlc is a factor in
the accuracy
of the model. Second, each individual had long term CGM and several concurrent
laboratory HbAlc measurements. These longitudinal data were able to confirm
the role
of additional measurements to improve the accuracy of the personal glycation
factors.
Third, the results of this analysis are complementary to those previously
studied, and
further introduce new advantages and unexpected results.
Example 4
In accordance with an embodiment as described herein, data from three
different
data sets may be collected and linked together to study HblAlc reduction after
initiating
use of a continuous glucose monitor in Type 2 diabetes patients on long-acting
insulin or
non-insulin therapy. According to some embodiments, data can be collected from
Libre View, Quest Diagnositcs, and/or Decision Resources group. These data
sources
can then be linked, as shown in FIG. 18B, for example by the use of any
suitable linking
methodology, such as Datavant. The study can be designed according to the
template
illustrated in FTC 18A
The data included information glucose data from patients, HbAlc test dates and
results, and medication claims and diagnosis codes from medical and
pharmaceutical
claims. After use of a continuous glucose monitor, patients with Type-2
diabetes on basal
insulin or non-insulin therapy (including GLP-1) had reduction in HbAlc levels
from
baseline to 6 months of use and for baseline to 12 months of use.
For example, as illustrated in FIG. 18C use of the flash continuous glucose
monitor among users of long-acting insulin can result in a mean change in
HbAlc of -
0.6% after 6 months of use and of -0.5% after 12 months of use. Similarly, use
of the
flash continuous glucose monitor among non-insulin patients resulted in a mean
change
in HbAlc of -0.9% after 6 months of use and of -0.7% after 12 months of use.
Example 5
In accordance with an embodiment as described herein, data can be collected
from IBM Explorys databases according to the inclusion criteria shown in FIG.
19A.
For example, the analysis can be performed on a cohort of persons who have
been
prescribed a CGM monitor (for example, a FreeStyle Libre CGM) between a
predetermined timeframe, such as between November 2017 and February 2020; who
have Type 2 diabetes; who are under the age of 65 years old; who have not been
treated
with short or rapid-acting insulin (such as, bolus insulin); for whom HbAlc
data is
CA 03179837 2022- 11- 22
WO 2021/237225 PCT/US2021/033947
92
available; who have a baseline HbAlc level of 8 or more; for whom at least 6
months of
pre-prescription database enrollment is available.
Further, persons can be excluded according to certain exclusion criteria, some
of
which are also shown in FIG. 19A. These criteria include, but are not limited
to, persons
who have a history of CGM purchase outside a predetermined time frame; who
have
gestational diabetes; and/or who have both Type 1 and Type 2 codes on latest
encounters
with health records.
The exemplary study design is illustrated in FIG. 19B, which shows
determination of a baseline period, which is up to 180 days before an index
data, wherein
the index data can be the date on which a person is first prescribed a CGM
monitor, for
example, and not limitation, a FreeStyle Libre CGM. Further, the study can
designate an
outcome period, during which HbAl c levels can be measured at a plurality of
times after
the index date, including, for example but not limitation, 60 days, 180 days,
and 300
days after the index date.
FIG 19C shows selection of an exemplary cohort, and the resultant
characteristics of members of that cohort. In this exemplary selection,
beginning with
14,704 persons prescribed with a CGM monitor in a predetermined time period
(November 2017 ¨ February 2020), the number was reduced to 13,265 for those
for
whom the prescription was their first, then to 5,618 for those who had Type 2
Diabetes
and were treated with a non-bolus method, then to 3,682 persons who were under
the age
of 65, then to 1,859 who had HbAl c levels available, and, finally, to 1,034
persons who
had the predetermined HbAlc level (in this case, >8).
FIG. 19D illustrates a reduction in HbAl c levels for persons in the exemplary
cohort. In this example, on average, HbAl c levels were reduced by 1.48
percentage
points after prescription of a CGM (in this exemplary embodiment, a FreeStyle
Libre
CGM). Further reductions observed across different subgroups are illustrated
in FIG.
19E. As can be seen, persons having higher baseline HbA lc levels had larger
decreases
in HbAl c. Further, persons who are not treated with insulin (e.g. basal,
premix, NPH)
therapy showed a larger HbAlc decrease than patients who are treated with
insulin
therapy.
Budgetary and Economic Impact
According to an embodiment, the positive budgetary and economic impact of
continuous glucose monitor regimen vis a vis public health systems is
described.
CA 03179837 2022- 11- 22
WO 2021/237225 PCT/US2021/033947
93
Example 1
In accordance with an embodiment as described herein, an analysis estimates
the
potential costs associated with using flash glucose monitoring with optional
alarms
compared with either real time continuous glucose monitors (rtCGM) or routine
SMBG.
In the absence of direct evidence for flash monitoring with optional alarms, a
set of
clinical and resource-based assumptions are applied. The analysis can be
focused on
adults with diabetes and IAH who use an intensified insulin regimen, from a
Swedish
payer perspective.
Sweden has one of the highest prevalence rates of diabetes in Europe and is
currently estimated to be 7%. Impaired awareness of hypoglycemia (IAH), can
refer to
the absence or diminished ability to perceive the onset of hypoglycemia
amongst
diabetes patients who are users of an intensified insulin regimen. IAH caused
by
recurrent, untreated and non-severe hypoglycemic events makes patients less
aware and
able to respond to onset hypoglycemia, putting them at higher risk of
suffering severe
hypoglycemic events Prevalence estimates of TAI-T range between 20% - 32% in
adults
with insulin-treated type 1 diabetes mellitus (T1DM) and 10% in adults with
insulin-
treated type 2 diabetes mellitus (T2DM) and increases with age and duration of
diabetes.
Certain people with IAH can be disproportionally high healthcare users, due to
an
increase in the risk of severe hypoglycemia. In addition to the high cost
burden,
hypoglycemia is associated with a lower quality of life, increased anxiety and
reduced
productivity. Maintaining glucose levels within a recommended range reduces
the risk of
developing hypoglycemia associated with an intensified insulin regimen. The
Tandvards-
Lakemedelformansverket (TLV), a national health authority in Sweden,
recommends
that adults with insulin treated diabetes test at least four and up to ten
times per day
however recognize that adherence is poor as finger prick testing can be both
time
consuming, painful and inconvenient.
rtCGM automatically tracks glucose in interstitial fluid and in certain
embodiment can be used in combination with occasional self-monitoring of blood
glucose (SMBG) and features alarms to notify patients when their glucose is
outside of a
pre-defined range. This facilitates improved glycemic control by allowing
patients or
their caregivers to monitor and respond to changes. While rtCGM has been
demonstrated
to be effective in improving glycaemic control, adherence is variable. Of
1,662
participants reporting rtCGM use at enrolment into the T1DM Exchange registry,
675
CA 03179837 2022- 11- 22
WO 2021/237225
PCT/US2021/033947
94
(41%) reported discontinuing rtCGM use at the 1-year data collection. Alarm
fatigue can
also contribute to non-adherence.
The clinical benefits of flash glucose monitoring in comparison to routine
SMBG
have been demonstrated in two randomized controlled trials (RCTs) in people
with
T1DM and T2DM using an intensified insulin regimen. Both RCTs reported
differences
in the number of patients experiencing severe hypoglycaemic events in favour
of rtCGM.
In real-world studies flash monitoring has shown reductions from baseline in
HbAl c and
hypoglycaemia. The economic case for flash glucose monitoring has also been
demonstrated in published economic analyses, demonstrating cost-effectiveness
of flash
monitoring compared to routine SMBG in people with T1DM and in intensified
insulin
regimen users with T2DM from a Swedish payer perspective. A key differentiator
of
the newer model of flash glucose monitoring is that the optional alarms
empower
patients by providing a choice about how they want to use alarms. The efficacy
of flash
monitoring with optional alarms for people with diabetes and IAH who are using
an
intensified insulin regimen is expected to be similar to rtCGM because both
alert patients
in real-time of hypoglycaemia or hyperglycaemia. However, as the notification
feature is
optional it may reduce the risk of non-adherence due to alarm fatigue.
The analysis according to this embodiment can calculate the cost per patient
treated over a three-year period, applying a set of clinical and resource use
assumptions
to simulate a hypothetical base-case scenario. Flash monitoring with optional
alarms,
was compared to two alternatives: routine SMBG, or rtCGM, based on the Dexcom
G6
rtCGM system. Costs were estimated from a Swedish national health service
payer
perspective and are reported in 2018 SEK. The costs considered in the model
include
glucose monitoring costs and resource use to treat severe hypoglycaemic
events.
A simple two state cohort Markov model can be built in Microsoft Excel in
Office 365 which can be configured account for risk of severe hypoglycaemic
events
requiring medical assistance and non-adherence over a three-year time horizon
using
quarterly Markov cycles (T1DM, type 1; T2DM, type 2), as illustrated in FIG.
15A. In
the flash monitoring with optional alarms and rtCGM, patients enter the first
health state
where they use flash monitoring with optional alarms or rtCGM respectively,
with
occasional SMBG. Patients may discontinue flash monitoring with optional
alarms or
rtCGM due to non-compliance and move to a state where they are on routine
SMBG. In
both states, patients can experience severe hypoglycaemic events for which
they accrue
CA 03179837 2022- 11- 22
WO 2021/237225 PCT/US2021/033947
the medical costs associated with the event. In the routine SMBG arm, the
model
consists of only one state from which the patient may experience severe
hypoglycaemic
events.
The cost inputs, as illustrated in FIG. 15E, can be sourced from Swedish price
5 lists, manufacturer data and resource use reported in the control arm of
the HypoDE
study, an RCT comparing rtCGM to routine SMBG in a population predominantly of
people with IAH. The unit cost for a physician visit was sourced from a prior
Swedish
cost-effectiveness study. The cost of a severe hypoglycaemic event was
calculated using
inflated unit costs reported in Jonsson et al., which is herein incorporated
in its entirety
10 by reference and the resource use reported in Heller et al., which is
herein incorporated
in its entirety by reference. For the purposes of this embodiment, a severe
hypoglycaemic
event is one that requires third party medical assistance, including ambulance
call outs,
emergency room visits or hospital admissions.
Targeted literature searches were run in PubMed to source the clinical inputs
as
15 shown in FTC. 15F The baseline risk for severe hypoglycaemic events was
also sourced
from Heller et al., Severe Hypoglycaemia in adults with insulin-treated
diabetes: impact
on healthcare resources, J Diabetic Medicine, 2016, 33(4): p. 471-477, which
is herein
incorporated by reference in its entirety. This rate was adjusted to account
for a 3-fold
higher rate of severe hypoglycaemia reported in real world settings compared
to clinical
20 trials. Further adjustments can be applied to account for higher rates
of severe
hypoglycaemia amongst intensified insulin regimen users with TAB compared with
those
without TAR.
Efficacy data for both flash glucose monitoring with alarms and rtCGM was
sourced from Heinemann et al., which is herein incorporated in its entirety by
reference,
25 using the rate ratio of all severe hypoglycaemic events requiring third
party assistance.
Treatment discontinuation was modelled using the proportion of patients
(23.4%) who
discontinued using rtCGM in a real-world study after 1 year. No further
discontinuation
is assumed beyond year 1. In the base case the discontinuation rate is assumed
to be the
same for rtCGM and flash monitoring with alarms because no flash monitoring
with
30 alarms specific data are available.
As embodied herein, one-way sensitivity analysis can be conducted by varying
all inputs individually within lower and upper bounds and ranking the results
in order of
impact. High and low values were selected using a 95% confidence interval, or
by
CA 03179837 2022- 11- 22
WO 2021/237225
PCT/US2021/033947
96
varying the input by 50% or to extreme values where there was a first level of
uncertainty and 25% when there was a second level of uncertainty. The inputs
for the
analysis comparing flash glucose monitoring with alarms to routine SMBG and
rtCGM
are reported in FIGS. 15G and 15H, respectively.
The rate of severe hypoglycaemic events applied in this exemplary model was
calculated using data from an RCT in a T1DM diabetes population and applying
an
adjustment for a real-world setting and an IAH population. To account for
uncertainty
between these adjustments, the IAH rate ratio, the combined adjustment for
real-world
setting and IAH population, was varied, while keeping all other model inputs
constant.
A second scenario analysis considers the impact if adherence to flash glucose
monitoring with optional alarms is higher than adherence to rtCGM. In the base
case a
conservative assumption was applied, assuming that adherence was equal however
flash
monitoring with optional alarms is potentially more engaging for users than
rtCGM as
the notification feature is more flexible.
The base case results over a 3-year time horizon are illustrated in FIG 15B
Over
3 years, a patient using flash glucose monitoring with optional alarms is
expected to
realize cost savings of SEK 7,708 when compared to a patient using routine
SMBG and
SEK 69,908 when compared to rtCGM.
In comparison to rtCGM, the savings accrued by using flash monitoring with
optional alarms are largely due to differences in the sensor cost, the fact
that there is no
need for a transmitter, and a lower reader cost. In contrast, the cost savings
when
compared to routine SMBG are due to severe hypoglycaemic events avoided
because the
aggregate cost of treating severe hypoglycaemic events is around 50% lower.
The base-case analysis according to this present embodiment shows that the
higher acquisition cost of flash glucose monitoring with optional alarms
compared to
routine SMBG is offset by cost savings from avoiding severe hypoglycaemic
events. In
addition to costs avoided, reducing risk of severe hypoglycaemic events has
additional
health benefits not captured in the model. These include avoiding detriments
to patient's
quality of life associated with severe hypoglycaemic events and reducing risk
of further
complications or death. Sensitivity and scenario analyses found some
uncertainty
regarding this conclusion, where the result was particularly sensitive to
varying the
severe hypoglycaemic event parameters, most notably the intervention rate
ratio.
CA 03179837 2022- 11- 22
WO 2021/237225
PCT/US2021/033947
97
The results of the one-way sensitivity analysis comparing flash glucose
monitoring with optional alarms with routine SMBG are illustrated in a tornado
plot in
FIG. 15C, ranking the parameters in order of effect. The model is most
sensitive to the
severe hypoglycaemic event parameters. Changing the intervention incidence
rate ratio,
the rate ratio to account for IAH, or the base line severe hypoglycaemic event
rate to
their respective upper and lower bounds can cause the model results to shift
over the cost
saving threshold or become even more cost saving than the base case.
The results of the one-way sensitivity analysis projecting the cost saving of
flash
glucose monitoring with optional alarms compared to rtCGM after 3 years are
illustrated
in FIG. 15D. This shows that the analysis is most sensitive to the unit cost
of the rtCGM
sensor and the intervention rate ratio for flash glucose monitoring with
optional alarms
respectively. However, in all scenarios the cost per patient using flash
monitoring with
optional alarms is substantially lower than with rtCGM.
The results of the scenario analysis varying IAN rate ratio, according to some
embodiments, are illustrated in FIG 15J, and show that flash glucose
monitoring with
optional alarms is cost-saving compared to SMBG when the IAH severe
hypoglycaemic
event rate ratio is above 12.72. Flash monitoring with optional alarms is cost-
neutral
when the IAH ratio is 12.72. The cost-savings compared to rtCGM do not change
when
this rate is varied as the effect of rtCGM on severe hypoglycaemic events is
the same for
both flash monitoring with optional alarms and rtCGM. The results of the
scenario
analysis varying adherence to flash glucose monitoring with optional alarms,
according
to some embodiments, are illustrated in FIG. 15K and show that the model is
not
particularly sensitive to this input. Flash monitoring with optional alarms is
cost-saving
compared to rtCGM or routine SMGB in all variations of adherence to flash
monitoring
with alarms considered. The relationship between this variable and difference
in cost
need not be linear because higher adherence ca be associated with both higher
consumable costs as well as costs savings from severe hypoglycaemic events
avoided.
The comparison with rtCGM suggests that flash monitoring with optional alarms
dominates rtCGM because the acquisition costs are substantially lower and both
treatment strategies may provide similar efficacy. This conclusion, that cost
savings are
associated with switching from rtCGM to flash monitoring with optional alarms
was
consistent across the sensitivity and scenario analyses.
CA 03179837 2022- 11- 22
WO 2021/237225
PCT/US2021/033947
98
Glucose monitoring can be in people with diabetes and IAH who are using an
intensified insulin regimen due to the increased risk of severe hypoglycaemic
events.
Managing complications with diabetes imposes a high cost burden on health care
services in Sweden, with the cost of treating hypoglycaemia projected to be
SEK 34
million in 2020.
Two RCTs in populations using an intensified insulin regimen demonstrate high
scanning rates and real-world evidence confirms that this is maintained when
used as
regular, daily diabetes management. Frequent testing is recommended in certain
clinical
guidelines for effective diabetes management because real-world studies can
suggest this
is associated with more effective management of both HbAl c levels and reduced
risk of
hypoglycemia with intensified insulin regimen use. This benefit is expected to
be
particularly pertinent to IAH populations who are using an intensified insulin
regimen
given their higher susceptibility to hypoglycaemia.
A further benefit of flash monitoring with optional alarms over routine SMBG
can include the additional information captured, making this monitoring
strategy more
compliant with current international consensus for good practice. Each scan
provides
more information than a single glucose reading from an SMBG test and flash
monitoring
with optional alarms can provide a summary ambulatory glucose profile (AGP)
and a
complete 24-hour glucose record. A recent international consensus statement
endorsed
by EASD, ADA, AACE, AADE and ISPAD recognizes the importance of time in
glucose ranges (TIR) as "appropriate and useful as clinical targets and
outcome
measurements-. The flash monitoring system with optional alarms provides TIR
in the
AGP report, in contrast with SMBG which does not easily facilitate capturing
this
metric.
Example 2
In accordance with an embodiment as described herein, a nationwide audit,
Deshmukh et. al., Effect of flash glucose monitoring on glycemic control,
hypoglycemia,
diabetes-related distress, and resource utilization in the Association of
British Clinical
Diabetologists (ABCD) nationwide audit J Diabetes care, 2020, 43(9): p. 2153-
2160,
which is incorporated herein in its entirety, was set-up to assess the
patterns of use of
FreeStyle Libre system and to study its effect on glycemic control,
hypoglycemia,
diabetes-related distress, and hospital admissions due to hypoglycemia and
hyperglycemia/diabetic ketoacidosis (DKA). The study commenced in November
2017
CA 03179837 2022- 11- 22
WO 2021/237225 PCT/US2021/033947
99
and involved clinicians from 102 NHS hospitals in the UK for which they were
asked to
submit user data collected during routine clinical care.
In this embodiment, the budget impact of more widespread adoption of the
FreeStyle Libre system from a local health economy's perspective in the UK by
applying
the outcome data reported in the ABCD nationwide audit was estimated. The
potential
cost-effectiveness is also explored in a subsequent simplified cost-utility
analysis.
Improved glycemic control, facilitated by effective blood glucose monitoring
improves acute outcomes in Type 1 diabetes mellitus (T1DM) by reducing the
risk of
hypoglycemia and severe hypoglycaemic events ("SHE"), as well longer-term
outcomes
such as slowing down disease progression of retinopathy, nephropathy and other
diabetes
end-points. Self-monitoring of blood glucose ("SIVIBG"), or 'finger-prick'
testing, has
been the standard of care for people with T1DM. However, the introduction of
new
technology, such as sensor-based glucose monitoring, is changing the standard
approach
to glucose monitoring. The FreeStyle Libre system is convenient and easy to
use and
improves the frequency of glucose monitoring relative to SlVERG Furthermore,
it can
provide dense data, enabling informed discussion between people with diabetes
and their
clinicians about glucose management and, with the addition of digital
communication
tools, it minimizes the need for face-to-face contact. It is indicated for
measuring
interstitial fluid glucose levels in people age 4 and older with diabetes
mellitus, including
pregnant women and is designed to replace SMBG testing in the self-management
of
diabetes.
In this exemplary study, a budget impact model was developed in Microsoft
Excel to calculate the net difference in costs per patient and total budget
impact over a 3-
year time horizon, comparing the FreeStyle Libre system to SMBG. Included in
the
analysis were the acquisition costs, costs associated with severe
hypoglycaemic events
("SHE"), cost of diabetic ketoacidosis and hyperglycemia ("DKA") events, and
cost
savings from a reduction in HbAlc. The change in resource utilization with the
FreeStyle
Libre system compared to SMBG was sourced from the ABCD nationwide audit,
where
the people included in the ABCD audit are a sub-group of all T1DM populations
defined
by the NHS funding criteria and those able to self-fund. The budget impact
analysis can
estimate total costs, multiplying uptake by the cost per person using the
FreeStyle Libre
system and SMBG.
CA 03179837 2022- 11- 22
WO 2021/237225
PCT/US2021/033947
100
An additional, simplified, cost utility analysis calculated the expected
quality
adjusted life years ("QALYs") gained and an incremental cost-effectiveness
ratio,
comparing the FreeStyle Libre system to SMBG over a 1-year time horizon. Due
to the
short time horizon, only difference in quality of life was captured and
mortality was
assumed to be the same with both technologies. The incremental cost-
effectiveness ratio
("ICER") can be calculated as the net difference in cost per patient divided
by the net
difference in QALYs gained, where QALYs gained can be estimated by applying a
system utility weight to the FreeStyle Libre system use vs SMBG, a utility
decrement
associated with diabetes related events and a utility increment associated
with a change
in HbAlc. This approach facilitated the calculation of the utility difference
on an
incremental basis, reporting the difference in QALYs gained relative to SMBG
rather
than total QALYs gained for each comparator. No discounting was applied
because the
cost-utility analysis was conducted over a one-year time horizon.
In the analysis according to this embodiment, a selected cohort included 1,790
people with T1DM, which represents the mean number of people with T1DM across
all
clinical commissioning groups ("CCGs"), representing local health economies in
England. In the base-case, parameters for the rate of SHE events, DKA events
and
change in HbAl c for the FreeStyle Libre system and SMBG can be sourced using
data
from ABCD audit, as illustrated in FIG. 21A. For post-FreeStyle Libre system
use, 7-
month data can be applied and prorated to estimate annual outcomes.
FIG. 21A illustrates unit costs applied in the model according to this
embodiment. Acquisition costs for the FreeStyle Libre system can be obtained
from a
plurality of publicly available databased, for example, the NHS tariff
databases. Unit
costs for SMBG testing can be averaged from the top ten strips used in the UK
calculated
from IQVIA prescribing data . The number of tests strips per day with SMBG can
sourced from IMPACT, a multi-center randomized control trial of the FreeStyle
Libre in
T1DM, which is incorporated by reference in its entirety herein. The cost of
an
ambulance callout and admission for SHE and DKA events can be sourced from the
NHS reference cost and tariff data collection.
The cost associated with each incremental reduction in HbAlc was sourced from
a study that estimated the costs associated with micro and macrovascular
complications
with different HbAlc levels using the diabetes CORE model, is incorporated by
reference in its entirety herein. It reports the cost avoided from a UK payer
perspective in
CA 03179837 2022- 11- 22
WO 2021/237225
PCT/US2021/033947
101
years periods. The costs for the first 5-year period reported were annualized
to a one-
year basis.
The budget impact analysis according to this embodiment can evaluate a
scenario
where the FreeStyle Libre system would replace a proportion of SMBG use in
T1DM
5 adults within three years from the perspective of a UK local health
economy (n= 1,790).
For example, in year 1, 30% of the T1DM population are assumed to use the
FreeStyle
Libre system and the remaining 70% use SMBG, reflecting estimated trends in
2020. In
years 2 and 3, uptake of the FreeStyle Libre system is assumed to increase to
50% and
70% respectively, with the remaining population using SMBG.
FIG. 21B illustrates Utility gain from using the FreeStyle Libre system
compared
to SMBG. This gain can reflect the greater convenience as well as intangible
benefits of
empowering people to monitor and self-manage their glucose levels compared to
SMBG.
Utility decrements were also applied for SHE and DKA events and a further
utility gain
was applied per decrease in HbAlc
One-way sensitivity analysis ("OWSA") can be performed on all model
parameters to investigate the sensitivity of the cost effectiveness model
result to
variations in each of the parameter values. Where confidence intervals are at
undesired
levels, parameters may by varied by approximately 25%.
In addition, threshold analysis can vary the number SMBG tests per day, for
example and not limitation, between 0.5 and 10 to show the impact of this on
the ICER.
A further scenario analysis can be applied to a set of assumptions for the
utility benefits
with FreeSyle Libre system. In this exemplary embodiment the utility benefit
with the
FreeStyle Libre system was reduced from 0.03 to 0.01.
The results from the ABCD nationwide audit found that the reduction in HbAl c
was greater amongst people with a higher baseline HbAl c. The impact of this
was
considered in a sub-group analysis comparing the FreeStyle Libre system with
SMBG
reporting the cost-per patient treated and cost-effectiveness in people with
T1DM with
higher baseline HbAlc.
As illustrated in FIG. 21C, the FreeStyle Libre system can be marginally more
expensive than SMBG when testing 5.6 times per day because higher acquisition
costs
can be at least partially offset by cost savings from reduced resource
utilization. As
embodied herein, the net budget impact of increasing the proportion of people
with
T1DM using the FreeStyle Libre system from 30% in year 1 to 50% and 70% in
year 2
CA 03179837 2022- 11- 22
WO 2021/237225
PCT/US2021/033947
102
and 3 respectively is illustrated in FIG. 21D. In year 1 the total cost was
1,787,345
increasing to 1,847,618 and 1,907,890 in years 2 and 3 respectively
representing 3.4%
and 3.3% year on year increase.
As illustrated in FIG. 21E, a cost utility analysis can be used to estimate a
net
difference in cost as well as a net incremental QALY between a CGM system,
such as
the FreeStyle Libre system, and SMBG. In a study according to this embodiment,
for
example, a net difference in cost of 163 and a net incremental QALY of 0.048
can be
observed between a FreeStyle Libre System and SMBG over a one-year period.
This
resulted in an incremental cost effectiveness ratio of 3,516 per QALY gained.
As illustrated in FIGS. 21F and 23G, it can be observed that the model
according
to this embodiment is sensitive to the number of SMBG tests per day as well as
the costs
of the strips. For example, when SMBG tests per day is varied between 0.5 and
10 tests
per day, it can be observed, in FIG. 21H, that ICER is below 20,000 in all
scenarios,
and further that the FreeStyle Libre system performs better than SMBG when the
strip
per day value is 7 or more A further exemplary analysis can apply conservative
assumptions for the utility benefits with FreeStyle Libre system, effectively
reducing the
incremental utility benefit associated with using FreeStyle Libre system from
0.03 to
0.01; using this assumption the ICER increases to 16,313.
FIG. 211 illustrates the results of a sub-group analysis in people with higher
baseline HbAlc. Amongst those with a high HbAl c baseline (>8.5%), the costs
savings
from reduced HbAlc with the FreeStyle Libre system are projected to be greater
relative
to the overall population. According to this exemplary analysis, the
difference in cost per
patient per year with the FreeStyle Libre system compared to SMBG is, 73,
compared
to 163 in the overall population. Applying this difference in cost to the
cost-utility
analysis reduces the ICER from 3,516 in the overall population to 1,129 in
this sub-
group. Threshold analysis of the number of tests per day in the high HbAl c
group, as
illustrated in FIG. 21J, shows that cost neutrality with SMBG would be
achieved when
carrying out approximately 6.5 tests per day.
As reflected in the data outlined above, the ABCD nationwide audit
demonstrates
that the FreeStyle Libre system use is associated with improved outcomes,
resulting in
reduced diabetes-related resource utilization in T1 DM populations in the real
world. In
an average sized local health economy in England (population size of 1,790
11DM),
increasing the proportion of people using the FreeStyle Libre system by 30% in
year 1 to
CA 03179837 2022- 11- 22
WO 2021/237225
PCT/US2021/033947
103
50% in year 2 increased costs by 3.4%. Similarly increasing the FreeStyle
Libre system
uptake to 70% in year 3 increased the budget by a further 3.3%.
This increase in costs can be associated with patient and healthcare system
benefits including improved glucose monitoring, reduced hospital admissions
and
improved quality of life from discreet and easy to use sensing technology. In
this
embodiment, the cost utility analysis estimated an ICER of 3,516 per QALY
gained,
below 20,000 the 'willingness to pay' threshold typically applied in the
United
Kingdom deemed to represent good value. A further benefit of more widespread
use of
the FreeStyle Libre system is the access to glucose data in the cloud on
Libreview which
enables physicians to monitor people with diabetes remotely. Furthermore, the
data can
include time in range and the glucose management indicator which can be used
as a
substitute for quarterly HbAlc blood tests, further reducing system costs.
As illustrated above, widespread adoption of FreeStyle Libre system in T1DM
populations can offer benefits and have a relatively small budget impact
compared to the
total cost of glucose management to health economies in the United Kingdom
People
with T1DM and healthcare systems stand to benefit from the improved glycemic
control,
reduced diabetes related distress, reduced hospital admissions and the
opportunity of
virtual reviews which this easy to use monitoring solution provides.
Example 3
In this exemplary review, several studies were examined for evidence related
to
the flash glucose monitoring system in patients with T2D, although several
real-world
studies had mixed type 1 diabetes (T1D) and T2D populations. These studies are
tabulated in FIGS. 23A-B. Additional details of this embodiment are disclosed
in A
review of flash glucose monitoring in type 2 diabetes, which was originally
published in
Diabetology & Metabolic Syndrome, Volume 13, Article Number 42, 2021, BMC and
can be accessed at the web site
https://dmsjournal.biomedcentral.com/articles/10.1186/s13098-021-00654-3, and
is
incorporated by reference herein in its entirety.
To identify clinical trials of the flash glucose monitoring system, searches
were
conducted of PubMed and Google Scholar from inception to 30 June 2020 using
the
search terms flash glucose monitoring; continuous and/or intermittent glucose
monitoring; and FreeStyle Libre system. No language restrictions were applied.
Reference lists of retrieved papers were hand-searched for additional clinical
studies and
CA 03179837 2022- 11- 22
WO 2021/237225
PCT/US2021/033947
104
other articles of interest. Relevant abstracts presented at the American
Diabetes
Association Congress in June 2020 were also considered for inclusion.
The benefits of the flash glucose monitoring system in improving glycemia in
T1D were shown in the IMPACT randomized controlled trial (RCT) of 239
randomized
patients, and subsequently in a large real-world study (n=1913).
In the IMPACT study, which is incorporated by reference in its entirety
herein, of
adult patients with well-controlled T1D (glycosylated hemoglobin [HbAlc]
<7.5%),
flash glucose monitoring for 6 months significantly reduced the time spent in
hypoglycemia compared with SMBG (P<0.0001). The mean change from baseline of
¨1.39 vs. ¨0.14 hours/day equated to a 38% reduction. In this 6-month study,
the mean
SD number of scans/day recorded by the flash glucose monitoring device was
15.1 6.9,
which was almost triple the frequency of blood glucose testing (5.5 2.0
tests/day). A
prespecified subgroup analysis of the IMPACT trial showed the benefit of flash
glucose
monitoring in patients receiving multiple daily insulin injection therapy, as
evidenced by
a 46% reduction in time spent in hypoglycemia compared with S1V111G (mean
change
from baseline -1.65 vs. 0.00 hours/day; P <0.0001).
A 1-year observational real-world cohort study of adults with T1D treated in
specialist Belgian diabetes centers found that flash glucose monitoring
improved
treatment satisfaction and reduced severe hypoglycemia whilst maintaining
HbAlc
levels. Compared with the year before the study, flash glucose monitoring
reduced
admissions for severe hypoglycemia and/or ketoacidosis (3.3 vs. 2.2%;
P=0.031), and
reduced the incidence of reported severe hypoglycemic events (14.6 vs. 7.8%,
P>0.0001)
and hypoglycemic coma (2.7 vs. 1.2% P=0.001).
The REPLACE open-label randomized controlled trial (RCT) of adults with T2D,
which is incorporated by reference in its entirety herein, compared the
efficacy and
safety of flash glucose monitoring (n=149) with SMBG (n=75). The study
assessed the
effect of flash glucose monitoring on glycemic control in patients receiving
intensive
insulin therapy or continuous subcutaneous insulin infusion. Although no
significant
difference was observed between flash technology and SMBG in the outcome
measure
of change in HbAlc at 6 months (mean ¨0.29 vs. ¨0.31%, respectively),
prespecified
subgroup analyses demonstrated several benefits, as shown in FIG. 22A. The 6-
month
HbAl c level was significantly reduced in patients aged <65 years using the
flash system
compared with SMBG (mean ¨0.53 vs. ¨0.20%; P=0.030) although the trend was
CA 03179837 2022- 11- 22
WO 2021/237225
PCT/US2021/033947
105
reversed in patients aged >65 years (mean ¨0.05 vs. ¨0.49%; P=0.008). As
further
demonstrated in FIG. 22A, other glycemic measures significantly reduced with
flash
glucose monitoring compared with SMBG include time spent in hypoglycemia,
frequency of hypoglycemic events and area under the concentration-time curve
(AUC)
for glucose, with a reduction in each of these measures in inverse proportion
to the
glucose level. SMBG frequency from baseline to study end was decreased in
flash
glucose monitoring participants from a mean standard deviation (SD) of 3.8
1.4 to
0.3 0.7 tests/day. Treatment satisfaction, as assessed by the Diabetes
Treatment
Satisfaction Questionnaire, was higher in the flash glucose monitoring group
compared
with the SMBG group (mean SE 13.1 0.50 vs. 9.0 0.72; P<0.0001). No
serious
adverse events (SAEs) or severe hypoglycemic events were reported in
association with
the device.
A total of 139 participants in the flash glucose monitoring group of the
REPLACE RCT completed the 6-month treatment phase and continued into a 6-month
open-access phase. The mean changes from baseline (start of treatment period)
in
glycemic parameters measured at 12 months paralleled those measured at 6
months. In
FIG. 22A, reductions in sensor measures of time spent in hypoglycemia, number
of
hypoglycemic events, and glucose AUC were observed for open-access
participants at 12
months post-baseline compared with baseline, and the magnitude of change
increased as
glucose cut-off points decreased.
Time in range (sensor glucose 70-180 mg/dL) remained unchanged between
baseline and 12 months post-baseline (14.0 4.4 vs. 14.1 4.0 hours). Mean
SD
frequency of SMBG decreased from 3.9 1.2 tests/day at baseline to 0.2 0.6
tests/day
at 12 months post-baseline. During 12 months' use of the flash glucose
monitoring
device there were no reports of diabetic ketoacidosis or a state of
hyperosmolar
hyperglycemia. No SAEs were attributable to the device. Sixteen device-related
adverse
events (sensor adhesive or site reactions) were reported in nine participants,
which were
classified as severe (n=4), moderate (n=9) or mild (n=3). All events resolved
after
treatment with mainly topical preparations.
Collectively, the 6-month REPLACE RCT and follow-on 6-month open-access
study showed that, in individuals with T2D managed by intensive insulin
therapy, the
flash glucose monitoring system reduces hypoglycemia and is a safe alternative
to
SMBG. In the initial 6-month phase, the mean SD number of scans/day recorded
by
CA 03179837 2022- 11- 22
WO 2021/237225
PCT/US2021/033947
106
the flash glucose monitoring device was 8.3 4.4 (median 6.8), which was
double the
frequency of blood glucose testing (median 3.8 1.9 tests/day). Average
sensor-
scanning frequency during the extension phase was 7.1 3.5 times/day (median
5.7).
A further RCT compared the effect on glycemia of intermittent wearing of the
professional flash glucose monitoring sensor with SMBG in insulin-treated T2D
patients
with a HbAlc level between 7.5 and 12.0%. Patients performed SMBG (n=52,
control
group A), or SMBG plus flash sensor worn for two 14-day periods during 4.5
months
(n=46, intervention group B), or SMBG plus flash sensor worn for four 14-day
periods
during 7 months (n=50, intervention group C). No significant changes were
observed
within group C for sensor-derived time in range (70-180 mg/dL) from baseline
to
penultimate sensor wear (days 172-187; endpoint), with mean SD values of
15.0 5.0
and 14.1 4.7 hours/day, respectively, or for the difference versus the
control group at
study end (days 215-230). In group C, HbAl c was reduced significantly during
the study
period by a mean SD of 0.44% 0.81% (P=0.0003). At study end, HbAlc was
significantly reduced in group C compared with the control group by an
adjusted mean
SE of 0.48% 0.16% (P=0.004). In contrast, there was no significant
difference in
HbAl c between group B and control group at day 144 (P=0.133).
A further open-label RCT compared the effect of 10-week flash glucose
monitoring (n=53) or SMBG (n=48) on glycemic control in patients with T2D
receiving
multiple daily insulin injections. HbAlc was significantly reduced in the
flash device
group compared with SMBG, with mean changes from baseline of ¨0.82% and
¨0.33%,
respectively (P=0.005). Non-prespecified post hoc analyses showed that higher
proportions of patients in the flash device group, compared with the SMBG
group, had
HbAl c reductions of > 0.5% (68.6 vs. 30.2%; P<0.001), or of 1.0% (39.2 vs.
18.6%;
P=0.0023). No significant differences were found in the mean SD perceived
frequency
of hypoglycemic episodes: 1.41 1.29 vs. 0.75 1.57, respectively (P=0.066).
There
was a trend towards higher treatment satisfaction in the flash device group,
with a mean
Diabetes Treatment Satisfaction Questionnaire change version score of 2.47
0.77
compared with 2.18 0.83 in the standard care group (P=0.053). Patients found
flash
glucose monitoring to be significantly more flexible than SMBG (2.28 1.28
vs. 1.61
1.59, P=0.019), and more would recommend it to their counterparts (2.61 0.86
vs. 2.19
+ 1.04, P-0.023).
CA 03179837 2022- 11- 22
WO 2021/237225
PCT/US2021/033947
107
Further retrospective real-world chart review studies from three European
countries examined the effectiveness of flash glucose monitoring on HbAlc in
adults
with T2D managed by basal bolus insulin therapy. Medical records from centers
in
Austria (n=92), France (n=88) and Germany (n=183) were evaluated prior to, and
following, use of the device for 90 days. Mean SD changes in HbAlc were
¨0.9%
0.8% (P< 0.0001), ¨0.8% 1.1%(P <0.0001) and ¨0.9% 1.1% (P< 0.0001),
respectively. In a combined analysis of the three studies, the overall effect
size was
¨0.9% (P<0.0001 vs. baseline). There was no significant heterogeneity between
studies
performed in each country (P=0.711). No significant differences were recorded
for
changes in HbAl c according to age group, gender, body mass index, or duration
of
insulin use.
A real-world retrospective, observational study, which analyzed data from the
US
electronic health record database IBM Explorys, showed that de novo
prescription of
flash glucose monitoring significantly reduced HbAlc in T2D patients (n=1034)
not
using bolus insulin Mean HbA 1 c levels decreased from 10.1% at baseline to
8.6%
within 60-300 days of the flash glucose monitoring prescription (P<0.001).
Similarly,
another real-world retrospective study which analyzed claims data by the
Decision
Resources Group, a commercial medical and pharmacy claims database, showed a
significant reduction in HbAl c levels in T2D patients on long-acting insulin
or non-
insulin therapy after 6-month and 12-month use of flash glucose monitoring.
Mean
HbAl c was reduced by 0.8% (from 8.5% to 7.7%) in the 6-month T2D cohort
(n=774),
and by 0.6% (from 8.5% to 7.9%) in the 12-month T2D cohort (n=207) (both P
<0.0001).
Patient inclusion criteria differed among studies with some patient
populations
using intensive insulin therapy and others not. The 12-month General Practice
Optimising Structured Monitoring To achieve Improved Clinical Outcomes (GP-
OSMOTIC) trial, which compared professional-mode (masked) flash glucose
monitoring
with usual care (non-insulin glucose-lowering drugs, insulin, or both) in 299
adults with
T2D in primary care, reported a significant reduction in mean HbAlc with flash
monitoring at 6 months (-0.5%; P=0.0001) but not at 12 months (-0.3%;
P=0.059),
although the mean percentage of time spent in target glucose range at 12
months was
7.9% higher with flash monitoring than usual care (P-0.0060).
CA 03179837 2022- 11- 22
WO 2021/237225
PCT/US2021/033947
108
Two recent real-world retrospective, observational analyses of the MarketScan
database, which contains insurance billing claims for inpatient, outpatient,
and pharmacy
expenses, have shown benefits for flash glucose monitoring beyond glycemic
control. In
T2D patients not using bolus insulin (n=7167), de novo flash glucose
monitoring use
(purchased between Q4 of 2017 and Q4 of 2018) significantly reduced inpatient
and
outpatient emergency acute diabetes events from 0.071 to 0.052 events/patient-
year
(hazard ratio [1-1R]: 0.70; 95% CI: 0.57-0.85; P<0.001), and all-cause
hospitalization
from 0.180 to 0.161 events/patient-year (HR: 0.87; 95% CI: 0.78-0.98;
P=0.025). In
T2D patients receiving fast- or short-acting insulin, flash glucose monitoring
use
(purchased between Q4 of 2017 and Q2 of 2018) significantly reduced acute
diabetes
events from 0.158 to 0.077 events/patient-year (ER: 0.49; 95% CI: 0.34-0.69;
P<0.001)
and all-cause hospitalization from 0.345 to 0.247 events/patient-year (HR:
0.72; 95% CI:
0.58-0.88; P=0.002).
Further real-world observational studies from several world regions have
assessed the impact of flash glucose monitoring in often large groups of
patients with
T1D or T2D.
A retrospective nationwide study of reimbursement claims from a French
database assessed ketoacidosis rates in T1D (n=33,203) and T2D (n=40,955)
patients
who initiated flash glucose monitoring use during a 5-month study period in
2017.
Four studies assessed the benefits of flash glucose monitoring mainly on HbAl
c.
A Dutch prospective nationwide registry study which analyzed data from 1365
participants with T1D (77.2%), T2D (16.4%), Latent Autoimmune Diabetes in
Adults
(4.6%) or maturity-onset diabetes of the young (0.5%) examined the effect of
flash
glucose monitoring on HbAl c, disease burden and well-being. A cohort study
using data
from the Swedish National Diabetes Register (January 2014¨June 2019) assessed
the
effectiveness of the FreeStyle Libre system on HbAlc reduction. A meta-
analysis of 29
clinical trials and real-world studies, of which 25 reported longitudinal
HbAlc data in
1723 participants with T1D or T2D using the FreeStyle Libre system, examined
the
impact of flash glucose monitoring on HbAl c. A study from Israel assessed the
impact
of flash glucose monitoring on HbAlc in T2D (n=25) and T1D (n=6) patients.
Other studies assessed the impact of increased scanning frequency on glycemic
measures. A real-world European analysis examined deidentified data from more
than
50,000 users worldwide of the FreeStyle Libre system who had performed more
than 60
CA 03179837 2022- 11- 22
WO 2021/237225
PCT/US2021/033947
109
million scans over a 20-month period. To assess the role of flash glucose
monitoring in
early and late changes of glycemic markers under real-life conditions, a
longitudinal
study analyzed deidentified glucose results from 6802 flash monitors after
stratification
into high, medium and low-risk groups based on tertiles of time spent in
hypoglycemia
(min/day <70 mg/dL) or hyperglycemia (hours/day >240 mg/dL). Another large
real-
world study analyzed deidentified glucose and user scanning data (250 million
glucose
readings, 37.1 million glucose scans) collected over a 4-year period from
Spanish users
(n=22,949) to determine the relationship between testing frequency and
glycemic
parameters. An interesting study from Brazil analyzed glucose results captured
from
launch of the FreeStyle Libre flash glucose monitor in 2016 and compared them
with
global population data collected between September 2014 and December 2018.
Data
were analyzed from 688,640 readers and 7,329,052 sensors worldwide, including
17,691
readers and 147,166 sensors from Brazil.
As illustrated in FIG. 22B, four studies show that flash glucose monitoring
improved glycemic control, as assessed by 1lb Alc, compared with prior to its
use In the
Dutch prospective registry study, estimated HbAl c decreased from 8.0% before
use of
flash glucose monitoring to 7.6% after 6 months of use (P<0.001) and remained
steady at
7.6% at 12 months (P<0.001). The 12-month difference in estimated HbAlc was
more
pronounced in patients with T2D (n=223) than T1D (n=1054). Swedish National
Diabetes Register data also showed a significant decrease in HbAlc (method of
measurement unspecified) before and after incident FreeStyle Libre use, with a
mean
change of ¨0.33% for T1D patients (n=8,316) and ¨0.52% for T2D patients
(n=538) at
12 months (both P<0.0001). The meta-analysis of clinical trials and real-world
studies of
flash glucose monitoring indicated a mean change in laboratory HbAlc of ¨0.55%
at 2-4
months, with a negligible difference (-0.56% and ¨0.54%, respectively)
observed
between adults (n=1023) and children and adolescents (n=447). Longitudinal
analysis of
studies involving adult subjects (n=1276) showed that laboratory HbAlc was
reduced
within the first 2 months of use, and that changes were sustained for up to 12
months,
thus confirming a trend observed in a previous small study of flash glucose
monitoring in
patients with HbAl c >7.5%, in which the majority of change from baseline in
mean
HbAl c (method of measurement unspecified) occurred by 8 weeks (-1.33%;
P<0.0001)
and was maintained at 24 weeks (-1.21%; P-0.009).
CA 03179837 2022- 11- 22
WO 2021/237225
PCT/US2021/033947
110
Additional studies, illustrated in FIG. 22B, show that people who scan more
tend
to have lower HbAlc. In the European real-world analysis, greater scanning
frequency
from 4.4 (lowest) to 48.1 (highest) scans/day was associated with a reduction
in
estimated HbAlc from 8.0% to 6.7% (P<0.001). In the real-world study of
Spanish users
of the flash glucose monitoring device, estimated HbAl c was significantly
lower in the
highest (39.6 scans/day) versus lowest (3.9 scans/day) scan frequency group
(6.9 vs.
8.0%; P<0.001). Similarly, the Brazilian study found that, in line with
worldwide data,
increased scanning frequency in Brazil was associated with better glycemic
control, as
evidenced by a lower estimated HbAl c in the highest (43.1 scans/day) versus
lowest (3.6
scans/day) scan rate groups (6.7 vs. 7.6%; P<0.01).
FIG. 22C further illustrates results from four real-world studies showing that
increased scanning frequency of the flash monitoring device was associated
with benefits
on glycemic measures apart from HbAl c.
In a European analysis, greater scanning frequency was inversely correlated
with
time spent in hypoglycemia and hyperglycemia For blood glucose levels <70
mg/dL,
<56 mg/dL and <45 mg/dL, time in hypoglycemia was lower by 15%, 40% and 49%,
respectively (all P<0.001) in the highest (48.1 scans/day) compared with the
lowest (4.4
scans/day) scan rate group. Highest versus lowest scanning frequency was also
associated with a 44% decrease (P<0.001) in time spent in hyperglycemia and a
40%
increase in time in range. Six-month data from the real-world longitudinal
study showed
that, in the high-risk hypoglycemia group, flash glucose monitoring
significantly
(P<0.0001) reduced the mean time spent in hypoglycemia (blood glucose < 70
mg/dL)
from the first to last 14-day periods of the study, irrespective of scanning
frequency
(high, medium, or low). In the high-risk hyperglycemia group, flash glucose
monitoring
reduced the time spent in hyperglycemia (blood glucose >240 mg/dL) by 0.8
hours/day
in higher-frequency scanners (P<0.0001), by 0.3 hours/day in medium-frequency
scanners (P=0.02), and had no effect in low-frequency scanners from the first
to last 14-
day periods of the study.
In a real-world study of Spanish users of the flash glucose monitoring device,
glucose parameters progressively improved as average scanning frequency
increased
from the lowest (3.9 scans/day) to highest (39.6 scans/day) scan rate group.
Time in
hypoglycemia for blood glucose thresholds of <70 mg/dL and <54 mg/dL,
respectively,
was decreased by 14% and 37% in the highest versus lowest scan rate group.
Respective
CA 03179837 2022- 11- 22
WO 2021/237225
PCT/US2021/033947
111
times in hypoglycemia for the highest and lowest scan rate groups were 85.3
and 99.2
min/day (P<0.001) for blood glucose <70 mg/dL; and 29.7 min/day and 46.8
min/day for
blood glucose <54 mg/dL. Time spent in hyperglycemia (blood glucose >180
mg/dL)
was decreased by 37% (P<0.001), and time in range was increased by 36%
(P<0.001)
and in the highest versus lowest scan rate group. A comparison of sensor data
derived
from flash glucose monitoring users in Brazil and worldwide showed significant
(P<0.01) improvements in time spent in hyperglycemia (blood glucose >180
mg/dL)
associated with highest versus lowest scanning frequency: 43.1 and 3.6
scans/day,
respectively, in Brazil; 37.8 and 3.4 scans/day, respectively, worldwide. In
both
populations, greater scanning frequency also increased time in range (blood
glucose 70-
180 mg/dL).
The retrospective study analyzing reimbursement claims from a French database
showed a marked reduction in ketoacidosis rates in patients who initiated
flash glucose
monitoring during a 5-month study period in 2017. The hospitalization rate for
ketoacidosis (excluding incidence for coma) was reduced by 52% (from 5.5 to
2.6 per
100 patient-years) and by 47% (from 1.7 to 0.9 per 100 patient-years) in T1D
and T2D
patients, respectively.
In a Dutch prospective registry study, 12-month use of flash glucose
monitoring
significantly reduced the proportion of patients experiencing any hypoglycemic
event
from 93.5% to 91.0%, the proportion of diabetes-related hospitalization from
13.7% to
4.7%; and work absenteeism from 18.5% to 7.7% (all comparisons P<0.05). In
addition,
flash glucose monitoring improved 12-month well-being scores, with changes
from
baseline of 0.03 (95% CI 0.01-0.05) in the EuroQol 5D tariff, 4.4(95% CI 2.1-
6.7) in
the EQ-visual analogue scale, and 3.3 (95% CI 2.1-4.4) in the 12-Item Short
Form
Health Survey v2 mental component score.
While the disclosed subject matter is described herein in terms of certain
illustrations and examples, those skilled in the art will recognize that
various
modifications and improvements may be made to the disclosed subject matter
without
departing from the scope thereof. Moreover, although individual features of
one
embodiment of the disclosed subject matter may be discussed herein or shown in
the
drawings of one embodiment and not in other embodiments, it should be apparent
that
individual features of one embodiment may be combined with one or more
features of
another embodiment or features from a plurality of embodiments.
CA 03179837 2022- 11- 22
WO 2021/237225
PCT/US2021/033947
112
In addition to the specific embodiments claimed below, the disclosed subject
matter is also directed to other embodiments having any other possible
combination of
the dependent features claimed below and those disclosed above. As such, the
particular
features presented in the dependent claims and disclosed above can be combined
with
each other in other manners within the scope of the disclosed subject matter
such that the
disclosed subject matter should be recognized as also specifically directed to
other
embodiments having any other possible combinations. Thus, the foregoing
description of
specific embodiments of the disclosed subject matter has been presented for
the purposes
of illustration and description. It is not intended to be exhaustive or to
limit the disclosed
subject matter to those embodiments disclosed.
The description herein merely illustrates the principles of the disclosed
subject
matter. Various modifications and alterations to the described embodiments
will be
apparent to those skilled in the art in view of the teachings herein.
Accordingly, the
disclosure herein is intended to be illustrative, but not limiting, of the
scope of the
disclosed subject matter.
CA 03179837 2022- 11- 22