Note: Descriptions are shown in the official language in which they were submitted.
WO 2022/187744
PCT/US2022/019165
CHAPERONIN-CONTAINING TCP-1 INHIBITORS FOR THE
TREATMENT OF CANCER
CROSS REFERENCE TO REALTED APPLICATIONS
1. This application claims the benefit of priority to U.S. Provisional
Application No.
63/157,051, filed March 5, 2021, which is incorporated by reference herein in
its entirety.
BACKGROUND
2. Breast cancer is the most common cancer among women and a leading cause
of death.
Worldwide estimates of age-standardized incidence rate and mortality rate for
breast cancer is
46.3 and 13.0 per 100,000, respectively. Breast cancer is typically classified
based on the
expression of estrogen receptor (ER), progesterone receptor (PR), and human
epidermal growth
factor receptor 2 (HER2). The main molecular subtypes of breast cancer are:
luminal A, which is
hormone-receptor positive (ER+PR+HER2-, Ki67 low), low grade, grows slowly and
has the
best prognosis; luminal B, which is also hormone-receptor positive (ER+PR+
HER2+/-, Ki67
high), grows faster than luminal A and has a worse prognosis; HER2 positive or
enriched, which
is hormone receptor negative but HER2 positive (ER-PR-HER2+), grows faster
than luminal
cancers, and has a worse prognosis; and triple negative (TNBC) or basal, which
is hormone
receptor negative (ER-PR-HER2-), is more invasive, is common in women with
BRCA1
mutations and cannot be treated with endocrine therapies or HER2 inhibitors as
with the other
subtypes. These subtypes of breast cancer help stratify patients and impact
prognostic
predictions and therapeutic decision making. However, breast cancer is a
heterogenous disease
with complexities that go beyond these subtypes. Loss of tumor suppressors and
amplification of
oncogenes are common in breast tumors. Gene amplification is the most frequent
genetic
alteration in breast cancer with MYC, CCND1, epidermal growth factor receptor
(EGFR),
fibroblast growth factor receptor (FGFR), CDK4, and MDM2 being the genes most
frequently
amplified in primary and recurrent breast tumors. Genetic alterations in these
genes correlate
with patient prognosis and clinicopathological features and their therapeutic
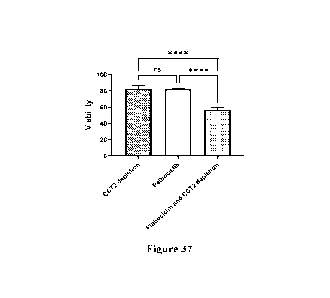
targeting remains
the goal of precision medicine. What is needed are compositions and methods to
diagnosing and
treating cancers.
1
CA 03210821 2023- 9- 1
WO 2022/187744
PCT/US2022/019165
SUMMARY
3. Disclosed herein are methods for treating, preventing, reducing, and/or
inhibiting a
cancer and/or metastasis in a subject. Also disclosed herein are methods for
diagnosing cancers.
4. The details of one or more embodiments of the invention are set forth in
the accompa-
nying drawings and the description below. Other features, objects, and
advantages of the
invention will be apparent from the description and drawings, and from the
claims.
5. In some aspects, disclosed herein are methods of treating, inhibiting,
decreasing,
reducing, ameliorating, and/or preventing a cancer and/or metastasis in a
subject in need thereof,
comprising administering to the subject a therapeutically effective amount of
a chaperonin-
containing TCP1 (CCT) inhibitor. In some embodiments, the CCT inhibitor
described herein is a
CCT1 inhibitor, a CCT2 inhibitor, a CCT3 inhibitor, a CCT4 inhibitor, a CCT5
inhibitor, a
CCT6 inhibitor, a CCT7 inhibitor, or a CCT8 inhibitor. In some embodiments,
the CCT inhibitor
is a CCT2 inhibitor.
6. In some embodiments, the CCT inhibitor comprises a small molecule, an
antibody, a
peptide, a polypeptide, a small interfering RNA (siRNA), or a short hairpin
RNA.
7. In some examples, the method disclosed herein further comprises
administering to the
subject a therapeutically effective amount of a cell cycle inhibitor. In some
embodiments, the
cell cycle inhibitor comprises a CCND1 inhibitor, a CDK2 inhibitor, or a CDK4
inhibitor (for
example, palbociclib, ribociclib, or abemaciclib).
8. In some embodiments, the cancer is a metastatic cancer. In some
embodiments, the
cancer is sarcoma, glioma, melanoma, lymphoma, or a breast cancer. In some
embodiments, the
breast cancer comprises luminal A breast cancer, luminal B breast cancer,
estrogen
receptor(ER)- progesterone receptor(PR)- HER2+ breast cancer, or triple
negative breast cancer.
9. In some embodiments, the cancer is a pediatric cancer. In some
embodiments, the
pediatric cancer is neuroblastoma, clear cell sarcoma of the kidney (CCSK),
Wilms tumor,
Rhabdoid tumor of the kidney (RTK), rhabdomyosarcoma, or Choroid plexus
carcinoma.
10. In some embodiments, cancer cells obtained from the subject have an
increased level of
one or more tumor biomarkers selected from the group consisting of MYC, MYCN,
CDK2,
CDK4, CCNE1, CCND1, YAP1, and RBI relative to a reference control.
11. Also disclosed herein are methods of treating, inhibiting, decreasing,
reducing,
ameliorating, and/or preventing a drug-resistant cancer and/or metastasis in a
subject in need
thereof, comprising administering to the subject a therapeutically effective
amount of a
chaperonin-containing TCP1 (CCT) inhibitor. In one example, the drug-resistant
cancer and/or
2
CA 03210821 2023- 9- 1
WO 2022/187744
PCT/US2022/019165
metastasis is resistant to a cell cycle inhibitor. In one example, the drug-
resistant cancer and/or
metastasis is resistant to a CDK4 inhibitor.
12. Also disclosed herein is a method of diagnosing a subject as
having a cancer, comprising
a) quantifying a level of a chaperonin-containing TCP1 (CCT) relative to a
reference control;
b) determining the subject as having the cancer when the level of CCT is
higher than the
reference control; and c) determining the subject as not having the cancer
when the level of CCT
is lower than the reference control.
13. In some embodiments, the method further comprises
administering to the subject a
therapeutically effective amount of the CCT inhibitor disclosed herein.
DESCRIPTION OF DRAWINGS
14. Figure 1(A-D). Co-occurrence of CCT2 genetic alterations with
cell cycle gene
alterations is suggestive of functional relationships. (Figure lA and 1B) The
TCGA PanCancer
database was evaluated using cBioPortal for CCT2 and CCT3 genetic alterations
(Figure 1A)
and overall and progression free survival of patients (Figure 1B) in CCT2
altered and unaltered
groups. (Figure 1C) Copy number alterations and mutation profiles for MCF7 and
T47D cell
lines based on CCLE data exported using cBioPortal are shown. (Figure 1D) CCT
mutation and
expression in T47D and MCF7 cells was obtained from the COSMIC database.
15. Figure 2(A-C). CCT2-FLAG is overexpressed inT47D and MCF7
breast cancer cell line.
(Figure 2A) Expression of GFP by cells transduced with lentiviral CCT2-FLAG
and control
vectors is shown. (Figure 2B) Western blot for exogenous CCT2-FLAG (anti-FLAG
antibody),
total CCT2 (N-terminal specific anti-CCT2 antibody), and endogenous CCT2 (C-
terminal
specific anti-CCT2 antibody) proteins. Data were normalized to total protein.
Representative
blots are shown, and data replicates summarized in the graph. (Figure 2C)
Relative mRNA
expression for total CCT2 and exogenous CCT2-FLAG was determined by RT-qPCR.
GAPDH
was used as a reference gene. Calculations were based on using the equation 2-
AA Ct equation.
****p-value <0.00005.
16. Figure 3(A-D). CCT2 enhances the formation of spheroids by
breast cancer cells. (Figure
3A and 3B) Merged brightfield and GFP images from T47D and MCF7 spheroids
grown on 24-
well ULA flat bottom plates at days 3, 5, and 8 of 3D culture. Magnification
was 2.5X. (Figure
3B) Total spheroid cell count per well for T47D and MCF7 cells is shown. Cells
were
dissociated from spheroids and counted using flow cytometry. (Figure 3C)
Merged brightfield
and GFP images of T47D and MCF7 spheroids grown on 96-well ULA round bottom
plates at
3
CA 03210821 2023- 9- 1
WO 2022/187744
PCT/US2022/019165
days 3. 5, and 8 of spheroid growth. Magnification was 2.5X. Spheroids from 96-
well ULA
plates were used for perimeter measurements. (Figure 3D) Relative mRNA
expression for total
CCT2 and exogenous CCT2-FLAG was determined by RT-qPCR. GAPDH was used as
reference gene. **p-value <0.005, *** p-value < 0.0005, **** p-value <0.00005.
17. Figure 4(A-B). CCT2 depletion impairs breast cancer spheroid formation.
(Figure 4A)
Brightfield images for E0771 cells at 24, 48, 72 hours after CCT2 depletion
using doxycycline to
induce CCT2 or control shRNA expression. CCT2 depletion was induced at day 3
spheroid of
spheroid growth. (Figure 4B) CCT2 depletion in E0771 cells was induced at day
0 (start of
spheroid cultures) and imaged at 48 hours and 72 hours after doxycycline was
used to induce
expression of CCT2 or control shRNA. Circles delineate the compact spheroid
core, while
arrows indicate the formation of loose cell aggregates.
18. Figure 5(A-B). CCT2 overexpression promotes adherence of breast cancer
cells in post-
3D spheroid cultures and increases intracellular actin. (Figure 5A)
Brightfield and GFP overlay
images of day 8 spheroids from T47D and MCF7, CCT2-FLAG overexpressing and
lentiviral
control, cells plated onto standard tissue culture plates are shown. Non-
adherent cells were
washed off and images were taken of adherent cells. Adherent cells were then
dissociated and
counted by flow cytometry. Magnification was 2.5X. (Figure 5B) Confocal
microscopy images
of F-actin (stained with green fluorescent phalloidin), DAPI and overlays of
the two signals are
shown for T47D, CCT2-FLAG overexpressing and lentiviral control, cells
Magnification was
40X. Fluorescent cells were quantified using ImageJ. * p-value <0.05, *** p-
value <0.0005,****
p-value <0.00005.
19. Figure 6(A-C). CCT2 supports transition of breast cancer cells from 3D
to 2D monolayer
culture. (Figure 6A) Brightfield microscopic images are shown of established
2D monolayer
cultures for spheroid derived T47D cells, CCT2-FLAG overexpressing and
lentiviral control.
Magnification was 20X. (Figure 6B) Brightfield and GFP microscopic images
showing results of
spheroid transfer to standard tissue culture plates at days 2 and 5 post-
transfer. Magnification
was 2.5X. (Figure 6C) Total CCT2 and CCT2-FLAG mRNA expression was evaluated
from
T47D and MCF7, CCT2-FLAG overexpressing and lentiviral control, cells grown in
2D post-3D
monolayer cultures. The equation used was 2-sA ct and GAPDH was the reference
gene as
previously described. * p-value <0.05, ** p-value <0.005.
20. Figure 7(A-D). CCT2 overexpression increases cell division of breast
cancer cells in 3D
cultures. (Figure 7A and 7B) The ViaFluork dye was used to assess cell
division over time for
T47D cells (Figure 7A) and MCF7 cells (Figure 7B), CCT2-FLAG overexpressing
and lentiviral
controls, from days 3-5 of spheroid 3D cultures. Cell division was assessed by
flow cytometry,
4
CA 03210821 2023- 9- 1
WO 2022/187744
PCT/US2022/019165
and the generation time (histograms) and percent cells divided (graph) was
determined. (Figure
7C and 7D) PI exclusion assay was used to assess the viability of cells from
spheroid cultures at
days 3,5, and 8 of 3D growth for T47D cells (Figure 7C) and MCF7 cells (Figure
7D). Data was
acquired using a CytoFlex S flow cytometer and analyzed using FCS Express
software. * p-
value <0.05, **p- value <0.005, *** p-value <0.0005, **** p-value < 0.00005.
21. Figure 8(A-D). CCT2 overexpression promotes progression of breast
cancer cells
through the Gl/S transtion. Proliferation of T47D and MCF7, CCT2-FLAG
overexpressing and
lentiviral control, cells in 2D cultures was synchronized after serum
deprivation and cell cycle
distribution was analyzed by PI staining of cells from 2D monolayer cultures
(Figure 8A and 8B)
and 2D post 3D cultures (Figure 8C and 8D). Data was acquired using the
CytoFlex S flow
cytometer and analyzed with FCS Express software.
22. Figure 9(A-C). CCT2 upregulates expression of MYC and cell cycle genes
in breast
cancer cells. (Figure 9A) Graphs show results of relative gene expression
measured as (-AACt)
for each gene in response to CCT2-FLAG overexpression in T47D and MCF7 cells
at days 0
(pre-spheroid), 3, 5, and 8 of 3D spheroid cultures. The MCF7 lentiviral
control was used as a
reference sample. This data was used to determine the multiple linear mixed
effect model shown
in Table 4. (Figure 9B) Cyclin D1 expression was evaluated in reference to
T47D lentiviral
control and statistical analysis shown in Table 4. (Figure 9C) Comparison of
gene expression
was measured (-AACt) for each gene in response to CCT-FLAG overexpression in
T47D and
MCF7 cells grown in 2D (pre-spheroid) and 2D post 3D/spheroid culture
separately. This data
was used to perform that multiple factor ANOVA analysis shown in Table 5.
23. Figure 10(A-C). CCT2 as a possible oncogene. (Figure 10A) Spearman
correlation
coefficients were determined to demonstrate gene interactions among MYC, CCNDI
(Cyclin
D1), and total CCT2 in MCF7 and T47D cells, CCT2 overexpressing and lentiviral
controls.
Results from the combined dataset are shown. Gene expression was measured as -
AACt using the
MCF7 lentiviral control as reference. The red colored squares indicate that
correlations were
significant with p-values <0.05. P-values were adjusted based on the Holm
multiple test
adjustment. (Figure 10B) The TCGA PanCancer dataset was analyzed for co-
expression of
CCT2 mRNA with MYC, CCND1, CCNEI, CDK2, and CDK4 mRNA. Spearman and Pearson
correlation p-values are shown. (Figure 10C) The CCT2 interaction network with
physical and
genetic integrators is shown (data from BioGRTD). Greater node size represents
increased
connectivity and thicker edge sizes represent increased evidence supporting
the association. The
list of CCT2 interactors is included in Table 6.
CA 03210821 2023- 9- 1
WO 2022/187744
PCT/US2022/019165
24. Figure 11(A-B). CCT3 expression in breast cancer CCT2-FLAG
overexpressing cells.
(Figure 11A) Representative immunoblot of CCT3 protein expression in T47D and
MCF7,
CCT2-FLAG overexpressing and lentiviral control, cells. Graph summarizes data
from blots that
was normalized to total protein. (Figure 11B) CCT3 relative mRNA expression
was assessed
using RT-qPCR. GAPDH was used as the reference gene.
25. Figure 12(A-B). CCT2 protein levels in spheroid cultures of breast
cancer cells. Graphs
show total CCT2 protein, CCT2-FLAG protein (anti-FLAG) and endogenous CCT2
protein
normalized to total protein in T47D (Figure 12A) and MCF7 (Figure 12B), CCT2-
FLAG
overexpressing and lentiviral control, cells. Data was determined from
immunoblots shown in in
Figure 13.
26. Figure 13(A-D). Immunoblots for CCT2 protein. Representative
immunoblots for CCT2
total protein expression in T47D (Figure 13A) and MCF7 (Figure 13B), CCT2-FLAG
(anti-
FLAG) and endogenous CCT2 in T47D (Figure 13C) and MCF 7(Figure 13D) at day 0
(2D
cultures, pre-spheroid), spheroid cultures on days 3, 5, and 8, and 2D post 3D
cultures. Total
protein stain is showed below each panel.
27. Figure 14(A-C). CCT2 protein levels in spheroid reversal cultures (2D
post 3D) of breast
cancer cells. Graphs show (Figure 14A) CCT2-FLAG (anti-FLAG), (Figure 14B)
total CCT2
protein, and (Figure 14C) endogenous CCT2 protein expression normalized to
total protein in
T47D and MCF7, CCT2- FLAG overexpressing and lentiviral control, cells. Cells
were grown in
3D spheroid cultures and then transferred to standard tissue culture plates
for 2D growth (2D
post 3D). Data was determined from immunoblots shown in in Figure 13.
28. Figure 15(A-B). Viability gating of breast cancer cells in spheroid
culture. T47D and
MCF7, CCT2- FLAG overexpressing and lentiviral control, cells were cultured on
ULA plates
and cells recovered for PI exclusion staining. Live cell gating on PI negative
cells on days 3, 5, 8
of spheroid growth is shown for T47D (Figure 15A) and MCF7 (Figure 15B) cells.
29. Figure 16(A-D). Serum deprivation causes cell cycle arrest of breast
cancer cells. T47D
and MCF7, CCT2-FLAG overexpressing and lentiviral control, cells were deprived
of sera for
24 hours, and cells were collected for analysis of cell cycle distribution
using PI staining. (Figure
16A-16D) Cell cycle distribution of T47D and MCF7 cells in standard 2D culture
(Figure 16A,
16B) and of cells transitioning from 3D to 2D culture (2D post 3D culture)
(Figure 16C, 16D).
30. Figure 17(A-D). Cell Cycle distribution of growth synchronized cultures
of breast cancer
cells. Growth arrested T47D and MCF7, CCT2-FLAG overexpressing and lentiviral
control,
cells were cultured in sera-containing media for 24 to 48 hours, and cells
were collected for
analysis of cell cycle distribution using PI staining. (Figure 17A-17D) Cell
cycle distribution of
6
CA 03210821 2023- 9- 1
WO 2022/187744
PCT/US2022/019165
147D and MCF7 cells in standard 2D culture (Figure 17A, 17B) and of cells
transitioning from
3D to 2D culture (2D post 3D culture) (Figure 17C, 17D).
31. Figure 18(A-C). CCT2 is located in an amplicon associated with cancer
progression.
CCT2 is found in 12q13-15 chromosomal region that is subject to recurrent
amplification in
cancer. (Figure 18A-18C) CCT2, MDM2, FRS2, YEATS4, CDK4 genetic alteration and
heatmap for mRNA expression the TCGA PanCancer Atlas studies combined, Sarcoma
(Figure
18A) and invasive breast carcinoma TCGA PanCancer studies (Figure 18B). Co-
amplification of
genes in the CCT2 altered group compared to unaltered group in invasive breast
carcinoma
(TCGA PanCancer studies) (Figure 18C).
32. Figure 19(A-D): CCT2 levels are present in pediatric cancers like
Neuroblastoma. Figure
19A. UCSC Xena data set TCGA (blue), TARGET (red) and GTEx (purple) cohort
(n=19,131)
comparing CCT2 gene expression levels. Figure 19B. UCSC Xena dataset TARGET
comparing
CCT2 gene expression in specific pediatric cancers. ALL: Acute Lymphoblastic
Leukemia,
AML: Acute Myeloid Leukemia. Figure 19C. KidsFirst dataset comparing CCT2 gene
expression in specific pediatric cancers. ATRT: Atypical Teratoid Rhabdoid
Tumor, DNET:
Dysembryoplastic neuroepithelial tumor, MPNST: Malignant peripheral nerve
sheath tumor,
SEGA: Subependymal giant cell astrocytoma. Glioma/astrocytoma: High-grade (WHO
grade
III/IV) vs low-grade (WHO grade I/II). Figure 19D. UCSC Xena TARGET dataset
focused on
neuroblastoma cases (n=167) comparing expression levels of several genes:
CeT2,MYC,
MYCN, CDK2, CDK-4, CCND1, CCNE1, YAP], and RB1.
33. Figure 20(A-B): Staining for CCT2 in pediatric Tissue microarrays.
Figure 20A.
Example images from CCT2 staining of PC701 pediatric TMA. CCT2 stain score is
listed below
each image. Figure 20B. Example images from CCT2 staining of NB642c
neuroblastoma TMA.
CCT2 stain score is listed below each image as well as CD56 and CgA score
given with TMA
data. All images were taken at 20x.
34. Figure 21(A-C): Levels of CCT2 in neuroblastoma cell lines. Figure 21A.
Nemours
database looking at mRNA expression for the 8 subunits of CCT in IMR32 vs
SKNAS. Colors
indicate changes in gene expression between cell lines. Red indicates that
gene expression
decreased in SK-N-AS cells compared to IMR-32 and green that gene expression
increased.
Expression of CCT subunits, except for CCT6B), was very robust (varying from
¨10,000-30,000
reads). Typical expressed products vary from ¨300-1000 reads. Reads less than
50 are
insignificant. Figure 21B. RT-PCR analysis of 1MR32 and SKNAS for CCT2 and
CCT3 gene
expression. MDA-MB-231 breast cancer cell line was used as reference. Figure
21C. Western
7
CA 03210821 2023- 9- 1
WO 2022/187744
PCT/US2022/019165
analysis of IMR32 and SKNAS for CCT2 and CCT3. MDA-MB-231 breast cancer cell
line was
used as reference.
35. Figure 22(A-C): Knockdown of CCT2 in SKNAS decreases viability and
IMR32 siRNA
treated cells had less actin. Figure 22A. Western analysis of SKNAS cells
transfected with
shRNA-GFP or shRNA-CCT2 before and after activation with doxy treatment.
Figure 22B.
MTT viability assay after transient knockdown of CCT2 in SKNAS with shRNA
plasmid.
Figure 22C. Representative images of Actin and DAPI staining in IMR32 cells
before and after
CCT2 siRNA treatment.
36. Figure 23(A-F): Overexpression of CCT2 in SKNAS and IMR32 cells leads
to increases
in RNA and protein. A-B. RT-PCR analysis for Total CCT2, CCT3 and FLAG in
SKNAS
(Figure 23A) and IMR32 (Figure 23B) after lentiviral transduction compared to
MDA-MB-231
and MCF7 breast cancer cell lines. Figure 23(C-D). Total protein and western
blots for CCT2,
CCT3, Endo CCT2, and FLAG in SKNAS (Figure 23C) and IMR32 (Figure 23D) after
lentiviral
transduction. Figure 23C) Lanes are: 1. MDA-MB-231, 2. MCF7, 3. And 4. SKNAS-
GFP, 5.
And 6. SKNAS-CCT2. Figure 23D) Lanes are: 1. MDA-MB-231, 2. MCF7, 3. And 4.
IMR32-
GFP, 5. And 6. IMR32-CCT2.MDA-MB-231 and MCF7 cell lines are used as
references. Figure
23(E-F). Quantification of bands from western blots in SKNAS (Figure 23) and
IMR32 (Figure
23F).
37. Figure 24(A-C): Functional assays of neuroblastoma cell lines show
minimal changes
due to CCT2 overexpression. Figure 24A. Migration assay comparing SKNAS-GFP
and
SKNAS-CCT2. Figure 24B. Actin and DAPI stainig in IMR32-GFP vs IMR32-CCT2 and
SKNAS-GFP vs SKNAS-CCT2. Figure 24C. Quantification of Actin stain.
38. Figure 25(A-E) CCT gene expression is increased in cancerous tissues
compared to
normal tissue. UCSC Xena database comparing all eight CCT subunits in normal
(GTEx) vs.
cancerous (TCGA) tissue. (Figure 25a) Overall cancer (n= 17,200): the most
significant
differences were observed in the CCT2 and CCT3 genes, and the least difference
was in the
CCT6B gene. (Figure 25b) Brain cancer (n= 1,277): the most significant
difference was seen in
the CCT2 gene, and the least difference was in the CCT6B gene. (Figure 25c)
Breast cancer (n=
1,660): the most significant differences were seen in the CCT3 and CCT8 genes
and the least
difference was in the CCT6B gene. (Figure 25d) Colon cancer (n= 598): the most
significant
difference was seen in the CCT2 gene, and the least difference was in the
CCT6B gene. (Figure
25e) Lung cancer (n= 1,301): the most significant differences were seen in the
CCT2 and CCT3
genes, and the least difference was in the CCT6B gene. p<0.0001 for all
samples.
8
CA 03210821 2023- 9- 1
WO 2022/187744
PCT/US2022/019165
39. Figure 26(A-B). Pediatric Cancers with Altered Expression of CCT
subunits. A pediatric
Pan-Cancer analysis for expression of CCT subunits was performed using the
TARGET
database. (Figure 26A) Analysis was performed by primary disease for all CCT
subunits.
CCT6B which is only expressed in testis is included as a negative control.
(Figure 26B) Analysis
was performed by primary disease for the CCT2 subunit. RT, Rhabdoid tumor;
AML, acute
myeloid leukemia; ALL, acute lymphoblastic leukemia; AML-IF, Induction Failure
AML;
NBL, Neuroblastoma; WT, Wilms tumor; CCSK, Clear cell sarcoma of the kidney.
Arrows
indicate results for neuroblastoma.
40. Figure 27 shows that CCT2 expression is increased in pediatric tumor
tissues. CCT2
protein levels were examined by immunohistochemistry using a pediatric
malignant tumor tissue
microarray (TMA) (PC701, US Biomax) with normal tissue, containing 21 cases of
nephroblastoma, 12 neuroblastoma plus, 7 endodermal sinus carcinoma, 4
retinoblastoma, 3
hepatoblastoma, 2 medulloblastoma, 4 lymphoma, 1 each of choroid plexus
papilloma,
glioblastoma, adrenocortical carcinoma, embryonal rhabdomyosarcoma,
ependymoma,
neuroblastoma, primitive neuroectodermal tumor, alveolus rhabdomy-osarcoma,
immaturity
teratoma, leiomyosarcoma, plus 7 normal tissue, single cores per case. Each
specimen was read
by an independent pathologist and the CCT staining score assigned based on the
published data
(Bassiouni et al, CCR, 2016). Representative images are shown. Table
summarizes results of
CCT2 staining score in TMA of pediatric cancer and normal tissues.
41. Figure 28 shows that CCT2 expression is increased in neuroblastoma
tissues. CCT2
protein levels were examined by immunohistochemistry using a neuroblastoma
tissue microarray
(TMA) (NB642c, US Biomax), containing 27 cases of neuroblastoma and 5
peripheral nerve
tissue, duplicate cores per case. Each specimen was read by an independent
pathologist and the
CCT staining score assigned based on our published data (Bassiouni et al, CCR,
2016).
Representative images for CCT2neg, CCT2lo and CCT2hi staining are shown. Table
summarizes results of CCT2 staining score in TMA of neuroblastoma and normal
tissues.
42. Figure 29(A-B) show that CCT2 (and CCT3) is highly expressed in
neuroblastoma cells.
(Figure 29A) Relative mR_NA expression for total CCT2 and CCT3 was determined
by RT-
qPCR (n=5) in IMR-32 and SK-N-As neuroblastoma cell lines. GAPDH was used as a
reference
gene. Calculations were based on using the equation 2-AA Ct equation. Values
are mean SD.
p-values were not significant. (Figure 29B) Data from Western blots for total
CCT2 (anti-CCT2
antibody), and total CCT2 (anti-CCT3 antibody) proteins in 1MR-32 and SK-N-AS
cell lines are
shown. Data were normalized to total protein (Revert stain). Data replicates
(n=2) summarized in
the graphs. *p-value <0.05 or ns, non-significant.
9
CA 03210821 2023- 9- 1
WO 2022/187744
PCT/US2022/019165
43. Figure 30(A-B). Cells that overexpress CCT2 are more resistant to luM
palbociclib than
control cells. (Figure 30A) Cell culture scheme for investigating long term
drug resistance to 1
p.M Palbociclib treatment is shown. (Figure 30B) Estimated cell growth curve
based on cell
confluency in culture plates.
44. Figure 31(A-B). CCT2 expression correlates with increased cell cycle
and glucose uptake
genes during treatment with palbociclib in T47D cells. (Figure 31A, 31B) Gene
expression of
cell cycle regulators and GLUT1 was examined using RT-qPCR. GAPDH was used as
a
reference gene. Day 0 represents cells cultured overnight, day 6 for 6 days of
Palbociclib
treatment, 2- or 3-days recovery for post-treatment in drug-free medium, for
T47D (Figure 31A)
and MCF7 (Figure 31B). Experiments were performed in triplicates. * p-value
<0.5, **p-value
<0.005, ***p-value <0.0005, ****p-value <.00005.
45. Figure 32(A-C). CCT2 expression increases during palbociclib treatment.
Figure 32(A-
B) Total CCT2 and CCT2-FLAG mRNA expression were assayed using RT-qPCR
relative to
GAPDH. Experiments were performed in triplicates on days 0 and 6 of 1 [IM
Palbociclib
treatment and on day 3 post-recovery (see Figure 29A). **p-value <0.005, ****p-
value
<0.00005. (Figure 32C) Total CCT2 mRNA was assessed at points indicated in
figure axis as
above from long term palbociclib treatment (see Figure 30A).
46. Figure 33(A-B). CCT2 protein levels decrease during palbociclib
treatment. (Figure 33A)
Relative protein levels of endogenous (endo) CCT2 (anti-CCT2-C-terminal), CCT2-
FLAG (anti-
FLAG), total CCT2 (anti-CCT2-N-terminal) and endogenous CCT3 were determined
by
immunoblot analysis in T47D (shown) and MCF-7 cells (not shown) stably
expressing CCT2-
FLAG or lentiviral control. Cells were treated with 1 p.M palbociclib for 6
days and then
recovered over 3 days (see Figure 29A). (Figure 33B) Relative protein levels
between CCT2-
FLAG and lentiviral control of CCT2 and CCT3 were normalized to total protein.
Error bars
represent the mean with s.e.m of technical replicates.
47. Figure 34(A-B). CCT2 protein is targeted for degradation through the
proteosome.
(Figure 34A) Relative protein levels of endogenous CCT2 (anti-CCT2-C-
terminal), CCT2-
FLAG (anti-FLAG), total CCT2 (anti-CCT2-N-terminal) and endogenous CCT3 were
determined by immunoblot analysis in 147D (shown) and MCF-7 (not shown) cells
stably
expressing CCT2-FLAG or lentiviral control. Cells were treated with
palbociclib, 1 i.tM, for 6
days (see Figure 29A) and treated with either 10 irM lactacystin (lacta)
(proteosome inhibitor) or
101,1g/m1 cycloheximide (cyclo) (protein synthesis inhibitor) for 5 hours.
(Figure 34B) Graphs
display relative CCT2 and CCT3 protein levels between CCT2-FLAG and lentiviral
control
CA 03210821 2023- 9- 1
WO 2022/187744
PCT/US2022/019165
cells. Results were normalized to total protein. Error bars represent the mean
with s.e.m of
technical replicates. A representative experiment of two performed is shown.
48. Figure 35(A-D). Monomeric CCT2 protein increases after palbociclib
treatment. Figure
35(A-B) Protein lysates from T47D (shown) and MCF-7 (not shown) cells stably
expressing
CCT2-FLAG or lentiviral control and treated with palbociclib, 1 j.tM, for 0-6
days (see Figure
14A) were run on a native non-denaturing gel. Membranes were probed for CCT2-
FLAG with
anti-FLAG antibody (Figure 35A, 35C) or total CCT2 with anti-N-terminal CCT2
antibody
(Figure 35B, 35D). CCT2 in the oligomeric complex (>900 kDa) and as a monomer
(¨ 60kDa)
are indicated by arrows.) Relative protein level of CCT2-containing oligomer
and CCT2
monomer in CCT2-FLAG and lentiviral control cells were normalized to total
protein. Error bars
represent the mean with s.e.m of technical replicates. A representative
experiment of two
performed is shown.
49. Figure 36(A-C). Depletion of CCT2 is achieved in luminal A breast
cancer cells. (Figure
36A) CCT2 depletion in T47D and MCF7 was achieved using a doxycycline-
inducible shRNA
lentiviral system. CCT2 mRNA expression in T47D (shown) and MCF7 (not shown)
after 48
and 72 hours 0.5 mg doxycycline addition for induction of shRNA. For RT-qPCR;
GAPDH was
used as a reference gene. (Figure 36B) CCT2 protein was assessed by western
blot for cells from
(A). Total protein staining was used for normalization. Data for T47D cells is
shown. (Figure
36C) Viability of CCT2 depleted and control T47D and MCF-7 cells was assessed
after 48 and
72 hours of shRNA induction by MTT assay. ns, not significant.
50. Figure 37. Combination treatment of CCT2 inhibition with palbociclib is
more effective
than treatments alone in luminal A breast cancer cells. T47D cells stably
expressing doxycycline
inducible CCT2 shRNA were treated with either 0.5 ug/ml doxycycline to induce
¨50%
depletion of CCT2 protein (see Fig. 24A) or 200 nM palbociclib or both for 4
days. Viability
was assessed by MTT assay. **** p< 0.00005.
51. Figure 38(A-B). CCT2 depletion in neuroblastoma cells decreases
viability. SK-N-AS
cells stably expressing doxycycline inducible CCT2 shRNA or control shRNA
(viral control)
were treated with 0.5 ug/ml doxycycline to induce depletion of CCT2 protein.
(Figure 38A)
Image of lenti-viral transduced cells. (Figure 38B) Viability was assessed by
MTT assay.
52. Figure 39(A-F). CT20p-nanoparticles reduce tumor growth and extend
survival in mice.
Figure 39(A-D) Growth curves of LNCaP prostate tumors implanted in male nude
mice (n=4)
treated intravenously (IV) 4 times (hatched lines) with 1001.1.1 of CT20p-
nanoparticles (1
mg/kg/dose) or PBS. (Figure 39B) Average weight of the PBS-treated and CT20p-
treated treated
mice at the end of the experiment. (Figure 39C) Tumor size comparison after
necropsy. (Figure
11
CA 03210821 2023- 9- 1
WO 2022/187744
PCT/US2022/019165
39D) Average weight of the PBS-treated and CT20p-treated tumors at the end of
the experiment.
Figure 39(E-F) MDA-MB-231 triple negative breast cancer cells were
orthotopically implanted
in mammary pad of female nude mice (n=4). Mice were treated three times IV
with 100 ul of
CT20p-nanoparticles (1 mg/kg/dose) (orange) or PBS (pink). Tumor growth
(Figure 39E) was
reduced, and survival (Figure 39F) was extended. AUC, area under the curve.
53. Figure 40(A-B). Neuroblastoma cells take up dye-loaded polymeric
nanoparticles. SK-N-
AS (Figure 40A) and IMR-32 (Figure 40B) cells were treated with 3 lug of DiI
dye-loaded
nanoparticles for 24 hours and uptake assessed using the Cytation 5 multi-
model plate reader.
Inset shows digitally magnified view of combined brightfield and fluorescence
overlay.
54. Figure 41. CT20p-nanoparticles kill neuroblastoma cells. IMR-32 cells
were treated with
PBS (vehicle control), and CT20p-nanoparticles at 100 ug/m1 and 200iug/m1
doses for 24 hours
and cells imaged using the Cytation 5 multi-model imaging reader. Inset was
digitally
magnified.
55. Figure 42(A-B). CCT2 overexpression reduces luminal A breast cancer
cell sensitivity to
CDK4/6 inhibitor, Palbociclib. Viability was determined using standard MTT
assay for cells
exposed to increasing concentration of Palbociclib for 6 days. CCT2-FLAG
expressing cells had
higher IC50 in T47D (Figure 42A) and MCF7 (Figure 42B) compared to lentiviral
control.
Model Fitting: [Inhibitor] vs. response (three parameters) was used to plot
dose-response curve
using GraphPad 9. Experiments were performed in quadruplicate.
56. Figure 43(A-E) CCT2 promotes cell cycle progression and proliferation
in the recovery
phase post-Palbociclib treatment. (Figure 43A) Timeline for palbociclib
treatment and recovery
phase is shown. (Figure 43B) Cell cycle analysis was performed by
intracellular PI staining after
6 days of Palbociclib treatment and 2-3 days of recovery post-Palbociclib
treatment. CCT2-
FLAG expressing and lentiviral control T47D and MCF7 cells were used. (Figure
43C)
Proliferation assay using ViaFluor 405 dilution dye to track cell division
over time in cells (from
above) in recovery phase post-Palbociclib treatment. (Figure 43D) Cell count
for cells (from
above) in recovery phase post-Palbociclib treatment. Counts acquired by flow
cytometry
(Cytoflex S). (Figure 43E) Colony-forming assay was performed for 10 days
during the recovery
phase post-Palbociclib treatment. Cells were stained with crystal violet.
Experiments were
performed in triplicates.
12
CA 03210821 2023- 9- 1
WO 2022/187744
PCT/US2022/019165
DETAILED DESCRIPTION
57. Before the present compounds, compositions, articles, devices, and/or
methods are
disclosed and described, it is to be understood that they are not limited to
specific synthetic
methods or specific recombinant biotechnology methods unless otherwise
specified, or to
particular reagents unless otherwise specified, as such may, of course, vary.
It is also to be
understood that the terminology used herein is for the purpose of describing
particular
embodiments only and is not intended to be limiting.
Definitions
58. Throughout this application, various publications are referenced. The
disclosures of
these publications in their entireties are hereby incorporated by reference
into this application in
order to more fully describe the state of the art to which this pertains. The
references disclosed
are also individually and specifically incorporated by reference herein for
the material contained
in them that is discussed in the sentence in which the reference is relied
upon.
59. As used in the specification and claims, the singular form "a," "an,"
and "the" include
plural references unless the context clearly dictates otherwise. For example,
the term "a cell"
includes a plurality of cells, including mixtures thereof
60. The term -about- as used herein when referring to a measurable value
such as an amount,
a percentage, and the like, is meant to encompass variations of +20%, 10%,
5%, or 1% from
the measurable value.
61. "Activate", "activating", and "activation" mean to increase an
activity, response,
condition, or other biological parameter. This may also include, for example,
a 10% increase in
the activity, response, "or condition, as compared to the native or control
level. Thus, the
increase can be a 10, 20, 30, 40, 50, 60, 70, 80, 90, 100%, or any amount of
reduction in between
as compared to native or control levels.
62. "Administration- to a subject or "administering- includes any route of
introducing or
delivering to a subject an agent. Administration can be carried out by any
suitable route,
including intravenous, intraperitoneal, and the like. Administration can be
carried out by any
suitable route, including oral, topical, intravenous, subcutaneous,
transcutaneous, transdermal,
intramuscular, intra-joint, parenteral, intra-arteriole, intradermal,
intraventricular, intracranial,
intraperitoneal, intralesional, intranasal, rectal, vaginal, by inhalation,
via an implanted reservoir,
or via a transdermal patch, and the like. Administration includes self-
administration and the
administration by another.
13
CA 03210821 2023- 9- 1
WO 2022/187744
PCT/US2022/019165
63. The term "antibodies" is used herein in a broad sense and includes both
polyclonal 5 and
monoclonal antibodies. As used herein, the term "antibody" encompasses, but is
not limited to,
whole immunoglobulin (i.e., an intact antibody) of any class. In addition to
intact immunoglobulin
molecules, also included in the term "antibodies" are fragments or polymers of
those
immunoglobulin molecules, and human or humanized versions of immunoglobulin
molecules or
fragments thereof It should be understood that the -antibody" can be
monoclonal antibodies,
polyclonal antibodies, chimeric antibodies, bi-specific antibodies (diabody),
or tri-specific
antibody (triabody).
64. The term -monoclonal antibody" as used herein refers to an antibody
obtained from a
substantially homogeneous population of antibodies, i.e., the individual
antibodies within the
population are identical except for possible naturally occurring mutations
that may be present in a
small subset of the antibody molecules. The monoclonal antibodies herein
specifically include
"chimeric" antibodies in which a portion of the heavy and/or light chain is
identical with or
homologous to corresponding sequences in antibodies derived from a particular
species or
belonging to a particular antibody class or subclass, while the remainder of
the chain(s) is identical
with or homologous to corresponding sequences in antibodies derived from
another species or
belonging to another antibody class or subclass, as well as fragments of such
antibodies, as long
as they exhibit the desired antagonistic activity.
65. The disclosed monoclonal antibodies can be made using any procedure
which produces
mono clonal antibodies. For example, disclosed monoclonal antibodies can be
prepared using
hybridoma methods, such as those described by Kohler and Milstein, Nature,
256:495 (1975). In
a hybridoma method, a mouse or other appropriate host animal is typically
immunized with an
immunizing agent to elicit lymphocytes that produce or are capable of
producing antibodies that
will specifically bind to the immunizing agent. Alternatively, the lymphocytes
may be immunized
in vitro.
66. As used herein, the term "antibody or fragments thereof' encompasses
chimeric antibodies
and hybrid antibodies, with dual or multiple antigen or epitope specificities,
and fragments, such
as F(ab')2, Fab', Fab, Fv, scFv, and the like, including hybrid fragments.
Thus, fragments of the
antibodies that retain the ability to bind their specific antigens are
provided. For example,
fragments of antibodies which maintain Annexin A2 binding activity are
included within the
meaning of the term "antibody or fragment thereof." Such antibodies and
fragments can be made
by techniques known in the art and can be screened for specificity and
activity according to the
methods set forth in the Examples and in general methods for producing
antibodies and screening
14
CA 03210821 2023- 9- 1
WO 2022/187744
PCT/US2022/019165
antibodies for specificity and activity (See Harlow and Lane. Antibodies, A
Laboratory Manual.
Cold Spring Harbor Publications, New York, (1988)).
67. The fragments, whether attached to other sequences or not, can also
include insertions,
deletions, substitutions, or other selected modifications of particular
regions or specific amino
acids residues, provided the activity of the antibody or antibody fragment is
not significantly
altered or impaired compared to the non-modified antibody or antibody
fragment. These
modifications can provide for some additional property, such as to remove/add
amino acids
capable of disulfide bonding, to increase its bio-longevity, to alter its
secretory characteristics, etc.
In any case, the antibody or antibody fragment must possess a bioactive
property, such as specific
binding to its cognate antigen. Functional or active regions of the antibody
or antibody fragment
may be identified by mutagenesis of a specific region of the protein, followed
by expression and
testing of the expressed polypeptide. Such methods are readily apparent to a
skilled practitioner
in the art and can include site-specific mutagenesis of the nucleic acid
encoding the antibody or
antibody fragment. (Zoller, M.J. Curr. Opin. Biotechnol. 3:348-354, 1992).
68. As used here, the terms "beneficial agent" and "active agent" are used
interchangeably
herein to refer to a chemical compound or composition that has a beneficial
biological effect.
Beneficial biological effects include both therapeutic effects, i.e.,
treatment of a disorder or other
undesirable physiological condition, and prophylactic effects, i.e.,
prevention of a disorder or
other undesirable physiological condition The terms also encompass
pharmaceutically
acceptable, pharmacologically active derivatives of beneficial agents
specifically mentioned
herein, including, but not limited to, salts, esters, amides, prodrugs, active
metabolites, isomers,
fragments, analogs, and the like. When the terms "beneficial agent- or "active
agent- are used,
then, or when a particular agent is specifically identified, it is to be
understood that the term
includes the agent per se as well as pharmaceutically acceptable,
pharmacologically active salts,
esters, amides, prodrugs, conjugates, active metabolites, isomers, fragments,
analogs, etc.
69. The term -biocompatible" generally refers to a material and any
metabolites or
degradation products thereof that are generally non-toxic to the recipient and
do not cause
significant adverse effects to the subject.
70. The term -biological sample" as used herein means a sample of
biological tissue or fluid.
Such samples include, but are not limited to, tissue isolated from animals.
Biological samples
can also include sections of tissues such as biopsy and autopsy samples,
frozen sections taken for
histologic purposes, blood, plasma, serum, sputum, stool, tears, mucus, hair,
and skin. Biological
samples also include explants and primary and/or transformed cell cultures
derived from patient
tissues. A biological sample can be provided by removing a sample of cells
from an animal, but
CA 03210821 2023- 9- 1
WO 2022/187744
PCT/US2022/019165
can also be accomplished by using previously isolated cells (e.g., isolated by
another person, at
another time, and/or for another purpose), or by performing the methods as
disclosed herein in
vivo. Archival tissues, such as those having treatment or outcome history can
also be used.
71. As used herein, the term "comprising" is intended to mean that the
compositions and
methods include the recited elements, but not excluding others. -Consisting
essentially of" when
used to define compositions and methods, shall mean excluding other elements
of any essential
significance to the combination. Thus, a composition consisting essentially of
the elements as
defined herein would not exclude trace contaminants from the isolation and
purification method
and pharmaceutically acceptable carriers, such as phosphate buffered saline,
preservatives, and
the like. "Consisting of' shall mean excluding more than trace elements of
other ingredients and
substantial method steps for administering the compositions of this invention.
Embodiments
defined by each of these transition terms are within the scope of this
invention.
72. "Composition" refers to any agent that has a beneficial biological
effect. Beneficial
biological effects include both therapeutic effects, e.g., treatment of a
disorder or other
undesirable physiological condition, and prophylactic effects, e.g.,
prevention of a disorder or
other undesirable physiological condition. The terms also encompass
pharmaceutically
acceptable, pharmacologically active derivatives of beneficial agents
specifically mentioned
herein, including, but not limited to, a vector, polynucleotide, cells, salts,
esters, amides,
proagents, active metabolites, isomers, fragments, analogs, and the like_ When
the term
"composition" is used, then, or when a particular composition is specifically
identified, it is to be
understood that the term includes the composition per se as well as
pharmaceutically acceptable,
pharmacologically active vector, polynucleotide, salts, esters, amides,
proagents, conjugates,
active metabolites, isomers, fragments, analogs, etc.
73. A -control" is an alternative subject or sample used in an experiment
for comparison
purposes. A control can be "positive" or "negative." The term "reference
control" refers to a
level in detected in a subject in general or a study population (e.g., healthy
control).
74. By the term "effective amount" of a therapeutic agent is meant a
nontoxic but sufficient
amount of a beneficial agent to provide the desired effect (for example,
reduction of tumor size,
elimination of tumor, prevention or mitigation of metastasis, reversal of drug
resistance, or
sensitize a subject to an anti-cancer agent). The amount of beneficial agent
that is "effective"
will vary from subject to subject, depending on the age and general condition
of the subject, the
particular beneficial agent or agents, and the like. Thus, it is not always
possible to specify an
exact "effective amount." However, an appropriate "effective" amount in any
subject case may
be determined by one of ordinary skill in the art using routine
experimentation. Also, as used
16
CA 03210821 2023- 9- 1
WO 2022/187744
PCT/US2022/019165
herein, and unless specifically stated otherwise, an -effective amount" of a
beneficial can also
refer to an amount covering both therapeutically effective amounts and
prophylactically effective
amounts. An "effective amount" of a drug necessary to achieve a therapeutic
effect may vary
according to factors such as the age, sex, and weight of the subject. Dosage
regimens can be
adjusted to provide the optimum therapeutic response. For example, several
divided doses may
be administered daily or the dose may be proportionally reduced as indicated
by the exigencies
of the therapeutic situation.
75. A ''decrease" can refer to any change that results in a smaller amount
of a symptom,
disease, composition, condition, or activity. A substance is also understood
to decrease the
genetic output of a gene when the genetic output of the gene product with the
substance is less
relative to the output of the gene product without the substance. Also for
example, a decrease can
be a change in the symptoms of a disorder such that the symptoms are less than
previously
observed. A decrease can be any individual, median, or average decrease in a
condition,
symptom, activity, composition in a statistically significant amount. Thus,
the decrease can be a
1, 2, 3, 4, 5, 6, 7, 8, 9, 10, 15, 20, 25, 30, 35, 40, 45, 50, 55, 60, 65, 70,
75, 80, 85, 90, 95, or
100% decrease so long as the decrease is statistically significant.
76. "Inhibit", "inhibiting," and "inhibition" mean to decrease an activity,
response, condition,
disease, or other biological parameter. This can include but is not limited to
the complete
ablation of the activity, response, condition, or disease. This may also
include, for example, a
10% reduction in the activity, response, condition, or disease as compared to
the native or
control level. Thus, the reduction can be a 10, 20, 30, 40, 50, 60, 70, 80,
90, 100%, or any
amount of reduction in between as compared to native or control levels.
77. "Inhibitors," of expression or of activity are used to refer to
inhibitory molecules,
respectively, identified using in vitro and in vivo assays for expression or
activity of a described
target protein, e.g., ligands, antagonists, and their homologs and mimetics.
Inhibitors are agents
that, e.g., inhibit expression or bind to, partially or totally block
stimulation or protease activity,
decrease, prevent, delay activation, inactivate, desensitize, or down regulate
the activity of the
described target protein, e.g., antagonists. Samples or assays comprising
described target protein
that are treated with a potential inhibitor are compared to control samples
without the inhibitor to
examine the extent of effect. Control samples are assigned a relative activity
value of 100%.
Inhibition of a described target protein is achieved when the activity value
relative to the control
is about 80%, optionally 50% or 25, 10%, 5% or 1%. It should be understood
that the CCP
inhibitor described herein can be an inhibitor for one or more other factors
(e.g., one or more
genes, proteins, mRNA) involved in the CCP pathway.
17
CA 03210821 2023- 9- 1
WO 2022/187744
PCT/US2022/019165
78. The term "nucleic acid" as used herein means a polymer composed of
nucleotides, e.g.
deoxyribonucleotides (DNA) or ribonucleotides (RNA). The terms "ribonucleic
acid" and
"RNA" as used herein mean a polymer composed of ribonucleotides. The terms
"deoxyribonucleic acid" and "DNA" as used herein mean a polymer composed of
deoxyribonucleotides. (Used together with -polynucleotide" and -polypeptide".)
79. "Pharmaceutically acceptable" component can refer to a component that
is not
biologically or otherwise undesirable, i.e., the component may be incorporated
into a
pharmaceutical formulation of the invention and administered to a subject as
described herein
without causing significant undesirable biological effects or interacting in a
deleterious manner
with any of the other components of the formulation in which it is contained.
When used in
reference to administration to a human, the term generally implies the
component has met the
required standards of toxicological and manufacturing testing or that it is
included on the
Inactive Ingredient Guide prepared by the U.S. Food and Drug Administration.
80. "Pharmaceutically acceptable carrier" (sometimes referred to as a
"carrier-) means a
carrier or excipient that is useful in preparing a pharmaceutical or
therapeutic composition that is
generally safe and non-toxic, and includes a carrier that is acceptable for
veterinary and/or
human pharmaceutical or therapeutic use. The terms "carrier" or
"pharmaceutically acceptable
carrier" can include, but are not limited to, phosphate buffered saline
solution, water, emulsions
(such as an oil/water or water/oil emulsion) and/or various types of wetting
agents.
81. As used herein, the term "carrier" encompasses any excipient, diluent,
filler, salt, buffer,
stabilizer, solubilizer, lipid, stabilizer, or other material well known in
the art for use in
pharmaceutical formulations. The choice of a carrier for use in a composition
will depend upon
the intended route of administration for the composition. The preparation of
pharmaceutically
acceptable carriers and formulations containing these materials is described
in, e.g., Remington's
Pharmaceutical Sciences, 21st Edition, ed. University of the Sciences in
Philadelphia, Lippincott,
Williams & Wilkins, Philadelphia, PA, 2005. Examples of physiologically
acceptable carriers
include saline, glycerol, DMSO, buffers such as phosphate buffers, citrate
buffer, and buffers
with other organic acids; antioxidants including ascorbic acid; low molecular
weight (less than
about 10 residues) polypeptides; proteins, such as serum albumin, gelatin, or
immunoglobulins;
hydrophilic polymers such as polyvinylpyrrolidone; amino acids such as
glycine, glutamine,
asparagine, arginine or lysine; monosaccharides, disaccharides, and other
carbohydrates
including glucose, mannose, or dextrins; chelating agents such as EDTA; sugar
alcohols such as
mannitol or sorbitol; salt-forming counterions such as sodium; and/or nonionic
surfactants such
as TWEENTM (ICI, Inc.; Bridgewater, New Jersey), polyethylene glycol (PEG),
and
18
CA 03210821 2023- 9- 1
WO 2022/187744
PCT/US2022/019165
PLURONICSTM (BASF; Florham Park, NJ). To provide for the administration of
such dosages
for the desired therapeutic treatment, compositions disclosed herein can
advantageously
comprise between about 0.1% and 99% by weight of the total of one or more of
the subject
compounds based on the weight of the total composition including carrier or
diluent.
82. The term "polynucleotide" refers to a single or double stranded polymer
composed of
nucleotide monomers.
83. The term "polypeptide" refers to a compound made up of a single chain
of D- or L-amino
acids or a mixture of D- and L-amino acids joined by peptide bonds.
84. The terms -peptide," -protein," and -polypeptide" are used
interchangeably to refer to a
natural or synthetic molecule comprising two or more amino acids linked by the
carboxyl group
of one amino acid to the alpha amino group of another.
85. The term -increased" or -increase" as used herein generally means an
increase by a
statically significant amount; for the avoidance of any doubt, -increased"
means an increase of at
least 10% as compared to a reference level, for example an increase of at
least about 20%, or at
least about 30%, or at least about 40%, or at least about 50%, or at least
about 60%, or at least
about 70%, or at least about 80%, or at least about 90% or up to and including
a 100% increase
or any increase between 10-100% as compared to a reference level, or at least
about a 2-fold, or
at least about a 3-fold, or at least about a 4-fold, or at least about a 5-
fold or at least about a 10-
fold increase, or any increase between 2-fold and 10-fold or greater as
compared to a reference
level.
86. The term -reduced-, "reduce", or "reduction as used herein generally
means a lowering
or decrease of an event or characteristic (e.g., tumor growth) by a
statistically significant amount.
However, for avoidance of doubt, "reduced" means a decrease by at least 10% as
compared to a
reference level, for example a decrease by at least about 20%, or at least
about 30%, or at least
about 40%, or at least about 50%, or at least about 60%, or at least about
70%, or at least about
80%, or at least about 90% or up to and including a 100% decrease (i.e. absent
level as compared
to a reference sample), or any decrease between 10-100% as compared to a
reference level.
87. The term -subject- is defined herein to include animals such as
mammals, including, but
not limited to, primates (e.g., humans), cows, sheep, goats, horses, dogs,
cats, rabbits, rats, mice
and the like. In some embodiments, the subject is a human. The term "patient-
refers to a
subject under the treatment of a clinician, e.g., physician.
88. As used herein, the terms -treating" or -treatment" of a subject
includes the
administration of a drug to a subject with the purpose of curing, healing,
alleviating, relieving,
altering, remedying, ameliorating, improving, stabilizing or affecting a
disease or disorder, or a
19
CA 03210821 2023- 9- 1
WO 2022/187744
PCT/US2022/019165
symptom of a disease or disorder. The terms -treating" and -treatment" can
also refer to
reduction in severity and/or frequency of symptoms, elimination of symptoms
and/or underlying
cause, and improvement or remediation of damage. Treatments according to the
invention may
be applied preventively, prophylactically, pallatively or remedially.
Prophylactic treatments are
administered to a subject prior to onset (e.g., before obvious signs of
cancer), during early onset
(e.g., upon initial signs and symptoms of cancer), or after an established
development of cancer.
89. By "prevent" or other forms of the word, such as "preventing" or
"prevention," is meant
to stop a particular event or characteristic, to stabilize or delay the
development or progression of
a particular event or characteristic, or to minimize the chances that a
particular event or
characteristic will occur. Prevent does not require comparison to a control as
it is typically more
absolute than, for example, reduce. As used herein, something could be reduced
but not
prevented, but something that is reduced could also be prevented. Likewise,
something could be
prevented but not reduced, but something that is prevented could also be
reduced. It is
understood that where reduce or prevent are used, unless specifically
indicated otherwise, the use
of the other word is also expressly disclosed.
90. "Therapeutically effective amount" or "therapeutically effective dose"
of a composition
(e.g. a composition comprising an agent) refers to an amount that is effective
to achieve a desired
therapeutic result. In some embodiments, a desired therapeutic result is the
control of a cancer.
In some embodiments, a desired therapeutic result is the control of
metastasis, or a symptom of a
cancer. Therapeutically effective amounts of a given therapeutic agent will
typically vary with
respect to factors such as the type and severity of the disorder or disease
being treated and the
age, gender, and weight of the subject. The term can also refer to an amount
of a therapeutic
agent, or a rate of delivery of a therapeutic agent (e.g., amount over time),
effective to facilitate a
desired therapeutic effect, such as elimination of a cancer or prevention of
relapse. The precise
desired therapeutic effect will vary according to the condition to be treated,
the tolerance of the
subject, the agent and/or agent formulation to be administered (e.g., the
potency of the
therapeutic agent, the concentration of agent in the formulation, and the
like), and a variety of
other factors that are appreciated by those of ordinary skill in the art. In
some instances, a
desired biological or medical response is achieved following administration of
multiple dosages
of the composition to the subject over a period of days, weeks, or years.
91. The term "cancer" as used herein is defined as disease characterized by
the rapid and
uncontrolled growth of aberrant cells. Cancer cells can spread locally or
through the bloodstream
and lymphatic system to other parts of the body. Cancer may include different
histological
types, cell types, and different stages of cancer, such as, for example,
primary tumor or
CA 03210821 2023- 9- 1
WO 2022/187744
PCT/US2022/019165
metastatic growth. Cancer may include, for example, breast cancer,
cholangiocellular carcinoma,
colorectal cancer, endometriosis, esophageal cancer, gastric cancer, diffused
type gastric cancer,
pancreatic cancer, renal carcinoma, soft tissue tumor, testicular cancer,
cardiac: sarcoma
(angiosarcoma, fibrosarcoma, rhabdomyosarcoma, liposarcoma), myxoma,
rhabdomyoma,
fibroma, lipoma and teratoma; Lung: bronchogenic carcinoma (squamous cell,
undifferentiated
small cell, undifferentiated large cell, adenocarcinoma), alveolar
(bronchiolar) carcinoma,
bronchial adenoma, sarcoma, lymphoma, chondromatous hanlartoma, inesothelioma,
non-small
cell lung cancer (NSCLC), small cell lung cancer (SCLC); Gastrointestinal:
esophagus
(squamous cell carcinoma, adenocarcinoma, leiomyosarcoma, lymphoma), stomach
(carcinoma,
lymphoma, leiomyosarcoma), pancreas (ductal adenocarcinoma, insulinoma,
glucagonoma,
gastrinoma, carcinoid tumors, vipoma), small bowel (adenocarcinoma, lymphoma,
carcinoid
tumors, Karposi's sarcoma, leiomyoma, hemangioma, lipoma, neurofibroma,
fibroma), large
bowel (adenocarcinoma, tubular adenoma, villous adenoma, hamartoma,
leiomyoma);
Genitourinary tract: kidney (adenocarcinoma, Wilm's tumor [nephroblastoma],
lymphoma,
leukemia), bladder and urethra (squamous cell carcinoma, transitional cell
carcinoma,
adenocarcinoma), prostate (adenocarcinoma, sarcoma), testis (seminoma,
teratoma, embryonal
carcinoma, teratocarcinoma, choriocarcinoma, sarcoma, interstitial cell
carcinoma, fibroma,
fibroadenoma, adenomatoid tumors, lipoma); Liver: hepatoma (hepatocellular
carcinoma),
cholangiocarcinoma, hepatoblastoma, angiosarcoma, hepatocellular adenoma,
hemangioma;
Bone: osteogenic sarcoma (osteosarcoma), fibrosarcoma, malignant fibrous
histiocytoma,
chondrosarcoma, Ewing's sarcoma, malignant lymphoma (reticulum cell sarcoma),
multiple
myeloma, malignant giant cell tumor chordoma, osteochronfroma
(osteocartilaginous exostoses),
benign chondroma, chondroblastoma, chondromvxofibroma, osteoid osteoma and
giant cell
tumors; Nervous system: skull (osteoma, hemangioma, granuloma, xanthoma,
osteitis
defornians), meninges (meningioma, meningiosarcoma, gliomatosis), brain
(astrocytoma,
medulloblastoma, glioma, ependymoma, germinoma [pinealomat glioblastoma,
glioblastoma
multiforin, oligodendroglioma, schwannoma, retinoblastoma, congenital tumors),
spinal cord
neurofibroma, meningioma, glioma, sarcoma); Gynecological: uterus (endometrial
carcinoma),
cervix (cervical carcinoma, pre-tumor cervical dysplasia), ovaries (ovarian
cancer, ovarian
carcinoma [serous cystadenocarcinoma, mucinous cystadenocarcinoma,
unclassified carcinoma],
granulosa-thecal cell tumors, SertoliLeydig cell tumors, dysgerminoma,
malignant teratoma),
vulva (squamous cell carcinoma, intraepithelial carcinoma, adenocarcinoma,
fibrosarcoma,
melanoma), vagina (clear cell carcinoma, squamous cell carcinoma, botryoid
sarcoma
(embryonal rhabdomyosarcoma], fallopian tubes (carcinoma); Hematologic: blood
(myeloid
21
CA 03210821 2023- 9- 1
WO 2022/187744
PCT/US2022/019165
leukemia [acute and chronic], acute lymphoblastic leukemia, chronic
lymphocytic leukemia,
myeloproliferative diseases, multiple myeloma, myelodysplastic syndrome),
Hodgkin's disease,
non-Hodgkin's lymphoma [malignant lymphoma], CML; Skin: melanoma, malignant
melanoma,
basal cell carcinoma, squamous cell carcinoma, Karposi's sarcoma, moles,
dysplastic nevi,
lipoma, angioma, dermatofibroma, keloids, psoriasis; and Adrenal glands:
neuroblastoma. In
some embodiments, the cancer comprises non-small cell lung cancer (NSCLC). In
some
embodiments, the cancer is resistant to a therapy. In some embodiments, the
cancer is not
resistant to a therapy.
92. The term -cancer cells" and -tumor cells" are used interchangeably to
refer to cells
derived from a cancer or a tumor, or from a tumor cell line or a tumor cell
culture.
93. The term -primary tumor- refers to a tumor growing at the site of the
cancer origin.
94. The term -metastatic tumor" refers to a secondary tumor growing at the
site different
from the site of the cancer origin.
Compositions and Methods of Treating Cancers
95. Inhibitors of the cell cycle are effective in the treatment of cancer
but their use in many
patients is hindered by the development of resistance. How to overcome the
limitations of single
agent inhibitors is the unmet medical need underlying our research. Chaperonin-
Containing
TCP1 (CCT), a multi-subunit protein folding complex, is highly expressed in
many cancers and
interacts with oncoproteins and mutated tumor suppressors. To date, the
complex multi-subunit
nature of CCT has challenged the development of targeted inhibitors. It is
shown herein that
overexpressing a single CCT subunit, CCT2, is sufficient to enhance cell
cycling in breast cancer
cells (e.g., luminal A breast cancer) and that these cells produce larger
spheroids in culture and
acquire invasive and metastatic-like characteristics. In these cells,
expression of CCT2 correlated
with MYC and CCND1, indicating that the chaperonin could be a node of
intersection for these
proliferative signals. Moreover, CCT2 is frequently genomically amplified in
cancerous cells
and is found in an amplicon associated with other oncogenes. These findings
collectively support
that the CCT2 subunit could be a potential oncogene whose therapeutic
targeting would inhibit
deregulated cell cycling factors like CCND1 and MYC and have application for
patients that
acquire resistance to front line treatments. In one aspect, disclosed herein
are methods of
treating, inhibiting, decreasing, reducing, ameliorating, and/or preventing a
cancer and/or
metastasis (such as, for example, sarcoma, glioma, melanoma, lymphoma, or a
breast cancer) in
a subject in need thereof, comprising administering to the subject a
therapeutically effective
amount of a chaperonin-containing TCP1 (CCT) inhibitor.
22
CA 03210821 2023- 9- 1
WO 2022/187744
PCT/US2022/019165
96. The CCT inhibitor described herein can be a CCT1 inhibitor, a CCT2
inhibitor, a CCT3
inhibitor, a CCT4 inhibitor, a CCT5 inhibitor, a CCT6 inhibitor, a CCT7
inhibitor, or a CCT8
inhibitor. In some embodiments, the CCT inhibitor is a CCT2 inhibitor.
97. In some embodiments, the CCT inhibitor comprises a small molecule, an
antibody, a
peptide, a polypeptide, a small interfering RNA (siRNA), or a short hairpin
RNA. In some
embodiments, the CCT inhibitor is a gene editing system, including, for
example, CRISPR-Cas9.
98. In some embodiments, the CCT inhibitor is a peptide, including, for
example, a CT20p
peptide. The CT2Op peptide is known in the art. See, e.g., U.S. Patent
Application Publication
No. 20170165318A1. incorporated by reference herein in its entirety. The CT20
peptide may
include SEQ ID NO: 1, SEQ ID NO: 2, SEQ ID NO: 3, SEQ ID NO: 4, SEQ ID NO: 5,
SEQ ID
NO: 6, any variant of SEQ ID NO:1-6 having at least 60% (e.g., at least 70%,
80%, 90%, 95%,
or 99%) sequence identity to SEQ ID NO: 1, SEQ ID NO: 2, SEQ ID NO: 3, SEQ ID
NO: 4,
SEQ ID NO: 5, or SEQ ID NO: 6, or a combination of two or more of the above.
99. In some embodiments, the CT20 peptide of the therapeutic regimen may be
delivered via
nanoparticles suitable for delivery of the CT20 peptide into a cancer cell.
The nanoparticles may
also include at least one type of targeting moiety, for example, a ligand for
a receptor expressed
by cancer cells. In some embodiments, the receptor expressed by cancer cells
is an EGF, HER2,
or folate receptor. In some embodiments, the CT20 peptide is linked to an
internalization
domain suitable for delivery of the CT20 peptide into a cancer cell.
100. As used herein, "nanoparticle" may refer to any nanostructure capable of
delivering
pharmaceutical compounds, nucleic acids, peptides, or proteins. Nanoparticles
may be naturally
or synthetically derived. In some aspects, "nanoparticles- may include plasma
vesicle particles,
liposomes, exosomes, protein-based particles, albumin particles, nucleic acid-
based particles,
natural polymers, synthetic polymers, hydrogels, dendrimers, silicon-based
materials, metal-
based materials, carbon-based materials, calcium-based materials, or a
combination of any of the
above. In some embodiments, the nanoparticle described herein are those
disclosed in U.S.
Patent No. 11,129,868, incorporated by reference herein in its entirety.
101. In an aspect, the nanoparticles are hyperbranched polyester polymeric
nanoparticles. In
an aspect, the nanoparticles are polymeric nanoparticles. In an aspect, the
nanoparticles can
comprise a targeting moiety. In an aspect, the targeting moiety can comprise a
targeting ligand.
In an aspect, the targeting ligand can be for a receptor expressed by cancer
cells. In an aspect, the
receptor expressed by cancer cells can be an EGF, HER2, or folate receptor. In
an aspect, the
receptor expressed by cancer cells can be any receptor known to the skilled
person to be
expressed by cancer cells. In some embodiments, the receptor may be know to be
expressed by
23
CA 03210821 2023- 9- 1
WO 2022/187744
PCT/US2022/019165
colon cancer cells, prostate cancer cells, lung cancer cells, liver cancer
cells, and/or breast cancer
cells.
102. In an aspect, the targeting ligand is a folate compound. In an aspect,
the targeting ligand
is a glutamate compound. In an aspect, the targeting ligand is a
polyglutamated folate compound.
In an aspect. the targeting ligand is glutamate azido urea. In an aspect, the
targeting ligand is
folate azido urea. In an aspect, the targeting ligand is glutamate azido urea.
In an aspect, the
targeting ligand is a bifunctional glutamate-folate hybridized compound. In an
aspect, the
targeting ligand is at high density. In an aspect, the targeting ligand is at
low density. In an
aspect, the targeting ligand is at high valency. In an aspect, the targeting
ligand is at low valency.
In an aspect, the targeting ligand is a substrate for a solid tumor-specific
cell protein.
103. In some examples, the method disclosed herein further comprises
administering to the
subject a therapeutically effective amount of a cell cycle inhibitor. In some
embodiments, the
cell cycle inhibitor comprises a CCND1 inhibitor, a CDK2 inhibitor, or a CDK4
inhibitor. In
some embodiments, the cell cycle inhibitor is a CDK4 inhibitor. The CDK4
inhibitor includes,
for example, palbociclib, ribociclib, or abemaciclib. In some embodiments, the
cell cycle
inhibitor is selected from the group consisting of lavopiridol, indisulam,
AZD5438, SNS-032,
bryostatin-1, seliciclib, PD 0332991, and SCH 727965. In some embodiments, the
cell cycle
inhibitor used herein is selected from the group consisting of flavopiridol,
SNS-032, AT7519,
dinaciclib, palbociclib, and P276-00. In some embodiments, the cell cycle
inhibitor is vincristine,
paclitaxel, or CYT997.
104. In some embodiments, the method described herein is effective on treating
a breast
cancer, including, for examples, luminal A breast cancer, luminal B breast
cancer, estrogen
receptor(ER)- progesterone receptor(PR)- HER2+ breast cancer, or triple
negative breast cancer.
105. In some embodiments, the method described herein is effective to treat a
pediatric cancer.
In some embodiments, the pediatric cancer is neuroblastoma, clear cell sarcoma
of the kidney
(CCSK), Wilms tumor, Rhabdoid tumor of the kidney (RTK), rhabdomyosarcoma, or
Choroid
plexus carcinoma.
106. In some embodiments, cancer cells obtained from the subject have an
increased level of
one or more tumor biomarkers selected from the group consisting of MYC, MYCN,
CDK2,
CDK4, CCNE1, CCND1, YAP1, and RB1 relative to a reference control. In some
embodiments,
the cancer cells obtained from the subject have an increased level of one or
more tumor
biomarkers selected from the group consisting of MYC (UniProtKB/Swiss-Prot:
P01106),
MYCN (UniProtKB/Swiss-Prot: P04198), CDK2 (UniProtKB/S wiss-Prot: P24941),
CDK4
(UniProtKB/Swiss-Prot: P11802), CCNE1 (UniProtKB/Swiss-Prot: P24864), CCND1
24
CA 03210821 2023- 9- 1
WO 2022/187744
PCT/US2022/019165
(UniProtKB/Swiss-Prot: P24385), YAP1 (UniProtKB/Swiss-Prot: P46937), and RB1
(UniProtKl3/Swiss-Prot: P06400) relative to a reference control. In some
embodiments, the
reference control is a non-cancerous cell or a cell obtained from a healthy
control.
107. Also disclosed herein are methods of treating, inhibiting, decreasing,
reducing,
ameliorating, and/or preventing a drug-resistant cancer and/or metastasis
(such as, for example,
sarcoma, glioma, melanoma, lymphoma, a breast cancer, or a pediatric cancer
disclosed herein)
in a subject in need thereof, comprising administering to the subject a
therapeutically effective
amount of a chaperonin-containing TCP1 (CCT) inhibitor.
108. In one example, the drug-resistant cancer is resistant to a cell cycle
inhibitor. In one
example, the drug-resistant cancer is resistant to a CDK4 inhibitor. In one
example, the drug-
resistance cancer and/or metastasis is resistance to chemotherapy.
109. In some embodiments, the administration of the CCT inhibitor sensitizes
the cancer to a
cell cycle inhibitor and/or chemotherapy. -Insensitivity" or -resistance" to a
drug means, but not
limited to, that a drug does not cause growth inhibition and/or death of a
cell (e.g., a cancer cell).
110. Accordingly, in some aspects, disclosed herein is a method of sensitizing
a subject to a
cycle inhibitor and/or chemotherapy, said method comprising administering to
the subject a
therapeutically effective amount of a CCT inhibitor, wherein the subject is
nonresponsive to a
cycle inhibitor and/or chemotherapy. For example, if the traditionally
recommended dosage of a
cell cycle inhibitor or chemotherapy agent can reduce tumor size or tumor cell
number in X
amount, then combination of a CCT inhibitor and a cell cycle inhibitor or
chemotherapy agent
can reduce tumor size or tumor cell number in an amount of about 10%, 20%,
50%, 80%, 100%,
2-fold, 4-fold, 10-fold, 50-fold, 100-fold, or 1000-fold or more.
111. The CCT inhibitor described herein can be a CCT1 inhibitor, a CCT2
inhibitor, a CCT3
inhibitor, a CCT4 inhibitor, a CCT5 inhibitor, a CCT6 inhibitor, a CCT7
inhibitor, or a CCT8
inhibitor. In some embodiments, the CCT inhibitor is a CCT2 inhibitor.
112. In some embodiments, the CCT inhibitor comprises a small molecule, an
antibody, a
peptide, a polypeptide, a small interfering RNA (siRNA), or a short hairpin
RNA. In some
embodiments, the CCT inhibitor is a gene editing system, including, for
example, CRISPR-Cas9.
113. In some embodiments, the CCT inhibitor is a peptide, including, for
example, a CT20p
peptide. The CT20p peptide is known in the art. See, e.g., U.S. Patent
Application Publication
No. 20170165318A1 incorporated by reference herein in its entirety.
114. In some examples, the method disclosed herein further comprises
administering to the
subject a therapeutically effective amount of a cell cycle inhibitor. In some
embodiments, the
cell cycle inhibitor comprises a CCND1 inhibitor, a CDK2 inhibitor, or a CDK4
inhibitor. In
CA 03210821 2023- 9- 1
WO 2022/187744
PCT/US2022/019165
some embodiments, the cell cycle inhibitor is a CDK4 inhibitor. The CDK4
inhibitor includes,
for example, palbociclib, ribociclib, or abemaciclib.
115. As the timing of onset of a cancer can often not be predicted, it should
be understood the
disclosed methods of treating, preventing, reducing, and/or inhibiting a
cancer can be performed
any time prior to the onset of the cancer or after the onset of the cancer. In
one aspect, the
disclosed methods can be employed 30, 29, 28, 27, 26, 25, 24, 23, 22, 21, 20,
19, 18, 17, 16, 15,
14, 13, 12, 11, 10, 9, 8, 7, 6, 5, 4, 3, 2 years, 22, 21, 20, 19, 18, 17, 16,
15, 14, 13, 12, 11, 10,9,
8, 7, 6, 5, 4, 3, 2 months, 30, 29, 28, 27, 26,25, 24, 23, 22, 21, 20, 19, 18,
17, 16, 15, 14, 13, 12,
11, 10, 9, 8, 7, 6, 5, 4, 3 days, 60, 48, 36, 30, 24, 18, 15, 12, 10, 9, 8, 7,
6, 5, 4, 3, 2 hours, 60, 45,
30, 15, 10, 9, 8, 7, 6, 5, 4, 3, 2, or 1 minute prior to the onset of the
cancer; or 1, 2, 3, 4, 5, 6, 7,
8,9, 10, 15, 20, 25, 30, 35, 40, 45, 50, 55, 60, 75, 90, 105, 120 minutes,
3,4, 5, 6, 7, 8, 9, 10, 11,
12, 15, 18,24, 30, 36, 48, 60 hours, 3, 4, 5, 6, 7, 8, 9, 10, 11, 12, 13, 14,
15, 16, 17, 18, 19,20,
21, 22, 23, 24, 25, 26, 27, 28, 29, 30, 45, 60, 90 or more days, 4, 5,6. 7,
8,9, 10, 11, 12 months,
2, 3, 4, 5, 6, 7, 8, 9, 10, 15, 20, 25, 30 or more years after the onset of
the cancer.
116. In one aspect, it is understood and herein contemplated that successful
treatment of a
cancer in a subject is important and doing so may include the administration
of additional
treatments. Thus, the disclosed treatments using CCT inhibitors disclosed
herein can further
include any anti-cancer therapy known in the art including, but not limited to
Abemaciclib,
Abiraterone Acetate, Abitrexate (Methotrexate), Abraxane (Paclitaxel Albumin-
stabilized
Nanoparticle Formulation), ABVD, ABVE, ABVE-PC, AC, AC-T, Adcetris
(Brentuximab
Vedotin), ADE, Ado-Trastuzumab Emtansine, Adriamycin (Doxorubicin
Hydrochloride),
Afatinib Dimaleate, Afinitor (Everolimus), Akynzeo (Netupitant and
Palonosetron
Hydrochloride), Aldara (Imiquimod), Aldesleukin, Alecensa (Alectinib),
Alectinib,
Alemtuzumab, Alimta (Pemetrexed Disodium), Aliqopa (Copanlisib Hydrochloride),
Alkeran
for Injection (Melphalan Hydrochloride), Alkeran Tablets (Melphalan), Aloxi
(Palonosetron
Hydrochloride), Alunbrig (Brigatinib), Ambochlorin (Chlorambucil), Amboclorin
Chlorambucil), Amifostine, Aminolev-ulinic Acid, Anastrozole, Aprepitant,
Aredia (Pamidronate
Disodium), Arimidex (Anastrozole), Aromasin (Exemestane),Arranon (Nelarabine),
Arsenic
Trioxide, Arzerra (Ofatumumab), Asparaginase Erwinia chrysanthemi,
Atezolizumab, Avastin
(Bevacizumab), Avelumab, Axitinib, Azacitidine, Bavencio (Avelumab), BEACOPP,
Becenum
(Carmustine), Bel eodaq (Belinostat), Belinostat, Bendamustine Hydrochloride,
BEP, Besponsa
(lnotuzumab Ozogamicin) , Bevacizumab, Bexarotene, Bexxar (Tositumomab and
Iodine 1 131
Tositumomab), Bicalutamide, BiCNU (Carmustine), Bleomycin, Blinatumomab,
Blincyto
(Blinatumomab), Bortezomib, Bosulif (Bosutinib), Bosutinib, Brentuximab
Vedotin, Brigatinib,
26
CA 03210821 2023- 9- 1
WO 2022/187744
PCT/US2022/019165
BuMel, Busulfan, Busulfex (Busulfan), Cabazitaxel, Cabometyx (Cabozantinib-S-
Malate),
Cabozantinib-S-Malate, CAF, Campath (Alemtuzumab), Camptosar, , (Irinotecan
Hydrochloride), Capecitabine, CAPDX, Carac (Fluorouracil--Topical),
Carboplatin,
CARBOPLATIN-TAXOL, Carfilzomib, Carmubris (Carmustine), Carmustine, Carmustine
Implant, Casodex (Bicalutamide), CEM, Ceritinib, Cerubidine (Daunorubicin
Hydrochloride),
Cervarix (Recombinant HPV Bivalent Vaccine), Cetuximab, CEV, Chlorambucil,
CHLORAMBUCIL-PREDNISONE, CHOP, Cisplatin, Cladribine, Clafen
(Cyclophosphamide),
Clofarabine, Clofarex (Clofarabine), Clolar (Clofarabine), CMF, Cobimetinib,
Cometriq
(Cabozantinib-S-Malate), Copanlisib Hydrochloride, COPDAC, COPP, COPP-ABV,
Cosmegen
(Dactinomycin), Cotellic (Cobimetinib), Crizotinib, CVP, Cyclophosphamide,
Cyfos
(Ifosfamide), Cyramza (Ramucirumab), Cytarabine, Cytarabine Liposome, Cytosar-
U
(Cytarabine), Cytoxan (Cyclophosphamide), Dabrafenib, Dacarbazine, Dacogen
(Decitabine),
Dactinomycin, Daratumumab, Darzalex (Daratumumab), Dasatinib, Daunorubicin
Hydrochloride, Daunorubicin Hydrochloride and Cytarabine Liposome, Decitabine,
Defibrotide
Sodium, Defitelio (Defibrotide Sodium), Degarelix, Denileukin Diftitox,
Denosumab, DepoCyt
(Cytarabine Liposome), Dexamethasone, Dexrazoxane Hydrochloride, Dinutuximab,
Docetaxel,
Doxil (Doxorubicin Hydrochloride Liposome), Doxorubicin Hydrochloride,
Doxorubicin
Hydrochloride Liposome, Dox-SL (Doxorubicin Hydrochloride Liposome), DTIC -
Dome
(Dacarbazine), Durvalumab, Efudex (Fluorouracil--Topical), Elitek
(Rasburicase), Ellence
(Epirubicin Hydrochloride), Elotuzumab, Eloxatin (Oxaliplatin), Eltrombopag
Olamine, Emend
(Aprepitant), Empliciti (Elotuzumab), Enasidenib Mesylate, Enzalutamide,
Epirubicin
Hydrochloride, EPOCH, Erbitux (Cetuximab), Eribulin Mesylate, Eriv edge
(Vismodegib),
Erlotinib Hydrochloride, Erwinaze (Asparaginase Erwinia chrysanthemi) , Ethyol
(Amifostine),
Etopophos (Etoposide Phosphate), Etoposide, Etoposide Phosphate, Evacet
(Doxorubicin
Hydrochloride Liposome), Everolimus, Evista , (Raloxifene Hydrochloride),
Evomela
(Melphalan Hydrochloride), Exemestane, 5-FU (Fluorouracil Injection), 5-FU
(Fluorouracil--
Topical), Fareston (Toremifene), Farydak (Panobinostat), Faslodex
(Fulvestrant), FEC, Femara
(Letrozole), Filgrastim, Fludara (Fludarabine Phosphate), Fludarabine
Phosphate, Fluoroplex
(Fluorouracil--Topical), Fluorouracil Injection, Fluorouracil--Topical,
Flutamide, Folex
(Methotrexate), Folex PFS (Methotrexate), FOLFIRI, FOLFIRI-BEVACIZUMAB,
FOLFIRI-
CETUXTMAB, FOLFIRTNOX, FOLFOX, Folotyn (Pralatrexate), FU-LV, Fulvestrant,
Gardasil
(Recombinant HPV Quadrivalent Vaccine), Gardasil 9 (Recombinant HPV Nonavalent
Vaccine), Gazyva (Obinutuzumab), Gefitinib, Gemcitabine Hydrochloride,
GEMCITABINE-
CISPLATIN, GEMCITABINE-OXALIPLATIN, Gemtuzumab Ozogamicin, Gemzar
27
CA 03210821 2023- 9- 1
WO 2022/187744
PCT/US2022/019165
(Gemcitabine Hydrochloride), Gilotrif (Afatinib Dimaleate), Gleevec (Imatinib
Mesylate),
Gliadel (Carmustine Implant), Gliadel wafer (Carmustine Implant),
Glucarpidase, Goserelin
Acetate, Halaven (Eribulin Mesylate), Hemangeol (Propranolol Hydrochloride),
Herceptin
(Trastuzumab), HPV Bivalent Vaccine, Recombinant, HPV Nonavalent Vaccine,
Recombinant,
HPV Quadrivalent Vaccine, Recombinant, Hycamtin (Topotecan Hydrochloride),
Hydrea
(Hydroxyurea), Hydroxyurea, Hyper-CVAD, Ibrance (Palbociclib), Ibritumomab
Tiuxetan,
Ibrutinib, ICE, Iclusig (Ponatinib Hydrochloride), Idamycin (Idarubicin
Hydrochloride),
Idarubicin Hydrochloride, Idelalisib, Idhifa (Enasidenib Mesylate), Ifex
(Ifosfamide),
Ifosfamide, Ifosfamidum (Ifosfamide), IL-2 (Aldesleukin), Imatinib Mesylate,
Imbruvica
(Ibrutinib), Imfinzi (Durvalumab), Imiquimod, Imlygic (Talimogene
Laherparepvec), Inlyta
(Axitinib), Inotuzumab Ozogamicin, Interferon Alfa-2b, Recombinant,
Interleukin-2
(Aldesleukin), Intron A (Recombinant Interferon Alfa-2b), Iodine 1131
Tositumomab and
Tositumomab, Ipilimumab, Iressa (Gefitinib), Irinotecan Hydrochloride,
Irinotecan
Hydrochloride Liposome, Istodax (Romidepsin), Ixabepilone, Ixazomib Citrate,
Ixempra
(Ixabepilone), Jakafi (Ruxolitinib Phosphate), JEB, Jevtana (Cabazitaxel),
Kadcyla (Ado-
Trastuzumab Emtansine), Keoxifene (Raloxifene Hydrochloride), Kepivance
(Palifermin),
Keytruda (Pembrolizumab), Kisqali (Ribociclib), Kymriah (Tisagenlecleucel),
Kyprolis
(Carfilzomib), Lanreotide Acetate, Lapatinib Ditosylate, Lartruvo
(Olaratumab), Lenalidomide,
Lenvatinib Mesylate, Lenvima (Lenvatinib Mesylate), Letrozole, Leucovorin
Calcium, Leukeran
(Chlorambucil), Leuprolide Acetate, Leustatin (Cladribine), LevuIan
(Aminolevulinic Acid),
Linfolizin (Chlorambucil), LipoDox (Doxorubicin Hydrochloride Liposome),
Lomustine,
Lonsurf (Trifluridine and Tipiracil Hydrochloride), Lupron (Leuprolide
Acetate), Lupron Depot
(Leuprolide Acetate), Lupron Depot-Ped (Leuprolide Acetate), Lynparza
(Olaparib), Margibo
(Vincristine Sulfate Liposome), Matulane (Procarbazine Hydrochloride),
Mechlorethamine
Hydrochloride, Megestrol Acetate, Mekinist (Trametinib), Melphalan, Melphalan
Hydrochloride, Mercaptopurine, Mesna, Mesnex (Mesna), Methazolastone
(Temozolomide),
Methotrexate, Methotrexate LPF (Methotrexate), Methylnaltrexone Bromide,
Mexate
(Methotrexate), Mexate-AQ (Methotrexate), Midostaurin, Mitomycin C,
Mitoxantrone
Hydrochloride, Mitozytrex (Mitomycin C), MOPP, Mozobil (Plerixafor), Mustargen
(Mechlorethamine Hydrochloride) , Mutamycin (Mitomycin C), Myleran (Busulfan),
Mylosar
(Azacitidine), Mylotarg (Gemtuzumab Ozogamicin), Nanoparticle Pad itax el
(Paclitaxel
Albumin-stabilized Nanoparticle Formulation), Navelbine (Vinorelbine
Tartrate), Necitumumab,
Nelarabine, Neosar (Cyclophosphamide), Neratinib Maleate, Nerlynx (Neratinib
Maleate),
Netupitant and Palonosetron Hydrochloride, Neulasta (Pegfilgrastim), Neupogen
(Filgrastim),
28
CA 03210821 2023- 9- 1
WO 2022/187744
PCT/US2022/019165
Nexavar (Sorafenib Tosylate), Nilandron (Nilutamide), Nilotinib, Nilutamide,
Ninlaro (Ixazomib
Citrate), Niraparib Tosylate Monohydrate, Nivolumab, Nolvadex (Tamoxifen
Citrate), Nplate
(Romiplostim), Obinutuzumab, Odomzo (Sonidegib), OEPA, Ofatumumab, OFF,
Olaparib,
Olaratumab, Omacetaxine Mepesuccinate, Oncaspar (Pegaspargase), Ondansetron
Hydrochloride, Onivyde (Irinotecan Hydrochloride Liposome), Ontak (Denileukin
Diftitox),
Opdivo (Nivolumab), OPPA, Osimertinib, Oxaliplatin, Paclitaxel, Paclitaxel
Albumin-stabilized
Nanoparticle Formulation, PAD, Palbociclib, Palifermin, Palonosetron
Hydrochloride,
Palonosetron Hydrochloride and Netupitant, Pamidronate Disodium, Panitumumab,
Panobinostat, Paraplat (Carboplatin), Paraplatin (Carboplatin), Pazopanib
Hydrochloride, PCV,
PEB, Pegaspargase, Pegfilgrastim, Peginterferon Alfa-2b, PEG-Intron
(Peginterferon Alfa-2b),
Pembrolizumab, Pemetrexed Disodium, Perj eta (Pertuzumab), Pertuzumab,
Platinol (Cisplatin),
Platinol-AQ (Cisplatin), Plerixafor, Pomalidomide, Pomalyst (Pomalidomide),
Ponatinib
Hydrochloride, Portrazza (Necitumumab), Pralatrexate, Preclnisone,
Procarbazine Hydrochloride
, Proleukin (Aldesleukin), Prolia (Denosumab), Promacta (Eltrombopag Olamine),
Propranolol
Hydrochloride, Provenge (Sipuleucel-T), Purinethol (Mercaptopurine), Purixan
(Mercaptopurine), Radium 223 Dichloride, Raloxifene Hydrochloride,
Ramucirumab,
Rasburicase, R-CHOP, R-CVP, Recombinant Human Papillomavirus (HPV) Bivalent
Vaccine,
Recombinant Human Papillomavirus (HPV) Nonavalent Vaccine, Recombinant Human
Papillomavirus (HPV) Quadrivalent Vaccine, Recombinant Interferon Alfa-2b,
Regorafenib,
Relistor (Methylnaltrexone Bromide), R-EPOCH, Revlimid (Lenalidomide),
Rheumatrex
(Methotrexate), Ribociclib, R-ICE, Rituxan (Rituximab), Rituxan Hycela
(Rituximab and
Hy aluronidase Human), Rituximab, Rituximab and , Hy aluronidase Human,
Rolapitant
Hydrochloride, Romidepsin, Romiplostim, Rubidomycin (Daunorubicin
Hydrochloride),
Rubraca (Rucaparib Camsylate), Rucaparib Camsylate, Ruxolitinib Phosphate,
Rydapt
(Midostaurin), Sclerosol Intrapleural Aerosol (Talc), Siltuximab, Sipuleucel-
T, Somatuline
Depot (Lanreotide Acetate), Sonidegib, Sorafenib Tosylate, Sprycel
(Dasatinib), STANFORD V,
Sterile Talc Powder (Talc), Steritalc (Talc), Stivarga (Regorafenib),
Sunitinib Malate, Sutent
(Sunitinib Malate), Sylatron (Peginterferon Alfa-2b), Sylvant (Siltuximab),
Synribo
(Omacetaxine Mepesuccinate), Tabloid (Thioguanine), TAC, Tafinlar
(Dabrafenib), Tagrisso
(Osimertinib), Talc, Talimogene Laherparepvec, Tamoxifen Citrate, Tarabine PFS
(Cytarabine),
Tarceva (Erlotinib Hydrochloride), Targretin (Bexarotene), Tasigna
(Nilotinib), Taxol
(Paclitaxel), Taxotere (Docetaxel), Tecentriq , (Atezolizumab), Temodar
(Temozolomide),
Temozolomide, Temsirolimus, Thalidomide, Thalomid (Thalidomide), Thioguanine,
Thiotepa,
Tisagenlecleucel, Tolak (Fluorouracil--Topical), Topotecan Hydrochloride,
Toremifene, Torisel
29
CA 03210821 2023- 9- 1
WO 2022/187744
PCT/US2022/019165
(Temsirolimus), Tositumomab and Iodine 1131 Tositumomab, Totect (Dexrazoxane
Hydrochloride), TPF, Trabectedin, Trametinib, Trastuzumab, Treanda
(Bendamustine
Hydrochloride), Trifluridine and Tipiracil Hydrochloride, Trisenox (Arsenic
Trioxide), Tykerb
(Lapatinib Ditosylate), Unituxin (Dinutuximab), Uridine Triacetate, VAC,
Vandetanib, VAMP,
Varubi (Rolapitant Hydrochloride), Vectibix (Panitumumab), VeIP, Velban
(Vinblastine
Sulfate), Velcade (Bortezomib), Velsar (Vinblastine Sulfate), Vemurafenib,
Venclexta
(Venetoclax), Venetoclax, Verzenio (Abemaciclib), Viadur (Leuprolide Acetate),
Vidaza
(Azacitidine), Vinblastine Sulfate, Vincasar PFS (Vincristine Sulfate),
Vincristine Sulfate,
Vincristine Sulfate Liposome, Vinorelbine Tartrate, VIP, Vismodegib, Vistogard
(Uridine
Triacetate), Voraxaze (Glucarpidase), Vorinostat, Votrient (Pazopanib
Hydrochloride), Vyxeos
(Daunorubicin Hydrochloride and Cytarabine Liposome), Wellcovorin (Leucovorin
Calcium),
Xalkori (Crizotinib), Xeloda (Capecitabine), XELIRI, XELOX, Xgeva (Denosumab),
Xofigo
(Radium 223 Dichloride), Xtandi (Enzalutamide), Yervoy (Ipilimumab), Yondelis
(Trabectedin),
Zaltrap (Ziv-Aflibercept), Zarxio (Filgrastim), Zejula (Niraparib Tosylate
Monohydrate),
Zelboraf (Vemurafenib), Zevalin (Ibritumomab Tiuxetan), Zinecard (Dexrazoxane
Hydrochloride), Ziv-Aflibercept, Zofran (Ondansetron Hydrochloride), Zoladex
(Goserelin
Acetate), Zoledronic Acid, Zolinza (Vorinostat), Zometa (Zoledronic Acid),
Zydelig (Idelalisib),
Zykadia (Ceritinib), and/or Zytiga (Abiraterone Acetate). Where an EGFR splice
variant
isoform is not detected, the treatment methods can include or further include
checkpoint
inhibitors include, but are not limited to antibodies that block PD-1
(Nivolumab (BMS-936558
or MDX1106), CT-011, MK-3475), PD-Li (MDX-1105 (HMS-936559), MPDL3280A, or
MSB0010718C), PD-L2 (rHIgMl2B7), CTLA-4 (Ipilimumab (MDX-010), Tremelimumab
(CP-
675,206)), IDO, B7-H3 (MGA271), B7-H4, TIM3, LAG-3 (BMS-986016).
117. As noted throughout this application, it is understood and herein
contemplated that the
methods and CCT inhibitors disclosed herein alone or in combination with
adoptive
immunotherapies (such as, for example, CAR T cell, CAR NK cell, TIL, and MIL
immunotherapies), a cell cycle inhibitors (such as, for example, a CCND1
inhibitor, a CDK2
inhibitor, and/or a CDK4 inhibitor), or any other anti-cancer therapy
disclosed herein can be
used to treat, inhibit, reduce, ameliorate, and/or prevent any disease where
uncontrolled cellular
proliferation occurs such as cancers (including, but not limited to such as,
for example, sarcoma,
glioma, melanoma, lymphoma, or a breast cancer). A representative but non-
limiting list of
cancers that the disclosed compositions can be used to treat is the following:
lymphoma, B cell
lymphoma, T cell lymphoma, mycosis fungoides, Hodgkin's Disease, myeloid
leukemia, bladder
cancer, brain cancer, nervous system cancer, head and neck cancer, squamous
cell carcinoma of
CA 03210821 2023- 9- 1
WO 2022/187744
PCT/US2022/019165
head and neck, lung cancers such as small cell lung cancer and non-small cell
lung cancer,
neuroblastoma/glioblastoma, ovarian cancer, skin cancer, liver cancer,
melanoma, squamous cell
carcinomas of the mouth, throat, larynx, and lung, cervical cancer, cervical
carcinoma, breast
cancer, and epithelial cancer, renal cancer, genitourinary cancer, pulmonary
cancer, esophageal
carcinoma, head and neck carcinoma, large bowel cancer, hematopoietic cancers;
testicular
cancer; colon cancer, rectal cancer, prostatic cancer, or pancreatic cancer.
In some
embodiments, the method described herein is effective on treating a breast
cancer, including, for
examples, luminal A breast cancer, luminal B breast cancer, estrogen
receptor(ER)- progesterone
receptor(PR)- HER24 breast cancer, or triple negative breast cancer.
Diagnosis of Cancers
118. Expression of CCT (e.g., CCT2) causes these cancers to acquire invasive
and metastatic
like behaviors and begin to express other cancer genes that are associated
with cancer
progression like MYC. The outcomes are using CCT2 as a biomarker for cancer to
monitor
patient outcomes to treatments and predict development of drug resistance.
119. Accordingly, also disclosed herein is a method of diagnosing a subject as
having a
cancer, comprising a) quantifying a level of a chaperonin-containing TCP1
(CCT) relative to a
reference control; b) determining the subject as having the cancer when the
level of CCT is
higher (for example, at least about 1%, 5%, 10%, 15%, 20 %, 25%, 30%, 35%,
40%, 45%, 50%,
55%, 60%, 65%, 70%, 75%, 80%, 85%, 90%, 95%, or 100% higher) than the
reference control;
and c) determining the subject as not having the cancer when the level of CCT
is lower (1%, 5%,
10%, 15%, 20 %, 25%, 30%, 35%, 40%, 45%, 50%, 55%, 60%, 65%, 70%, 75%, 80%,
85%,
90%, 95%, or 100% lower) than the reference control.
120. In some embodiments, the method further comprises administering to the
subject a
therapeutically effective amount of a CCT inhibitor. In some embodiments, the
administration of
the CCT inhibitor sensitizes the cancer to a cell cycle inhibitor and/or
chemotherapy.
121. Accordingly, in some aspects, disclosed herein is a method of sensitizing
a subject's
responsive to a cycle inhibitor and/or chemotherapy, said method comprising
administering to
the subject a therapeutically effective amount of a CCT inhibitor, wherein the
subject is
nonresponsive to a cycle inhibitor and/or chemotherapy.
122. The CCT inhibitor described herein can be a CCT1 inhibitor, a CCT2
inhibitor, a CCT3
inhibitor, a CCT4 inhibitor, a CCT5 inhibitor, a CCT6 inhibitor, a CCT7
inhibitor, or a CCT8
inhibitor. In some embodiments, the CCT inhibitor is a CCT2 inhibitor.
31
CA 03210821 2023- 9- 1
WO 2022/187744
PCT/US2022/019165
123. In some embodiments, the CCT inhibitor comprises a small molecule, an
antibody, a
peptide, a polypeptide, a small interfering RNA (siRNA), or a short hairpin
RNA. In some
embodiments, the CCT inhibitor is a gene editing system, including, for
example, CRI5PR-Cas9.
124. In some embodiments, the CCT inhibitor is a peptide, including, for
example, a CT2Op
peptide. The CT20p peptide is known in the art. See, e.g., U.S. Patent
Application Publication
No. 20170165318A1, incorporated by reference herein in its entirety.
125. The CT20 peptide may include SEQ ID NO: 1, SEQ ID NO: 2, SEQ ID NO: 3,
SEQ ID
NO: 4, SEQ ID NO: 5, SEQ ID NO: 6, any variant of SEQ ID NO:1-6 having at
least 60% (e.g.,
at least 70%, 80%, 90%, 95%, or 99%) sequence identity to SEQ ID NO: 1, SEQ ID
NO: 2, SEQ
ID NO: 3, SEQ ID NO: 4, SEQ ID NO: 5, or SEQ ID NO: 6, or a combination of two
or more of
the above.
126. In some embodiments, the CT20 peptide of the therapeutic regimen may be
delivered via
nanoparticles suitable for delivery of the CT20 peptide into a cancer cell.
The nanoparticles may
also include at least one type of targeting moiety, for example, a ligand for
a receptor expressed
by cancer cells. In some embodiments, the receptor expressed by cancer cells
is an EGF, HER2,
or folate receptor. In some embodiments, the CT20 peptide is linked to an
internalization
domain suitable for delivery of the CT20 peptide into a cancer cell.
127. As used herein, "nanoparticle- may refer to any nanostructure capable of
delivering
pharmaceutical compounds, nucleic acids, peptides, or proteins. Nanoparticles
may be naturally
or synthetically derived. In some aspects, "nanoparticles" may include plasma
vesicle particles,
liposomes, exosomes, protein-based particles, albumin particles, nucleic acid-
based particles,
natural polymers, synthetic polymers, hydrogels, dendrimers, silicon-based
materials, metal-
based materials, carbon-based materials, calcium-based materials, or a
combination of any of the
above. In some embodiments, the nanoparticle described herein are those
disclosed in U.S.
Patent No. 11,129,868, incorporated by reference herein in its entirety.
128. In an aspect, the nanoparticles are hyperbranched polyester polymeric
nanoparticles. In
an aspect, the nanoparticles are polymeric nanoparticles. In an aspect, the
nanoparticles can
comprise a targeting moiety. In an aspect, the targeting moiety can comprise a
targeting ligand.
In an aspect, the targeting ligand can be for a receptor expressed by cancer
cells. In an aspect, the
receptor expressed by cancer cells can be an EGF, HER2, or folate receptor. In
an aspect, the
receptor expressed by cancer cells can be any receptor known to the skilled
person to be
expressed by cancer cells. In some embodiments, the receptor may be know to be
expressed by
colon cancer cells, prostate cancer cells, lung cancer cells, liver cancer
cells, and/or breast cancer
cells.
32
CA 03210821 2023- 9- 1
WO 2022/187744
PCT/US2022/019165
129. In an aspect, the targeting ligand is a folate compound. In an aspect,
the targeting ligand
is a glutamate compound. In an aspect, the targeting ligand is a
polyglutamated folate compound.
In an aspect, the targeting ligand is glutamate azido urea. In an aspect, the
targeting ligand is
folate azido urea. In an aspect, the targeting ligand is glutamate azido urea.
In an aspect, the
targeting ligand is a bifunctional glutamate-folate hybridized compound. In an
aspect, the
targeting ligand is at high density. In an aspect, the targeting ligand is at
low density. In an
aspect, the targeting ligand is at high valency. In an aspect, the targeting
ligand is at low valency.
In an aspect, the targeting ligand is a substrate for a solid tumor-specific
cell protein.
130. In some examples, the method disclosed herein further comprises
administering to the
subject a therapeutically effective amount of a cell cycle inhibitor. In some
embodiments, the
cell cycle inhibitor comprises a CCND1 inhibitor, a CDK2 inhibitor, or a CDK4
inhibitor. In
some embodiments, the cell cycle inhibitor is a CDK4 inhibitor. The CDK4
inhibitor includes,
for example, palbociclib, ribociclib, or abemaciclib.
131. In some embodiments, the subject is an adult. In some embodiments, the
subject is a
child.
132. In some embodiments, the cancer is a metastatic cancer. In some
embodiments, the
cancer is sarcoma, glioma, melanoma. lymphoma, or a breast cancer.
133. In some embodiments, the cancer is a pediatric cancer. In some
embodiments, the
pediatric cancer is neuroblastoma, clear cell sarcoma of the kidney (CCSK),
Wilms tumor,
Rhabdoid tumor of the kidney (RTK), rhabdomyosarcoma, or Choroid plexus
carcinoma. In
some embodiments, cancer cells obtained from the subject have an increased
level of one or
more tumor biomarkers selected from the group consisting of MYC, MYCN, CDK2,
CDK4,
CCNE1, CCND1, YAP1, and RB1 relative to a reference control.
134. In some embodiments, the method described herein is effective on treating
a breast
cancer, including, for examples, luminal A breast cancer, luminal B breast
cancer, estrogen
receptor(ER)- progesterone receptor(PR)- HER2+ breast cancer, or triple
negative breast cancer.
EXAMPLES
135. Unless defined otherwise, all technical and scientific terms used herein
have the same
meanings as commonly understood by one of skill in the art to which the
disclosed invention
belongs. Publications cited herein and the materials for which they are cited
are specifically
incorporated by reference.
33
CA 03210821 2023- 9- 1
WO 2022/187744
PCT/US2022/019165
136. Those skilled in the art will recognize, or be able to ascertain using no
more than routine
experimentation, many equivalents to the specific embodiments of the invention
described
herein. While the invention has been described with reference to particular
embodiments and
implementations, it will be understood that various changes and additional
variations may be
made and equivalents may be substituted for elements thereof without departing
from the scope
of the invention or the inventive concept thereof In addition, many
modifications may be made
to adapt a particular situation or device to the teachings of the invention
without departing from
the essential scope thereof Such equivalents are intended to be encompassed by
the following
claims. It is intended that the invention not be limited to the particular
implementations disclosed
herein, but that the invention will include all implementations falling within
the scope of the
appended claims.
Example 1: Introduction.
137. Genetic alterations support malignant transformation that results from
uncontrolled
proliferation, especially those that deregulate cell cycle phases ¨
specifically the Gap 1 (G1)
phase to Synthesis (S) phase transition. Therapeutically targeting cancer
proliferative pathways
is therefore of significant interest. The cell cycle is tightly regulated by
cyclin dependent kinases
(CDK), cyclins, and inhibitors such as p21 or p27 as well as proteolytic
pathways to drive cell
progression from the G1 phase through S phase, Gap 2 (G2) phase, then mitosis
and cytokinesis.
The G1 to S transition serves as a key checkpoint through regulation of the
activities of
retinoblastoma protein (Rb) and histone deacetylases, which control
transcription through E2
factor (E2F). In breast cancer, as with other cancers, deregulation of the
Gl/S transition results in
uncontrolled entry into S, bypassing the checkpoint. Normally, mitotic signals
drive the
expression of cyclin D, which associates with the G1 kinases, CDK4/6, leading
to the
phosphorylation of Rb, activation of the transcriptional activity of E2F, and
the subsequent
generation of the S phase kinase, CDK2/cyclin E. In breast cancer, ER+ in
particular, multiple
signaling pathways converge to target cyclin D. MYC is also involved in cell
proliferation and
differentiation, transcriptionally activating cell cycle regulators and
repressing cell cycle
inhibitors, and is implicated in the development of cancer drug resistance.
With that said,
treatment options for breast cancer patients depend on the molecular
classification of their
tumors and the availability of targeted therapeutics. Recent successes with
CDK inhibitors, such
as those that target CDK4, are encouraging, since these inhibitors block the
proliferation of
cancer cells. However, there are no drugs in clinical use that target CCND
l/cyclin D1 or MYC.
Endocrine therapies remain the best option for ER+ patients (luminal cancers),
but the
development of drug resistance is problematic. Patients can also develop
resistance to CDK4
34
CA 03210821 2023- 9- 1
WO 2022/187744
PCT/US2022/019165
inhibitors, three of which are approved for clinical use. Identifying new
targetable oncogenes can
advance knowledge on the evolution and progression of cancer and reveal novel
treatment
approaches that improve the prognosis and long-term survival of cancer
patients, especially
those that develop resistance to front-line therapies.
138. To advance the discovery of targetable factors for cancer therapy, CCT
was focused on.
CCT is a type II eukaryotic chaperonin that is composed of two stacked rings
consisting of eight
distinct subunits (CCT1-8) that form the protein folding chamber. Each CCT
subunit assembles
at a specific location in relation to other subunits in cis (same) and trans
(opposite) positions in
the ring. A CCT subunit contains three domains: an equatorial domain that
forms the base of the
chamber, an intermediate domain that has the ATP binding pocket, a hinge that
attaches to the
apical domain, and the apical domain itself The apical domain has multiple
hydrophobic areas
that bind different substrates; hence substrate binding is not based on the
amino acid sequence of
a protein but rather its structural features. CCT subunits have different
binding affinities to ATP,
which has a regulatory role, and as well as different binding affinities for
substrates. While the
scope and breadth of the CCT interactome are not fully understood, reports
suggest that CCT can
interact with about 1-15% of the proteome to support cellular processes such
as those involved in
proliferation, cell cycle progression, and invasion. Cytoskeleton proteins,
actin and tubulin, are
obligate substrates for CCT. In addition, direct interactions with CCT and
cell cycle proteins,
transcription factors, and tumor suppressors like PLK1, cdc20, CDH1, Cyclin E,
p53, STAT3
and others are reported. Hence, cancer cells can become highly dependent on
CCT to provide the
functional, folded forms of many oncoproteins and essential factors required
for survival and
growth.
139. CCT subunits were highly expressed in breast cancer as compared to normal
tissue and
that their expression increased with patients' tumor stage and metastasis. Of
the CCT subunits, it
was found that CCT2 expression inversely correlated with the overall survival
of breast cancer
patients. CCT2 can thus be a novel oncogene and serve as a prognostic
biomarker, which
supports deeper investigation into the role of the chaperonin complex and,
CCT2 in particular, in
the process of carcinogenesis. Most of the understanding of the role of CCT2
in cancer is
inferred from the activity of the whole CCT folding complex and identified
protein-protein
interactions. To augment this data, the role of CCT2 in cell cycle progression
was specifically
investigated using 2D and 3D cultures to investigate cellular and molecular
changes directly
associated with overexpressing the CCT2 subunit in luminal A cells, the most
common subtype
of breast cancer. It was found that CCT2 expression drove the proliferation of
cancer cells in
spheroid cultures as well as in 2D monolayers, endowing cancer cells with
growth adaptivity
CA 03210821 2023- 9- 1
WO 2022/187744
PCT/US2022/019165
irrespective of anchorage. CCT2 expression also correlated with increased
expression of key
proliferative factors, such as MYC, especially in spheroid cultures. These
findings present CCT2
as a cell cycle regulator and proto-oncogene with prognostic and therapeutic
value in breast and
other cancers.
Example 2: Materials and Methods.
140. Cell lines and generation of CCT2 overexpressing or depleted cells:
Cell lines used were
MCF7 (ATCC HTB-22) human ER+ breast cancer cells, T47D (ATCC HTB-133) human
ER+
breast cancer cells, and E0771 (CH3 Biosystems) murine TNBC cells. T47D cells
were cultured
in RPMI-1640 (Coming) supplemented with 10% fetal bovine sera (FBS) (Gemini),
I%
penicillin-streptomycin (P/S) (Coming), and 0.2 units/mL human recombinant
insulin (Santa
Cruz). MCF7 cells were cultured in Eagle's Minimum Essential Medium (EMEM)
(ATCC)
supplemented with 10% FBS (Gemini), 1% P/S (Coming), and 0.01 mg/mL human
recombinant
insulin (Santa Cruz). MCF7 and T47D cells were transduced with plasmids for
the lentiviral
control or CCT2-FLAG as previously described. For selection, cells were
maintained with 0.5
ittg/mL puromycin dihydrochloride (ThermoFisher) and microscopically observed
for GFP
expression. E0771 cells were cultured in RPMI-1640 (Coming) supplemented with
10% FBS
(Gemini) and 1% P/S (Corning). E0771 were transduced with lentiviral-based
inducible small
hairpin RNA (shRNA) targeting CCT2 as previously reported. To induce shRNA
expression, 0.5
ug/mL doxycycline was added to the media for 24-72 hours.
141. Cells were grown in ultra-low attachment plate (ULA) (Coming) and
supplemented with
complete growth media as appropriate for each cell line. To observe the
formation of multiple
spheroids, 24-well flat bottom ULA plates were seeded with 30,000 cells/well.
To observe the
formation of individual spheroids, 96-well rounded bottom ULA plates were
seeded with 10,000
cells/well. Culture day 0 refers to the start of spheroid plating. Spheroids
were grown for 8 days
on ULA plates and assayed at different time points: days 3, 5, and 8.
Brightfield images and
overlay GFP images were captured using the Cytation 5 Cell Imaging Multi-Mode
Reader
(BioTek).
142. 2D post 3D cultures (spheroid growth reversal): To assess spheroid growth
reversal, day
8 spheroids grown in 24-well ULA plates were collected and disintegrated
either physically by
repeat pipetting or chemically using Accumax (Innovative Cell Technology),
washed once in
PBS, resuspended in complete media, and then plated in standard tissue culture
T-25 flask with
media appropriate to each cell line. Intact day 8 spheroids from 96-well ULA
plate were
transferred to 48-well tissue culture plates with media appropriate to each
cell line. Fluorescent
36
CA 03210821 2023- 9- 1
WO 2022/187744
PCT/US2022/019165
images were captured using the Cytation 5 (BioTek). Bright field microscopy
images were
captured using the AXIO Observer with the 20X objective (Carl Zeiss AG).
143. Proliferation and viability assays: The ViaFluor 405 SE Cell
Proliferation Kit
(Biotium) was used to assess proliferation by tracking the number of cell
divisions. Cells from
day 3 spheroid cultures were stained following manufacturer's protocol,
incubated for 48 hours,
then collected on day 5 for analysis. As a reference population, a subset of
cells from day 3
spheroids were stained and immediately collected for analysis. Samples were
analyzed by flow
cytometry using the Cytoflex S flow cytometer (Beckman Coulter). The viability
of cells was
assessed using propidium iodide (PI) (Invitrogen) staining in an exclusion
assay. Five tl of
(1mg/m1) of PI were added to 200 ill cell suspension of 106 cell/ml
concentration. Samples were
analyzed by flow cytometry (Cytoflex S). Data analysis was performed using FCS
Express 6
software (DeNovo).
144. Cell cycle analysis: To assess cell cycle progression, 200,000 cells/well
were added to 6-
well tissue culture plates and supplemented with complete growth media. Cells
were cultured
overnight. To induce growth arrest, cells were washed with and then
supplemented with serum-
free media and cultured for 24 hours. Initiation of growth was synchronized by
the addition of
complete growth media with 10% FBS and cells assessed after 24- and 48-hours.
Samples were
collected for PI intracellular staining as follows. Briefly, equal volumes of
detergent buffer and
PI (Invitrogen) solution were added to cells at 106 cells/ml followed by the
addition of 15 ?Al
RNAase solution (Thermo Scientific) per lml total volume. Cells were incubated
for 3 hours at
room temperature. Samples were analyzed by flow cytometry (Cytoflex S). Data
analysis was
performed using FCS Express 6 software (DeNovo).
Detergent buffer recipe: 8 gm sodium chloride, 0.4 gm potassium chloride, 0.06
gm KH2PO4,
0.09 gm Na2HPO4, 0.14 gm CaCl2, 0.10 gm MgCl2, 0.10 gm MgSO4, 5.6 gm HEPES, 2
gm
bovine serum albumin (BSA), 4 gm Nonidet P-40 in 1000 ml distilled water.
PI staining solution recipe: 25 gm PI in 500 ml detergent buffer.
RNAase solution recipe: 0.006 g RNAse in 1 nil distilled water
145. Adhesion assay. Spheroids were grown on 96 well ULA plates as described
above for 8
days. On day 8, the spheroids were transferred to 96-well standard tissue
culture plates
(Eppendorf) and allowed to attach for 3 hours. After 3 hours, spheroids were
washed to remove
remaining floating cells and imaged using the Cytation 5 multi-model plate
reader (BioTek). The
following days, the spheroids were imaged again with the Cytation 5 and then
lifted from the
plate. Spheroids were then dissociated using ice-cold Accumax (Innovative Cell
Technologies)
37
CA 03210821 2023- 9- 1
WO 2022/187744
PCT/US2022/019165
with shaking for 15 min. Once dissociated, the cells were counted by imaging
using Cytation 5
reader and Gen 5 software based on green fluorescent protein (GFP) levels.
146. Immunofhtorescence staining for confocal microscopy: Spheroids grown on
24-well
ULA plate were collected and chemically dissociated using Accumax (Innovative
Cell
Technologies). Dissociated spheroid cells were plated on poly-L-lysine coated
25 mm coverslips
(Fisher Scientific), and cells were left for 1 hour to adhere before fixation.
Cells were fixed with
4% PFA for 10 min, washed with PBS for 10 min, permeabilized in 0.5% TritonX-
100 in PBS
for 5 min, blocked with 1% BSA and 0.05% Tween in PBS for 1 hour, stained with
and
ActinRedTM 555 ReadyProbesTM Reagent (Rhodamine phalloidin) (Thermofisher) for
1 hour,
and mounted with anti-fade DAPI (Invitrogen). Images were acquired with a
Zeiss LSM 710
confocal microscope (Carl Zeiss AG) with the 20X objective.
147. Western blot: Cell lysis, sodium dodecyl sulfate polyacrylamide gel
electrophoresis
(SDS-PAGE), total protein staining, gel visualization, and gel band
quantification were
performed as previously described. Lysates were collected from cells grown in
2D culture flask
or 24-well ULA plates. Total protein concentration was determined using te
Pierce BCA Protein
Assay Kit (Thermo Scientific) following the manufacturer's protocol. Anti-CCT2
(ab109184)
and anti-FLAG (ab1162) antibodies were obtained from Abeam, anti-CCT3 (MA5-
27872)
antibodies were from from Invitrogen, and anti-CCT-beta (MAB10050) antibodies
were from
Millipore. Note that anti-CCT2 (Abeam) and anti-CCT-beta (Millipore)
antibodies target the N-
terminal amino acids 1-100 and C-terminal amino acids of human CCT-beta,
respectively.
Secondary antibodies used were IRDye 800CW and IRDye 680CW (LI-COR).
148. Quantitative Real Time Polymerase Chain Reaction (RT-qPCR,): Total RNA
was
extracted from cells using Trizol (Ambion) following the manufacturer's
instructions. RNA
concentration was determined using the NanoDrop instrument (Nanodrop 8000,
ThermoFisher).
Approximately 1 ug of RNA was reverse transcribed to cDNA using iScript
reverse transcription
Supermix for RT-qPCR ( Bio-Rad) according to the manufacturer's instruction.
cDNA was
diluted to 10 ng/ 1. For RT-qPCR, a 20 pl PCR reaction was performed using 5
p1 of Fast Syber
Green Mastermix (Applied Biosystem), 0.2 forward primer, 0.2 reverse primer,
and 2 pl cDNA
(10 g/m1) and RNase free water. PCR reactions were performed in duplicate.
GAPDH was used
as a reference gene. PCR reactions were performed using the Applied Biosystems
QuantStudio 7
Flex Real-Time PCR system of 40 cycles of 95 C for 3 seconds and 62 C for 30
seconds. The
melting curve was evaluated for each reaction to verify a single amplification
product. Relative
38
CA 03210821 2023- 9- 1
WO 2022/187744
PCT/US2022/019165
mRNA expression was calculated using 2-Act and fold change using 2-AAct
equations. Primers
used are shown in Table 1.
149. Bioinforrnatics analysis: Interrogation of The Cancer Genome Atlas (TCGA)
database
was accomplished using the websource cBioPortal for Cancer Genomics
[cbioportal.org] to
visualize copy number alteration, mutual exclusivity, and co-expression of
genes in different
studies. TCGA data were analyzed and graphics were downloaded using the
webtool. CCT
subunits alterations were analyzed using the Catalog of Somatic Mutations in
Cancer
(COSMIC). mRNA expression and copy number data from The Cancer Cell Line
Encyclopedia
(CCLE) databases were downloaded using the Xena browser.
150. Statistical analysis: For statistical analysis of protein levels, imaging
data, spheroid
growth, adhesion, viability and proliferation data, Prism 8 (GraphPad) was
used to determine
statistical significance. Different groups were tested using Student's 1-test
or ANOVA as
relevant. P-values of less than 0.05 were considered statistically
significant. For analysis of gene
expression data, we first checked the raw Ct data for batch effect. If it
existed, the batch effect
was then removed using R package (Limma) prior to downstream gene expression
analysis.
After batch effect was corrected, the 2-AAct method was used to calculate and
normalize gene
expression for each target gene, in which -AACt was calculated using the
formula: -
AACt=average(ACt control sample)-ACt treated sample, where ACt=Ct target gene
¨ Ct
housekeeping gene. In all subsequent analysis, the fold change was log2-
transformed (2-AAct),
i.e., used -AACt, to evaluate the effect of different treatments on gene
expression of each target
gene. Multiple mixed effect linear regression model was used to evaluate
expression of each
gene in response to the effects of cell line, treatment and time. Time was set
as a continuous
variable with value of 0 for day 0, 1 for day 3, 2 for day 5 and 3 for day 8.
Multi-factor ANOVA
analysis was performed to evaluate the effect of individual factors, such as
cell line,
overexpression of CCT2 and culture type, depending on expression of each
target gene.
Spearman correlation coefficient was applied to test the gene interaction
among MYC, CCND1
and total CCT2. These statistical analyses were performed using Stata MP 15
(StataCorp LLC,
2019) and R packages. All tests were two-tailed with a significance level of a
(type I error)
<0.05. The p-values were adjusted based on Holm adjustment when multiple tests
were
conducted.
39
CA 03210821 2023- 9- 1
WO 2022/187744
PCT/US2022/019165
Example 3. Co-occurrence of CCT2 genetic alterations with cell cycle gene
alterations is
suggestive of functional relationships.
151. The co-occurrence of genetic mutations that are functionally related
contributes to the
process of carcinogenesis. Identifying such patterns can reveal novel cancer
initiating pathways
and treatment targets. Genetic alterations in cell cycle regulators are common
in breast cancer,
supporting the uncontrolled proliferation of cancer cells. However, the
heterogeneity of tumor
types and subtypes, suggests that there is not a single mechanism that exerts
a biological function
like proliferation but rather different signaling pathways converge that are
responsible for the
complex dynamics of cancer growth. Identifying possible points of convergence
for future
therapeutic targeting underlies the present studies. To this end, pan-cancer
databases like TCGA
were mined for the expression of CCT subunits in all cancers and it was showed
that the most
common type of copy number alteration of the CCT2 subunit gene was
amplification, and that
this gene was rarely deleted (Fig. 1A). As comparison, data for CCT3 is
included (Fig. 1A). The
importance of CCT2 in cancer progression is further emphasized by the fact
that cancer patients
with genetic alterations in CCT2 had reduced overall and progression free
survival (Fig. 1B). In
support, it was previously reported that breast cancer patients with CCT2
genetic alterations died
up 70 months sooner than patients without alterations. These findings support
investigating the
relationship between CCT2 and cell cycle gene expression to reveal new
pathways for
therapeutic intervention. Since the previous studies showed that the CCT2
subunit was essential
for breast cancer growth and tumor formation, whether alterations of the CCT2
gene associated
with cell cycle gene alterations was first examined. As shown in Table 2,
genetic alterations in
CCT2 co-occurred with CDK4, CDK2, CCND1, and MYC.
152. As the platform to investigate a role for CCT2 in cell cycle regulation,
the T47D and
MCF-7 cell lines were chosen to use. Both cell lines are luminal A epithelial
breast cancer cells,
ER+, and are derived from a metastatic site of pleural effusion. It was
previously reported that
T47D and MCF7 cells had lower levels of cytosolic CCT2 protein as compared to
basal cell lines
like MDA-MB-231. Luminal A subtypes are among the most common breast cancer
subtypes
but also display molecular heterogeneity. Clinically this is reflected by
differential treatment
outcomes and the development of acquired endocrine therapy resistance, such as
due to the
overexpression/amplification of CCND1 and CDK4. The Cancer Cell Line
Encyclopedia
(CCLE) database for global and selected genes alterations indicates that MCF7
and T47D cell
lines have variable copy number alteration profiles and mutation rates
(Fig.1C). Focusing on the
copy number and expression level of cell cycle genes, MCF7 cells have a
relatively higher copy
number of CCT2 and MYC but lower gene expression relative to T47D cells (Fig.
1D). CCT2
CA 03210821 2023- 9- 1
WO 2022/187744
PCT/US2022/019165
gene expression is thus higher in T47D cells. MCF7 cells also had the same
copy number but
relatively higher mRNA expression for CCND1 and CDKN1A compared to T47D cells
(Fig.
1D). Further, whether these cell lines harbored any genetic alterations in CCT
subunits was
examined. Using the COSMIC web-tool, it was found that MCF7 and T47D cells had
mutations
in CCT6B and CCT8 subunits, respectively. In addition, CCT3 was overexpressed
in MCF7
cells, but not in T47D cells (Table 3). These data indicate that, while T47D
and MCF7 cell lines
are representative of the most common forms of breast cancer, these display
genetic
heterogeneity that is observed in cancerous cells and thus can help reveal the
role that CCT2
plays in the regulation of cancer cell growth, especially as cancers spread
from local to
disseminated disease.
Example 4. CCT2 overexpression in breast cancer cells promotes the growth of
spheroids.
153. To achieve the exogenous expression of CCT2 in T47D and MCF7 cells, a
lentiviral
system was used to transduce cells with a FLAG-tagged CCT2 construct. As shown
in Figure
2A, the -transduction of both cell lines was equivalent as indicated by
comparable levels of GFP
expression from the lentiviral plasmid. CCT2-FLAG overexpression was examined
by western
blot using antibodies specific for the exogenous CCT2-FLAG protein (anti-
FLAG), total CCT2
protein (anti-CCT2 N-terminal specific), and endogenous CCT2 protein (anti-
CCT2 C-terminal
specific). While both cell lines expressed the CCT2-FLAG protein, T47D cells
had increased
total CCT2 protein as compared to MCF7 cells (Fig. 2B). This is in part due to
the
downregulation of endogenous CCT2 in CCT2-FLAG expressing cells (Fig. 28). In
T47D cells,
CCT2-FLAG expression increased total CCT2 mRNA (Fig. 2C), which correlated
with CCT2
protein expression. In MCF7 cells, CCT2-FLAG mRNA was increased as well;
however, this
did not correlate with increased total CCT2 protein as compared to lentiviral
control, due to
differences in post-transcriptional mechanisms. This difference in total CCT2
expression
between the cell lines is important as the effects of CCT2-FLAG overexpression
upon cell
growth, proliferation, and correlation with cell cycle regulators were
considered.
154. Since it was observed that overexpressing CCT2-FLAG caused a decrease in
endogenous
CCT2, whether other endogenous CCT subunits were also decreased was
determined. In MCF7
cells expressing CCT2-FLAG, endogenous CCT3 protein and mRNA expression were
slightly
increased, not decreased, and no statistically significant changes were noted
in T47D cells
expressing CCT2-FLAG (Fig. 11). It was reported that the endogenous levels of
the other CCT
subunits (e.g., CCT4, CCT5) were the same or increased in cells expressing
CCT2-FLAG.
Hence, the decrease in endogenous CCT2 upon expression of CCT2-FLAG was not
accompanied by the decrease of other CCT subunits. Moreover, it was found that
a major portion
41
CA 03210821 2023- 9- 1
WO 2022/187744
PCT/US2022/019165
of the CCT2-FLAG protein physically associated with the other CCT subunits to
form a
complex. While this shows that the biological activity of CCT2-FLAG in T47D
and MCF7 cells
is mediated as part of the CCT protein-folding complex, it does not rule a
biological function for
the monomeric CCT2 mRNA or protein.
155. 3D culture models better mimic tumor growth dynamics and are a valuable
tool to
investigate tumor growth mechanisms. Cells grown in 3D culture tend to
aggregate and form
spheroids. The core of these spheroids is usually hypoxic and necrotic, having
less access to
growth factors, the middle layers contain quiescent cells, and the outer
layers are typically
composed of actively proliferating cells in contact with the surrounding
media. Utilizing 3D
culture conditions, enabled through the use of ULA plates, the impact that
CCT2-FLAG
overexpression can have on spheroid formation by breast cancer cells was
investigated. In flat
bottom 24 well ULA plates, T47D and MCF7 cells expressing CCT2-FLAG formed
multiple
large spheroids as compared to cells expressing a lentiviral control plasmid
(Fig. 3A).
Morphologically, the spheroids formed by T47D cells expressing CCT2-FLAG
attained a sheet-
like pattern rather than growing in multiple but individual spheroids as seen
with MCF7 cells
expressing CCT2-FLAG or the T47D and MCF7 lentiviral controls (Fig. 3A).
Spheroid number
per well was next evaluated at different days of spheroid formation (days 3,
5, and 8). A
statistically significant increase in the number of spheroids formed was seen
with T47D cells that
overexpressed CCT2-FLAG, and a similar, though not statistically significant
trend, was
observed with MCF7 CCT2-FLAG expressing cells (Fig. 3B). To measure the size
of individual
spheroids (by imaging single spheroids), T47D and MCF7 CCT2-FLAG
overexpressing and
lentiviral control cells were grew in 96-well rounded bottom ULA plates. For
T47D and MCF7
CCT2 overexpressing cells, larger spheroids formed that increased with each
time point - 3, 5
and 8 days (Fig. 3C). It was confirmed that CCT2-FLAG protein levels were
maintained in each
cell line through day 5 of spheroid growth, while in lentiviral control cells,
endogenous CCT2
protein was downregulated (Figs. 12-13). T47D CCT2-FLAG over-expressing cells
maintained
higher total CCT2 mRNA that peaked at day 3 of the 3D culture (Fig. 3D). These
results
demonstrate that increased expression of CCT2 can drive spheroid growth, even
when normal
cellular processes are decreasing, and that T47D cells, which maintain a
higher expression level
of total CCT2 than MCF7 cells, display corresponding increased growth of
multiple and larger
spheroids under 3D culture conditions.
156. To verify that CCT2 is essential for spheroid formation and growth, a
CCT2 depletion
experiment was performed using a doxycycline (doxy) inducible shRNA. Depletion
of CCT2 in
breast cancer cells was lethal and can inhibit tumor growth in a syngeneic
mouse model of
42
CA 03210821 2023- 9- 1
WO 2022/187744
PCT/US2022/019165
TNBC. TNBC cells were used because, unlike luminal A breast cancer cells,
these cells tend to
express increased amounts of endogenous CCT2 and are amenable to depletion. In
the previous
study, using E0771 TNBC cells achieved ¨50% depletion of CCT2 after 72 hours
of treatment
with doxy. Using this same system to deplete CCT2, the E0771 control or CCT2
shRNA cells
were plated on 96-well ULA round bottom plates and assessed the growth of
individual
spheroids as follows. As shown in Figure 4A, E0771 cells (control and CCT2
shRNA) were
plated at day 0, and depletion of CCT2 was induced with doxy after day 3 of
spheroid growth.
Cells were imaged at 24-, 48-, and 72-hours post-doxy treatment. CCT2
depletion interfered with
the formation of spheroids as these cells lost their tight interactions and
loosely aggregated at the
bottom of the well (Fig.4A). As shown in Figure 4B, the experiment was
repeated but instead
CCT2 was depleted at the start of spheroid culture. When CCT2 depletion was
induced on day 0,
this prevented cells from forming tight spheroid structures and were loosely
aggregated (Fig.
4B). In both experiments, the resulting aggregates formed after CCT2 depletion
were easily
dispersed by pipetting, indicating that the tight cell-to-cell interactions
needed to form spheroids
were lost. These finding helps confirm that CCT2 promotes spheroid formation
and growth.
Example 5. CCT2 overexpression supports the transition of cells from 3D
spheroid to 2D
monolayer cultures.
157. CCT2-FLAG overexpressing cells growing in 3D culture mimic in vivo
tumors. Whether
these cells can undergo a reversal of 3D growth, re-attaching and expanding in
a 2D monolayer
was next wanted to determine. This model can mimic metastasis by retaining the
malignant
characteristics (e.g., invasiveness, sternness) of spheroid cells when these
transition to 2D
culture. Spheroids from day 8 cultures of T47D and MCF7 cells, lentiviral
control and CCT2-
FLAG expressing, were collected and transferred to treated tissue culture
plates and allowed to
re-attach for 3 hours. Cells were washed to remove unattached cells and then
imaged and
quantitated. More CCT2-FLAG expressing cells were able to re-attach as
compared to lentiviral
controls, indicating that these cells preserved features that enabled re-
establishment of growth in
adherent cultures (Fig. 5A). This was most apparent with T47D CCT2-FLAG
expressing cells,
since these retained cell-to-cell attachments, while also anchoring to a
surface. Since actin is an
obligate substrate of the CCT complex and has a role in spheroid formation by
supporting cell-
to-cell and cell-to-substrate interactions along with other cytoskeleton
components, the
intracellular distribution of F-actin was microscopically examined. T47D cells
were chosen for
F-actin visualization, since CCT2-FLAG overexpressing cells from this cell
line displayed
reversal of spheroid growth and re-attachment in monolayer culture (Fig. 5A).
F-actin levels
were assessed by confocal microscopy using fluorescent phalloidin, which binds
F-actin. CCT2-
43
CA 03210821 2023- 9- 1
WO 2022/187744
PCT/US2022/019165
FLAG overexpression in T47D spheroid cells significantly upregulated F-actin
levels as
compared to lentiviral control cells (Fig. 5B). These cells also had
filopodial like cellular
extensions (Fig.5B). While MCF7 CCT2-FLAG overexpressing cells also underwent
spheroid
growth reversal (Fig. 5A), in contrast to T47D cells, these cells did not
attach strongly to coated
coverslips and only a few cells can be imaged for F-actin by microscopy.
Collectively, these
results show that CCT2 overexpression supports spheroid growth reversal and
increased F-actin
levels.
158. To further investigate the effect of CCT2-FLAG expression on spheroid
growth reversal,
spheroids from T47D cells were examined, CCT2-FLAG overexpressing and
lentiviral control,
under two experimental conditions for re-growth in 2D monolayers. First, day 8
spheroids were
disassociated and placed in standard tissue culture plates. Under these
conditions, CCT2-FLAG
overexpressing cells gained anchorage-independent growth. As shown in Figure
6A, CCT2-
FLAG overexpressing cells, in 2D culture conditions, exhibited superimposed
growth, forming a
spheroid-like structure that attached to the flask. In contrast, lentiviral
control cells recovered
from spheroid culture grew in only in a 2D monolayer (Fig. 6A). In the second
approach, intact
day 8 spheroids (not dissociated) were transferred from T47D and MCF7, CCT2-
FLAG
overexpressing and lentiviral control, cells to a standard tissue culture
plate and imaged at
different time points. CCT2-FLAG overexpression enhanced the transition of
spheroids from 3D
to 2D culture; by day 2 after the transfer, spheroids from CCT2-FLAG
overexpressing cells were
attached and growing faster than the lentiviral controls, especially the T47D
cells (Fig. 6B).
These cells maintained CCT2-FLAG protein levels (Figs. S3 and S4) and higher
total CCT2
mRNA (especially T47D cells) (Fig.6C). Based on these observations, it is
concluded that CCT2
overexpression confers to tumor cells enhanced growth potential and
adaptability, even as these
cell transition between suspension and adherent culture conditions, indicative
of the potential for
invasive and metastatic-like behavior.
Example 6. CCT2 overexpression increases cell cycling in 3D and post-3D
cultures
159. Having shown that overexpression of CCT2-FLAG resulted in larger
spheroids and
promoted spheroid growth reversal, the proliferation of cells in 2D and 3D
culture conditions
was examined using a dilution dye, ViaFluor 405 . Cells in spheroid cultures
(growing on ULA
plates) were treated with the dye on day 3 and collected for analysis on day 5
of spheroid culture.
The percent of cells divided during this period was significantly higher for
the T47D and MCF7
cells overexpressing CCT2-FLAG as compared to lentiviral control. For T47D
cells, 60% of
CCT2-FLAG overexpressing cells divided over time compared with 40% of
lentiviral control
cells (Fig. 7A). For MCF7 cells, about 80% of CCT2-FLAG overexpressing cells
divided
44
CA 03210821 2023- 9- 1
WO 2022/187744
PCT/US2022/019165
compared to about 40% of lentiviral control cells (Fig.7B). The viability of
these cells was
assessed on days 3, 5 and 8 using PI exclusion. Spheroids formed with CCT2-
FLAG
overexpressing cells had lower viability in later culture days compared to
lentiviral control in
both cell lines, which was most evident for MCF7 CCT2-FLAG overexpressing
cells at days 5
and 8 of spheroid growth (Figs. 7C and 7D; gating shown in Fig. 15). Loss of
viability in the
147D CCT2-FLAG overexpressing cells at day 8 can be explained by a bigger
necrotic core in
these larger spheroids (Fig. 3C). Viability loss in MCF7 CCT2-FLAG
overexpressing cells can
be due to increased proliferation of cells that failed to thrive in spheroid
cultures. In total, these
findings provide additional support for CCT2 in promoting the proliferation of
cancer cells and
growth of spheroids.
160. Based on the data mining showing the co-occurrence of CCT2 with cell
cycle genes
(Table 2) and the previous finding that overexpression of CCT2-FLAG promoted
cell division in
2D monolayer cultures, whether CCT2-FLAG overexpression can enhance cell cycle
entry and
progression was tested. Cultures of T47D and MCF7, CCT2 overexpressing and
lentiviral
control, cells were synchronized for growth. After 24 hours of serum
deprivation, cell cycle
analysis using PI to stain the DNA confirmed that a majority of cells (-70%)
were in G1 phase
arrest (Fig. 16A-16D). Serum-containing media was introduced to the culture to
synchronize
growth, and cell cycling was assessed at 24- and 48-hours post-serum addition.
Results showed
that overexpression of CCT2-FLAG in T47D cells promoted the transition of
cells from G1 to S
and G2 phases of cell cycle. T47D cells overexpressing CCT2-FLAG had more
cells in S and G2
phases at 24- and 48-hours post-serum addition compared to lentiviral control
cells (Fig. 8A, Fig.
17A). MCF7 CCT2-FLAG overexpressing and lentiviral control cells had about the
same cell
cycle distribution post-serum addition (Fig. 8B, Fig. 17B).
161. 2D monolayer cultures were also established from the 3D cultures that
underwent
spheroid growth reversal ¨ referred to as 2D post 3D. Using these cells,
whether CCT2-FLAG
overexpression impacted cell cycle progression was tested. The 2D post-3D
cells derived from
T47D and MCF7 spheroids were synchronized by serum deprivation and analyzed
for the effect
of CCT2-FLAG overexpression on the cell cycle. Using PI staining for DNA
analysis, we
confirmed that about 70% of cells were in GI after 24-hours of serum
deprivation (Fig. I6A-
I6D). T47D CCT2 overexpressing cells had more cells in S and G2 phases after
24- and 48-
hours post-serum addition compared to lentiviral control cells (Fig. 8C, Fig.
17C). MCF7 CCT2
overexpressing and lentiviral control cells had comparable cell cycle
distribution after serum
addition, however these cells were inherently more proliferative (Fig. 8D,
Fig. 17D).
Collectively, it was found that CCT2 promotes breast cancer cell cycle
progression through
CA 03210821 2023- 9- 1
WO 2022/187744
PCT/US2022/019165
G1/S, in 2D, spheroid and 2D post 3D cultures; however, this effect can be
cell type dependent
and may involve different mechanisms depending on the cell's genetic make-up.
Example 7. CCT2 upregulates expression of MYC and cell cycle genes under
different
culture conditions
162. To investigate whether CCT2 overexpression increased the expression of
genes involved
in cell cycling, the gene expression of MYC and key cell cycle regulators were
measured by RT-
qPCR. GAPDH was used as a reference gene. Gene expression is presented as -AA
Ct relative to
the MCF7 lentiviral control reference sample, since these had the lowest CCT2
expression.
MCF7 and T47D cell lines had inherent differences in gene expression (Table 4;
Fig. 9A).
Collectively, T47D spheroids displayed statistically significant higher levels
of MYC, CDK2,
CDK4, and CCNE1 compared to MCF7 spheroids (Table 4). As spheroid cultures
grew,
expression for selected genes was downregulated, which is consistent with a
general decrease in
cellular processes observed with spheroid growth. Peaks of gene expression
most commonly
occurred on day 3 of spheroid culture, which correlated with peak levels of
CCT2 (Fig. 9A).
Importantly, CCT2-FLAG overexpression significantly upregulated the expression
of the cell
cycle regulators, MYC (Fig 9A) and CCND1/cyclin D1 (using T47D lentiviral
cells as the
reference sample), in T47D cells relative to the lentiviral control cells
(Fig. 9B, Table 4).
163. Two different population of cells grown in 2D monolayer cultures were
evaluated, the
more heterogeneous cells that are adapted to 2D adherent growth conditions and
the 2D post 3D
cells, that survived the selection process of spheroid growth and transitioned
back to monolayer
growth (underwent spheroid growth reversal). CCT2-FLAG overexpression
upregulated MYC,
CCND1, CDK2, and CDKN1A gene expression in cells from 2D cultures (Table 5).
Especially
significant was the increased expression of MYC and CCND1 in T47D CCT2-FLAG
overexpressing cells as compared to lentiviral controls (Fig. 9C, Table 5). In
summary, it was
found that in CCT2 overexpressing cells (especially T47D cells) gene
expression of key
regulators of cell proliferation, such as MYC and CCND1, was increased and
contributed to the
proliferative expansion detected across 2D, 3D and 2D post-3D culture
conditions.
Example 8. CCT2 as an oncogene.
164. The highest gene expression for MYC in the CCT2-FLAG overexpressing T47D
cell line
was observed on day 3 of spheroid culture (Fig. 9A) and is consistent with
total CCT2 mRNA
expression (Fig. 9A). Whether there was a statistically significant
correlation between CCT2,
MYC, and CCND1 were determined in the breast cancer cell lines. Gene
expression of CCT2,
MYC and CCND1 was assessed from the same batch of 2D and day 3 spheroid
cultures of T47D
and MCF7 cells, CCT2-FLAG and lentiviral control. Combining the datasets to
increase
46
CA 03210821 2023- 9- 1
WO 2022/187744
PCT/US2022/019165
statistical power, we performed a gene correlation analysis and found that
total CCT2 expression
significantly correlated with the increased expression of MYC and CCND1, with
Spearman
correlations of 0.864 and 0.824, respectively, and p< 0.05 (Fig.10A). To
determine if the
correlation between CCT2, MYC, and CCND1 was clinically relevant, we analyzed
TCGA data
for CCT2 mRNA co-expression with these genes. Using combined pan-cancer
studies,
moderately positive correlations of CCT2 mRNA were found with MYC, CDK2, CDK4,
CCNE1 but not CCND1 (slight negative correlation) (Fig. 10B). However, a
different correlation
test using the UCSC Xena database (study: TCGA BRCA) did find a weak but
significant
correlation between CCT2 and CCND1 (Pearson's correlation 0.095, p-value <
0.001). These
findings suggest that CCT2 can be a possible node for the interaction of key
cell cycle regulators
in the uncontrolled growth of cancer cells. An analysis of the network
resulting from compiling
data of potential CCT2 interactors (evidence from both physical and genetic
interactions,
BioGRID) included MYC, CDK2, and cyclin D1 as part of the CCT2 interactome,
supporting
the idea that CCT2 can be a central point or node for regulation of cancer
proliferation pathways
(Fig. 10C, Table 6).
165. CCT2 is located on chromosome 12q15 along with other identified oncogenes
MDM2,
FRS2, YEATS4 and others. CDK4 (12q13) also spans the chromosomal region 12q13-
15. Hence
CCT2 is part of an amplicon that is associated with cancer development. The
highest percent of
samples/patients with CCT2 gene amplification or increased gene expression is
observed in soft
tissue cancers like sarcoma (19% of sarcoma samples/patients have gene
alterations in CCT2,
TCGA) (Fig. 18A). CCT2 is also genetically altered in invasive breast cancer
along with other
12q15 oncogenes, the percent of which varies depending on the study and
availability of samples
(Fig. 18B, 18C). Along with its role in the CCT protein folding complex, we
showed that CCT2
promotes the proliferation of cancer cells that is anchorage-independent,
correlates with the
expression of other oncogenes like MYC, and thus may fulfill the basic
requirements for an
oncogene as it undergoes genomic amplification during the mutational processes
that drives
tumorigenesis.
166. The CCT complex assists in the folding, stability, maturation, or
assembly of many
proteins essential for cancer cells. However, being a large complex composed
of eight subunits,
the therapeutic targeting of CCT is challenging. To address this, it is shown
that overexpressing
one subunit, CCT2, is sufficient to promote the proliferation of cancer cells
and enhance the
potential for metastasis. We chose two luminal A breast cancer cell lines that
had different
genetic backgrounds to study the function of CCT2. T47D cells, which are also
PR high,
manifested the greatest changes upon CCT2 overexpression, with increased
spheroid size and
47
CA 03210821 2023- 9- 1
WO 2022/187744
PCT/US2022/019165
numbers and enhanced proliferation. T47D cells also sustained higher levels of
CCT2-FLAG
expression, displayed spheroid growth reversal, and anchorage-independent
growth. Importantly,
increases in the gene expression of MYC and CCND1 correlated with CCT2 in T47D
cells.
Hence, T47D cells show that overexpressing CCT2 can result in the uncontrolled
proliferation
and the metastatic-like behavior of aggressive, invasive cancer cells and is
linked to increased
expression of cell cycle regulators. In contrast, MCF7 cells, that have higher
CCT2 copy number
compared to T47D cells, inherently do not express more CCT2 but rather have
high endogenous
levels of MYC and CCND1. While CCT2-FLAG overexpression was achieved in these
cells,
high levels of total CCT2 were not sustained. As a result, we did not observe
significant
increases in spheroid growth or spheroid growth reversal over that of MCF7
control cells. Taken
together, the data from these cell lines support that CCT2 is a novel
regulator of cell proliferation
that can be anchorage independent and can be a node for the interaction of
growth pathways
involving MYC and CCND1.
167. MYC functions as a transcription factor and is involved in cell cycle
regulation,
transformation, angiogenesis and growth of cancers. As a result, MYC is a
major proto-oncogene
in breast cancer, especially for HER2 and BRCA-1 associated cancers that have
poor prognosis.
Likewise, CCND1 (cyclin D1) is amplified or overexpressed in cancer and may
cooperate with
MYC to promote transformation. Herein, we showed that CCT2 expression can
upregulate MYC
and CCND1 gene expression and promote metastatic-like behavior in luminal A
breast cancer
cells that are typically less aggressive than the basal-like/TNBC subtypes
usually associated with
MYC amplification. While CCT2 was identified as a MYC-interacting protein, the
relationship
between MYC and CCT2 (or any of the CCT subunits) is not well-understood.
Others reported
that overexpression or suppression of CCT3 in basal-like TNBC cells altered
cell proliferation
and changed the expression of MYC. One pathway of interest is WNT/11-catenin
signaling that
regulates cell growth and can drive proliferation in breast cancer cells
through MYC and
CCND1. Overexpression of CCT3 increased 0 -catenin in MDA-MB-231 and T47D
breast
cancer cells, which can be modulated by microRNA (miRNA) 223. This miRNA was
shown to
bind to the 3'UTR of both CCT3 and 0-catenin. The conclusion drawn from this
study was that
CCT3 mediates breast cancer growth by binding to and competitively inhibiting
miRNA 223.
However, a predication analysis for miRNA targets in CCT2 did not reveal
similar findings
(www.targetscan.org/cgi-
bin/targetscan/vert 72/view
gene.cgi'?rs=ENST00000299300.6&taxid=9606&members=&show
cnc=0&shownc=0&showncfl =&showncf2=&subset=1). Moreover, CCT3 mRNA and protein
in
the current study did not vary substantially between the lentiviral control
and CCT2-FLAG
48
CA 03210821 2023- 9- 1
WO 2022/187744
PCT/US2022/019165
overexpressing breast cancer cells. While the contribution of miRNAs and other
CCT subunits in
the effects of CCT2 overexpression upon MYC, cyclin D1 and subsequent
proliferation and
spheroid growth is not definitively rule out, the mechanisms driving this
interaction remain to be
elucidated. The relationship between CCT2, MYC and p53 is studied. In a study
of mutant TP53
in head and neck cancers, CCT2 was identified as a MYC and mutant TP53 target
gene.
Depletion of mutant p53 reduced the interaction of MYC with the CCT2 promoter.
Since T47D
cells have a missense TP53 mutation with potential gain of function (MCF7 have
wild type p53),
it is interesting to speculate that the mutant TP53-MYC axis can be involved
in the
responsiveness of this cell line to CCT2 overexpression.
168. Using 3D cultures to model breast tumor growth, increased spheroid
formation upon
CCT2 over expression was observed, as evidenced by multiple and larger
spheroids, and loss of
cell-to-cell contacts that support spheroid structure when CCT2 was depleted.
In support, it was
also found that actin was upregulated in CCT2 overexpressing cells, especially
as cells
transitioning from 3D to monolayer cultures. One group showed that cells
undergoing 3D to 2D
culture transitions retained signatures typical of metastatic cells, such as
the expression of cancer
stem-cell markers and the development of chemoresistance. These data show that
CCT2 can
enhance the potential of spheroids to not only to grow but to transition to 2D
culture, which is
indicative of a more aggressive phenotype, and such a phenotype that can be
responsible for
promoting drug resistance_ As example, spheroids from MDA-MB-231 cells, which
was reported
had high endogenous levels of CCT2, developed increased resistance to
treatment with
carboplatin or doxorubicin. Hence, inhibition of CCT2 can be used as a
treatment approach for
reversing cancer drug resistance. Applications of CCT2 (or CCT) inhibition can
be a
combination approach with CDK4 inhibitors. The development of resistance to
these inhibitors
has in part been attributed to the modulation of Rb and CDK2 activity. Since
we found that
CCT2 overexpression increased CCND1 and CDK2, CCT2 inhibition can improve
sensitivity to
CDK4 inhibitors.
169. Targeting CCT (and CCT2 specifically) can be an effective therapeutic
approach for
breast cancer as well as other cancers in which CCT is highly expressed. The
highest
amplification rate of the CCT2 gene was found in soft tissue cancers. The gene
for CCT2 is
located in the 12q15 amplicon, which also contains the oncogenes MDM2, YEATS4,
FRS2
among others. High level amplification of this amplicon can be an early event
in precursor cells
that give rise to sarcomas and other cancers like gliomas and melanomas.
Genomic imbalances
in this region are also found in other cancers such as follicular lymphomas.
Given this,
therapeutically targeting CCT is complicated by the fact that this is a multi-
subunit complex,
49
CA 03210821 2023- 9- 1
WO 2022/187744
PCT/US2022/019165
which challenges the development of small molecule inhibitors. Identifying a
subunit, such as
CCT2 as essential for the activity of the chaperonin complex, is a first step
towards developing a
CCT inhibitor for clinical use. Others identified a small molecule that
interferes with the CCT2-
13-tubulin interaction that can have application in the treatment of
resistance to tubulin-binding
agents. However, given the genetic heterogeneity of cancer, a CCT inhibitor
that works
independently of substrate identification is needed. To this end, a small
amphipathic peptide was
identified, called CT20p, as being cytotoxic in cancer cells that highly
express CCT. Using
polymeric nanoparticles to systemically deliver CT20p, regression of breast
and prostate tumors
was achieved in mice and it was demonstrated that CT20p directly binds to the
CCT2 subunit.
CT2Op thus demonstrates that CCT2 and the chaperonin complex can be
therapeutically
targeted. Herein the study shows the value of CCT2 as a druggable target by
demonstrating its
role as a cell cycle regulator that intersects with key proliferative factors
like MYC and CCND I.
The function of CCT2 as an oncogene can be established and elucidating its
relationship with
MYC can undercover a novel mechanism underlying cancer growth and
dissemination and
reveal uses for CCT inhibitors in the treatment of drug resistant cancers and
in the prevention of
cancer relapse and metastasis.
Example 8. CCT Neuroblastoma
Methods:
170. Bioinforrnatics: Data was collected from University of California Santa
Cruz (UCSC)
Xena at xena.ucsc.edu using the combined cohort of "The Cancer Genome Atlas
(TCGA),
Therapeutically Applicable Research to Generate Effective Treatments (TARGET),
and
Genotype Tissue Expression (GTEx) samples- dataset (Goldman et al., 2019).
Expression for
CCT2 gene was compared in GTEx, TCGA, and TARGET samples. Neuroblastoma cases
from
the TARGET samples were then isolated and analyzed for 9 different gene
expressions: CCT2,
MYC, MYCN, CDK2, CDK4, CCNDI, CCNE1, YAP1, and RBI. Muriel's Data.
171. Histology: Slides with formalin-fixed paraffin-embedded (FFPE) tissues
were received
from US Biomax 1) PC701 and NB642c. Slides were processed by standard
immunohistochemistry (IHC) methods for CCT2 and STAT3 staining [refl. Anti-
CCTr3 antibody
[amino acids 277 and 473 of Human TCP1 beta] (LifeSpan Biosciences) was used.
Slides were
stained and scored for the CCT2 stain by an independent and identification-
blinded pathologist,
as described previously [ref]. Images were taken using the BZ-X800 Keyence.
172. Cell Lines: 1MR-32 cells (ATCC 1(.) CCL-12") were cultured in Eagle's
Modified
Eagle's Medium (EMEM) (Corning) and supplemented with 10% fetal bovine serum
(FBS)
(Gemini) and 1% Penicillin-Streptomycin (P/S) (Coming) and L-Glutamine. SK-N-
AS cells
CA 03210821 2023- 9- 1
WO 2022/187744
PCT/US2022/019165
(ATCC CRL-2137TM) were cultured in Dulbecco's Modified Eagle's Medium (DMEM)
(Coming) and supplemented with 10% FBS (Gemini), 1X Non-Essential Amino Acids,
1% (P/S)
(Corning), and L-Glutamine. IMR-32 and SK-N-AS cells were transfected with a
lentiviral
plasmid to express CCT2 with a FLAG tag (DYKDDDDK (SEQ ID NO: 7)) hereafter
referred
to as IMR32-CCT2 or SKNAS-CCT2. Scrambled lentiviral plasmid was used as a
control and
these cells are hereafter referred to as IMR32-GFP or SKNAS-GFP. 0.5 pg/mL
puromycin
dihydrochloride (ThermoFisher) was added to maintain plasmids in SKNAS cells
and 1.0 pg/mL
was used in IMR32 cells.
173. Western. Cell lysis, sodium dodecyl sulfate polyacrylamide gel
electrophoresis (SDS-
PAGE), total protein staining, gel visualization, and gel band quantification
were performed as
previously described (ref). Lysates collected from 6 well plates or 2D culture
flasks. Total
protein was determined using the Pierce BCA Protein Assay Kit (Thermo
Scientific) following
the manufacturer's protocol. Primary antibodies included: Total CCT2
(ab109184) abcam which
targets N-terminal ammino acids 1-100; CCT3 (MA5-27872) Invitrogen; Endogenous
CCT2
(MAB10050) millipore which targets C-terminal amino acids; and FLAG (ab1162)
abeam.
Secondary antibodies included IRDye 800CW and IRDye 680CW (LI-COR). Images
were
collected on LiCORE imager and processed using ImageStudio.
174. RT-PCR. RNA was isolated from cells using TRIzolTM (Invitrogen) following
the
manufacturer's standard protocol for RNA extraction_ RNA was quantified using
a Nanodrop.
Cdna was synthesized using the iScriptTM Cdna Synthesis Kit (Bio-Rad)
following the
manufacturer's protocol. Cdna was diluted 1:5 and mixed with a Fast SYBRTM
Green Master
Mix (Applied Biosystems) according to manufacturer's recommendations and then
run in the
Quantstudio PCR for 40 cycles at 95 'V for 3 sec, and 62 'V for 30 sec.
175. Migration Assay. Cells were cultured as seed density of 50,000 cells in
96 well plate
(SKNAS) and 60,000 cells (IMR32) and let sit overnight. Sartorius Scratch
Wound Assay kit
was used to create the scratch and cells were washed according to protocol.
Images were
collected every 2hrs for 48hrs using Incucyte S3 and analyzed using Incucyte
2021 A software.
176. Actin and DAPI stain. Cells were seeded at 10,000-30,000 cells per well
in 96 well plate.
The next day, cells were fixed in 10% neutral buffered formalin for 10 mins.
Cells were then
permeabilized in 0.5% Trition X100 in PBS for 5 mins with gentle shaking.
Cells were then
placed in a 1% blocking solution (1-2% BSA, 0.05% Tween20, in PBS) for 30 mins
are room
temperature under gentle shaking. Cells were then stained with luL Actin in 99
uL of 1%
blocking solution in the dark for 30 mins. Cells were washed 3 times with
washing solution
(0.05% Tween20 in PBS) and let dry for 10 mins. Cells were then stained for
DAPI using 5 uL
51
CA 03210821 2023- 9- 1
WO 2022/187744
PCT/US2022/019165
of DAPI in 95 uL of PBS for 10 mins. Cells were then visualized under Pico and
images were
captured and analyzed using Pico software.
177. Colony Assay. Cells were seeded at 10,000 cells in 6 well plate and
cultured for 6 cycles.
This was 2 weeks for IMR32 and 3 weeks for SKNAS.
178. Buffer Experiment. The protocol was adapted from Lowes et al [ref] as
described
previously (ref). Samples were washed twice with dilution buffer post antibody
staining, re-
suspended in dilution buffer (350 RL) and transferred into CSS magnets
cartridges and run in
CSS Analyzer II and analyzed.
179. Statistics. Statistical analysis was carried out using GraphPad Prism
Software. For RT-
PCR analysis, relative gene expression was calculated by dividing a gene's
expression in that
sample by the average expression of this gene in control samples, i.e., 2-
AACt/average (2-AACt
control sample) with MDA-MB-231 assigned as the control sample.
180. Bioinformatic databases show that pediatric cancers have high levels of
CCT2. To
determine the relevance of CCT2 in pediatric cancers, this study used the UCSC
Xena database
to compare GTEx (normal tissues), TCGA (adult cancerous tissues) and TARGET
(pediatric
cancerous tissues). The results show that TCGA cases have significantly higher
levels of CCT2
(<0.0001) than GTEx and pediatric cases have significantly higher levels of
CCT2 (<0.0001)
than TCGA cases, Figure 19A. When pediatric cases were broken down by cancer
type, it found
that Clear cell sarcoma of the kidney, Neuroblastoma, and Wilms tumor had
higher levels than
Rhabdoid tumor of the kidney, Figure 1B. To confirm these findings, a
different database called
KidsFirst was used, where CCT2 levels were assessed across several pediatric
cancers, Figure
19C. Some of the highest CCT2 levels were seen in Rhabdomyosarcoma, Choroid
plexus
carcinoma, and neuroblastoma. To determine where CCT2 levels compared to other
tumor
markers, the study looked at neuroblastoma cases in UCSC Xena database and
several common
biomarkers. CCT2 levels were higher than MYC, MYCN, CDK2, CDK4, CCNE1, CCND1,
YAP1, and RB1. CCT2 levels were lower than CCND1, Figure 19D.
181. CCT2 staining is present in multiple pediatric cancer tissues and is high
in
neuroblastoma. To determine CCT2 staining in pediatric cancerous tissues, a
tissue microarray
(TMA) for pediatric cancers was stained. It was found that all cancers had
high (score 3-4)
staining for CCT2, Figure 20A. Meanwhile most normal tissues had low staining
(score 1-2) for
CCT2. Neuroblastoma had some of the highest CCT2 staining, therefore we
stained a
neuroblastoma TMA to get a better range of tumor stage and aggression. The
study found
staining was present in all tumor tissues and minimal in normal tissue, Figure
20B. While not
52
CA 03210821 2023- 9- 1
WO 2022/187744
PCT/US2022/019165
statistically significant due to few samples, there did seem to be a trend
with increased staining
and increased tumor grade, CD56 staining, and//or CgA staining.
182. CCT2 is present in neuroblastoma cell lines SKNAS and IMR32. To determine
if CCT2
was detectable in neuroblastoma cell lines, this study first analyzed RNA from
Nemours'
database on IMR32 and SKNAS cell lines. IMR32 is a MYCN-amplified high risk
neuroblastoma, pre-treatment. SKNAS is a MYCN down-regulated high-risk
neuroblastoma,
post-treatment from a metastatic recurrence. CCT1, CCT2, and CCT4 show
statistically
significant increases in IMR32 compared to SKNAS, Figure 21A. The study then
cultured
IMR32 and SKNAS cell lines and measured the RNA and protein for CCT2 and CCT3
levels.
RT-PCR showed high levels of CCT2 in IMR32 and SKNAS compared to MDA-MB-231,
which is a Triple Negative Breast Cancer cell line and has historically high
levels of CCT2
(REF). This increase in CCT2 above MDA-MB-231 was only statistically
significant for IMR32
(p=0.0031), Figure 21B. CCT3 levels were comparably high across IMR32, SKNAS,
and MDA-
MB-231 cell lines. Western analysis saw similar results. CCT2 and CCT3 levels
were
statistically significantly higher in IMR32 over SKNAS (p=0.0108 and p=0.0919
respectively),
Figure 21C.
183. Knockdown of CCT2 in SKNAS cells decreases viability and decreases actin
lit4R32. To
determine if the roll of CCT2 in these neuroblastoma cell lines was vital, the
cell lines were
transfected with CCT2-shRNA. GFP-shRNA was used for control transfections.
Figure 22
shows that transfection was successful in SKNAS cell lines. This inducible
system is activated
by doxycycline. Western analysis showed statistically significant decreases in
total CCT2
(p=0.0092), CCT3 (p=0.0307), and Endo CCT2 (p=0.0284) after treatment with
doxycy cline,
Figure 22A. To determine the knockdown's effect on cell viability, MTT assay
was completed
on transiently transfected cells. MTT assay showed 50% decrease in viable
cells after 48hrs in
CCT2-shRNA treated cells than GFP-shRNA treated cells (p<0.0001), Figure 22B.
IMR32 cells
did not accept the transfection as well, therefore we treated these cells with
a pool of siRNA that
targets CCT2. Actin and DAPI staining shows a 80-60% decrease in actin present
in cells that
were treated with siRNA compared to control, Figure 22C.
184. Lenti viral transduction of CCT2 plasmid increases CCT2 RNA and protein.
To determine
if CCT2 can be overexpressed in SKNAS and IMR32 cell lines, they were
transfected with
lentiviral plasmid to overexpress CCT2. Lentiviral GFP was used for control.
RT-PCR analysis
show statistically significant increases in CCT2 in SKNAS (P=0.0214) but not
in IMR32
(0.2540), Figure 23A. Increases in CCT3 were not statistically significant,
Figure 23A. Western
analysis showed that CCT2 overexpression in SKNAS resulted in statistically
significant
53
CA 03210821 2023- 9- 1
WO 2022/187744
PCT/US2022/019165
decreases in endogenous CCT2 (p=0.0108) and statistically significant
increases in FLAG
(p=0.0040). Overall, the increases in Total CCT2 and CCT3 were not
statistically significant. In
IMR32 cells, the CCT2 overexpression resulted in statistically significant
increases in Total
CCT2 (p=0.0337) and FLAG (p=0.0214) with statistically significant decreases
in Endogenous
CCT2 (p=0.0121). CCT3 remained unchanged.
185. Functional Assays show no change from overexpression of CCT2 in
neuroblastoma cell
lines. To determine the effect overexpression of CCT2 has on the SKNAS cell
lines, a migration
assay was completed. The migration assay showed no significant differences
between the
SKNAS-GFP cell line and the SKNAS-CCT2 cell line, Figure 24A. To determine if
there was an
increase in chaperonin activity, we measured actin levels in SKNAS and IMR32
cell lines and
compared control vs CCT2 overexpressing. The Actin staining remained unchanged
between
overexpressing cell lines and controls, Figure 5B.
Table 1. Primer pairs used in RT-qPCR assay.
CDK4 Forward: TCTGGTACCGAGCTCCCGAA (SEQ ID NO: 8)
Reverse: GATTTGCCCAACTGGTCGG (SEQ ID NO: 9)
CDK2 Forward: ATGGAGAACTTCCAAAAGGTGGA (SEQ ID NO: 10)
Reverse: CAGGCGGATTTTCTTAAGCG (SEQ ID NO: 11)
Cvclin D1 Forward: GCGTCCATGCGGAAGATC (SEQ ID NO: 12)
Reverse: ATGGCCAGCGGGAAGAC (SEQ ID NO: 13)
Cyclin El Forward: GCCAGCCTTGGGACAATAATG (SEQ ID NO: 14)
Reverse: AGTTTGGGTAAACCCGGTCAT (SEQ ID NO: 15)
MYC Forward: GGAGGCTATTCTGCCCATTTG (SEQ ID NO: 16)
Reverse: GAGGCTGCTGGTTTTCCACTA (SEQ ID NO: 17)
P27 Forward: ACCTGCAACCGACGATTCT (SEQ ID NO: 18)
Reverse: CAGGCTTCTTGGGCGTCTG (SEQ ID NO: 19)
P21 Forward: TGAGCCGCGACTGTGATG (SEQ ID NO: 20)
Reverse: GTCTCGGTGACAAAGTCGAAGTT (SEQ ID NO: 21)
GAPDH Forward: GAAGGTGAAGGTCGGAGTCAAC (SEQ ID NO: 22)
Reverse: TGGAAGATGGTGATGGGATTTC (SEQ ID NO: 23)
CCT3 Forward: TCAGTCGGTGGTCATCTTTGG (SEQ ID NO: 24)
Reverse: CCTCCAGGTATCTTTTCCACTCT (SEQ ID NO: 25)
CCT2-FLAG Forward: CAGAGGTGATTCTGCGTGTG (SEQ ID NO: 26)
Reverse: TGTCGTCGTCGTCCTTGTAG (SEQ ID NO: 27)
CCT2 Forward: GTTGGAGAGAAGCCACGAAG (SEQ ID NO: 28)
Reverse: GTTGCCAGAGCCTTTCAGTC (SEQ ID NO: 29)
54
CA 03210821 2023- 9- 1
WO 2022/187744
PCT/US2022/019165
Table 2. Co-occurring genetic alterations of CCT2 with cell cycle genes [From
combined
breast cancer studies (9103 patients/9524 samples in 17 studies) The Cancer
Genome Atlas
(TCGA)].
A B p-Value Tendency
CCT2 CDK4 <0.001 Co-occurrence
MYC CCNE1 <0.001 Co-occurrence
CCNEI CDKN1A <0.001 Co-occurrence
CCND1 CDK4 <0.001 Co-occurrence
CCT2 CCND1 <0.001 Co-occurrence
CDKN1A CDKN1B <0.001 Co-occurrence
CDK4 CDKN1A <0.001 Co-occurrence
CDK4 CDKN1B <0.001 Co-occurrence
CCND1 CDK2 <0.001 Co-occurrence
MYC CDKN1A <0.001 Co-occurrence
CDK4 CDK2 <0.001 Co-occurrence
CDK2 CDKN1B 0.001 Co-occurrence
CCT2 MYC 0.002 Co-occurrence
CCT2 CDK2 0.002 Co-occurrence
MYC CDKN1B 0.002 Co-occurrence
MYC CDK4 0.004 Co-occurrence
MYC CCND1 0.005 Co-occurrence
CCNE I CDKN1B 0.005 Co-occurrence
Table 3. Genetic alterations of CCT subunits in MCF7 and T47D cells (COSMIC
database)
CCT2 subunits alterations
Cell Line
Mutation CNV and
expression
MCF7 CCT6B (Substitution - intronic) CCT3 is
overexpressed
T470 CCT8 (Substitution - intronic) No changes
reported
Table 4. Summary of multiple mixed effect linear regression analysis on
expression of each
gene in response to cell line (T47D vs MCF-7), treatment [lentiviral control
(control) vs CCT2-
FLAG overexpression (over-CCT2)1 and day. Day is set as a continuous variable
with value of 0
for day 0, 1 for day 3, 2 for day 5 and 3 for day 8 of spheroid culture. * p
<0.05, ** p<0.005, ***
p<0.0005, SE: standard error.
Gene Factor Estimated effect SE
P-value Sig.
MYC T47D vs. MCF7 2.459 0.386 0
***
Over-CCT2 vs. Control 0.765 0.386
0.048 *
Day -1.124 0.167 0
***
Intercept -0.623 0.418
0.136
CDK4 T47D vs. MCF7 0.525 0.235
0.025 *
Over-CCT2 vs. Control 0.047 0.235
0.842
Day -0.976 0.105 0 ***
CA 03210821 2023- 9- 1
WO 2022/187744
PCT/US2022/019165
Intercept -0.062 0.257 0.81
CDK2 T47D vs. MCF7 3.276 0.228 0
***
Over-CCT2 vs. Control -0.083 0.228
0.715
Day -1.13 0.102 0
***
Intercept 0.51 0.25 0.041
*
Cyclin D1 T47D vs. MCF7 -0.579 0.348
0.096
Over-CCT2 vs. Control 0.381 0.348
0.274
Day -0.981 0.069 0
***
Intercept -0.406 0.319
0.203
Cyclin D1 in T47D* Over-CCT2 vs. Control 1.130 0.350
0.001 *"
Day -0.930 0.101
0.000 ***
Intercept 0.037 0.290
0.899
Cyclin El T47D vs. MCF7 3.698 0.281 0
***
Over-CCT2 vs. Control 0.122 0.281
0.665
Day -1.266 0.126 0
***
Intercept 0.696 0.308
0.024 *
Total CCT2 T47D vs. MCF7 2.738 0.333 0
***
Over-CCT2 vs. Control 2.448 0.333 0
***
Day -0.845 0.097 0
***
Intercept -0.089 0.323
0.784
CCT2 FLAG T47D vs. MCF7 3.276 0.565 0
***
Over-CCT2 vs. Control
Day -0.657 0.253
0.009 **
Intercept -0.522 0.551
0.344
*MCF7 lentiviral control was used as the reference samples for all analysis
except for cyclin D1
in T47D cells in which the T47D lentiviral control was used as the reference
sample.
Table 5. Sun-unary of multi-factor ANOVA analysis showing effect of individual
factors on the
expression of each gene in response to effects of cell line (T47D vs MCF-7),
treatment lentiviral
control (control) vs CCT2-FLAG overexpression (over-CCT2)1 and 2D (before
spheroid culture)
vs 2D post 3D (after spheroid growth reversal).
Gene Factor Coef. SE P-value Sig.
MYC T47D vs. MCF7 0.455 0.279 0.113
Over-CCT2 vs. Control 0.815 0.279 0.007
**
2D post 3D vs. 2D -0.69 0.301 0.029 *
Intercept -0.603 0.308 0.059
CDK4 T47D vs. MCF7 0.019 0.163 0.906
Over-CCT2 vs. Control 0.314 0.163 0.063
2D post 3D vs. 2D -0.3 0.173 0.093
Intercept -0.009 0.182 0.961
CDK2 T47D vs. MCF7 2.784 0.287 0
***
Over-CCT2 vs. Control 0.667 0.287 0.027 *
2D post 3D vs. 2D -0.221 0.305 0.474
Intercept -0.253 0.321 0.436
Cyclin D1 T47D vs. MCF7 -0.977 0.197 0
***
56
CA 03210821 2023- 9- 1
WO 2022/187744
PCT/US2022/019165
Over-CCT2 vs. Control 0.63 0.197 0.003
**
2D post 3D vs. 2D -0.289 0.212 0.182
Intercept -0.259 0.217 0.242
Cyclin El T47D vs. MCF7 3.275 0.172 0
***
Over-CCT2 vs. Control 0201. 0.172 0.251
2D post 3D vs. 2D 0.022 0.185 0.905
Intercept 0.559 0.19 0.006
**
P21 T47D vs. MCF7 0.377 0.368 0.319
Over-CCT2 vs. Control 1.101 0.368 0.008
**
2D post 3D vs. 2D -0.565 0.368 0.142
Intercept -0.54 0.359 0.149
P27 T47D vs. MCF7 -0.179 0.268 0.514
Over-CCT2 vs. Control 0.213 0.268 0.436
2D post 3D vs. 2D -0.777 0.268 0.009
**
Intercept -0.388 0.262 0.155
Table 6. CCT2 interaction network based on having two or more pieces of
experimental
evidence for interactions (generated using BioGRid)
lnteractor Description
TCP1 t-complex 1
PPP2R2C protein phosphatase 2, regulatory subunit B, gamma
CCT7 chaperonin containing TCP1, subunit 7 (eta)
CCT5 chaperonin containing TCP1, subunit 5 (epsilon)
CCT4 chaperonin containing TCP1, subunit 4 (delta)
TIMG1 tubulin, gamma 1
YAP 1 Yes-associated protein 1
CCT6A chaperonin containing TCP1, subunit 6A (zeta 1)
DCAF7 DDB1 and CUL4 associated factor 7
CCT3 chaperonin containing TCP1, subunit 3 (gamma)
CDC20 cell division cycle 20
STRN striatin, calmodulin binding protein
PPP4C protein phosphatase 4, catalytic subunit
MLST8 MTOR associated protein, LST8 homolog (S. cerevisiae)
CCT8 chaperonin containing TCP1, subunit 8 (theta)
PPP2CA protein phosphatase 2, catalytic subunit, alpha isozyme
ACTR1B ARP1 actin-related protein 1 homolog B, centractin beta
(yeast)
PPP2R2B protein phosphatase 2, regulatory subunit B, beta
CCT6B chaperonin containing TCP1, subunit 6B (zeta 2)
FBXW4 F-box and WD repeat domain containing 4
VCP valosin containing protein
TP53 tumor protein p53
PPP2CB protein phosphatase 2, catalytic subunit, beta isozyme
HDAC1 histone deacetylase 1
PPP2R2D protein phosphatase 2, regulatory subunit B, delta
57
CA 03210821 2023- 9- 1
WO 2022/187744
PCT/US2022/019165
STRN3 striatin, calmodulin binding protein 3
neural precursor cell expressed, developmentally down-
NEDD1 regulated 1
POC1A POC1 centriolar protein A
BUB3 BUB3 mitotic checkpoint protein
DCAF5 DDB1 and CUL4 associated factor 5
FBXW8 F-box and WD repeat domain containing 8
TLK integrin-linked kinase
RFWD2 ring finger and WD repeat domain 2, E3 ubiquitin
protein ligase
IGBP1 immunoglobulin (CD79A) binding protein 1
RFWD3 ring finger and WD repeat domain 3
WDR76 WD repeat domain 76
WDR83 WD repeat domain 83
FYCO1 FYVE and coiled-coil domain containing 1
OBSL1 obscurin-like 1
POC1B POC1 centriolar protein B
MEPCE methylphosphate capping enzyme
CASP7 caspase 7, apoptosis-related cysteine peptidase
WRAP53 WD repeat containing, antisense to TP53
TUBB2A tubulin, beta 2A class Ha
MAPK10 mitogen-activated protein kinase 10
SEC31B SEC31 homolog B (S. cerevisiae)
TUBA1B tubulin, alpha lb
RPTOR regulatoy associated protein of MTOR, complex 1
DDB2 damage-specific DNA binding protein 2, 48kDa
SSSCA1 Sjogren svndrome/scleroderma autoantigen 1
PACRG PARK2 co-regulated
XIAP X-linked inhibitor of apoptosis, E3 ubiquitin protein
ligase
TUBB2B tubulin, beta 2B class fib
CCDC8 coiled-coil domain containing 8
ESR1 estrogen receptor 1
WDR92 WD repeat domain 92
TUBB tubulin, beta class I
TUBA3E tubulin, alpha 3e
ACTL6A actin-like 6A
MYC v-myc avian myelocytomatosis viral oncogene homolog
TUBAL3 tubulin, alpha-like 3
ERCC8 excision repair cross-complementation group 8
PEX7 peroxisomal biogenesis factor 7
FLCN folliculin
TTLL3 tubulin tyrosine ligase-like family, member 3
CYLD cylindromatosis (turban tumor syndrome)
NLE1 notchless homolog 1 (Drosophila)
58
CA 03210821 2023- 9- 1
WO 2022/187744 PCT/US2022/019165
PSMA3 proteasome (prosome, macropain) subunit, alpha type, 3
PPP6C protein phosphatase 6, catalytic subunit
ATP6V1B1 ATPase, H+ transporting, lysosomal 56/58kDa, V1 subunit B1
CDK5 cyclin-dependent kinase 5
C UL7 cullin 7
PARK2 parkin RBR E3 ubiquitin protein ligase
HDAC3 histone deacetylase 3
Table 7
Name Sequence
CT20 VTIFVAGVLTASLTIWKKMG
(SEQ ID NO:1)
CT2O V ASLTIWKKMG
- I
(SEQ ID NO:2)
CT2O V2 VTIFVAGVLT
- (SEQ ID NO:3)
VTIFVAG
CT2O-V3
(SEQ ID NO:4)
CT2O-V4 IFVAG
(SEQ ID NO:5)
IWKKMG
CT2O-V5
(SEQ ID NO:6)
References
1. Bray F, Ferlay J, Soerjomataram I, Siegel RL, Torre LA, Jemal A. Global
cancer
statistics 2018: GLOBOCAN estimates of incidence and mortality worldwide for
36 cancers in
185 countries. CA: A Cancer Journal for Clinicians. 2018;68(6):394-424.
2. Cejalvo JM, Martinez de Duenas E, Galvan P. Garcia-Recio S, Burgues
Gasion 0, Pare
L, et al. Intrinsic Subtypes and Gene Expression Profiles in Primary and
Metastatic Breast
Cancer. Cancer Res. 2017;77(9).2213-21.
3. Cancer Genome Atlas N. Comprehensive molecular portraits of human breast
tumours.
Nature. 2012;490(7418):61-70.
4. Perou CM, Sorlie T, Eisen MB, van de Rijn M, Jeffrey SS, Rees CA, et al.
Molecular
portraits of human breast tumours. Nature. 2000;406(6797):747-52.
5. van de Vijver MJ. Genetic alterations in breast cancer. Current
Diagnostic Pathology.
2000;6(4):271-81.
6. Berns EM, Foekens JA, van Staveren IL, van Putten WL, de Koning HY,
Portengen H, et
al. Oncogene amplification and prognosis in breast cancer: relationship with
systemic treatment.
Gene. 1995;159(1):11-8.
7. Quesnel B, Preudhomme C, Fournier J, Fenaux P. Peyrat JP. MDM2 gene
amplification
in human breast cancer. European journal of cancer. 1994;30A(7):982-4.
8. Turner N, Pearson A, Sharpe R, Lambros M, Geyer F, Lopez-Garcia MA, et
al. FGFR1
amplification drives endocrine therapy resistance and is a therapeutic target
in breast cancer.
Cancer Res. 2010;70(5):2085-94.
9. Lebeau J, Goubin G. Amplification of the epidermal growth factor
receptor gene in the
BT20 breast carcinoma cell line. Int J Cancer. 1987;40(2):189-91.
59
CA 03210821 2023- 9- 1
WO 2022/187744
PCT/US2022/019165
10. An HX, Beckmann MW, Reifenberger G, Bender HG, Niederacher D. Gene
amplification and overexpression of CDK4 in sporadic breast carcinomas is
associated with high
tumor cell proliferation. The American journal of pathology. 1999;154(1):113-
8.
11. Yersal 0, Barutca S. Biological subtypes of breast cancer: Prognostic
and therapeutic
implications. World J Clin Oncol. 2014;5(3):412-24.
12. Peurala E, Koiyunen P, Haapasaari KM, Bloigu R, Jukkola-Vuorinen A. The
prognostic
significance and value of cyclin D1, CDK4 and p16 in human breast cancer.
Breast Cancer Res.
2013;15(1):R5.
13. Bergamaschi A. Kim YH, Wang P, Sorlie T, Hemandez-Boussard T, Lonning
PE, et al.
Distinct patterns of DNA copy number alteration are associated with different
clinicopathological features and gene-expression subtypes of breast cancer.
Genes Chromosomes
Cancer. 2006;45(11):1033-40.
14. Nielsen NH, Loden M, Cajander J, Emdin SO, Landberg G. GI-S transition
defects occur
in most breast cancers and predict outcome. Breast Cancer Res Treat.
1999;56(2):105-12.
15. Otto T, Sicinski P. Cell cycle proteins as promising targets in cancer
therapy. Nat Rev
Cancer. 2017;17(2):93-115.
16. Caldon CE, Daly RI, Sutherland RL, Musgrove EA. Cell cycle control in
breast cancer
cells. J Cell Biochem. 2006;97(2):261-74.
17. Elsheikh S, Green AR, Aleskandarany MA, Grainge M, Paish CE, Lambros
MB, et al.
CCND1 amplification and cyclin D1 expression in breast cancer and their
relation with
proteomic subgroups and patient outcome. Breast Cancer Res Treat.
2008;109(2):325-35.
18. Li Z, Cui J, Yu Q, Wu X, Pan A, Li L. Evaluation of CCND1 amplification
and
CyclinD1 expression: diffuse and strong staining of CyclinD1 could have same
predictive roles
as CCNDI amplification in ER positive breast cancers. American journal of
translational
research. 2016;8(1):142-53.
19. Deming SL, Nass SJ, Dickson RB, Trock BJ. C-myc amplification in breast
cancer: a
meta-analysis of its occurrence and prognostic relevance. Br J Cancer.
2000;83(12):1688-95.
20. Garcia-Gutierrez L, Delgado MD, Leon J. MYC Oncogene Contributions to
Release of
Cell Cycle Brakes. Genes (Basel). 2019;10(3).
21. Bretones G, Delgado MD, Leon J. Myc and cell cycle control. Biochim
Biophys Acta.
2015;1849(5):506-16.
22. Yu Q, Sicinska E, Geng Y. Ahnstrom M, Zagozdzon A, Kong Y, et al.
Requirement for
CDK4 kinase function in breast cancer. Cancer Cell. 2006;9(1):23-32.
23. Shah M, Nunes MR, Stearns V. CDK4/6 Inhibitors: Game Changers in the
Management
of Hormone Receptor-Positive Advanced Breast Cancer? Oncology (Williston
Park).
2018;32(5):216-22.
24. Gao JJ, Cheng J, Bloomquist E, Sanchez J, Wedam SB, Singh H, et al.
CDK4/6 inhibitor
treatment for patients with hormone receptor-positive, HER2-negative, advanced
or metastatic
breast cancer: a US Food and Drug Administration pooled analysis. Lancet
Oncol.
2020;21(2):250-60.
25. Li Z, Zou W, Zhang J, Zhang Y, Xu Q, Li S, et al. Mechanisms of CDK4/6
Inhibitor
Resistance in Luminal Breast Cancer. Front Pharmacol. 2020;11:580251.
CA 03210821 2023- 9- 1
WO 2022/187744
PCT/US2022/019165
26. Du Q, Guo X. Wang M. Li Y. Sun X. Li Q. The application and prospect of
CDK4/6
inhibitors in malignant solid tumors. J Hematol Oncol. 2020;13(1):41.
27. Kim S, Willison KR, Horwich AL. Cystosolic chaperonin subunits have a
conserved
ATPase domain but diverged polypeptide-binding domains. Trends Biochem Sci.
1994;19(12):543-8.
28. Spiess C, Miller EJ, McClellan AJ, Frydman J. Identification of the
TRiC/CCT substrate
binding sites uncovers the function of subunit diversity in eukaryotic
chaperonins. Molecular
cell. 2006;24(1):25-37.
29. Willison KR. The substrate specificity of eukaryotic cytosolic
chaperonin CCT. Philos
Trans R Soc Lond B Biol Sci. 2018;373(1749).
30. Narayanan A, Pullepu D, Kabir MA. The interactome of CCT complex - A
computational analysis. Comput Biol Chem. 2016;64:396-402.
31. Yam AY, Xia Y, Lin HT, Burlingame A, Gerstein M, Frydman J. Defining
the
TRiC/CCT interactome links chaperonin function to stabilization of newly made
proteins with
complex topologies. Nature structural & molecular biology. 2008;15(12):1255-
62.
32. Vallin J, Grantham J. The role of the molecular chaperone CCT in
protein folding and
mediation of cytoskeleton-associated processes: implications for cancer cell
biology. Cell Stress
Chaperones. 2019;24(1):17-27.
33. Liu X, Lin CY, Lei M, Yan S, Zhou T, Erikson RL. CCT chaperonin complex
is required
for the biogenesis of functional Plkl. Mol Cell Biol. 2005;25(12):4993-5010.
34. Wang Q, Huang WR, Chih WY, Chuang KP, Chang CD, Wu Y, et al. Cdc20 and
molecular chaperone CCT2 and CCT5 are required for the Muscovy duck reovirus
p10.8-
induced cell cycle arrest and apoptosis. Veterinary microbiology. 2019;235:151-
63.
35. Dekker C. On the role of the chaperonin CCT in the just-in-time
assembly process of
APC/CCdc20. FEBS Lett. 2010;584(3):477-81.
36. Camasses A, Bogdanova A, Shevchenko A, Zachariae W. The CCT chaperonin
promotes
activation of the anaphase-promoting complex through the generation of
functional Cdc20. Mol
Cell. 2003;12(1):87-100.
37. Won KA, Schumacher RJ, Farr GW, Horwich AL, Reed SI. Maturation of
human cyclin
E requires the function of eukaryotic chaperonin CCT. Mol Cell Biol.
1998;18(12):7584-9.
38. Trinidad AG, Muller PA, Cuellar J, Klejnot M, Nobis M, Valpuesta JM, et
al. Interaction
of p53 with the CCT complex promotes protein folding and wild-type p53
activity. Mol Cell.
2013;50(6):805-17.
39. Kasembeli M, Lau WC, Roh SH, Eckols TK, Frydman J, Chiu W, et al.
Modulation of
STAT3 folding and function by TRiC/CCT chaperonin. PLoS Biol.
2014;12(4):e1001844.
40. Showalter AE, Martini AC, Nierenberg D, Hosang K, Fahmi NA, Gopalan P,
et al.
Investigating Chaperonin-Containing TCP-1 subunit 2 as an essential component
of the
chaperonin complex for tumorigenesis. Sci Rep. 2020;10(1):798.
41. Guest ST, Kratche ZR, Bollig-Fischer A, Haddad R, Ethier SP. Two
members of the
TRiC chaperonin complex, CCT2 and TCP I are essential for survival of breast
cancer cells and
are linked to driving oncogenes. Exp Cell Res. 2015;332(2):223-35.
61
CA 03210821 2023- 9- 1
WO 2022/187744
PCT/US2022/019165
42. Bassiouni R, Nemec KN, Iketani A, Flores 0, Showalter A, Khaled AS, et
al. Chaperonin
Containing TCP-1 Protein Level in Breast Cancer Cells Predicts Therapeutic
Application of a
Cytotoxic Peptide. Clin Cancer Res. 2016;22(17):4366-79.
43. Carr AC, Khaled AS, Bassiouni R, Flores 0, Nierenberg D, Bhatti H, et
al. Targeting
chaperonin containing TCP1 (C CT) as a molecular therapeutic for small cell
lung cancer.
Oncotarget. 2017;8(66):110273-88.
44. Gao J, Aksoy BA, Dogrusoz U, Dresdner G, Gross B, Sumer SO, et al.
Integrative
analysis of complex cancer genomics and clinical profiles using the
cBioPortal. Sci Signal.
2013;6(269):p11.
45. Cerami E, Gao J, Dogrusoz U, Gross BE, Sumer SO, Aksoy BA, et al. The
cBio cancer
genomics portal: an open platform for exploring multidimensional cancer
genomics data. Cancer
Discov. 2012;2(5):401-4.
46. Tate JG, Bamford S, Jubb HC, Sondka Z, Beare DM, Bindal N. et al.
COSMIC: the
Catalogue Of Somatic Mutations In Cancer. Nucleic acids research.
2019;47(D1):D941-D7.
47. Goldman MJ, Craft B, Hastie M, Repecka K, McDade F, Kamath A, et al.
Visualizing
and interpreting cancer genomics data via the Xena platform. Nat Biotechnol.
2020;38(6):675-8.
48. Zwijsen RM, Wientj ens E, Klompmaker R, van der Sman J, Bemards R,
Michalides RJ.
CDK-independent activation of estrogen receptor by cyclin DI. Cell.
I997;88(3):405-15.
49. Guarducci C, Bonechi M, Boccalini G, Benelli M, Risi E, Di Leo A, et
al. Mechanisms
of Resistance to CDK4/6 Inhibitors in Breast Cancer and Potential Biomarkers
of Response.
Breast Care (Basel). 2017;12(5):304-8.
50. Kunjithapatham R, Karthikeyan S, Geschwind JF, Kieserman E, Lin M, Fu
DX, et al.
Reversal of anchorage-independent multicellular spheroid into a monolayer
mimics a metastatic
model. Sci Rep. 2014;4:6816.
51. Smyrek I, Mathew B, Fischer SC, Lissek SM, Becker S, Stelzer EHK. E-
cadherin, actin,
microtubules and FAK dominate different spheroid formation phases and
important elements of
tissue integrity. Biology open. 2019;8(1):bio037051.
52. Chitcholtan K, Asselin E, Parent S, Sykes PH, Evans JJ. Differences in
growth properties
of endometrial cancer in three dimensional (3D) culture and 2D cell monolaver.
Exp Cell Res.
2013;319(1).75-87.
53. Riedl A, Schlederer M, Pudelko K, Stadler M, Walter S, Unterleuthner D,
et al.
Comparison of cancer cells in 2D vs 3D culture reveals differences in AKT-mTOR-
S6K
signaling and drug responses. J Cell Sci. 2017;130(4203-18.
54. Schmidt M, Scholz CJ, Polednik C, Roller J. Spheroid-based 3-
dimensional culture
models: Gene expression and functionality in head and neck cancer. Oncology
reports.
2016;35(4):2431-40.
55. Tanaka H, Watanabe T. Mechanisms Underlying Recurrent Genomic
Amplification in
Human Cancers. Trends Cancer. 2020;6(6):462-77.
56. Jonsson G, Staaf J, Vallon-Christersson J, Ringner M, Holm K, Hegardt
C, et al.
Genomic subtypes of breast cancer identified by array-comparative genomic
hybridization
display distinct molecular and clinical characteristics. Breast Cancer Res.
2010;12(3):R42.
57. Nardulli AM, Katzenellenbogen BS. Progesterone receptor regulation in
T47D human
breast cancer cells: analysis by density labeling of progesterone receptor
synthesis and
degradation and their modulation by progestin. Endocrinology. 1988;122(4):1532-
40.
62
CA 03210821 2023- 9- 1
WO 2022/187744
PCT/US2022/019165
58. Xu J, Chen Y, Olopade OI. MYC and Breast Cancer. Genes Cancer.
2010;1(6):629-40.
59. Chen Y, Olopade 01. MYC in breast tumor progression. Expert Rev
Anticancer Ther.
2008;8(10): 1689-98.
60. Wang Y, Thakur A, Sun Y, Wu J, Biliran H, Bollig A, et al. Synergistic
effect of cyclin
D1 and c-Myc leads to more aggressive and invasive mammary tumors in severe
combined
immunodeficient mice. Cancer Res. 2007;67(8):3698-707.
61. Spiniello M, Steinbrink Ml, Cesnik AJ, Miller RM, Scalf M, Shortreed
MR, et al.
Comprehensive in vivo identification of the c-Myc mRNA protein interactome
using HyPR-MS.
RNA. 2019;25(10:1337-52.
62. Xu G, Bu S. Wang X, Zhang H, Ge H. Suppression of CCT3 inhibits the
proliferation
and migration in breast cancer cells. Cancer Cell Int. 2020;20:218.
63. Qu H, Zhu F, Dong H, Hu X, Han M. Upregulation of CCT-3 Induces Breast
Cancer Cell
Proliferation Through miR-223 Competition and Wnt/f3-Catenin Signaling Pathway
Activation.
Frontiers in oncology. 2020;10:533176-.
64. Wang SH, Li N, Wei Y, Li QR, Yu ZP. beta-catenin deacetylation is
essential for WNT-
induced proliferation of breast cancer cells. Molecular medicine reports.
2014;9(3):973-8.
65. Bilir B, Kucuk 0, Moreno CS. Wnt signaling blockage inhibits cell
proliferation and
migration, and induces apoptosis in triple-negative breast cancer cells. J
Transl Med.
2013;11:280.
66. Ganci F, Pulito C, Valsoni S, Sacconi A, Turco C, Vahabi M, et al. P13K
Inhibitors
Curtail MYC-Dependent Mutant p53 Gain-of-Function in Head and Neck Squamous
Cell
Carcinoma. Clin Cancer Res. 2020;26(12):2956-71.
67. Huang Z, Yu P, Tang J. Characterization of Triple-Negative Breast
Cancer MDA-MB-
231 Cell Spheroid Model. OncoTargets and therapy. 2020;13:5395-405.
68. Kumarasamy V, Vail P, Nambiar R, Witkiewicz AK, Knudsen ES. Functional
determinants of cell-cycle plasticity and sensitivity to CDK4/6 inhibition.
Cancer Res. 2020.
69. Tyler R, Wanigasooriya K. Taniere P, Almond M, Ford S, Desai A, et at A
review of
retroperitoneal liposarcoma genomics. Cancer Treat Rev. 2020;86:102013.
70. Italian A, Cardot N, Dupre F, Monticelli 1, Keslair F, Piche M, et al.
Gains and complex
rearrangements of the 12q13-15 chromosomal region in ordinary lipomas: the
"missing link"
between lipomas and liposarcomas? Int J Cancer, 2007;121(2):308-15.
71. Berglund M, Enblad G, Thunberg U, Amini RM, Sundstrom C, Roos G, et al.
Genomic
imbalances during transformation from follicular lymphoma to diffuse large B-
cell lymphoma.
Modern pathology : an official journal of the United States and Canadian
Academy of
Pathology, Inc. 2007;20(1):63-75.
72. Lin YF, Tsai WP, Liu HG, Liang PH. Intracellular beta-
tubulin/chaperonin containing
TCP1-beta complex serves as a novel chemotherapeutic target against drug-
resistant tumors.
Cancer Res. 2009;69(17):6879-88.
73. Lee MW, Bassiouni R, Sparrow NA, Iketani A, Boohaker RJ, Moskowitz C,
et al. The
CT20 peptide causes detachment and death of metastatic breast cancer cells by
promoting
mitochondrial aggregation and cytoskeletal disruption. Cell Death Dis.
2014;5:e1249.
63
CA 03210821 2023- 9- 1
WO 2022/187744
PCT/US2022/019165
74. Boohaker RJ, Zhang G, Lee MW, Nemec KN, Santra S. Perez JM, et al.
Rational
development of a cytotoxic peptide to trigger cell death. Molecular
pharmaceutics.
2012;9(7):2080-93.
75. Flores 0, Santra S, Kaittanis C, Bassiouni R, Khaled AS, Khaled AR, et
al. PSMA-
Targeted Theranostic Nanocarrier for Prostate Cancer. Theranostics.
2017;7(9):2477-94.
64
CA 03210821 2023- 9- 1