Note: Descriptions are shown in the official language in which they were submitted.
CA 03216395 2023-10-10
WO 2022/223771 PCT/EP2022/060670
TREATMENT OF LUPUS NEPHRITIS WITH ANTI-TYPE I INF RECEPTOR ANTIBODY
ANIFROLUMAB
1. BACKGROUND
[0001] Lupus nephritis (LN) is one of the most prevalent severe disease
manifestations of lupus, occurring
in approximately 40% of SLE patients [1]. LN is more prevalent in African
Americans, Hispanics, and Asians
compared with patients of European descent [2]. The accumulation of immune
complexes and the
subsequent inflammatory response in kidney tissue can lead to irreversible
glomerular and tubulointerstitial
damage [1]. LN is strongly associated with the increased morbidity and pre-
mature mortality in SLE with
the standardized mortality ratio being about 3-fold higher in LN patients
compared with patients with non-
renal SLE and 6- to 9-fold higher compared with the general population.
According to the World Health
Organization (WHO) histological classification, proliferative LN includes
patients with focal Class III and
diffuse Class IV proliferative glomerulonephritis [3], a subset of patients
with poor prognosis, with up to 45%
of patients progressing to end-stage kidney disease within 15 years of
diagnosis [4].
[0002] The ultimate treatment goal for patients with active, proliferative LN
is to prevent end-stage kidney
failure and death [5]. Persistent proteinuria and/or acute kidney dysfunction
indicate renal inflammation and
are risk factors for progressive kidney damage and worse long-term outcomes
[1]. Therefore, short-term
treatment goals include attenuating proteinuria, measured using the urine
protein¨creatinine ratio (UPCR),
and stabilizing/improving the estimated glomerular filtration rate (eGFR) [5].
[0003] Histopathological classes III and IV represent proliferative LN that
generally requires intensive
immunosuppressive therapy to achieve the treatment goal of renal remission,
preserved renal function, and
ultimately prevention of end-stage renal disease (ESRD). Such
immunosuppressive therapy with
Mycophenolate mofetil (MMF) or cyclophosphamide (CYC), in combination with
glucocorticoids, is the
current recommended off-label standard of care treatments for proliferative LN
in international guidelines,
for which an unmet therapeutic need clearly remains; the treatment typically
consists of an initial intensive
immunosuppressive period for 3 to 6 months followed by less intensive therapy
for several years to maintain
remission [5]. However, not all patients respond to this therapy: only 10% to
40% achieve remission after
one year [6] and disease flares are common [7]. Furthermore, the current
treatments have significant side
effects, such as the risk of pre-mature menopause induced by CYC and organ
damage from long-term
glucocorticoid use.
[0004] The Food and Drug Administration (FDA) approved belimumab in 2020 and
voclosporin in 2021 for
the treatment of patients with LN based on positive efficacy results beyond
standard therapy. However, in
phase 3 trials, less than 50% of patients achieved a complete renal response
(CRR) following treatment
with belimumab (CRR; requiring urine protein¨creatinine ratio (UPCR) <0.5
mg/mg) [8-10]. As such, there
remains a need for additional treatment options to further increase response
rates while reducing
glucocorticoid exposure.
1
CA 03216395 2023-10-10
WO 2022/223771 PCT/EP2022/060670
[0005] LN diagnosis is made by renal biopsy and histopathological
classification according to the 2003
ISN/RPS classification criteria [3] and the histopathological classification
also guides treatment. Active
Class III and Class IV LN generally requires initially intensive
immunosuppressive therapy combined with
high dose glucocorticoids followed by several years of continued
immunosuppressive treatment to achieve
the clinically important treatment goals of renal remission, preserved renal
function, and ultimately
prevention of ESKD. The currently recommended immunosuppressive therapy for
Class III and IV LN (used
as off-label in most regions) consists of MMF or cyclophosphamide in
combination with glucocorticoids [5].
[0006] Even if renal outcomes have improved after introduction
immunosuppressive treatment only 10%
to 40% achieve remission after 1 year [6] and disease flares are common.
Importantly, up to 20% of LN
patients develop ESKD within 10 years of initial diagnosis despite treatment
and therapy is associated with
significant side effects including organ damage from long-term glucocorticoid
use. Despite recent approvals
of belimumab in US and EU and voclosporin in US for treatment of adult
patients with active a large unmet
need remains since more than half of patients don't respond to these
therapies. Thus, new effective and
safe therapies targeting novel pathways for treatment of active LN remains in
order to achieve clinical
treatment goals, i.e. improve renal remission rates, reduce flares, and
prevent of ESKD, while reducing the
need for glucocorticoids.
[0007] The unmet need for LN thus remains substantial, with the need for
novel, targeted therapies for
improved renal responses, reduced flares, and prevention of ESRD, as well as
reduced need for
glucocorticoids. LN remission rates remain suboptimal [8], and patients are at
high risk of developing end-
stage kidney disease [4] and drug-related toxicity, particularly relating to
prolonged, high-dose
glucocorticoid use [5].
[0008] Anifrolumab is a human, monoclonal antibody that targets the type I
interferon (IFN) receptor
subunit 1 [11]. Two phase 3 randomized controlled trials TULIP-1 and TULIP-2
(NCT02446899 and
NCT02962960, respectively) demonstrated that 300 mg intravenous (IV) every
four weeks (Q4VV)
anifrolumab provides therapeutic benefit across multiple clinical endpoints
and is well tolerated by patients
with moderate to severe SLE. TULIP-1 and TULIP-2 excluded patients with LN.
The safety and efficacy of
type I IFN receptor inhibitor in patients with LN has not previously been
demonstrated, and anifrolumab is
not approved for the treatment of LN.
[0009] The present invention solves one or more of the above-mentioned
problems.
2. SUMMARY
[0010] The present invention relates to a treatment for lupus nephritis (LN).
Particularly, the invention
relates to the use of a type I IFN receptor (IFNAR1) inhibitor for use in a
method of treating LN. The invention
is supported inter alia by efficacy and safety data from a phase 2,
multicenter, multinational, randomized,
double-blind, placebo-controlled clinical trial (NCT02547922), data from which
is presented herein for the
first time.
2
CA 03216395 2023-10-10
WO 2022/223771 PCT/EP2022/060670
[0011] In another aspect, the invention also relates to safe and efficacious
dosage regimes of a type I
IFNAR (also referred to herein as IFNAR1 and IFNR) inhibitor for use in the
treatment of LN. Surprisingly,
a dose of a IFNAR1 inhibitor that is greater than the IFNAR1 inhibitor dose
previous described for SLE
patients (as described in WO 2013/188494, incorporated herein by reference) is
identified as safe and
efficacious in LN patients. The invention is supported inter alia by efficacy
and safety data from
NCT02547922, data and dosage information for which is presented herein for the
first time.
[0012] The present invention also relates to subcutaneous doses of an IFNAR1
inhibitor and their use in
the treatment of LN. The invention is supported inter alia by efficacy, safety
and PK data from a 2 phase 3,
multicenter, multinational, randomized, double-blind, placebo-controlled
clinical trials in SLE patients
(NCT02446899 and NCT02962960), a Phase 2, multinational, multicenter,
randomized, double-blind,
placebo controlled, parallel-group clinical trial in SLE patients
(NCT02962960), a phase 2, multicenter,
multinational, randomized, double-blind, placebo-controlled clinical trial in
LN patients (NCT02547922) and
a phase I, Randomized, Placebo-Controlled, Double-Blind clinical trial in
health subjects (NCT02601625),
together with PK/PD modelling data that is presented herein for the first
time.
3. BRIEF DESCRIPTION OF FIGURES
Figure 1: IFN scores distribution
[0013] Figure 1A: 4-gene IFN score distribution. Figure 1B: Distribution of
the 21-gene IFNGS in patients
with SLE, LN and Sjogren's syndrome. LN: lupus nephritis; SLE: Systemic Lupus
Erythematosus; HD:
healthy donor.
Figure 2: Study 7 TULIP-LN trial design and patient disposition.
[0014] Figure 2A: Flow Chart of TULIP-LN Trial Design. Figure 2B: Patient
disposition for the completed
52-week double-blind treatment period. All percentages are based on the 145
patients in the full analysis
set. aOf patients not randomized, 179 did not meet the screening criteria, 7
withdrew consent, 2 experienced
AEs, 1 was lost to follow-up, and 1 patient was not included because of the
physician's decision; bone
patient was assigned to but did not receive at least 1 dose of each of the
anifrolumab regimens and
therefore was not included in the analysis; cReasons for not entering the
second-year extension period
included AEs, development of specific trial intervention discontinuation
criteria, patient's decision, and lack
of therapeutic response.
Figure 3: Time to Discontinuation of Investigational Product, Kaplan¨Meier
Plot (mITT Population)
[0015] More patients discontinued trial intervention early in the placebo
(42.9%) group than in both
anifrolumab groups. BR, basic regimen; IR, intensified regimen; mITT, modified
intention-to-treat. At the
time of the primary analysis (Week 52), the second-year study period was still
ongoing; data from patients
who continued into the ongoing second-year study period were censored.
3
CA 03216395 2023-10-10
WO 2022/223771 PCT/EP2022/060670
Figure 4: Key efficacy endpoints over time.
[0016] Figure 4A. A geometric mean (GM) change from baseline in 24-hour UPCR
overtime. GMR of the
relative improvement in 24-hour UPCR for anifrolumab groups vs placebo groups,
where GMR <1 favors
anifrolumab. A P-value (105 for the combined anifrolumab vs placebo group was
deemed significant. All
other P-values presented are nominal. There was a numerically larger
improvement in 24-hour UPCR for
the combined anifrolumab group and anifrolumab IR group versus the placebo
group from Week 12 to
Week 36, and for the anifrolumab IR group versus anifrolumab BR group at all
time points. Figure 4B.
Percentage of patients with CRR over time. Anifrolumab BR responses for all
CRR definitions were
generally similar to or lower than the placebo group at all time points apart
from Week 12. Figure 4C: Key
efficacy endpoints over time. The time to sustained CRR05 was numerically
shorter with anifrolumab IR
than with placebo. Time to CRR05sustained through Week 52. BR, basic regimen;
Cl, confidence interval;
CRR, complete renal response; CRR05, CRR with UPCR (15 mg/mg; GM, geometric
mean; GMR,
geometric mean ratio; HR, hazard ratio; IR, intensified regimen; UPCR, urine
protein¨creatinine ratio. Error
bars represent 95% Cls. aGM of the ratio of the 24-hour UPCR values at each
time point over the baseline
value for each treatment group (values <1 indicate an improvement); cPatients
from Italy and France were
excluded from the analysis; dTime to sustained CRR05 was analyzed post hoc.
Figure 5: 24-hour UPCR, CRR and sustained steroid reduction
[0017] Figure 5A: 24-Hour UPCR Change from Baseline at Week 52 by Subgroup
Forest Plot. There
were no major differences in 24-hour UPCR across predefined subgroups. Figure
5B: CRR and sustained
steroid reduction. Anifrolumab IR was associated with a CRR with sustained
glucocorticoid reduction.
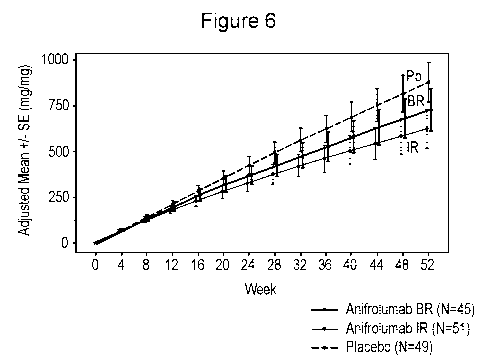
Figure 6. Mean Cumulative Proteinuria (UPCR) Over Time
[0018] Both anifrolumab groups had a numerically lower cumulative proteinuria
than the placebo group
throughout the treatment duration. Mean cumulative proteinuria (area under the
curve in UPCR
standardized by the expected follow-up time) for anifrolumab IR, anifrolumab
BR, and placebo was
assessed using analysis of covariance controlling for baseline UPCR and
stratification factors. All data after
discontinuation are excluded from the analysis. Error bars represent standard
error.
Figure 7: Percentage of Patients with A CRRa and CRR0,5 Over Time
[0019] Figure 7A: Percentage of patients with a CRRa overtime. Figure 7B:
Percentage of patients with
a CRR05 over time. CRRa, complete renal response with inactive urinary
sediment requirement; CRR05,
complete renal response with urine protein¨creatinine ratio (15 mg/mg
requirement; IR, intensified
regimen. Error bars represent 95% confidence intervals.
Figure 8. IFNGS neutralization and measures of disease activity over time.
[0020] Median percentage 21-gene type I IFN PD neutralization among IFNGS test-
high patients. A
median PD neutralization >80% was observed with anifrolumab IR across all
visits (Weeks 12, 24, 36, and
4
CA 03216395 2023-10-10
WO 2022/223771 PCT/EP2022/060670
52) and with anifrolumab BR at Weeks 12 and 24 only, after which there was a
rebound in IFNGS. BR,
basic regimen; IFNGS, interferon gene signature; IR, intensified regimen; LS,
least squares, MAD, median
absolute deviation; PD, pharmacodynamic; PGA, Physician's Global Assessment,
PtGA, Patient's Global
Assessment; SE, standard error; SLEDAI-2K, Systemic Lupus Erythematosus
Disease Activity Index 2000.
Number of patients with non-missing value at visit are presented.
Figure 9. Plots of Anti-dsDNA Antibodies and C3 Complement Levels
[0021] Figure 9A: Compared with the placebo group, patients positive for anti-
dsDNA antibodies at
baseline had numerically greater reductions in anti-dsDNA antibody levels with
anifrolumab IR versus
placebo. Data points are median change from baseline and error bars represent
median absolute deviation.
Figure 9B: Patients with low C3 at baseline had an increase in C3 across
groups (IR and BR). Data points
are median change from baseline and error bars represent median absolute
deviation.
Figure 10. Plot of C4 Complement Levels
[0022] There were no clear differences in C4 increases across groups. Data
points are median change
from baseline and error bars represent median absolute deviation.
Figure 11. SLEDAI-2K, PGA and PtGA
[0023] Compared with placebo, anifrolumab IR elicited numerically greater
improvements from baseline
in measures of disease activity (SLEDAI-2K, PGA, PtGA). Figure 11A: Non-renal
SLEDAI-2K change from
baseline. Figure 11B: PGA change from baseline. Figure 11C: PtGa from
baseline.
Figure 12. Logarithmic Anifrolumab Serum Concentration-Time Profiles
(Pharmacokinetic Analysis
Set)
[0024] BR, basic regimen; IR, intensified regimen; LLOQ, lower limit of
quantitation.
Figure 13. PK Modeling of Anifrolumab Concentrations Over Time for Anifrolumab
Basic and
Intensified Regimens in IFNGS-High Patients With LN and SLE
[0025] Figure 13A: In IFNGS-high patients (94.5%), the median Week 12
anifrolumab steady-state
concentration was 63.4 pg/mL with anifrolumab BR. Figure 13B: The median Week
12 anifrolumab steady-
state concentration was 63.4 pg/mL with anifrolumab IR (-50% lower than in
nonrenal SLE). Dashed black
lines represent median PK concentration at Week 12 steady-state for patients
with LN and nonrenal SLE.
PK modeling was performed using a nonlinear mixed-effect model with NONMEM 7.3
software (ICON
Development Solutions, Ellicott City, MD, United States; 2006). The predicted
anifrolumab concentrations
for patients with SLE are based on data pooled from 4 clinical trials of
anifrolumab in patients with SLE
(n=664): the phase 2, multicenter, open-label study in Japanese patients
(NCT01559090), the phase 2b
global, multicenter MUSE RCT (NCT01438489), and the phase 3 global,
multicenter TULIP-1
(NCT02446912) and TULIP-2 (NCT02446899) RCTs.
CA 03216395 2023-10-10
WO 2022/223771 PCT/EP2022/060670
Figure 14. Overlay of observed concentration profiles for the basic and
intensified treatment
regimen in study 07 and model-projects based on population PK model in
patients with SLE
Figure 15. Estimated Anifrolumab Clearance (L/day) in Patients Depending on
Baseline 24-Hour
UPCR Value (53 mg/mg vs >3 mg/mg)
[0026] Anifrolumab clearance was higher among patients with baseline UPCR >3
mg/mg than those with
UPCR 53 mg/mg. BR, basic regimen; IR, intensified regimen; PK,
pharmacokinetics; UPCR urine protein¨
creatinine ratio. Bars represent median anifrolumab clearance interquartile
range. Using the
Population¨PK model developed for nonrenal SLE, the estimated individual
clearance estimates for
baseline 24-hour UPCR subgroups (53 mg/mg vs >3 mg/mg) in the combined
anifrolumab group were
estimated a nonlinear mixed-effect model with NONMEM 7.3 software, fitted to
anifrolumab BR and
anifrolumab IR datasets. PK data collected from the anifrolumab IR group after
tapering to 300 mg were
excluded, because of the potential impact of tapering on the change of time-
dependent clearance.
Figure 16: Mean anifrolumab serum concentration-time profiles
[0027] Figure 16A: Study MI-CP180 in Scleroderma (SSc) ¨ Mean anifrolumab
serum concentration-time
profiles following a single IV dose. Data represent +/- SD. Mean data below
LLOQ are not plotted. IV,
intravenous; LLOQ, lower limit of quantification; MEDI 546, anifrolumab; n,
number of patients in a
subgroup; SSc, systemic sclerosis. Figure 16B: Study 06 in healthy volunteers
¨ Mean anifrolumab serum
concentration-time profiles following a single SC and IV dose. Samples with
actual collection time deviating
from nominal collection time by >10% were excluded from the mean. IV,
intravenous; N, number of subjects;
SC, subcutaneous.
Figure 17: Study 08 study design and results
[0028] Figure 17A: Study design for phase II of SC anifrolumab in SLE
patients. Study 08 (NCT02962960)
evaluated the effect of two anifrolumab doses every other week. Figure 17B:
Mean serum concentration
of anifrolumab overtime. Figure 17C: Anifrolumab neutralization of the type I
IFN gene signature.
Figure 18: Type I IFN 21-gene signature neutralization in type I IFN test-high
patients in studies 04,
05, and 1013
Figure 19: Computed median AUC Ratios (SC/IV)
[0029] Figure 19A: Computed median AUC Ratio (SC/IV) between weeks 0-52 for
various SC doses. The
computed median AUC Ratio (SC/IV), based on the estimated bioavailability from
Study 06, between weeks
0-52, where the subcutaneous dose is either 75mg (+ sign), 90 mg (empty
squares), 105 mg (circles), 120
mg (triangles), or 135 mg (filled squares). The subcutaneous dose here is
administered once every 7 days
(QV; the IV dose is administered once every 4 weeks (Q4VV) at a dose of 300
mg. Based on the AUC,
both 90 and 105 mg SC QW appear similar to 300 mg IV. Figure 19B: Computed
median AUC ratio (SC/IV)
for 90 mg and 105 mg SC QW. The computed median AUC Ratio (SC/IV), based on
the estimated
6
CA 03216395 2023-10-10
WO 2022/223771 PCT/EP2022/060670
bioavailability ¨7% lower than the bioavailability calculated from Study 06,
between weeks 0-52, where the
subcutaneous dose is either 90 mg SC QW or 105 mg SC.
Figure 20: Anifrolumab concentration over time at different doses
[0030] Figure 20A: A plot showing (computed) trough concentrations of plasma
anifrolumab in a patient
administered either (i) 105 mg of anifrolumab subcutaneously, once every 7
days (straight line); (ii) 300 mg
anifrolumab intravenously, once every 4 weeks (lower dotted line); (ii) 1000
mg anifrolumab intravenously,
once every 4 weeks (upper dotted line). Shaded area represents the area
between 5th and 95th percentiles
of the 300 mg IV Q4W dose. Figure 20B: Anifrolumab trough concentration in
IFNGS high SLE subjects.
Computed trough concentrations of anifrolumab in IFNGS high patients' plasma
after administration as
follows: (i) 300 mg IV Q4W; (ii) 90 mg SC QW; (iii) 105 mg SC QW; (iv) 135 mg
SC QW; (v) 1000 mg IV
Q4W. SC = subcutaneous. Based on trough, both 90 and 105 mg SC QW were
projected to have higher
PD suppressions than 300 mg IV.
Figure 21: Positive Exposure-BICLA relationship observed in TULIP 1 & TULIP 2
in IFNGS high
patients
[0031] Figure 21A: TULIP I, for placebo, 150 mg and 300 mg anifrolumab. Figure
21B: TULIP II, for
placebo and 300 mg.
Figure 22: BICLA dose response
[0032] Figure 22A: Dose response curve, for probability of meeting BICLA
response criteria (in IFNGS
high patients) versus anifrolumab Cave over 52 weeks, showing the predicted
mean (grey line) and 95%
confidence interval (Cl) (dashed area). Patients are grouped by dose (150 mg,
n =62; 300 mg, n=242; and
1000 mg). Figure 22B: Predicted PK and efficacy for different SC doses. The
probability of meeting BICLA
(in IFNGS high patients) for weekly subcutaneous doses starting from 105 mg,
and up to 150 mg.
Assumptions for generating the data include no dose delays/interruptions.
Figure 23: Ctreughs following injection at thigh compared to injection at
abdomen
[0033] Figure 23A: 150 mg SC Q2W. Figure 23B: 300 mg SC Q2W.
Figure 24: Exposure prediction based on 81-87% bioavailability and preliminary
PK modelling
[0034] Anifrolumab Cave medium ratio predicted for 90-150 mg SC QW to 300 mg
Q4W, based on PK
preliminary modelling and bioavailability assumptions.
Figure 25: Anifrolumab Cave over 52 weeks in IFNGS high patients for different
SC and IV doses
[0035] Figure 25A: 105 mg SC QW. Figure 25B: 120 mg SC QW. Figure 25C: Overlap
with 1000 mg IV
Q4W.
7
CA 03216395 2023-10-10
WO 2022/223771 PCT/EP2022/060670
Figure 26: Cave median ratio SC QW to 300 mg IV Q4W
[0036] Figure 26A: 81% bioavailability assumed. Figure 26B: 70%
bioavailability assumed.
Figure 27: Average anifrolumab concentration versus herpes zoster incidence
[0037] The incidence of Herpes Zoster (%) in patients in the Study 1013
receiving placebo, 300 mg IV
anifrolumab or 1000 mg IV anifrolumab.
Figure 28: Median change in UPCR over time for patients with baseline 24-hour
UPCR 5 3 mg/mg
and magnitude of the change in clearance
[0038] Figure 28A: UPCR 5 3. Figure 28B: UPCR >3. CL, clearance, hr, hour, n,
number of patients;
UPCR, urine protein-creatinine ratio; yr, year.
Figure 29: Type I IFN 21-GS in LN patients
Figure 29A: PD suppression over time in study 07 for patients with baseline 24-
hour UPCR > 3 mg/mg by
treatment regimen. Figure 29B: 24-hour UPCR level stratified by percentage
steady state PD suppression
in study 07 for patients with baseline 24-hour UPCR > 3 mg/mg.
Figure 30: Visual predicative check of UPCR model
[0039] Plots are showing 95% confidence intervals for the model-predicted
median (dark grey) and 10th
and 90th percentiles (light grey) of UPCR, together with observed individual
data (circles) and its median
(solid line) and 10th and 90th percentiles (dashed lines). Model predictions
have been corrected for dropout.
Binning is indicated by the vertical lines at the top. BR, basic regimen, IR
intensified regimen, UPCR, urine
protein-creatinine ratio.
Figure 31: Visual predictive check of PK model
[0040] Plots are showing 95% confidence intervals for the model-predicted
median (dark grey) and 10th
and 90th percentiles (light grey) of anifrolumab trough concentrations,
together with observed individual
data (circles) and its median (solid line) and 10th and 90th percentiles
(dashed lines). Model predictions
have been corrected for dropout. Bottom Straight line indicates LLOQ of 0.02
pg/m. The 10th percentile of
the concentration in BR at Week 12 was below the LLOQ. Binning is indicated by
the vertical lines at the
top. BR, basic regimen, IR, intensified regimen, LLOQ, lower limit of
quantification; PK, pharmacokinetic.
Figure 32: Visual predictive check of dropout model
[0041] Plots are showing 95% confidence intervals for the model-predicted
dropout (dark grey), together
with observed dropout (black line). BR, basic regimen; IR, intensified
regimen.
Figure 33: Model-predicted impact of the intensified treatment period on UPCR
response
[0042] BR, basic regimen; IR, intensified regimen; IV, intravenous; Q4W, once
every four weeks; QW,
once a week; SC, subcutaneous; UPCR, urine protein-creatinine ratio.
8
CA 03216395 2023-10-10
WO 2022/223771 PCT/EP2022/060670
Figure 34: Model predictions of PK, UPCR, PD, and clearance for the proposed
regimen
[0043] Simulations are showing the median (bold line) and the 10th to 90th
percentile interval of the
population (shaded area), including only patients that has not dropped out.
Upper left panel is showing
anifrolumab concentrations. Reference lines indicate the median trough
concentration at Week 24 for 300
mg IV Q4W as predicted by the previously developed SLE PK model, and the
estimated IC80 and IC90 of
the PD signature according to the SLE PD model. Upper right panel is showing
UPCR. Percentage numbers
are showing the proportion of patients below the 0.5 mg/mg (accounting also
for the patients that dropped
out). Lower left panel is showing PD suppression. The levels of 80% and 90%
suppression are shown as
references. The lower right panel is showing anifrolumab clearance. CL,
clearance; IC80, 80% inhibitory
concentration; IC90, 90% inhibitory concentration; IV, intravenous; PD,
pharmacodynamics; PK,
pharmacokinetic; SLE, systemic lupus erythematosus; UPCR, urine protein-
creatinine ratio.
Figure 35: 1150 mg SC provides similar AUC to 900mg IV in healthy volunteers
Figure 36: 1150 mg Sc provides similar AUC to 900mg IV in LN patients
[0044] Figure 36A: AUC ratio is close to 1.0 for the entire 6 months of the
intensified treatment. Figure
36B: SC median Ctrough at week 24 (72 pg/mL) is lower compared to SLE patients
on 1000 mg Q4W. .
Figure 36C: PD suppression at troughs remains high throughout the intensified
treatment.
Figure 37: Urinary proteins in LN
[0045] Figure 37A: Urinary Proteins Associated With High NIH-Al and NIH-CI
Scores. Protein
associations (FDR <0.1) are color coded by whether their concentrations
positively (orange, +) or negatively
(blue,-) correlate with the respective outcome. Figure 37A: Urinary Proteins
Associated With Clinical
Characteristics. Protein associations (FDR <0.1)) are color coded by whether
their concentrations positively
(+) or negatively (-) correlate with the respective outcome.
Figure 38: Urinary proteins and IFNGS
[0046] Figure 38A: Urinary Proteins Associated With High IFNGS, and Their
Correlations With Other
Measures. Protein associations (FDR <0.1)) are color coded by whether their
concentrations positively (+)
or negatively (-) correlate with the respective outcome. Figure 38B: Venn
Diagram of Overlap in Significant
Protein Associations Across Three Renal Measures. Only proteins with
statistically significant associations
(FDR<0.1) are listed.
Figure 39: Ingenuity Pathway analysis
[0047] Figure 39A: Ingenuity Pathway Analysis of the 11 Proteins Commonly
Associated With eGFR,
SLEDAI-R, and NIH-Al. Top four disease and molecular function categories as
scored by Fisher's Exact
Test are displayed. Highly redundant categories were removed. Significance
threshold (dashed line).
Figure 39B: Urinary Proteins Unique to All Clinical Features.
9
CA 03216395 2023-10-10
WO 2022/223771 PCT/EP2022/060670
Figure 40. Delivery device
[0048] Anifrolumab is administered by an injection device [1] [9] such as a
prefilled syringe (PFS) (Figure
40A) or an autoinjector (Al) (Figure 40B).
Figure 41. Autoinjector
[0049] The autoinjector for administering anifrolumab of the functional
variant thereof in exploded view
(Figure 41A), assembled (Figure 41B) and filled with drug substance (Figure
41C).
Figure 42. Accessorized pre-filled syringe
[0050] The accessorized pre-filled syringe (APFS) for anifrolumab of the
functional variant thereof. The
primary tube is shown in assembled form (Figure 42A) and in exploded view
(Figure 42B). The APFS with
its additional components is shown in assembled form (Figure 42D).
Figure 43. Packaging for the delivery device
Figure 44. Anifrolumab Heavy Chain alignment
Figure 45. Anifrolumab Light Chain alignment
4. DETAILED DESCRIPTION
4.1. Method of treating lupus nephritis (LN)
[0051] In a first aspect the invention relates to a method of treating lupus
nephritis (LN) in a subject in
need thereof, the method comprising administering a type I IFN receptor
(IFNAR) inhibitor to the subject,
wherein the method reduces lupus nephritis disease activity in the subject.
The method may reduce LN
disease severity in the subject. The method may prevent worsening of LN
disease in the subject. LN
diagnosis of the subject may be made by renal biopsy and histopathological
classification according to the
2003 ISN/RPS classification criteria [3]. LN may be proliferative LN. LN may
be Class III or IV (both with or
without Class V) LN. The IFNAR1 inhibitor may be anifrolumab or a functional
variant thereof.
[0052] The invention also relates to a dosage regime of an IFNAR inhibitor for
the treatment of LN in a
subject. The data provided herein demonstrate that the dosage regime of an
IFNAR previously identified
as suitable for treatment of SLE is insufficient to treat LN. The treatment of
LN requires an intensified dosage
regime (e.g. of 900 mg Q4W IV for at least 3 weeks, or the equivalent
subcutaneous dose) followed by a
basic dosage regime (e.g. of 300 mg Q4W or the equivalent subcutaneous dose).
[0053] Reducing LN disease activity in the subject may comprise treating LN in
the subject. Reducing LN
disease activity may comprise a complete renal response (CRR) in the subject
post-treatment compared to
pre-treatment. A CRR may be achieved by week 36 of treatment. Reducing LN
disease activity in the
subject may comprise a CRR and a UPCR of 0.5 mg/mg post-treatment. Reducing LN
disease activity in
the subject may comprise reduction in proteinuria in the subject post-
treatment compared to proteinuria in
CA 03216395 2023-10-10
WO 2022/223771 PCT/EP2022/060670
the subject pre-treatment. The proteinuria may be measured by UPCR.
Proteinuria may be measured by
24-hour UPCR (see Section 5.5.7). Reducing lupus nephritis disease activity in
the subject may comprise
an alternative CRR (aCRR) in the subject post-treatment (see Section 5.5.5).
The method may comprise
administering Mycophenolate mofetil (MMF) and/or steroid to the subject. The
method may comprise
steroid sparing in the subject, wherein the dose of the steroid administered
to the subject is tapered from a
pre-sparing dose to a post-sparing dose. The post-sparing dose may be
mg/day prednisone or
prednisone equivalent dose (see Section 5.4). The pre-sparing dose may be 20
mg/day or prednisone
equivalent dose. The steroid may comprise a glucocorticoid. The steroid may
comprise an oral
glucocorticoid. The method may comprise hydrocortisone, mometasone,
fluticasone, fluocinolone
acetonide, fluocinolone, flurandrenolone acetonide, ciclesonide, budesonide,
beclomethasone, deflazacort,
flunisolide, beclomethasone dipropionate, betamethasone, betamethasone
valerate, methylprednisolone,
dexamethasone, prednisolone, cortisol, triamcinolone, clobetasol, clobetasol
propionate, clobetasol
butyrate, cortisone, corticosterone, clocortolone, dihydroxycortisone,
alclometasone, amcinonide,
diflucortolone valerate, flucortolone, fluprednidene, fluandrenolone,
fluorometholone, halcinonide,
halobetasol, desonide, diflorasone, flurandrenolide, fluocinonide,
prednicarbate, desoximetasone,
fluprednisolone, prednisone, azelastine, dexamethasone 21-phosphate,
fludrocortisone, flumethasone,
fluocinonide, halopredone, hydrocortisone 17-valerate, hydrocortisone 17-
butyrate, hydrocortisone 21-
acetate, prednisolone, prednisolone 21-phosphate, clobetasol propionate,
triamcinolone acetonide, or a
mixture thereof. The steroid may comprise prednisone.
4.2. The subject
[0054] The subject may be a human subject. The subject may be an adult. The
subject may be a patient
with an elevated type I IFN gene signature. The subject may be a type I
interferon stimulated gene signature
(IFNGS)-test high patient pre-administration with the dose or unit dose. The
subject may have elevated
expression of the genes IF127, IF144, IF144L, and RSAD2 in the whole blood.
The subject may have elevated
expression of the genes IF127, IF144, IF144L, and RSAD2 in the whole blood
compare to a healthy subject.
The method may comprise identifying the subject as IFNGS-test high patient pre-
treatment with the dose
or unit dose. The method may comprise measuring the expression of the genes
IF127, IF144, IF144L, and
RSAD2 in the whole blood of the subject. The method may comprise measuring the
expression of the genes
IF127, IF144, IF144L, and RSAD2 in the whole blood of the subject by RT-PCR.
The method may comprise
measuring the expression of the genes IF127, IF144, IF144L, and RSAD2 in a
sample of whole blood from
the subject by RT-PCR. The subject may be a type I IFN 21-gene signature high
patient. The subject may
be a type I IFN 4-gene signature high patient.
[0055] The invention also relates to a method of treatment of lupus nephritis
comprising analysing the
levels of a protein or proteins in the urine of the subject pre-treatment
and/or post treatment, optionally in
an isolated urine sample from the subject. The protein or proteins may be
identified as elevated in the
subject's urine pre-treatment compared to the level of the protein in a
healthy subject. Post-treatment, the
11
CA 03216395 2023-10-10
WO 2022/223771 PCT/EP2022/060670
level of the protein or proteins in the urine of the subject may be reduced
compared to the pre-treatment
level of the protein or proteins in the urine of the subject.
[0056] The invention also relates to a method for identifying a subject as
suitable for treatment with a
IFNAR1 inhibitor, the method comprising identifying or detecting elevated
expression of a protein or proteins
in an isolated urine sample from the subject compared to expression of the
protein or proteins respectively
in a healthy subject. The IFNAR1 inhibitor may be an IFNAR1 inhibitor
according to the method of the
invention. The method of treatment may be method of treatment of the
invention.
[0057] The subject may have proliferative LN. The subject may have active LN.
The subject may have
Class III or Class IV LN, with or without co-existing Class V LN.
[0058] The protein or proteins may comprise Adiponectin, Alpha-2-Macroglobulin
(A2Macro),
Antithrombin-III (AT-Ill), Apolipoprotein A-I (Apo A-I), Apolipoprotein B (Apo
B), Apolipoprotein C-I (Apo C-
I), Apolipoprotein C-III (Apo C-III), Fatty Acid-Binding Protein, heart (FABP,
heart), Lactoferrin (LTF),
Neuropilin-1, Omentin, Serum Amyloid P-Component (SAP) and/or von VVillebrand
Factor (vVVF).
[0059] The protein or proteins may comprise Apo A-11, Apo B, Apo C-I,
Cathepsin D, EN-RAGE,
Fibrinogen, LTF, MCP-1, RANTES and/or IL-1p. The protein or proteins may
comprise Apo B, Apo C-I,
and/or LTF.
4.3. Pharmaceutical composition
[0060] In another aspect the invention relates to a pharmaceutical composition
for use in treating LN in a
subject thereof, the method comprising subcutaneously administering the
pharmaceutical composition to
the subject, wherein the pharmaceutical composition comprises the unit dose of
the invention.
[0061] In another aspect the invention relates to a pharmaceutical composition
for use in treating LN in a
subject thereof, the method comprising intravenously or subcutaneously
administering the pharmaceutical
composition to the subject.
[0062] In another aspect the invention relates to a pharmaceutical composition
for use in a method of
treating LN in a subject thereof, the method comprising subcutaneously
administering the pharmaceutical
composition to the subject, wherein the pharmaceutical composition comprises a
dose of a IFNAR1 inhibitor
(e.g. anifrolumab or a functional variant thereof), wherein the dose is more
than (>)105 mg and less than
(<)150 mg. The dose of the IFNAR1 inhibitor (e.g. anifrolumab or the
functional variant thereof) may be a
unit dose (unit dose form, pharmaceutical unit dose form, pharmaceutical unit
dose). Functional anifrolumab
variants include antigen-binding fragments of anifrolumab and antibody and
immunoglobulin derivatives of
an
[0063] In another aspect the invention relates to a pharmaceutical composition
for use in a method of
treating lupus nephritis in a subject thereof, the method comprising
subcutaneously administering the
pharmaceutical composition to the subject, wherein the pharmaceutical
composition comprises a dose of
12
CA 03216395 2023-10-10
WO 2022/223771 PCT/EP2022/060670
the IFNAR1 inhibitor (e.g. anifrolumab or functional variant thereof), wherein
administering the
pharmaceutical composition every week provides a plasma concentration in the
subject that is at least
equivalent to the plasma concentration provided by intravenous administration
of 300 mg of the IFNAR1
inhibitor (e.g. anifrolumab or the functional variant thereof) every 4 weeks.
Administering the dose every
week may provide a plasma concentration in the subject that is about
equivalent to the plasma
concentration provided by intravenous administration of 400 mg of the IFNAR1
inhibitor (e.g. anifrolumab
or the functional variant thereof) every 4 weeks. The dose may be <150 mg
(i.e. less than 150 mg) of the
IFNAR1 inhibitor (e.g. anifrolumab or the functional variant thereof). The
dose may be >105 mg (i.e. more
than 105 mg) of the IFNAR1 inhibitor (e.g. anifrolumab or the functional
variant thereof). The dose may be
135 mg (i.e. 135 mg or less) of the IFNAR1 inhibitor (e.g. anifrolumab or the
functional variant thereof).
The dose may be about 120 mg of the IFNAR1 inhibitor (e.g. anifrolumab or the
functional variant thereof).
The dose may be 120 mg of the IFNAR1 inhibitor (e.g. anifrolumab or the
functional variant thereof).
[0064] The pharmaceutical composition may comprise about 105, 110, 115, 120,
125, 130, 135, 140, 145,
150, 155, 160, 165, 170, 175, 180, 185, 190, 195, 200, 205, 210, 215, 220,
225, 230, 235, 240, 245, 250,
255, 260, 265, 270, 275, 280, 285, 290, 300, 305, 310, 800, 805, 810, 820,
825, 830, 835, 840, 845, 850,
855, 860, 865, 870, 875, 880, 885, 890, 895, 890, 900, 905, 910, 915, 920,
925, 930, 935, 940, 945, 950,
955, 960, 965, 970, 975, 980, 985, 990, 1000, 1050, 1010, 1020, 1025, 1030,
1035, 1040, 1045, 1050,
1055, 1060, or 1065 mg of the IFNAR1 inhibitor (e.g. anifrolumab or the
functional variant thereof).
[0065] The pharmaceutical composition may be administered to the subject in a
single administration step
or in multiple administration steps.
[0066] The pharmaceutical composition may be administered at intervals of 6-8
days. The pharmaceutical
composition may be administered once per week (QV. The pharmaceutical
composition may be
administered in a single administration step. The dose may be 120 mg of a
IFNAR1 inhibitor (e.g.
anifrolumab or the functional variant thereof), and the method of treatment
may comprise administering the
dose in a single administration step once per week (QV. The pharmaceutical
composition may be
administered once per week for at least about 4 weeks. The pharmaceutical
composition may be
administered once per week for at least about 8 weeks. The dose or unit dose
may be administered once
per week for at least about 12 weeks. The pharmaceutical composition may be
administered once per week
for at least about 16 weeks. The pharmaceutical composition may be
administered once per week for at
least about 20 weeks. The pharmaceutical composition may be administered once
per week for at least
about 24 weeks. The pharmaceutical composition may be administered once per
week for at least about
28 weeks. The pharmaceutical composition may be administered once per week for
at least about 32
weeks. The pharmaceutical composition may be administered once per week for
about 8 weeks. The
pharmaceutical composition may have a volume permitting delivery to the
subject in a single subcutaneous
administration step. The pharmaceutical composition may have a volume of 0.5
to 1 ml. The pharmaceutical
13
CA 03216395 2023-10-10
WO 2022/223771 PCT/EP2022/060670
composition may have a volume of less than 1 ml. The pharmaceutical
composition may have a volume of
about 0.8 ml.
[0067] Many patients with LN receive corticosteroids (glucocorticoids, oral
corticosteroids, OCS).
However, corticosteroids are associated with organ damage. Anifrolumab permits
tapering of the
corticosteroids (glucocorticoids) in LN patients (steroid sparing). The method
of treatment or method may
comprise administering a corticosteroid to the subject, optionally wherein the
corticosteroid is an oral
corticosteroid. The method may comprise tapering the dose of corticosteroids
administered to the subject
(steroid sparing). The method may comprise administering a first dose of the
corticosteroid and
subsequently administering a second dose of the corticosteroid, wherein the
second dose of the
corticosteroid is lower than the first dose of the corticosteroid. The second
dose of the corticosteroid may
be about a 7.5 mg prednisone-equivalent dose or less (see Table 5). The second
dose of the corticosteroid
may be a 5 mg prednisone-equivalent dose or less. The method or method of
treatment may comprise
administrating the second dose of the corticosteroid once per day. The first
dose of the corticosteroid may
be about a 10 mg prednisone-equivalent dose. The method may comprise tapering
the dose of
corticosteroid administered to the patient from 10 mg or more per day to less
than 10 mg per day. The
method or method of treatment may comprise administering the second dose of
the corticosteroid once per
day. The method may permit administration of a reduced dose of corticosteroids
that is sustained for weeks.
The second dose of the corticosteroid may be administered for at least 24
weeks. The second dose of the
corticosteroid may be administered for at least 28 weeks.
[0068] Administration of the pharmaceutical composition may provide a plasma
concentration of the
IFNAR1 inhibitor (e.g. anifrolumab or the functional variant thereof) in the
patient of 10 pg (i.e. 10 pg or
more). Administration of the pharmaceutical composition may provide a plasma
concentration of the IFNAR
1 inhibitor (e.g. anifrolumab or the functional variant thereof) in the
subject of 10-100 pg/ml. Administration
of the pharmaceutical composition may provide a plasma concentration of the
IFNAR1 inhibitor (e.g.
anifrolumab or the functional variant thereof) in the subject of 20-80 pg/ml.
Administration of the
pharmaceutical composition may provide a plasma concentration of the IFNAR1
inhibitor (e.g. anifrolumab
or the functional variant thereof) in the subject of 30-70 pg/ml.
Administration of the pharmaceutical
composition may provide a trough concentration of the IFNAR1 inhibitor (e.g.
anifrolumab or the functional
variant thereof) in the subject of 20 pg/ml (i.e. 20 pg/ml or more).
Administration of the pharmaceutical
composition may provide a trough concentration of the IFNAR1 inhibitor (e.g.
anifrolumab or the functional
variant thereof) in the subject of 30 pg/ml (i.e. 30 pg/ml or more).
Administration of the pharmaceutical
composition may provide a trough concentration of the IFNAR1 inhibitor (e.g.
anifrolumab or the functional
variant thereof) in the subject of 40 pg/ml (i.e. 40 pg/ml or more).
Administration of the pharmaceutical
composition may provide a trough concentration of the IFNAR1 inhibitor (e.g.
anifrolumab or the functional
variant thereof) in the subject of 20-100 pg/ml. Administration of the
pharmaceutical composition may
provide a trough concentration of the IFNAR1 inhibitor (e.g. anifrolumab or
the functional variant thereof) in
the subject of 30-80 pg/ml. Administration of the pharmaceutical composition
may provide a trough
14
CA 03216395 2023-10-10
WO 2022/223771 PCT/EP2022/060670
concentration of the IFNAR1 inhibitor (e.g. anifrolumab or the functional
variant thereof) in the subject of
40-70 pg/ml.
[0069] The subject may be a human subject. The subject may be an adult. The
subject may have LN. The
subject may be a patient with an elevated type I IFN gene signature. The
subject may be a type I interferon
stimulated gene signature (IFNGS)-test high patient pre-administration with
the dose or unit dose. The
subject may have elevated expression of the genes IF127, IF144, IF144L, and
RSAD2 in the whole blood.
The method may comprise identifying the subject as IFNGS-test high patient pre-
treatment with the dose
or unit dose. The method may comprise measuring the expression of the genes
IF127, IF144, IF144L, and
RSAD2 in the whole blood of the subject. The method may comprise measuring the
expression of the genes
IF127, IF144, IF144L, and RSAD2 in the whole blood of the subject by RT-PCR.
[0070] The pharmaceutical composition may provide a therapeutic effect in the
subject that is at least
equivalent to a therapeutic effect provided by administration of an
intravenous dose of 300 mg anifrolumab
or the functional variant thereof administered once every (Q4VV). The
pharmaceutical composition may
provide a trough concentration of the IFNAR1 inhibitor (e.g. anifrolumab or
the functional variant thereof) in
the subject that is greater than a trough concentration of anifrolumab or the
functional variant thereof
provided by administration of an intravenous dose of 300 mg anifrolumab or the
functional variant thereof
once every 4 weeks (Q4VV). The IFNAR1 inhibitor (e.g. anifrolumab or the
functional variant thereof) may
be comprised within a pharmaceutical composition. The pharmaceutical
composition may comprise 150 to
200 mg/ml of the IFNAR1 inhibitor (e.g. anifrolumab or the functional variant
thereof), 25 to 150 mM of
lysine salt and an uncharged excipient. The pharmaceutical composition may
comprise about 150 mg/mL
anifrolumab or the functional variant thereof. The pharmaceutical composition
may comprise 50 mM lysine
HCI. The pharmaceutical composition may comprise 130 mM trehalose dihydrate.
The pharmaceutical
composition may comprise 0.05% polysorbate 80 or polysorbate 20. The
pharmaceutical composition may
comprise 25 mM histidine/histidine HCI. The pharmaceutical composition may
comprise 150 mg/mL
anifrolumab or the functional variant thereof, 50 mM lysine HCI, 130 mM
trehalose dihydrate, 0.05%
polysorbate 80 and 25 mM histidine/histidine HCI.
[0071] In another aspect, the invention relates to an injection device
comprising the unit dose of the
invention, or the pharmaceutical composition for the use of the invention.
[0072] In another aspect, the invention relates to an injection device
comprising a pharmaceutical
composition. The pharmaceutical in the injection device may comprise >105 mg
(i.e. more than 105 mg)
and <150 mg (i.e. less than 150 mg) of the IFNAR1 inhibitor (e.g. anifrolumab
or a functional variant
thereof). The pharmaceutical composition in the injection device may comprise
about 120 mg of the IFNAR1
inhibitor (e.g. anifrolumab or the functional variant thereof). The
pharmaceutical composition in the injection
device may comprise 120 mg of the IFNAR1 inhibitor (e.g. anifrolumab or the
functional variant thereof).
The pharmaceutical composition in the injection device may comprise about 1150
mg of the IFNAR1
inhibitor (e.g. anifrolumab or the functional variant thereof). The
pharmaceutical composition in the injection
CA 03216395 2023-10-10
WO 2022/223771 PCT/EP2022/060670
device may comprise 1150 mg of the IFNAR1 inhibitor (e.g. anifrolumab or the
functional variant thereof).
The injection device may comprise 0.8 ml of the pharmaceutical composition.
The injection device may
comprise 7.7 ml of the pharmaceutical composition. The concentration of the
IFNAR1 inhibitor (e.g.
anifrolumab or the functional variant thereof) in the pharmaceutical
composition in the injection device may
be 150 mg/ml. The volume of the pharmaceutical composition in the injection
device may be at least about
0.8m1. The volume of the pharmaceutical composition may be about 0.8m1.
[0073] The pharmaceutical composition in the injection device may comprise 150
to 200 mg/ml
anifrolumab or the functional variant thereof, 25 to 150 mM of lysine salt and
an uncharged excipient. The
pharmaceutical composition in the injection device may comprise 150 mg/mL
anifrolumab or the functional
variant thereof. The pharmaceutical composition in the injection device may
comprise 50 mM lysine HCI.
The pharmaceutical composition may comprise 130 mM trehalose dihydrate. The
pharmaceutical
composition in the injection device may comprise 150 to 200 mg/ml anifrolumab
or the functional variant
thereof, 25 to 150 mM of lysine salt and an uncharged excipient. The
pharmaceutical composition in the
injection device may comprise 150 mg/mL anifrolumab or the functional variant
thereof. The pharmaceutical
composition may comprise 50 mM lysine HCI. The pharmaceutical composition in
the injection device may
comprise 130 mM trehalose dihydrate. The pharmaceutical composition in the
injection device may
comprise 0.05% polysorbate 80 or polysorbate 20. The pharmaceutical
composition in the injection device
may comprise 25 mM histidine/histidine HCI. The pharmaceutical composition in
the injection device may
comprise 150 mg/mL anifrolumab or the functional variant thereof, 50 mM lysine
HCI, 130 mM trehalose
dihydrate, 0.05% polysorbate 80 and 25 mM histidine/histidine HCI.
4.4. Device
[0074] As well as providing for subcutaneous administration of the antibody,
the ability to self-administer
(e.g. for home use) may further be enhanced by subcutaneous administration via
an accessorized pre-filled
syringe (APFS), an auto injector (Al), or a combination thereof. Such devices
have been found to be well-
tolerated and reliable for administering subcutaneous doses of an antibody and
provide further options for
optimizing patient care. Indeed, such devices may reduce the burden of
frequent clinic visits for patients.
An example of a suitable APFS device is described in Ferguson et. al. [12],
which is incorporated herein by
reference in its entirety.
[0075] The dose elucidated by the inventors provides yet advantages in the
context of APFS-
administration, as an APFS device typically administers a maximal volume of 1
ml. A dose in the range of
>105 mg to < 155 mg can be readily accommodated by a volume of ¨0.8 ml, such
that the dose(s) of the
present invention are uniquely suited to APFS and Al administration. For
comparison, due to viscosity of
the anifrolumab, larger doses (particularly doses of >150 mg) would need to be
administered within a
volume of > 1m1, requiring at least two SC injections, which is inconvenient
for the patient, and would require
a plurality of pre-filled devices
16
CA 03216395 2023-10-10
WO 2022/223771 PCT/EP2022/060670
[0076] The delivery device may be single use, disposable system that is
designed to enable manual, SC
administration of the dose.
[0077] In another aspect the invention relates to an injection device
comprising a unit dose. The unit dose
may comprise >105 mg (i.e. at least 105 mg) and <150 mg (i.e. less than 150
mg) of the IFNAR1 inhibitor,
optionally wherein the IFNAR1 inhibitor is anifrolumab or a functional variant
thereof. The unit dose may
comprise
35 mg (i.e. 135 mg or less) of the IFNAR1 inhibitor, optionally wherein the
IFNAR1 inhibitor is
anifrolumab or the functional variant thereof. The unit dose may comprise
about 120 mg of the IFNAR1
inhibitor, optionally wherein the IFNAR1 inhibitor is anifrolumab or the
functional variant thereof. The unit
dose in the injection device may comprise 120 mg of the IFNAR1 inhibitor,
optionally wherein the IFNAR1
inhibitor is anifrolumab or the functional variant thereof. The unit dose in
the injection device may consist
essentially of >105 mg and <150 mg of the IFNAR1 inhibitor, optionally wherein
the IFNAR1 inhibitor is
anifrolumab or the functional variant thereof. The unit dose in the injection
device may consist essentially
of
135 mg of the IFNAR1 inhibitor, optionally wherein the IFNAR1 inhibitor is
anifrolumab or the functional
variant thereof. The unit dose in the injection device may consist essentially
of about 120 mg anifrolumab
or the or the functional variant thereof. The concentration of anifrolumab or
the functional variant thereof in
the unit dose in the injection device may be about 150 mg/ml. The volume of
the unit dose in the injection
device may be less than lml. The unit dose in the injection device may have a
volume of 0.5 to 1 ml. The
concentration of the unit dose may be about 0.8 ml. The volume of the unit
dose may be 0.8 ml. The unit
dose in the injection device may comprise a formulation of 150 to 200 mg/ml
anifrolumab or the functional
variant thereof, 25 to 150 mM of lysine salt and an uncharged excipient. The
unit dose in the injection device
may comprise a formulation of 150 to 200 mg/ml anifrolumab or the functional
variant thereof, 25 to 150
mM of lysine salt and an uncharged excipient. The unit dose comprises a
formulation of 25 mM histidine-
HCL, 130 mM trehalose, and 0.05% w/v polysorbate 80. The formulation may have
a pH of about 5.9.
[0078] In another aspect the invention relates to an injection device
comprising a unit dose. The unit dose
may comprise 1150 mg of the IFNAR inhibitor, optionally wherein the IFNAR1
inhibitor is anifrolumab or a
functional variant thereof. The concentration of anifrolumab or the functional
variant thereof in the unit dose
in the injection device may be about 150 mg/ml. The volume of the unit dose in
the injection device may be
less than lml. The unit dose in the injection device may have a volume of 0.5
to 1 ml. The concentration of
the unit dose may be about 0.8 ml. The volume of the unit dose may be 0.8 ml.
The volume of the unit dose
in the injection device may be about 1 ml. The volume of the unit dose in the
injection device may be 7.7m1.
The unit dose in the injection device may comprise a formulation of 150 to 200
mg/ml anifrolumab or the
functional variant thereof, 25 to 150 mM of lysine salt and an uncharged
excipient. The unit dose in the
injection device may comprise a formulation of 150 to 200 mg/ml anifrolumab or
the functional variant
thereof, 25 to 150 mM of lysine salt and an uncharged excipient. The unit dose
comprises a formulation of
25 mM histidine-HCL, 130 mM trehalose, and 0.05% w/v polysorbate 80. The
formulation may have a pH
of about 5.9.
17
CA 03216395 2023-10-10
WO 2022/223771 PCT/EP2022/060670
[0079] The injection device may be a pre-filled syringe (PFS). The injection
device may be an accessorized
pre-filed syringe (AFPS). The injection device may be an auto-injector (Al).
4.5. Kit
[0080] In another aspect the invention relates to a kit comprising a unit dose
of the invention and
instructions for use, wherein the instructions for use comprise instructions
for subcutaneous administration
of the unit dose to a subject.
[0081] In another aspect the invention relates to a kit comprising the
pharmaceutical composition for the
use of the invention, wherein the instructions for use comprise instructions
for subcutaneous administration
of the pharmaceutical composition to a subject.
[0082] In another aspect the invention relates to a kit comprising the
injection device of any of the
invention, and instructions for use, wherein the instruction for use comprise
instructions for use of the
injection device to subcutaneously administer the unit dose or pharmaceutical
composition to the subject.
[0083] The instructions for use may specify that the injection device, unit
dose and/or pharmaceutical
composition are for use in the treatment of lupus nephritis. The kit of the
invention may comprise packaging,
wherein the packaging is adapted to hold the injection device and the
instructions for use. The instructions
for use may be attached to the injection device. The instruction for use may
comprise instructions for
administration of >105 mg and <150 mg anifrolumab or functional variant
thereof. The instruction for use
may comprise instructions for administration of 135 mg anifrolumab or the
functional variant thereof. The
instruction for use may comprise instructions for administration of 120 mg
anifrolumab or the functional
variant thereof. The instruction for use may comprise instructions for
administration of 120 mg anifrolumab
or the functional variant thereof every 4 weeks. The instructions for use may
define the subject as having a
type I IFN mediated disease. The instructions may define the subject as having
LN. The instructions for use
may be written instructions. The instructions may specify that the unit dose
of pharmaceutical composition
is for use according a method of the invention. The instruction for use may
comprise instructions for
subcutaneous administration of anifrolumab or functional variant thereof. The
instruction for use may
comprise instructions for administration of 1150 mg anifrolumab or functional
variant thereof. The
instructions for use may define the subject as having a type I IFN mediated
disease. The instructions may
define the subject as having LN. The instructions for use may be written
instructions. The instruction for
use may comprise instructions for intravenous administration of anifrolumab or
functional variant thereof.
The instruction for use may comprise instructions for administration of 900 to
1000 mg anifrolumab or
functional variant thereof. The instruction for use may comprise instructions
for administration of 900 mg
anifrolumab or functional variant thereof. The instructions for use may define
the subject as having a type I
IFN mediated disease.
[0084]
18
CA 03216395 2023-10-10
WO 2022/223771 PCT/EP2022/060670
4.6. Dose regimes
[0085] In another aspect the invention relates to an IFNAR1 inhibitor dosage
regimen for the treatment of
LN. The dosage regimen may comprise a first intensive regime (IR) comprising
x3 intravenous 900 mg
doses Q4W, followed by basic regime (BR) of a) weekly subcutaneous 120 mg
dose, or b) an intravenous
300 mg dose Q4W (or a mixture of a) and b)). The IFNAR1 inhibitor may be
anifrolumab or a functional
variant thereof.
[0086] In another aspect the invention relates to an IFNAR1 inhibitor dosage
regimen for the treatment of
LN. The dosage regimen may comprise a first intensive regime (IR) comprising
x6 intravenous 900 mg
doses Q4W, followed by basic regime (BR) of a) weekly subcutaneous 120 mg
dose, or b) an intravenous
300 mg dose Q4W (or a mixture of a) and b)). The IFNAR1 inhibitor may be
anifrolumab or a functional
variant thereof.
[0087] In another aspect the invention relates to an IFNAR1 inhibitor dosage
regimen for the treatment of
LN. The dosage regimen may comprise a first intensive regime (IR) comprising
x6 subcutaneous 1150 mg
doses Q4W, followed by basic regime (BR) of a) weekly subcutaneous 120 mg
dose, or b) an intravenous
300 mg dose Q4W (or a mixture of a) and b)). The IFNAR1 inhibitor may be
anifrolumab or a functional
variant thereof.
[0088] The method may comprise administering intravenously an intravenous dose
of an IFNAR1 inhibitor
(e.g. anifrolumab or the functional variant thereof to the subject). The
intravenous dose may be n00 mg of
an IFNAR1 inhibitor (e.g. anifrolumab or the functional variant thereof). The
intravenous dose may be
'1000mg of an IFNAR1 inhibitor (e.g. anifrolumab or the functional variant
thereof). The intravenous dose
may be 900 mg to 1000 mg of an IFNAR1 inhibitor (e.g. anifrolumab or the
functional variant thereof). The
intravenous dose may be >300 mg of an IFNAR1 inhibitor (e.g. anifrolumab or
the functional variant
thereof). The intravenous dose may be about 300 mg, about 900 mg or 1000 mg of
an IFNAR1 inhibitor
(e.g. anifrolumab or the functional variant thereof). The intravenous dose may
be 300 mg, 900 mg or 1000
mg of an IFNAR1 inhibitor (e.g. anifrolumab or the functional variant
thereof). The intravenous dose may
be administered about every four weeks (Q4VV). The intravenous dose may be
administered about every
month. A dose of 300 mg IV dose may be administered using an infusion pump
over a minimum of 30
minutes. A dose of 900 mg IV dose may be administered using an infusion pump
over a minimum of 60
minutes. An anifrolumab 300 mg IV dose may be supplied as a 2 ml vial, at a
concentration of 150 mg/mL.
[0089] The method may comprise administering subcutaneously a subcutaneous
dose of anifrolumab or
the functional variant thereof. The subcutaneous dose may be administered
after, before or in between
intravenous administration of the intravenous dose. The subcutaneous dose may
be >105 mg and <150
mg anifrolumab or the functional variant thereof. The subcutaneous dose may be
135 mg anifrolumab or
the functional variant thereof. The subcutaneous dose may be about 120 mg
anifrolumab or the functional
variant thereof. The subcutaneous dose may be administered in a single
administration step. The
subcutaneous dose may be administered at intervals of 6-8 days. The
subcutaneous dose may be
19
CA 03216395 2023-10-10
WO 2022/223771 PCT/EP2022/060670
administered once per week. The subcutaneous dose may have a volume of 0.5 to
1 ml. The subcutaneous
dose may have a volume of 0.5 to 1.0 ml. The subcutaneous dose may have a
volume of about 0.8 ml. The
subcutaneous dose may have a volume of 0.8 ml. The subcutaneous dose may about
1150 mg (e.g. 1155
or 1150 mg) anifrolumab or the functional variant thereof. The subcutaneous
dose may have a volume of
about 8 ml. The subcutaneous dose may have a volume of about 7.7m1.
[0090] The method may comprise administering to the subject a first dose of a
IFNAR1 inhibitor, followed
by a second dose of the IFNAR1 inhibitor, wherein the first dose is higher
than the second dose. The first
dose may be administered intravenously. The first dose may be >300 mg. The
first dose may be 1000 mg.
The first dose may be about 900 mg. The first dose may be administered Q4W.
The first dose may be
administered to the subject 3 times before the second dose is administered to
the subject. The first dose
may be administered to the subject 6 times before the second dose is
administered to the subject. The first
dose may be administered every 4 weeks for 12 weeks before the second dose is
administered. The first
dose may be administered every 4 weeks for 24 weeks before the second dose is
administered. The first
dose may be administered subcutaneous. The first dose may be about 1150 mg or
1150 mg. The first dose
may be administered Q4W. The first dose may be administered to the subject 3
times before the second
dose is administered to the subject. The first dose may be administered to the
subject 6 times before the
second dose is administered to the subject. The first dose may be administered
every 4 weeks for 12 weeks
before the second dose is administered. The first dose may be administered
every 4 weeks for 24 weeks
before the second dose is administered. The intravenous dose may be
administered as part of an intensive
dosage regime (IR), wherein the total dose of the IFNAR1 inhibitor
administered during the IR is 2.7 to 81g,
optionally 72.9 g, over a 12 to 24 week period. The IR may comprise
administration of a Sc dose of the
IFNAR1 inhibitor that is equivalent to an IV dose of 900 to 1000 mg Q4W.
[0091] The second dose may be administered subcutaneously. The second dose may
be >105 mg and
135 mg and administer subcutaneously. The second dose may be about 120 mg and
administer
subcutaneously. The second dose may be administered once per week.
[0092] The second dose may be administered intravenously. The second dose may
be administered every
month. The second dose may be administered Q4W. The second dose may be n00 mg.
The second dose
may be '1000mg and administered intravenously. The second dose may be about
300 mg and
administered intravenously. The dose may be about 900 mg and administered
intravenously Q4W, wherein
the second dose is about 120mg administered subcutaneously QW. The dose may be
about 900 mg and
administered intravenously Q4W, wherein the second dose is about 300 mg
administered intravenously
Q4W, optionally wherein the first dose is administered to the subject at least
3 times before the second
dose is administered to the patient, optionally wherein the first dose is
administered to the subject at least
6 times before the second dose is administered to the patient. The second dose
may be administered for
at least a year.
CA 03216395 2023-10-10
WO 2022/223771 PCT/EP2022/060670
[0093] The method may comprise administering a unit dose or pharmaceutical
composition comprising
about 105, 110, 115, 120, 125, 130, 135, 140, 145, 150, 155, 160, 165, 170,
175, 180, 185, 190, 195, 200,
205, 210, 215, 220, 225, 230, 235, 240, 245, 250, 255, 260, 265, 270, 275,
280, 285, 290, 300, 305, 310,
800, 805, 810, 820, 825, 830, 835, 840, 845, 850, 855, 860, 865, 870, 875,
880, 885, 890, 895, 890, 900,
905, 910, 915, 920, 925, 930, 935, 940, 945, 950, 955, 960, 965, 970, 975,
980, 985, 990, 1000, 1050,
1010, 1020, 1025, 1030, 1035, 1040, 1045, 1050, 1055, 1060, or 1065 mg of an
IFNAR1 inhibitor (e.g.
anifrolumab or the functional variant thereof).
4.7. Unit dose
[0094] A unit dose (also referred to as a unit dose form, a pharmaceutical
unit dose or a pharmaceutical
unit dose form) is a dose formed from a single unit. A unit dose (unit dose
form) is suitable for administration
to a subject in a single administration step. A unit dose (unit dose form) may
be packaged in a single-unit
container, for example a single-use pre-filled syringe or autoinjector. Unit
doses provide the advantage that
they can be ordered, packaged, handled and administered as single dose units
containing a pre-determined
amount of a drug. Unit doses decrease administration errors and reduce waste.
[0095] In another aspect the present invention relates to a unit dose
(pharmaceutical unit dose, unit dose
form or pharmaceutical unit dose form) for subcutaneous administration
comprising >105 mg (i.e. more
than 105 mg) and <150 mg (i.e. less than 150 mg) of an IFNAR1 inhibitor (e.g.
anifrolumab or a functional
variant thereof). The unit dose may comprise 105 mg to 149 mg of an IFNAR
inhibitor.
[0096] The unit dose may comprise 135 mg (i.e. 135 mg or less) of an IFNAR1
inhibitor. The unit dose
may comprise 105 mg to 135 mg of an IFNAR inhibitor. The unit dose may
comprise about 120 mg of the
IFNAR1 inhibitor. The unit dose may comprise 120 mg of the IFNAR1 inhibitor.
The unit dose may consist
essentially of >105 mg and <150 mg of the IFNAR1 inhibitor. The unit dose may
consist essentially of 135
mg of the IFNAR1 inhibitor. The unit dose may consist essentially of about of
the IFNAR1 inhibitor. The
concentration of the IFNAR1 inhibitor in the unit dose may be about 150 mg/ml.
The volume of the unit dose
may be less than lml. The dose or unit dose may have a volume of 0.5 to 1 ml.
The concentration of the
unit dose may be about 0.8 ml. The volume of the unit dose may be 0.8 ml. The
unit dose may comprise a
formulation of 150 to 200 mg/ml of the IFNAR1 inhibitor, 25 to 150 mM of
lysine salt and an uncharged
excipient. The unit dose may comprise a formulation of 150 to 200 mg/ml
anifrolumab or the functional
variant thereof, 25 to 150 mM of lysine salt and an uncharged excipient. The
unit dose comprises a
formulation of 25 mM histidine-HCL, 130 mM trehalose, and 0.05% w/v
polysorbate 80. The formulation
may have a pH of about 5.9.
[0097] The unit dose may comprise 135 mg (i.e. 135 mg or less) of an IFNAR1
inhibitor (e.g. anifrolumab
or the functional variant thereof). The unit dose may comprise about 120 mg of
an IFNAR1 inhibitor (e.g.
anifrolumab or the functional variant thereof). The unit dose may comprise 120
mg of an IFNAR1 inhibitor
(e.g. anifrolumab or the functional variant thereof. The unit dose may consist
essentially of >105 mg and
21
CA 03216395 2023-10-10
WO 2022/223771 PCT/EP2022/060670
<150 mg anifrolumab or the functional variant thereof). The unit dose may
consist essentially of 135 mg
of an IFNAR1 inhibitor (e.g. anifrolumab or the functional variant thereof).
The unit dose may consist
essentially of about 120 mg of an IFNAR1 inhibitor (e.g. anifrolumab or the or
the functional variant thereof).
The concentration of an IFNAR1 inhibitor (e.g. anifrolumab or the functional
variant thereof) in the unit dose
may be about 150 mg/ml. The volume of the unit dose may be less than 1mI. The
dose or unit dose may
have a volume of 0.5 to 1 ml. The concentration of the unit dose may be about
0.8 ml. The volume of the
unit dose may be 0.8 ml. The unit dose may comprise a formulation of 150 to
200 mg/ml anifrolumab or the
functional variant thereof, 25 to 150 mM of a lysine salt and an uncharged
excipient. The unit dose may
comprise a formulation of 150 to 200 mg/ml anifrolumab or the functional
variant thereof, 25 to 150 mM of
a lysine salt and an uncharged excipient. The unit dose comprises a
formulation of 25 mM histidine-HCL,
130 mM trehalose, and 0.05% w/v polysorbate 80. The formulation may have a pH
of about 5.9. The unit
dose may comprise 1150 or 1155mg of anifrolumab or the functional variant
thereof.
[0098] The dose or unit dose may be 105 mg, 106 mg, 107 mg, 108 mg, 109 mg,
110 mg, 111 mg, 112
mg, 113 mg, 114 mg, 115 mg, 116 mg, 117 mg, 118 mg, 119 mg, 120 mg, 121 mg,
122 mg, 123 mg, 124
mg or 125 mg, 126 mg, 127 mg, 128 mg, 129 mg, 130 mg, 131 mg, 132 mg, 133 mg,
134 mg, 135 mg, 136
mg, 137 mg, 138 mg, 139 mg, 140 mg, 141 mg, 142 mg, 143 mg, 144 mg, 145 mg,
146 mg, 147 mg, 148
mg, or 149 mg, 150 mg, 151 mg, 152 mg, 153 mg, 154 mg, 155 mg, 156 mg, 157 mg,
158 mg, 159 mg,
160 mg, 161 mg, 162 mg, 163 mg, 164 mg, 165 mg, 166 mg, 167 mg, 168 mg, 167 mg
168 mg, 169 mg,
170 mg, 171 mg, 172 mg, 173 mg, 174 mg, 175 mg, 176 mg, 177 mg, 178 mg, 179
mg, 180 mg, 181, mg,
182 mg, 183 mg, 184 mg, 185 mg, 186 mg, 187 mg, 188 mg, 189 mg, 190 mg, 191
mg, 192 mg, 193 mg,
194 mg, 195 mg, 196 mg, 197 mg, 198 mg, 199 mg, 200 mg, 205 mg, 210 mg, 215
mg, 220 mg, 225 mg,
230 mg, 235 mg, 240 mg, 245 mg, 250 mg, 255 mg, 260 mg, 265 mg, 270 mg, 275
mg, 280 mg, 285 mg,
290 mg, 300 mg, 305 mg, 310 mg, 800 mg, 805 mg, 810 mg, 820 mg, 825 mg, 830
mg, 835 mg, 840 mg,
845 mg, 850 mg, 855 mg, 860 mg, 865 mg, 870 mg, 875 mg, 880 mg, 885 mg, 890
mg, 895 mg, 890 mg,
900 mg, 905 mg, 910 mg, 915 mg, 920 mg, 925 mg, 930 mg, 935 mg, 940 mg, 945
mg, 950 mg, 955 mg,
960 mg, 965 mg, 970 mg, 975 mg, 980 mg, 985 mg, 990 mg, 1000 mg, 1050 mg, 1010
mg, 1020 mg, 1025
mg, 1030 mg, 1035 mg, 1040 mg, 1045 mg, 1050 mg, 1051 mg, 1052 mg, 1053 mg,
1054 mg, 1055 mg,
1056 mg, 1057 mg, 1058 mg, 1059 mg, 1060 mg, 1061 mg, 1062 mg, 1063 mg, 1064
mg, or 1065 mg of
an IFNAR1 inhibitor (e.g. anifrolumab or the functional variant thereof).
[0099] In another aspect, the invention relates to a method for treating LN in
a subject, the method of
treatment comprising subcutaneously administering the unit dose of the
invention to a subject having LN.
In another aspect the invention relates to a method of treating a LN in a
subject, the method comprising
subcutaneously administering a dose of anifrolumab or a functional variant
thereof, wherein the dose is
>105 mg and <150 mg.
[0100] In another aspect, the invention relates to a method of treating LN in
a subject, the method
comprising subcutaneously administering a dose of anifrolumab or a functional
variant thereof, wherein
22
CA 03216395 2023-10-10
WO 2022/223771 PCT/EP2022/060670
administering the dose every week provides a plasma concentration in the
subject that is at least equivalent
to the plasma concentration provided by intravenous administration of 300 mg
of anifrolumab or the
functional variant thereof every 4 weeks. Administering the dose every week
may provide a plasma
concentration in the subject that is more than the plasma concentration
provided by intravenous
administration of 300 mg of anifrolumab or the functional variant thereof
every 4 weeks. Administering the
dose every week may provide a plasma concentration in the subject that is at
least equivalent to the plasma
concentration provided by intravenous administration of 400 mg of anifrolumab
or the functional variant
thereof every 4 weeks. The dose may be administered in a single-administration
step. The dose
administered to the subject may be <150 mg (i.e. less than 150 mg) of an
IFNAR1 inhibitor (e.g. anifrolumab
or the functional variant thereof). The dose administered to the subject may
be >105 mg (i.e. more than
105 mg) of an IFNAR1 inhibitor (e.g. anifrolumab or the functional variant
thereof). The dose administered
to the subject may be 135 mg (i.e. 135 mg or less) of an IFNAR1 inhibitor
(e.g. anifrolumab or the functional
variant thereof). The dose administered to the subject may be about 120 mg of
an IFNAR1 inhibitor (e.g.
anifrolumab or the functional variant thereof).
[0101] The methods of the invention may comprise administering the dose or
unit dose at intervals of 6-8
days. The dose or unit dose may be administered once per week (QV. The dose or
unit dose may be 120
mg anifrolumab or the functional variant thereof, wherein the method comprises
administering the dose in
a single administration step once per week (QV. In other words, the method
comprises administering 120
mg QW of anifrolumab of the functional variant thereof. The dose or unit dose
may be administered once
per week for at least about 4 weeks. The dose or unit dose may be administered
once per week for at least
about 8 weeks. The dose or unit dose may be administered once per week for at
least about 12 weeks.
The dose or unit dose may be administered once per week for at least about 16
weeks. The dose or unit
dose may be administered once per week for at least about 20 weeks. The dose
or unit dose may be
administered once per week for at least about 24 weeks. The dose or unit dose
may be administered once
per week for at least about 28 weeks. The dose or unit dose may be
administered once per week for at
least about 32 weeks. The dose or unit dose may be administered once per week
for about 8 weeks. The
dose or unit dose may have a volume suitable for delivery in a single
subcutaneous administration step.
The dose or unit dose may have a volume of 0.5 to 1 ml. The dose or unit dose
may have a volume of less
than 1 ml. The dose or unit dose may have a volume of about 0.8 ml.
[0102] Administration of the dose or unit dose may provide a plasma
concentration of anifrolumab or the
functional variant thereof in the patient of 10 pg (i.e. 10 pg or more)
anifrolumab or the functional variant
thereof per ml of plasma (i.e. a plasma concentration of 10 pg/ml).
Administration of the dose or unit dose
may provide a plasma concentration of anifrolumab or the functional variant
thereof in the subject of about
10-100 pg/ml. Administration of the dose or unit dose may provide a plasma
concentration of anifrolumab
or the functional variant thereof in the subject of 20-80 pg/ml.
Administration of the dose or unit dose may
provide a plasma concentration of anifrolumab or the functional variant
thereof in the subject of 30-70 pg/ml.
Administration of the dose or unit dose may provide a trough concentration of
anifrolumab or the functional
23
CA 03216395 2023-10-10
WO 2022/223771 PCT/EP2022/060670
variant thereof in the subject of 20 pg/ml (i.e. 20 pg/ml or more).
Administration of the dose or unit dose
may provide a trough concentration of an IFNAR1 inhibitor (e.g. anifrolumab or
the functional variant thereof
in the subject of 30 pg/ml (i.e. 30 pg/ml or more). Administration of the dose
or unit dose may provide a
trough concentration of an IFNAR1 inhibitor (e.g. anifrolumab or the
functional variant thereof in the subject
of 40 pg/ml (i.e. 40 pg/ml or more)). Administration of the dose or unit dose
may provide a trough
concentration of anifrolumab or the functional variant thereof in the subject
of 20-100 pg/ml. Administration
of the dose or unit dose may provide a trough concentration of anifrolumab or
the functional variant thereof
in the subject of about 30-80 pg/ml. Administration of the dose or unit dose
may provide a trough
concentration of anifrolumab or the functional variant thereof in the subject
of 40-70 pg/ml.
[0103] The dose or unit dose may provide a therapeutic effect in the subject
that is at least equivalent to
a therapeutic effect provided by administration of an intravenous dose of 300
mg of an IFNAR1 inhibitor
(e.g. anifrolumab or the functional variant thereof) administered once every
(Q4VV). The dose or unit dose
may provide a trough concentration of anifrolumab or the functional variant
thereof in the subject that is
greater than a trough concentration of anifrolumab or the functional variant
thereof provided by
administration of an intravenous dose of 300 mg anifrolumab or the functional
variant thereof once every 4
weeks (Q4VV).
4.8. IFNAR1 inhibitor
[0104] A "type I interferon receptor inhibitor" refers to a molecule that is
antagonistic for the receptor of
type I interferon ligands such as interferon-a and interferon-6 (IFNAR,
IFNAR1). Such inhibitors,
subsequent to administration to a patient, preferably provide a reduction in
the expression of at least 1
(preferably at least 4) pharmacodynamic (PD) marker genes selected from the
group consisting of IF16,
RSAD2, IF144, IF144L, IF127, MX1, IFIT1, HERC5, I5G15, LAMP3, OAS3, OAS1,
EPST1, IFIT3, LY6E,
OAS2, PLSCR1, SIGLECI, USP18, RTP4, and DNAPTP6. The at least 4 genes may
suitably be IF127,
IF144, IF144L, and RSAD2. The "type I interferon receptor" is preferably
interferon-a/6 receptor (IFNAR).
[0105] For example, the type I interferon receptor inhibitor may be an
antibody or antigen-binding fragment
thereof that inhibits type I IFN activity (by inhibiting the receptor). An
example of a suitable antibody or
antigen-binding fragment thereof (that inhibits type I IFN activity) is an
interferon-a/6 receptor (IFNAR)
antagonist. The type I interferon receptor inhibitor may be an antibody or
antigen-binding fragment thereof
that inhibits type I IFN activity. Additionally or alternatively, the type I
interferon receptor inhibitor may be a
small molecule inhibitor of a type I interferon receptor (e.g. for
pharmacological inhibition of type I interferon
receptor activity).
[0106] The IFNAR1 inhibitor may be a human monoclonal antibody specific for
IFNAR1. The IFNAR1
inhibitor may be a modified IgG1 class human monoclonal antibody specific for
IFNAR1.
[0107] The antibody may comprise a heavy chain variable region complementarity
determining region 1
(HCDR1) comprising the amino acid sequence of SEQ ID NO: 3. The antibody may
comprise a heavy chain
24
CA 03216395 2023-10-10
WO 2022/223771 PCT/EP2022/060670
variable region complementarity determining region 2 (HCDR2) comprising the
amino acid sequence of
SEQ ID NO: 4. The antibody may comprise a heavy chain variable region
complementarity determining
region 3 (HCDR3) comprising the amino acid sequence of SEQ ID NO: 5. The
antibody may comprise a
light chain variable region complementarity determining region 1 (LCDR1)
comprising the amino acid
sequence SEQ ID NO: 6 The antibody may comprise a light chain variable region
complementarity
determining region 2 (LCDR2) comprising the amino acid sequence SEQ ID NO: 7.
The antibody may
comprise a light chain variable region complementarity determining region 3
(LCDR3) comprising the amino
acid sequence SEQ ID NO: 8.
[0108] The antibody may comprise a human heavy chain variable region
comprising the amino acid
sequence of SEQ ID NO: 1. The antibody may comprise a human light chain
variable region comprising
the amino acid sequence of SEQ ID NO: 2. The antibody may comprise a human
light chain constant region
comprising the amino acid sequence of SEQ ID NO: 9. The antibody may comprise
a human heavy chain
constant region comprising the amino acid sequence of SEQ ID NO: 10. The
antibody may comprise in the
Fc region an amino acid substitution of L234F, as numbered by the EU index as
set forth in Kabat and
wherein said antibody exhibits reduced affinity for at least one Fc ligand
compared to an unmodified
antibody. The antibody may comprise a human heavy chain comprising the amino
acid sequence of SEQ
ID NO: 11. The antibody may comprise a human light chain comprising the amino
acid sequence of SEQ
ID NO: 12.
[0109] The antibody may comprise: (a) a heavy chain variable region
complementarity determining region
1 (HCDR1) comprising the amino acid sequence of SEQ ID NO: 3;(b) a heavy chain
variable region
complementarity determining region 2 (HCDR2) comprising the amino acid
sequence of SEQ ID NO: 4; c)
a heavy chain variable region complementarity determining region 3 (HCDR3)
comprising the amino acid
sequence of SEQ ID NO: 5; (d) a light chain variable region complementarity
determining region 1 (LCDR1)
comprising the amino acid sequence SEQ ID NO: 6; (e) a light chain variable
region complementarity
determining region 2 (LCDR2) comprising the amino acid sequence SEQ ID NO: 7;
and 0 a light chain
variable region complementarity determining region 3 (LCDR3) comprising the
amino acid sequence SEQ
ID NO: 8.
[0110] The antibody may comprise (a) a human heavy chain comprising the amino
acid sequence of SEQ
ID NO: 11; and (b) a human light chain comprising the amino acid sequence of
SEQ ID NO: 12.
[0111] The IFNAR1 inhibitor may be anifrolumab or a functional variant
thereof.
4.9. Formulations
[0112] The anifrolumab or the functional variant thereof may be comprised
within a pharmaceutical
composition. The pharmaceutical composition may comprise 150 to 200 mg/ml
anifrolumab or the functional
variant thereof, 25 to 150 mM of a lysine salt and an uncharged excipient. The
pharmaceutical composition
may comprise 150 mg/mL anifrolumab or the functional variant thereof. The
pharmaceutical composition
CA 03216395 2023-10-10
WO 2022/223771 PCT/EP2022/060670
may comprise 50 mM lysine HCI. The pharmaceutical composition may comprise 130
mM trehalose
dihydrate. The pharmaceutical composition may comprise 0.05% polysorbate 80 or
polysorbate 20. The
pharmaceutical composition may comprise 25 mM histidine/histidine HCI. The
pharmaceutical composition
may comprise 150 mg/mL anifrolumab or the functional variant thereof, 50 mM
lysine HCI, 130 mM
trehalose dihydrate, 0.05% polysorbate 80 and 25 mM histidine/histidine HCI.
[0113] Stable formulations suitable for administration to subjects and
comprising anifrolumab are
described in detail in US patent 10125195 B1, which is incorporated herein in
its in entirety.
5. DEFINITIONS
5.1. IFNAR inhibitors
[0114] Anifrolumab (MEDI-546, anifro, AND is a human immunoglobulin G1 kappa
(IgG1k) monoclonal
antibody (mAb) directed against subunit 1 of the type I interferon receptor
(IFNAR1, IFN-aR1, IFNAR).
Anifrolumab downregulates IFNAR signaling and suppresses expression of IFN-
inducible genes.
Disclosures related to anifrolumab can be found in U.S. Patent No. 7662381 and
U.S. Patent No. 9988459,
which are incorporated herein by reference in their entirety. The sequence
information for anifrolumab is
provided in the WHO recommended INN: List 71 (WHO Drug information, Vol. 28,
No. 1,2014) and Peng
etal. [13]. Sequence information for anifrolumab is also provided in Table 1
and Figure 44 and Figure 45.
Table 1: Sequences
EVQLVQSGAEVKKPGESLKI SCKGSGYIFTNYWIAWVRQMPGKGLESMGIIYPGD
Anifrolumab VH (SEQ ID NO: 1) SDIRYSPSFQGQVT I SADKS I TTAYLQWS S LKAS
DTAMYYCARHDIEGFDYWGRG
TLVTVSS
EIVLTQS PGTLSLS PGERAT LS CRASQSVSSSFFAWYQQKP GQAP RLLIYGASSR
Anifrolumab VK (SEQ ID NO: 2)
ATGI P DRLS GS GS GTDFT LT IT RLEP EDFAVYYCQQYDSSAITFGQGTRLEI K
HCDR1 (SEQ ID NO: 3) NYWIA
HCDR2 (SEQ ID NO: 4) IIYPGDSDIRYSPSFQG
HCDR3 (SEQ ID NO: 5) HDIEGFDY
LCDR1 (SEQ ID NO: 6) RASQSVS SS FFA
LCDR2 (SEQ ID NO: 7) GAS S RAT
LCDR3 (SEQ ID NO: 8) QQYDS SAIT
Light chain constant region RTVAAP SVFI FP P S DEQLKS
GTASVVCLLNNFYPREAKVQWKVDNALQ SGNSQES
(SEQ ID NO: 9) VTEQDSKDSTYSLS ST LT LS KADYEKHKVYACEVTHQGLS S PVT KS
FNRGEC
AST KGP SVFPLAP S SKSTSGGTAALGCLVKDYFPEPVTVSWNSGALTSGVHTFPA
Heavy chain constant region
VLQ S S GLYS LS SVVTVPS SSLGTQTYI CNVNHKP SNT KVDKRVEPKSCDKTHT CP
26
CA 03216395 2023-10-10
WO 2022/223771
PCT/EP2022/060670
(SEQ ID NO: 10)
PCPAPEFEGGP SVFLFPPKPKDTLMI SRT PEVTCVVVDVSHEDPEVKFNWYVDGV
EVHNAKT KP REEQYNS TYRVVSVLTVLHQDWLNGKEYKCKVSNKAL PAS I EKT I S
KAKGQPREPQVYTLPP SREEMT KNQVS LT CLVKGFYP SDIAVEWESNGQPENNYK
TT P PVLDSDGS FFLYS KLTVDKSRWQQGNVFS C SVMHEALHNHYTQKS LS LS P GK
EVQLVQSGAEVKKPGESLKI SCKGSGYI FTNYWIAWVRQMPGKGLESMGI I YP GD
SDI RYSP SFQGQVT I SADKS I TTAYLQWS SLKASDTAMYYCARHDI EGFDYWGRG
TLVTVS SAS TKGP SVFPLAP S S KS T S GGTAALGCLVKDYFPEPVTVSWNS GALT S
GVHTFPAVLQS S GLYS LS SVVTVPSSSLGTQTYICNVNHKPSNTKVDKRVEPKSC
Heavy chain
DKTHT CP PC PAPEFEGGP SVFL FP PKPKDTLMI SRTPEVTCVVVDVSHEDPEVKF
(SEQ ID NO: 11) NWYVDGVEVHNAKT KP REEQYN
STYRVVSVLTVLHQDWLNGKEYKCKVSNKAL PA
S I EKT I S KAKGQPREPQVYT LP PSREEMTKNQVSLTCLVKGFYP SDIAVEWESNG
QPENNYKTT PPVLDSDGS FFLYSKLTVDKSRWQQGNVFSCSVMHEALHNHYTQKS
LSLSPGK
EIVLTQS PGTLSLS PGERAT LS CRASQ SVS S S FFAWYQQKPGQAPRLL I YGAS SR
Light chain ATGI
P DRLS GS GS GTDFT LT I T RLEPEDFAVYYCQQYDS SAI T FGQGT RLEI KRT
(SEQ ID NO: 12)
VAAPSVFI FP P SDEQLKS GTASVVCLLNNFYPREAKVQWKVDNALQ S GNS QESVT
EQDSKDS TYSL S ST LT LS KADYEKHKVYACEVTHQGL S S PVT KS FNRGEC
[0115] Anifrolumab is an immunoglobulin comprising an HCDR1, HCDR2 and HCDR3
of SEQ ID NO: 3,
SEQ ID NO: 4, and SEQ ID NO: 5, respectively (or functional variant thereof);
and an LCDR1, LCDR2 and
LCDR3 of SEQ ID NO: 6, SEQ ID NO: 7, and SEQ ID NO: 8, respectively (or
functional variant thereof).
Anifrolumab is an immunoglobulin comprising a VH of SEQ ID NO: 1 and a VL of
SEQ ID NO: 2.
[0116] The constant region of anifrolumab has been modified such that
anifrolumab exhibits reduced
affinity for at least one Fc ligand compared to an unmodified antibody.
Anifrolumab is a modified IgG class
monoclonal antibody specific for IFNAR1 comprising in the Fc region an amino
acid substitution of L234F,
as numbered by the EU index as set forth in Kabat (1991, NIH Publication 91-
3242, National Technical
Information Service, Springfield, Va.). Anifrolumab is a modified IgG class
monoclonal antibody specific for
IFNAR1 comprising in the Fc region an amino acid substitution of L234F, L235E
and/or P331S, as
numbered by the EU index as set forth in Kabat (1991, NIH Publication 91-3242,
National Technical
Information Service, Springfield, Va.). Anifrolumab is an antibody comprising
a light chain constant region
of SEQ ID NO: 9. Anifrolumab is an antibody comprising a heavy chain constant
region of SEQ ID NO: 10.
Anifrolumab is an antibody comprising a light chain constant region of SEQ ID
NO: 9 and a heavy chain
constant region of SEQ ID NO: 10. Anifrolumab is an antibody comprising a
heavy chain of SEQ ID NO:
11. Anifrolumab is an antibody comprising a light chain of SEQ ID NO: 12.
Anifrolumab is an antibody
comprising a heavy chain of SEQ ID NO: 11 and a light chain of SEQ ID NO: 12.
[0117] Functional variants of anifrolumab are sequence variants that perform
the same function as
anifrolumab. Functional variants of anifrolumab are variants that bind the
same target as anifrolumab and
27
CA 03216395 2023-10-10
WO 2022/223771 PCT/EP2022/060670
have the same effector function as anifrolumab. Functional variants of
anifrolumab are variants that bind
the same target as anifrolumab and have the same effector function as
anifrolumab with the same or greater
affinity. Functional anifrolumab variants include antigen-binding fragments of
anifrolumab and antibody and
immunoglobulin derivatives of anifrolumab. Functional variants include
biosimilars and interchangeable
products. The terms biosimilar and interchangeable product are defined by the
FDA and EMA. The term
biosimilar refers to a biological product that is highly similar to an
approved (e.g. FDA approved) biological
product (reference product, e.g. anifrolumab) in terms of structure and has no
clinically meaningful
differences in terms of pharmacokinetics, safety and efficacy from the
reference product. The presence of
clinically meaningful differences of a biosimilar may be assessed in human
pharmacokinetic (exposure)
and pharmacodynamic (response) studies and an assessment of clinical
immunogenicity. An
interchangeable product is a biosimilar that is expected to produce the same
clinical result as the reference
product in any given patient.
[0118] For example, a variant of the reference (anifrolumab) antibody may
comprise: a heavy chain CDR1
having at most 2 amino acid differences when compared to SEQ ID NO: 3; a heavy
chain CDR2 having at
most 2 amino acid differences when compared to SEQ ID NO: 4; a heavy chain
CDR3 having at most 2
amino acid differences when compared to SEQ ID NO: 5; a light chain CDR1
having at most 2 amino acid
differences when compared to SEQ ID NO: 6; a light chain CDR2 having at most 2
amino acid differences
when compared to SEQ ID NO: 7; and a light chain CDR3 having at most 2 amino
acid differences when
compared to SEQ ID NO: 8; wherein the variant antibody binds to the target of
anifrolumab (e.g. IFNAR)
and preferably with the same affinity.
[0119] A variant of the reference (anifrolumab) antibody may comprise: a heavy
chain CDR1 having at
most 1 amino acid difference when compared to SEQ ID NO: 3; a heavy chain CDR2
having at most 1
amino acid difference when compared to SEQ ID NO: 4; a heavy chain CDR3 having
at most 1 amino acid
difference when compared to SEQ ID NO: 5; a light chain CDR1 having at most 1
amino acid differences
when compared to SEQ ID NO: 6; a light chain CDR2 having at most 1 amino acid
difference when
compared to SEQ ID NO: 7; and a light chain CDR3 having at most 1 amino acid
difference when compared
to SEQ ID NO: 8; wherein the variant antibody binds to the target of
anifrolumab (e.g. IFNAR) optionally
with the same affinity.
[0120] A variant antibody may have at most 5, 4 or 3 amino acid differences
total in the CDRs thereof
when compared to a corresponding reference (anifrolumab) antibody, with the
proviso that there is at most
2 (optionally at most 1) amino acid differences per CDR. A variant antibody
may have at most 2 (optionally
at most 1) amino acid differences total in the CDRs thereof when compared to a
corresponding reference
(anifrolumab) antibody, with the proviso that there is at most 2 amino acid
differences per CDR. A variant
antibody may have at most 2 (optionally at most 1) amino acid differences
total in the CDRs thereof when
compared to a corresponding reference (anifrolumab) antibody, with the proviso
that there is at most 1
amino acid difference per CDR.
28
CA 03216395 2023-10-10
WO 2022/223771 PCT/EP2022/060670
[0121] A variant antibody may have at most 5, 4 or 3 amino acid differences
total in the framework regions
thereof when compared to a corresponding reference (anifrolumab) antibody,
with the proviso that there is
at most 2 (optionally at most 1) amino acid differences per framework region.
Optionally a variant antibody
has at most 2 (optionally at most 1) amino acid differences total in the
framework regions thereof when
compared to a corresponding reference (anifrolumab) antibody, with the proviso
that there is at most 2
amino acid differences per framework region. Optionally a variant antibody has
at most 2 (optionally at
most 1) amino acid differences total in the framework regions thereof when
compared to a corresponding
reference (anifrolumab) antibody, with the proviso that there is at most 1
amino acid difference per
framework region.
[0122] A variant antibody may comprise a variable heavy chain and a variable
light chain as described
herein, wherein: the heavy chain has at most 14 amino acid differences (at
most 2 amino acid differences
in each CDR and at most 2 amino acid differences in each framework region)
when compared to a heavy
chain sequence herein; and the light chain has at most 14 amino acid
differences (at most 2 amino acid
differences in each CDR and at most 2 amino acid differences in each framework
region) when compared
to a light chain sequence herein; wherein the variant antibody binds to the
same target antigen as the
reference (anifrolumab) antibody (e.g. IFNAR) and preferably with the same
affinity.
[0123] The variant heavy or light chains may be referred to as "functional
equivalents" of the reference
heavy or light chains. A variant antibody may comprise a variable heavy chain
and a variable light chain as
described herein, wherein: the heavy chain has at most 7 amino acid
differences (at most 1 amino acid
difference in each CDR and at most 1 amino acid difference in each framework
region) when compared to
a heavy chain sequence herein; and the light chain has at most 7 amino acid
differences (at most 1 amino
acid difference in each CDR and at most 1 amino acid difference in each
framework region) when compared
to a light chain sequence herein; wherein the variant antibody binds to the
same target antigen as the
reference (anifrolumab) antibody (e.g. IFNAR) and preferably with the same
affinity.
[0124] Functional variants of anifrolumab include the antibodies described in
WO 2018/023976 Al,
incorporated herein by reference (Table 2).
Table 2: anti-IFNAR antibody sequences
H15D10 VH EVQLVQSGAE VKKPGESLRI S c SEQ ID NO: 13
KG S GYT FT NYWVAWVRQM
PGKGLESMGI IYPGDS DT RY
SPSFQGHVTI SADKSI STAY
L8C3 VL DI QMTQS PS SLSASLGDRVTITCRASQN SEQ ID NO:
14
VGNYLNWYQQKPGKAPKLLIYRASNLAS
GVPSRFSGSGSGTDFTLTISSLQPEDFA
TYYCQQMEHAP PT FGQGTKVEI KR
L16C11 VL EIVLTQSPGTLSLSPGERATLSCRASQS SEQ ID NO: 15
VI GYYLAWYQQKPGQAPRLLI YSVS TLA
SGIPDRFSGSGSGTDFTLTISRLEPEDF
AVYYCQQYYRFP IT FGQGTKVEI K
29
CA 03216395 2023-10-10
WO 2022/223771 PCT/EP2022/060670
H19B7 VH EVQLVQSGAE VKKPGESLRI SEQ ID NO: 16
SCKGSGYT FT NYWMAWVRQM
PGKGLESMGI IYPSDSDTRY
SPSFQGHVTI SADKSISTAY
LQWSSLKASD TAMYYCARHD
VEGYDYWGQG TLVTVSS
[0125] Functional variants include antibodies comprising the VH amino acid
sequence SEQ ID NO: 13.
Functional variants include antibodies comprising the VH amino acid sequence
SEQ ID NO: 16. Functional
variants include antibodies comprising the VL amino acid sequence SEQ ID NO:
14. Functional variants
include antibodies comprising the VL amino acid sequence SEQ ID NO: 15.
Functional variants include
antibodies comprising the VL amino acid sequence SEQ ID NO: 16. Functional
variants include antibodies
comprising the VH sequence SEQ ID NO: 13 and VL amino acid sequence SEQ ID NO:
16. Functional
variants include antibodies comprising the VH sequence SEQ ID NO: 13 and VL
amino acid sequence SEQ
ID NO: 15. Functional variants include antibodies comprising the VH sequence
SEQ ID NO: 16 and VL
amino acid sequence SEQ ID NO: 15. Functional variants include antibodies
comprising the VH sequence
SEQ ID NO: 16 and VL amino acid sequence SEQ ID NO: 14.
[0126] IFNAR inhibitors may be a monoclonal antibody comprising the VH amino
acid sequence SEQ ID
NO: 13. The anti-IFNAR antibodies may comprise the VH amino acid sequence SEQ
ID NO: 16. The anti-
IFNAR antibodies may comprise the VL amino acid sequence SEQ ID NO: 14. The
anti-IFNAR antibodies
may comprise the VL amino acid sequence SEQ ID NO: 15. The anti-IFNAR
antibodies may comprise the
VL amino acid sequence SEQ ID NO: 16. The anti-IFNAR antibodies may comprise
the VH sequence SEQ
ID NO: 13 and VL amino acid sequence SEQ ID NO: 16. The anti-IFNAR antibodies
may comprise the VH
sequence SEQ ID NO: 13 and VL amino acid sequence SEQ ID NO: 15. The anti-
IFNAR antibodies may
comprise the VH sequence SEQ ID NO: 16 and VL amino acid sequence SEQ ID NO:
15. The anti-IFNAR
antibodies may comprise the VH sequence SEQ ID NO: 16 and VL amino acid
sequence SEQ ID NO: 14.
[0127] Functional variants of anifrolumab and anti-IFNAR antibodies include
the QX006N antibody
described in CN 11327807, incorporated herein by reference.
Table 3: QX006N antibody sequences
EVQLVESGGGLVQPGGSLRLSCAASGFSLSSYYMTWVRQAPGKGLEWVSV
VH (SEQ ID NO: 17) INVYGGT YYASWAKGRFT I SRDNSKNTLYLQMNSLRAEDTAVYYCAREDV
AVYMAI D LWGQ GT LVTVS S
Al QMTQS PS SL SASVGDRVT I TCQASQS I SNQLSWYQQKPGKAPKLLI YD
VL (SEQ ID NO: 18) AS SLAS GVP S RFS GS RS GTKFTLTI
SSLQPEDFATYYCLGIYGDGADDGI
AFGGGTKVEIK
HCDR1 (SEQ ID NO: 19) SYYMT
CA 03216395 2023-10-10
WO 2022/223771 PCT/EP2022/060670
HCDR2 (SEQ ID NO: 20) VI NVYGGTYYASWAKG
HCDR3 (SEQ ID NO: 21) EDVAVYMAI D L
LCDR1 (SEQ ID NO: 22) QASQS I SNQLS
LCDR2 (SEQ ID NO: 23) DAS S LAS
LCDR3 (SEQ ID NO: 24) LGIYGDGADDGIA
[0128] IFNAR inhibitors may be a monoclonal antibody comprising the VH amino
acid sequence SEQ ID
NO: 17. The anti-IFNAR antibodies may comprise the VL amino acid sequence SEQ
ID NO: 18.
[0129] QX006N is an immunoglobulin comprising an HCDR1, HCDR2 and HCDR3 of SEQ
ID NO: 19,
SEQ ID NO: 20, and SEQ ID NO: 21, respectively (or functional variant
thereof); and an LCDR1, LCDR2
and LCDR3 of SEQ ID NO: 22, SEQ ID NO: 23, and SEQ ID NO: 23, respectively (or
functional variant
thereof). QX006N is an immunoglobulin comprising a VH amino acid sequence SEQ
ID NO: 17 the VL
amino acid sequence SEQ ID NO: 18.
5.2. Anifrolumab clinical studies
Study ID Status Study design and Objectives Subjects
Doses
type of control
Phase I
MI-CP180 Completed Open-label, dose Primary: Safety and
Patients with IV single dose: 0.1 mg/kg ¨
escalation tolerability SSc 20 mg/kg
(SAD/MAD)
Secondary: PK,
IV multiple dose: 0.3 mg/kg
immunogenicity, ¨ 5.0 mg/kg
PD
study 06 Completed Randomized, Primary: PK, safety, and
Healthy SC single dose 300 mg or
double-blind, tolerability volunteers placebo (for
300 mg
placebo controlled injection)
Secondary:
Immunogenicity
600 mg or placebo (for 600
mg injection)
IV single dose 300 mg or
placebo (for 300 mg
injection)
Phase II
31
CA 03216395 2023-10-10
WO 2022/223771 PCT/EP2022/060670
study Completed Randomized (1:1:1),
Primary: SRI(4) at Week Patients with IV, Q4W 300 mg, 1000 mg,
1013 double-blind, 24 SLE who are or
placebo
placebo controlled receiving
Secondary: SRI(4) at standard of care
Week 52, OCS reduction,
safety, PK,
immunogenicity, PD
study 07 Completed Randomized (1:1:1),
Primary: UPCR at Week Patients with IV, Q4W 300 mg, 900 mg
double-blind, 52 active
for first 3 doses followed by
placebo controlled Secondary: CRR at Week proliferative LN 300 mg, or
placebo
52 safety and tolerability while receiving
SOC
study 08 Completed Randomized Primary: PK and PD
Type I IFNGS SC, Q2W 150 mg, 300 mg,
(3:1:3:1), double- test-high SLE or
placebo
blind (through week Secondary: Safety and patients with
12) placebo tolerability, active skin
controlled immunogenicity manifestations
while receiving
SOC
Phase III
study 05 Completed Randomized (1:2:2),
Primary: SRI(4) at Week Patients with IV, Q4W 150 mg, 300 mg,
double-blind, 52 moderate to or
placebo
placebo controlled severe SLE who
Secondary: SRI(4) in type were receiving
I IFNGS test-high patients, SOC
OCS reduction, CLASI
reduction, SRI(4) at Week
24, annualized flare rate
Safety and tolerability
study 04 Completed Randomized (1:1), Primary: BICLA at Week
Patients with IV, Q4W 300 mg or placebo
double-blind, 52 moderate to
placebo controlled severe SLE who
Secondary: BICLA in type were receiving
I IFNGS test-high patients, SOC)
OCS reduction, CLASI
reduction, joint count
reduction, annualized flare
rate Safety and tolerability
study 09 Ongoing Randomized (¨ 4:1),
Primary: Safety and Patients with IV, Q4W 300 mg or placebo
double-blind, tolerability SLE who
Patients on anifrolumab in
placebo controlled completed study studies 04 and 05 continued
04 or study 05 on 300 mg, placebo patients
from studies 04 and 05
randomized 1:1 to
anifrolumab 300 mg or
placebo
32
CA 03216395 2023-10-10
WO 2022/223771 PCT/EP2022/060670
(TULIP Ongoing Randomized (1:1), Primary: BICLA at Week
Adult patients SC, QW 120 mg or placebo
SC) double blind, 52 with moderateto-
placebo controlled severe
Secondary: time to systemic SLE
BICLA, who were
sustained OCS reduction, receiving
annualized flare rate, standard of
BICLA at care
Week 16
Safety and tolerability
5.3. Lupus nephritis (LN)
[0130] Presence of proteinuria, haematuria or urine granular casts, or
unexplained decrease in renal
function are all clinical signs of renal involvement in SLE patients. LN
diagnosis is made by renal biopsy
and histopathological classification according to the 2003 ISN/RPS
classification criteria [3] which are the
gold standard for renal assessment in LN.
[0131] LN is histologically classified as one of Classes I-V [3,14] (Table 4).
Table 4: The 2003 ISN/RPS classification of LN
Class Definition Clinical findings Subclasses
Minimal mesangial LN Normal glomeruli by LM, but None
mesangial immune deposits by IF
Mesangial proliferative LN Purely mesangial hypercellularity None
of any degree or mesangial matrix
expansion by LM, with mesangial
immune deposits. A few isolated
subepithelial or subendothelial
deposits may be visible by IF or
EM, but not by LM
Focal LN Active or inactive focal, segmental III (A):
active lesions; focal
or global endocapillary or proliferative LN
extracapillary glomerulonephritis III (A/C): active and
chronic lesions;
involving <50% of all glomeruli, focal proliferative and
sclerosing LN
typically with focal subendothelial III (C): chronic inactive
lesions with
immune deposits, with or without glomerular scars; focal
sclerosing LN
mesangial alterations
IV Diffuse LN Active or inactive diffuse, IV-Sa (A): active
lesions; diffuse
segmental or globai endocapiliary segmental proliferative LN
or extracapillary IV-Gb (A): active lesions;
diffuse
glomerulonephritis involving 250% global proliferative LN
of all glomeruli, typically with IV-Sa (A/C): active and
chronic
diffuse subendothelial immune lesions; diffuse segmental
deposits, with or without proliferative and
sclerosing LN
mesangial alterations IV-Gb (A/C): active and
chronic
lesions; diffuse global proliferative
and sclerosing LN
IV-Sa (C): chronic inactive lesions with
scars; diffuse segmental sclerosing
LN
IV-Gb (C): chronic inactive lesions
with scars; diffuse global sclerosing
LN
33
CA 03216395 2023-10-10
WO 2022/223771 PCT/EP2022/060670
V Membranous LN Global or segmental subepithelial None
immune deposits or their
morphological sequelae by LM
and by IF or EM, with or without
mesangial alterations. May occur
in combination with class III or IV,
in which case both classes are
diagnosed. May show advanced
sclerosis
VI Advanced sclerotic LN .90 /0 of glomeruli
globally None
sclerosed without residual activity
IF, immunofluorescence; LM, light microscopy; LN, lupus nephritis. aDiffuse
segmental LN indicates
that 50% or more of the involved glomeruli have segmental lesions (that is,
glomerular lesions
involving less than 50% of the glomerular tuft). bDiffuse global LN indicates
that 50% or more of the
involved glomeruli have global lesions (that is, glomerular lesions involving
50% or more of the
glomerular tuft).
[0132] Until very recently there has not been any approved treatment for Lupus
Nephritis (LN). The 2
newly approved treatments (BenlystaTM and LupkynisTm-approved in US, MAA under
review by EMA) are
both approved for use as add on therapy to background Standard of Care (SoC)
with mycophenolate mofetil
(MMF) which in itself is not approved for LN in most regions, but is widely
used as SoC in accordance with
international guidelines. The standard treatment for proliferative LN consists
of 6 to 12 months of intensive
immunosuppressive therapy (usually cyclophosphamide or mycophenolate mofetil
[MMF] with high dose
corticosteroids) followed by a longer period of less intensive maintenance
therapy with MMF or azathioprine
and low dose steroids. MMF is the recommended by American College of
Rheumatology (ACR) and the
2019 Update of the Joint European League Against Rheumatism and European Renal
Association
European Dialysis and Transplant Association (EULAR/ERA¨EDTA) recommendations
for the
management of lupus nephritis with a total daily dose of 2 to 3 g 1 of 4
orally for 6 months, followed by an
extended period of treatment at a dose between 1 to 2 grams per day.
Anifrolumab may be administered
in combination with the standard of care for lupus nephritis.
[0133] The ultimate treatment goal for patients with active, proliferative LN
is to achieve rapid control of
renal inflammation and to preserve renal function to prevent development of
ESKD. End stage kidney
disease occurs late and at relatively low frequency, making it impractical for
use as an endpoint in clinical
studies. Instead, the use of composite renal endpoints, including measurements
of renal function and renal
inflammation, for evaluation of renal responses to treatment is endorsed by
professional societies (ACR,
EULAR, and KDIGO) and is aligned with the current European Medicines Agency
guidance for clinical trials
in LN.
5.4. Steroids
[0134] Oral corticosteroids (OCS, glucocorticoids) include prednisone,
cortisone, hydrocortisone,
methylprednisolone, prednisolone and triamcinolone. Examples of equivalent
doses of oral prednisone are
shown in (Table 5).
34
CA 03216395 2023-10-10
WO 2022/223771 PCT/EP2022/060670
Table 5: Examples of equivalent doses of oral prednisone
)):,1 Pi d
Twit\ : Dose
IflhlA1,--nts
Oral Pi ,tlitisone -.5 I. 20 30 mg _
Cort: 100 mg 150 mg )00 mg
-304, , 80 r.:1.7 120 1 Al
ivietnyiprecimsoione 6 mg .ts mg 16 mg _12 mg
Prethusolone - aig 10 mg 20 mg 30 mg ; mg
Tnamcmolone 0 Snag 16 mg 24mg
5.5. End points
5.5.1. eGFR (estimated glomerular filtration rate)
[0135] The most widely used equation for estimating glomerular filtration rate
(GFR) from serum creatinine
are the Chronic Kidney Disease Epidemiology Collaboration (CKD-EPI) equation
[15] and the isotope
dilution mass spectrometry (IDMS) traceable Modification of Diet in Renal
Disease (MDRD) Study
equation [16].
[0136] The CKD-EPI equation uses a 2-slope "spline" to model the relationship
between GFR and serum
creatinine, age, sex, and race. The equation is given in the following table
for creatinine in mg/dL. The
equation can be expressed in a single equation:
Equation 1
GFR = 141 x min (Scr /k, 1)a x max(Scr /k, 1)-1.209 x 0.993Age x 1.018 [if
female] x 1.159 [if
black]
where: Scr is serum creatinine in mg/dL,
K is 0.7 for females and 0.9 for males,
a is -0.329 for females and -0.411 for males,
min indicates the minimum of Scr /K or 1, and
max indicates the maximum of Scr /K or 1.
[0137] The following is the IDMS-traceable MDRD Study equation (for creatinine
methods calibrated to an
IDMS reference method):
Equation 2
GFR (mL/min/1.73 m2) = 175 x (Scr)-1.154 x (Age)-0.203 x (0.742 if female) x
(1.212 if African
American)
where: Scr is serum creatinine in mg/dL.
CA 03216395 2023-10-10
WO 2022/223771 PCT/EP2022/060670
5.5.2. CRR (Complete renal response)
[0138] CRR is defined herein as follow:
= Estimated glomerular filtration rate (eGFR) is 60 mL/min/1.73 m2
or no confirmed
decrease of eGFR from baseline of 20`)/0
= 24-hour UPCR 01 mg/mg
[0139] A CRR is a recognized endpoint for demonstrating efficacy of a
pharmaceutical intervention for LN
treatment and remission [9,17]. CRR was the primary endpoint in the Phase III
voclosporin study for LN,
on the basis of which voclosporin was approved for the treatment of LN [17].
5.5.3. PRR (Partial renal response)
[0140] A subject achieves PRR if all the following criteria are met:
= eGFR: 60 mL/min/1.73 m2 or no confirmed decrease of eGFR from baseline of
20`)/0
= Improvement in 24-hour UPCR:
- For subjects with a baseline
UPCR mg/mg: <1.0 mg/mg
- For subjects with a baseline UPCR >3 mg/mg: >50% improvement from
baseline
and n.0 mg/mg
5.5.4. Graded CRR (Graded complete renal response)
[0141] A subject achieves graded CRR if all following criteria are met:
= A decrease in 24-hour UPCR:
= For subjects with baseline
UPCR >3 mg/mg: UPCR mg/mg
= For subjects with baseline UPCR mg/mg: UPCR 01 mg/mg
= eGFR: 60 mL/min/1.73 m2 or no confirmed decrease of eGFR from baseline of
20`)/0
5.5.5. aCRR (Alternative Complete renal response)
A subject achieves aCRR if all of the following criteria are met:
= eGFR: 60 mL/min/1.73 m2 or no confirmed decrease of eGFR from baseline of
20`)/0
= 24-hour UPCR 01 mg/mg
= Inactive urine sediment (defined as <10 RBC/hpf)
5.5.6. Graded aCRR (Graded alternative complete renal response)
[0142] A subject achieves graded aCRR if all following criteria are met:
= A decrease in 24-hour UPCR:
- For subjects with baseline UPCR >3 mg/mg: UPCR mg/mg
- For subjects with baseline UPCR mg/mg: UPCR 01 mg/mg
36
CA 03216395 2023-10-10
WO 2022/223771 PCT/EP2022/060670
= eGFR: 60 mL/min/1.73 m2 or no confirmed decrease of eGFR from baseline of
20`)/0
= Inactive urine sediment (defined as <10 RBC/hpf)
5.5.7. Protein uria
[0143] The urine protein/creatinine ratio (UPCR) provides a readout of the
amount of blood protein that
is passed into the urine. UPCR may be measured in a urine sample collected
over a 24-hour period (24-
hour UPCR). UPCR may be a spot UPCR, which provides the protein/creatinine
ratio measured in a
randomly collected urine sample to estimate 24-hour protein excretion.
5.5.8. SRI (Systemic Lupus Erythematosus Responder Index of ?4)
[0144] A subject achieves SRI(4) if all of the following criteria are met:
= Reduction from baseline of points in the SLEDAI-
2K;
= No new organ system affected as defined by 1 or more BILAG-2004 A or 2 or
more
= BILAG-2004 B items compared to baseline using BILAG-2004;
= No worsening from baseline in the subjects' lupus disease activity
defined by an increase n.30
points on a 3-point PGA VAS.
[0145] SRI(X) (X=5, 6, 7, or 8) is defined by the proportion of subjects who
meet the following criteria:
= Reduction from baseline of points in the SLEDAI-
2K;
= No new organ systems affected as defined by 1 or more BILAG-2004 A or 2
or
= more BILAG-2004 B items compared to baseline using BILAG-2004;
= No worsening from baseline in the subjects' lupus disease activity
defined by an
= increase n.30 points on a 3-point PGA VAS
5.5.9. SLEDAI-2K (Systemic Lupus Erythematosus Disease Activity Index 2000)
[0146] The SLEDAI-2K disease activity index consists of a list of organ
manifestations, each with a
definition. A certified Investigator or designated physician will complete the
SLEDAI-2K assessment and
decide whether each manifestation is "present" or "absent" in the last 4
weeks. The assessment also
includes the collection of blood and urine for assessment of the laboratory
categories of the SLEDAI-2K.
[0147] The SLEDAI-2K assessment consists of 24 lupus-related items. It is a
weighted instrument, in
which descriptors are multiplied by a particular organ's "weight". For
example, renal descriptors are
multiplied by 4 and central nervous descriptors by 8 and these weighted organ
manifestations are totaled
into the final score. The SLEDAI-2K score range is 0 to 105 points with 0
indicating inactive disease. The
SLEDAI-2K scores are valid, reliable, and sensitive clinical assessments of
lupus disease activity.
37
CA 03216395 2023-10-10
WO 2022/223771 PCT/EP2022/060670
5.5.10. SLE Disease Activity Index Renal Domain (SLEDAI-R)
[0148] The SLEDAI-R score (range 0-16; 0 = inactive LN) represents the sum of
the renal items of the
SLEDAI-2K. If present, each of the four SLEDAI-R items receives a score of 4:
proteinuria of > 0.5
gram/day, hematuria and pyuria (both >5 cells/high power field), and cellular
casts [18].
5.5.11. Time to renal flare
[0149] Renal flare is defined as an increase in spot UPCR and/or decline in
renal function in subjects who
achieved at least PRR (PRR or CRR) and then have maintained it for at least
one subsequent visit. Renal
flares can be characterized as either nephritic or proteinuric.
5.5.12. PAG (Physician's Global Assessment)
[0150] The PGA represents the physician's overall assessment of average
disease severity on a Visual
Analogue Scale (VAS) scale with 0 (none) to 3 (severe) disease activity over
30 days.
5.5.13. BILAG-2004 (British Isles Lupus Assessment Group-2004)
[0151] The BILAG-2004 is a translational index with 9 organ systems (General,
Mucocutaneous,
Neuropsychiatric, Musculoskeletal, Cardiorespiratory, Gastrointestinal,
Ophthalmic, Renal and
Haematology) that is able to capture changing severity of clinical
manifestations in SLE patients. It has
ordinal scales by design and does not have a global score; rather it records
disease activity across the
different organ systems at a glance by comparing the immediate past 4 weeks to
the 4 weeks preceding
them. It is based on the principle of physicians' intention to treat and
categorizes disease activity into 5
different levels from A to E:
= Grade A represents very active disease requiring immunosuppressive drugs
and/or a
prednisone dose of >20 mg/day or equivalent
= Grade B represents moderate disease activity requiring a lower dose of
corticosteroids,
topical steroids, topical immunosuppressives, antimalarials, or NSAIDs
= Grade C indicates mild stable disease
= Grade D implies no disease activity but the system has previously been
affected
= Grade E indicates no current or previous disease activity
[0152] Although the BILAG-2004 was developed based on the principle of
intention to treat, the treatment
has no bearing on the scoring index. Only the presence of active
manifestations influences the scoring.
5.5.14. BICLA (BILAG-Based Composite Lupus Assessment)
[0153] BICLA is a composite index that was originally derived by expert
consensus of disease activity
indices. BICLA response is defined as (1) at least one gradation of
improvement in baseline BILAG scores
38
CA 03216395 2023-10-10
WO 2022/223771 PCT/EP2022/060670
in all body systems with moderate or severe disease activity at entry (e.g.,
all A (severe disease) scores
falling to B (moderate), C (mild), or D (no activity) and all B scores falling
to C or D); (2) no new BILAG A
or more than one new BILAG B scores; (3) no worsening of total SLEDAI score
from baseline; (4) no
significant deterioration 0%) in physicians global assessment; and (5) no
treatment failure (initiation of
non-protocol treatment).
[0154] Particularly, a subject is a BICLA responder if the following criteria
are met:
= Reduction of all baseline BILAG-2004 A to B/C/D and baseline BILAG-2004 B
to CID, and no
BILAG-2004 worsening in other organ systems, as defined by 1 new BILAG-2004 A
or more than
1 new BILAG-2004 B item;
= No worsening from baseline in SLEDAI-2K as defined as an increase from
baseline of >0 points in
SLEDAI-2K;
= No worsening from baseline in the subjects' lupus disease activity
defined by an increase n.30
points on a 3-point PGA VAS;
= No discontinuation of investigational product or use of restricted
medications beyond the protocol-
allowed threshold before assessment
[0155] BICLA response is a composite endpoint requiring improvement of all
baseline BILAG-2004 A and
B scores, no worsening as assessed by SLEDAI-2K and PGA, as well as no IP
discontinuation and no use
of restricted medication beyond protocol-allowed thresholds. The BILAG
captures relative improvement in
organ system (in contrast to SLEDAI-2K, which is used to show improvement in
SRI, and which requires
complete resolution in organ system); the BILAG-2004 used to measure
improvement in BICLA can detect
clinically meaningful relative improvement in an organ system.
5.5.15. CLASI (Cutaneous Lupus Erythematosus Disease Area and Severity Index)
[0156] The CLASI is a validated index used for assessing the cutaneous lesions
of SLE and consists of 2
separate scores: the first summarizes the inflammatory activity of the
disease; the second is a measure of
the damage done by the disease. The activity score takes into account
erythema, scale/hypertrophy,
mucous membrane lesions, recent hair loss, and nonscarring alopecia. The
damage score represents
dyspigmentation, scarring/atrophy/panniculitis, and scarring of the scalp.
Subjects are asked if their
dyspigmentation lasted 12 months or longer, in which case the dyspigmentation
score is doubled. Each of
the above parameters is measured in 13 different anatomical locations,
included specifically because they
are most often involved in cutaneous lupus erythematosus (CLE). The most
severe lesion in each area is
measured.
5.6. Pharmacokinetics glossary
[0157] Area under the curve (AUC): Area under the plasma drug concentration
versus time curve, which
serves as a measure of drug exposure.
39
CA 03216395 2023-10-10
WO 2022/223771 PCT/EP2022/060670
[0158] Cave: Steady-state average concentration.
[0159] Cmõ: The maximum (or peak) concentration of the drug in the plasma.
[0160] Cmin Minimum plasma drug concentration.
[0161] Ct rough= = the concentration of drug in plasma at steady state
immediately prior to the administration
of a next dose. Trough plasma concentration (measured concentration at the end
of a dosing interval at
steady state [taken directly before next administration]).
[0162] LLOQ: The lower limit of quantitation, the lowest amount of an analyte
in a sample that can be
quantitatively determined with suitable precision and accuracy.
[0163] Linear pharmacokinetics: When the concentration of the drug in the
blood or plasma increases
proportionally with the increasing dose, and the rate of elimination is
proportional to the concentration, the
drug is said to exhibit linear pharmacokinetics. The clearance and volume of
distribution of these drugs are
dose-independent.
[0164] Nonlinear pharmacokinetics: As opposed to linear pharmacokinetics, the
concentration of the
drug in the blood or plasma does not increase proportionally with the
increasing dose. The clearance and
volume of distribution of these may vary depending on the administered dose.
Nonlinearity may be
associated with any component of the absorption, distribution, and/or
elimination processes.
5.7. PK/PD
[0165] Plasma levels obtainable by SC administration and IV administration may
be compared on the
basis of a plasma drug concentration-time curve (AUC), which reflects the body
exposure to the antibody
after administration of a dose of the drug. For example, during a clinical
study, the patient's plasma drug
concentration-time profile can be plotted by measuring the plasma
concentration at several time points.
Where an in silico modelling approach is employed, plasma drug concentration-
time for any given dose
may be predicted. The AUC (area under the curve) can then be calculated by
integration of the plasma
drug concentration-time curve. Suitable methodology is described in Tummala
et. al. [19], which is
incorporated herein by reference in its entirety. In the Examples described
herein, PK parameters were
calculated by non-compartmental analysis with Phoenix WinNonlin V/6.2
(Certara, Inc., Princeton, New
Jersey, USA) and included the area under the serum concentration-time curve
(AUC), clearance (CL, CL/F),
maximum serum concentration (Cmax) and time to reach maximum serum
concentration (tmax). All data were
analysed with SAS System V.9.2 (SAS Institute, Inc., Cary, NC, USA).
[0166] Conveniently, a ratio of the AUC obtainable with SC administration to
the AUC obtainable by IV
administration (AUCsc / AUCiv) may be calculated, providing a numerical
comparison of bioavailability
provided by the dosage routes. Reference to the "AUC Ratio" herein means the
AUCsc / AUCiv ratio. To
provide statistical robustness, the AUC ratio is preferably a mean, median or
mode (for example, a mean)
value calculated from a plurality of repeat experiments (or computational
simulations). This approach is
CA 03216395 2023-10-10
WO 2022/223771 PCT/EP2022/060670
demonstrated with reference to the Examples. The mean, median or mode
(preferably mean) may be
derived by pooling data obtained from multiple patients (or multiple
computational simulations). Thus, the
AUC Ratio may reflect the mean, median or mode (preferably mean) AUC in
multiple patients.
5.8. Type I IFN gene signature (IFNGS)
[0167] Type I IFN is considered to play a central role SLE disease
pathogenesis and inhibition of this
pathway is targeted by anifrolumab. To understand the relationship between
type I IFN expression and
response to anti-IFN therapy, it is necessary to know if a subject's disease
is driven by type I IFN activation.
However, direct measurement of type I IFN remains a challenge. As such, a
transcript-based marker was
developed to evaluate the effect of over expression of the target protein on a
specific set of mRNA markers.
The expression of these markers is easily detected in whole blood and
demonstrates a correlation with
expression in diseased tissue such as skin in SLE. The bimodal distribution of
the transcript scores for SLE
subjects supports defining an IFN test high and low subpopulation (Figure 1).
The type I IFN test is
described in W02011028933 Al, which is incorporated herein by reference in its
entirety. The type I IFN
gene signature may be used to identify a subject has a type I IFN gene
signature (IFNGS)-test high patient
or an IFNGS-test low patient. The IFNGS test measures expression of the genes
IF127, IF144, IF144L, and
RSAD2 compared with 3 reference genes; 18S, ACTB and GAPDH in the whole blood
of the subject. The
result of the test is a score that is compared with a pre-established cut-off
that classifies patients into 2
groups with low or high levels of IFN inducible gene expression (Figure 1).
[0168] The expression of the genes may be measured by RT-PCR. Suitable primers
and probes for
detection of the genes may be found in W02011028933. A suitable kit for
measuring gene expression for
the IFNGS test is the QIAGEN therascreen IFIGx RGQ RT-PCR kit (IFIGx kit), as
described in Brohawn
et al. [20], which is incorporated herein by reference in its entirety.
[0169] Gene expression may be measured by detecting mRNA in the whole blood or
tissue of the subject.
A IFNGS (4-gene, 5-gene or 21-gene) score may be detected in a subject by
measuring the IFNGS gene
expression (e.g. mRNA) in the blood or tissue of the subject and comparing the
gene expression levels to
expression of house-keeping or control genes, e.g. ACTB, GAPDH, and 18S rRNA,
in the blood or tissue.
[0170] The IFN 21-gene signature (IFNGS) is a validated pharmacodynamic marker
of type I IFN
signaling [21] (Table 6), that is elevated in patients with lupus nephritis.
Table 6: 21 Interferon-a/p-Inducible Genes Constituting the 21-Gene
Pharmacodynamic Interferon
Gene Signature
41
CA 03216395 2023-10-10
WO 2022/223771 PCT/EP2022/060670
Gene title 'Gene symbol Gene
Probe ID
interferon, alpha-inducible protein 27
Interferon, aipha-in d u cib I e protein 6 1F16 204415
Radical S-adenosyi meth i ()nine domain containing 2 RSAD2 213797
Interferon-induced protein 44 IF144 214059
Interferon-induced protein &Like IF144L 204439
Ubiquitin specific peptide:a 18 USP18 219211
Lymphocyte antigen 6 complex, locus E LY6E 202145
2,5-o41goadenyiete synthetase L,4-0/46 kDa OAS1 202869
Slake acid binding ig-iike iectin 1, sialoadhesin S1GLEC1 44673
ISG/5 ubitwitin-like modifier 1SG15 205483
Interferon-induced protein with tetratrIcopeptIde repents 1 IFIT1
203153
21-54-oligoadenyinte syrrthetase 3, 100 irDa OAS3 218400
tient domain and RID 5 HERC5 219863
a/Num/bus (Influenza virus) resistance 1 1VD(1 202086
Lysosomai-essociated membrane protein 3 LAMP3 205569
Epit h e stromal interaction 1 (breast) EPST11 227609
Interferon-Induced protein with tetretricopeptide repasts 3 1AM
204747
igoa d e nyl at* synthetase 2. 69/71 kDa 0AS2 204972
Receptor (chemosensory) transporter protein 4 RTP4 219684
Phospholipid scrambles* 1 PLSCR1 241916
0171] DNA polyrnerose-transactivated protein 6 DNAPTP6 241812
[
6. EXAMPLES SUMMARY
[0172] The evidence provided in the following examples is summarized in Table
7.
Table 7: Summary of data provided in the Examples
Example Section Results Summary Date source
Example 1 8 Summary of anifrolumab clinical trials
Example 2 7 Anifrolumab treats LN. study 07
Anifrolumab treats LN at a dose regime of 900 mg Q4W IV
x3, followed by 300 mg Q4W IV.
Example 3 9 Anifrolumab has a bioavailability of 87% in healthy
volunteers study 06
Example 4 10 An anifrolumab dose of < 150 mg QW and >105 mg QW will
study 04,
provide at least similar or even a higher Cave over 52 weeks study 05,
to that of 300 mg IV Q4W. study 08
A subcutaneous dose of 120 mg QW is considered to
provide at least similar or non-inferior exposure and PD
suppression to that of 300 mg IV Q4W.
Example 5 11 A subcutaneous dose of about 1150 mg (e.g. 1155 mg) Q4W
study 07,
is considered to provide at least similar or non-inferior study 08
exposure and PD suppression to that of 900 mg IV Q4W.
42
CA 03216395 2023-10-10
WO 2022/223771 PCT/EP2022/060670
Anifrolumab will treat LN at a dose of 900 mg Q4W IV x6 (or
about 1150 mg Q4W SC), followed by 300 mg Q4W IV (or
120 mg QW).
Example 6 12 Identification of 11 urinary proteins associated with
disease
severity in LN patients
Example 7 13 Delivery devices for subcutaneous delivery
7. EXAMPLE 1: Anifrolumab in the clinic
[0173] Anifrolumab safety and efficacy has been evaluated in 8 blinded or open-
label intravenous (IV) and
subcutaneous (SC) studies: 5 studies in patients with SLE (study 05, study 04,
study 1013, and study 08),
1 study in patients with systemic sclerosis (SSc) (Study MI-CP180), and 1
study in healthy volunteers (study
06) (Table 8). Of these studies, two (studies 08 and 06) employed SC
anifrolumab administration. Two
studies are ongoing: 1 study in patients with SLE (study 09) and 1 study in
patients with lupus nephritis
(LN) (study 07).
Table 8: Anifrolumab clinical studies
Study ID Status Study design Objectives Subjects Doses
and type of
control
Phase I
MI-CP180 Completed Open-label, dose Primary: Safety and Patients
with SSc IV single dose: 0.1
escalation tolerability mg/kg ¨20
mg/kg
(SAD/MAD)
Secondary: PK, IV multiple
dose: 0.3
immunogenicity,
mg/kg ¨ 5.0 mg/kg
PD
study 06 Completed Randomized, Primary: PK, safety, and
Healthy volunteers SC single dose 300
double-blind, tolerability mg
or placebo (for
placebo controlled 300
mg injection)
Secondary: Immunogenicity
600 mg or placebo
(for 600 mg
injection)
IV single dose 300
mg or placebo (for
300 rris in'ection
Phase ll
study 1013 Completed Randomized Primary:
SRI(4) at Week 24 Patients with SLE IV, Q4W 300 mg,
(MUSE) (1:1:1), double- who are 1000 mg, or placebo
blind, placebo Secondary: SRI(4) at Week
receiving standard
t 52, OCS reduction, safety, controlled of care
PK, immunogenicity, PD
study 07 Completed Randomized Primary:
UPCR at Week 52 Patients with active IV, Q4W 300 mg,
(1:1:1), double- proliferative LN 900
mg for first 3
blind, placebo Secondary: CRR at Week
while receiving SOC doses followed by
controlled 52. 300 mg, or placebo
Safety and tolerability
study 08 Completed Randomized Primary: PK and PD Type I
IFNGS test- SC, Q2W 150 mg,
(3:1:3:1), double- high SLE patients 300
mg, or placebo
Secondary: Safety and
blind (through with active skin
week 12) placebo tolerability, immunogenicity
manifestations while
controlled receiving SOC
Phase In
43
CA 03216395 2023-10-10
WO 2022/223771 PCT/EP2022/060670
study 05 Completed Randomized Primary: SRI(4)
at Week 52 Patients with IV, Q4W 150 mg,
(TULIP II) (1:2:2), double- moderate to severe
300 mg, or placebo
blind, placebo Secondary: SRI(4) in type I
SLE who were
IFNGS test-high patients,
controlled receiving SOC
OCS reduction, CLASI
reduction, SRI(4) at Week
24, annualized flare rate
Safety and tolerability
study 04 Completed Randomized (1:1),
Primary: BICLA at Week 52 Patients with IV, Q4W 300 mg or
(TULIP I) double-blind, moderate to severe
placebo
placebo controlled Secondary: BICLA in type I
SLE who were
IFNGS test-high patients, receiving SOC)
OCS reduction, CLASI
reduction, joint count
reduction, annualized flare
rate.
Safety and tolerability
study 09 Ongoing Randomized (-- Safety and tolerability
Patients with SLE IV, Q4W 300 mg or
4:1), double-blind, who completed
placebo. Patients on
placebo controlled study 04 or study 05
anifrolumab in
studies 04 and 05
continued on 300
mg, placebo patients
from studies 04 and
05 randomized 1:1
to anifrolumab 300
mg or placebo
(TULIP SC) Ongoing Randomized (1:1), Primary:
BICLA at Week 52 Adult patients with SC, QW 120 mg or
double blind, moderate to-severe
placebo
placebo controlled Secondary: time to BICLA,
systemic SLE who
sustained OCS reduction, were receiving
annualized flare rate, BICLA standard of care
at Week 16
Safety and tolerability
[0174] Study 1013 is described in further detail in Furie etal. 2017 [11],
which is incorporated herein by
reference in its entirety. Study 04 is described in further detail in Furie
etal. 2019 [22], which is incorporated
herein by reference in its entirety. The results of study 05 are presented in
Morand et al. 2020 [23], herein
incorporated by reference in its entirety. A full summary of the evidence for
intravenous anifrolumab clinical
efficacy in SLE is provided in Tanaka et al., 2020 [24], which is incorporated
herein by reference in its
entirety.
[0175] As described in Wang etal., a two-compartment PK model with parallel
first-order and IFNAR-
mediated elimination pathways has developed to describe the observed serum
concentration profiles of
anifrolumab [25].
8. EXAMPLE 2: Phase 2 Randomized Trial of Type I Interferon Inhibitor
Anifrolumab in Patients
with Active Proliferative LN (NCT02547922, Study 07)
44
CA 03216395 2023-10-10
WO 2022/223771 PCT/EP2022/060670
8.1. Summary
8.1.1. Objective
[0176] To assess the efficacy and safety of the type I interferon receptor
antibody anifrolumab in patients
with active, biopsy proven, proliferative LN. It was assessed whether
treatment with anifrolumab would
neutralize the type I IFN signaling through the human IFNAR1 that is driving
disease activity and thereby
reduce the severity of disease in patients with proliferative LN.
8.1.2. Methods
[0177] In this phase 2 double-blinded multicenter study (study 7,
NCT02547922), patients were
randomized (1:1:1) to receive monthly intravenous anifrolumab basic regimen
(BR, 300 mg IV), intensified
regimen (IR, 900 mgx3 IV, 300 mg thereafter), or placebo, alongside standard
therapy (oral glucocorticoids,
mycophenolate mofetil). For this study, the rationale for selection of the 300
mg dose-level for evaluation
in LN subjects was to replicate the dose identified in the Phase 2b study in
subjects with extra-renal SLE
(study 1013). The primary endpoint was improvement in baseline 24-hour urine
protein¨creatinine ratio
(UPCR) at Week 52 for combined anifrolumab versus placebo groups. The
secondary endpoint was
complete renal response (CRR) at Week 52. Exploratory endpoints included more
stringent CRR definitions
and sustained glucocorticoid reductions (7.5 mg/day, Weeks 24-52). Safety was
analyzed descriptively.
8.1.3. Results
[0178] Patients received anifrolumab BR (n=45), IR (n=51), or placebo (n=49).
At Week 52, 24-hour UPCR
improved by 69% and 70% for the combined anifrolumab and placebo groups,
respectively (geometric
mean ratio=1.03; 95% confidence interval: 0.62-1.71; P=0.905). Anifrolumab IR
elicited higher serum
concentrations than anifrolumab BR, which provided suboptimal exposure.
Numerically more patients
treated with anifrolumab IR versus placebo attained CRR (45.5% vs 31.1%), CRR
with UPCR 0.5 mg/mg
(40.9% vs 26.7%), CRR with inactive urinary sediment (40.9% vs 13.3%) and
sustained glucocorticoid
reductions (55.6% vs 33.3%). Herpes zoster was more frequent in the combined
anifrolumab versus
placebo groups (16.7% vs 8.2%); however, incidence of serious adverse events
was similar between
groups (19.8% vs 16.3%).
8.1.4. Conclusion
[0179] Although the primary endpoint was not met, anifrolumab IR elicited
numeric improvements over
placebo across clinically meaningful endpoints.
CA 03216395 2023-10-10
WO 2022/223771 PCT/EP2022/060670
8.2. Patients and Methods
8.2.1. Patients
[0180] Eligible patients were 18 to 70 years old with a biopsy-proven
diagnosis of Class 111 01 IV (both V)
LN within 3 months of screening, according to WHO or International Society of
Nephrology and the Renal
Pathology Society (ISN/RPS) 2003 criteria [3] (see Section 5.3). Eligible
patients had 24-hour UPCR >1
mg/mg (113.17 mg/mmol), eGFR mL/min/1.73 m2, and fulfilled
of the 11 American College of
Rheumatology SLE classification criteria [26], including seropositivity for
of antinuclear, anti¨double-
stranded DNA (anti-dsDNA), and/or anti-Smith antibodies at screening [27].
eGFR was based on
Modification of Diet in Renal Disease (MDRD) formula. Patients who received
any of the following
immunosuppressive induction therapies after their qualifying biopsy were
excluded: >0.5 mg/kg/day or
>40 mg/day of prednisone equivalent >8 weeks, average MMF >2.5 g/day for >8
weeks, or cumulative
methylprednisolone pulse >3000 mg.
8.2.2. Dose selection
[0181] The study evaluated the safety and efficacy of anifrolumab across 2
dosing regimens: the Basic
Regimen (BR) rested 300 mg throughout the treatment period whereas the
Intensified Regimen tested a
higher dose of 900 mg for the first 3 doses followed by 300 mg for the rest of
the treatment period.
[0182] The selection of doses of 300 mg and 900 mg anifrolumab every 4 weeks
(Q4VV) was based on
safety and efficacy results from the interim analysis of a Phase 2b study in
extra-renal SLE where 2 doses
of anifrolumab (300 mg and 1000 mg) were evaluated relative to placebo (study
1013). The 900 mg dose
was chosen over 1000 mg in the present study for ease of administration
(anifrolumab is supplied in 150
mg vials). At the interim analysis of the Phase 2b study, clinically
meaningful benefit was observed with the
300 mg dose, with no incremental benefit at 1000 mg. In addition, a higher
proportion of subjects reporting
herpes zoster reactivations was observed at 1000 mg compared to 300 mg. Based
on these data, the 300
mg dose was identified as the optimal the dose to test in a Phase 3 study for
extra-renal SLE (TULIP I and
TULIP II). Based on PK, efficacy, and safety considerations, anifrolumab 300
mg every 4 weeks was
subsequently recommended as the optimal dosage for pivotal phase 3 studies in
patients with SLE [28].
For TULIP-LN, the rationale for selection of the 300 mg dose-level for
evaluation in LN subjects was to
replicate the dose identified in the Phase 2b study in subjects with extra-
renal SLE.
8.2.3. Study Design
[0183] For the 52-week double-blind treatment period, patients were randomized
(1:1:1) on Day 1 to
receive anifrolumab basic regimen (BR; 300 mg, corresponding to SLE dosing
[23]), anifrolumab intensified
regimen (IR; 900 mg for the first 3 doses, 300 mg thereafter), or placebo
intravenously every 4 weeks for
48 weeks, alongside prespecified standard therapy of oral glucocorticoids and
MMF (Figure 2A).
46
CA 03216395 2023-10-10
WO 2022/223771 PCT/EP2022/060670
Randomization was stratified according to 24-hour UPCR at screening (n.0 vs
>3.0 mg/mg) and type I
IFNGS status (high versus low, determined as previously described [29]).
[0184] The primary endpoint was assessed at Week 52. Eligible patients could
enter the ongoing second-
year double-blind treatment period if they obtained at least a partial renal
response (PRR), defined as eGFR
60 mL/min/1.73 m2 or no confirmed decrease 20`)/0 in eGFR from baseline; a 24-
hour UPCR improvement
from baseline to Week 52 (<1.0 mg/mg among patients
mg/mg at baseline; >50% improvement and
mg/mg among patients >3 mg/mg at baseline); and no discontinuation of trial
intervention. For patients
who did not continue into the second-year period, the safety follow-up period
lasted 12 weeks after the last
dose of anifrolumab or placebo. Here we report the 52-week treatment period
results.
[0185] Patients received a methylprednisolone pulse 500 mg intravenously at
randomization, unless
already received <10 days before randomization. There was a mandatory oral
glucocorticoid dosage taper
to a target of 0 mg/day (prednisolone or equivalent) by Week 12 and
mg/day by Week 24. MMF was
titrated to a target dosage of 2 g/day by Week 8. MMF dosage adjustments were
permitted for suboptimal
responses, toxicity, or intolerability. Stable oral glucocorticoid and MMF
dosages were required from Weeks
40 to 52. Stable dosages of angiotensin-converting enzyme inhibitors and
angiotensin receptor blockers
were required from Week 4 onwards.
[0186] Protocol-specified trial intervention discontinuation criteria included
failure to adhere to background
standard therapy (including glucocorticoid tapering requirements of
prednisolone or equivalent <15 mg/day
by Week 12 and
mg/day by Week 24); use of prohibited rescue therapies (including >1
methylprednisolone pulse before Week 8 or any methylprednisolone pulse after
Week 8, cyclophosphamide
or rituximab at any time); use of restricted or excluded medications; or
predefined worsening of LN or SLE,
defined as an LN-related confirmed eGFR decrease >30% from baseline and eGFR
<60 mL/min/1.73 m2
at any time, eGFR decrease <75% from baseline and <60 mL/min/1.73 m2 at Week
12 or Week 24, or
nephrotic range UPCR at Week 12 or Week 24 (>50% increase to >3.5 mg/mg among
patients <3 mg/mg
at baseline; <60% improvement or >3.5 mg/mg among patients >3 mg/mg at
baseline).
8.2.4. Outcomes
8.2.4.1. Primary Endpoint
[0187] The primary objective when initiating the study was to evaluate the
efficacy of anifrolumab plus
SOC compared to placebo plus SOC in subjects with active proliferative LN
measured by the relative
difference in change from baseline to Week 52 in 24-hour UPCR (Table 9).
47
CA 03216395 2023-10-10
WO 2022/223771 PCT/EP2022/060670
Table 9: Primary objective in TULIP-LN
PI Nir,1
evaluate the efficacy of amfrolumat
oni7-!-f¨hrs
s ii
11
; the; ;;;It-m=erk - A clu
baseline to Week .52 in 24-!i rotem to
creatuune ratio (UPCR)
[0188] The treatment goal in LN is preservation of renal function. With
current SOC, end-stage renal
disease occurs late and with a relatively low frequency which makes it
impractical for use as endpoint in
clinical studies. Previous studies have used various composite endpoints for
renal response. The core
elements of all these criteria are stable or improving renal function and a
decrease in or normalisation of
proteinuria. Improvement in proteinuria reflects control of inflammation and
the subsequent repair of the
kidney.
[0189] The primary endpoint was thus the relative difference in the mean
change from baseline to Week 52
in 24-hour UPCR in the combined anifrolumab group (IR plus BR) versus the
placebo group. The mean
change from baseline was calculated as the geometric mean (GM) of the relative
difference in 24-hour
UPCR at Week 52 compared with baseline for each treatment group (values <1
indicate an improvement
from baseline). The comparison with the placebo group was measured with a GM
ratio (GMR) of the relative
change from baseline for the combined anifrolumab group versus the placebo
group (GMR <1 favors
anifrolumab) (Equation 3).
Equation 3
GM (24-hour UPCR at Week 52)
GMR
24-hour UPCR at baseline )õmbined anifrolumab
=
GM (24-hour UPCR at Week 52)
24-hour UPCR at baseline) placebo
8.2.4.2. Secondary Endpoint
[0190] The secondary endpoint was the difference between the combined
anifrolumab group versus the
placebo group in the proportion of patients with a CRR at Week 52, defined as
24-hour UPCR 13.7 mg/mg,
eGFR 60 mUmin/1.73 m2 or no decrease 20`)/0 from baseline, as well as
adherence to standard therapy
protocols, no discontinuation of intervention, and no use of restricted
medications (Table 10).
8.2.4.3. Exploratory Endpoints
[0191] Exploratory endpoints included the proportion of patients with baseline
oral glucocorticoid dosage
20 mg/day with a sustained dosage reduction (7.5 mg/day, Weeks 24-52); the
proportion of patients with
CRR including requirement for inactive urine sediment (CRRa; <10 red blood
cells per high-power field);
the proportion of patients with a CRR at Week 52 combined with achieving
sustained oral glucocorticoid
48
CA 03216395 2023-10-10
WO 2022/223771
PCT/EP2022/060670
dosage reduction; mean change from baseline in nonrenal SLE Disease Activity
Index 2000
(SLEDAI-2K) [30], Physician's Global Assessment (PGA)16, and Patient's Global
Assessment (PtGA) [31]
scores; mean change from baseline in lupus serologies (anti¨dsDNA antibodies,
C3/C4); and the
immunogenicity, pharmacokinetic (PK), and pharmacodynamic (PD) profile of
anifrolumab. PD
neutralization was measured as the median percentage change from baseline in
the 21-gene type I IFNGS,
as described previously [11,29,32] (Table 11 to Table 16).
Table 10: Secondary Objective in TULIP-LN
obit.oive: Ouloirffe h.=1=-111
Ra ,j!fined aI Alowing:
SOC.' con red with placebo plus sa: tlir' = 7:stunated elomerular
filtration rate (eGFR) is
propolly,u .s.,11Ijects achievnly
Ren7.!
>60
lea( of eGFR from ba 20%
ft. ..:4-bour 7 trrrirlf,
fif= liscontnitttioL IP or use of
re
inedicatri 1e. :d the protoco1.-.-110-.-\..:-,
threshold before assessment
eGFR is based on Modifi,s=ltir_,I1 7,31:2
Disease (MDRD) formul
49
CA 03216395 2023-10-10
WO 2022/223771
PCT/EP2022/060670
Table 11: Exploratory Objectives (1)
Exploratory Objective: Outcome Measure :
Proportion of subjects achieving alternative aCRR is defined as meeting all
of the following:
CRR (aCRR) at Week 52 (and Week 104) = eGFR
The difference between the CRR and the >60 mL/min/1.73 ni2 or no confirmed
aCRR is the addition of a criterion regarding decrease of eGFR from
baseline of >20%
-inactive urine sediment-
= 24-hour UPCR <0.7 mg/mg
= Inactive urine sediment (defined as <10 red
blood cells [RBC]/hpf)
= No discontinuation of IP or use of restricted
medicationb beyond the protocol-allowed
threshold before assessment
eGFR is based on MDRD formula
Proportion of subjects meeting Graded CRR at Graded CRR is defined as meeting
both the 24-hour
Week 52 (and Week 104) UPCR and eGFR criteria:
= A decrease in 24-hour UPCR:
- For subjects with baseline UPCR >3
mg/mg:
UPCR <1 mg/mg
- For subjects with baseline UPCR <3
mg/ing:
UPCR L=7Ø7 mg/mg
= eGFR:
>60 mL/min/1.73 m2 or no confirmed
decrease of eGFR from baseline of >20%
= No discontinuation of IF or use of restricted
medicationb beyond the protocol-allowed
threshold before assessment
CA 03216395 2023-10-10
WO 2022/223771
PCT/EP2022/060670
Table 12: Exploratory Objective (2)
Exploratory Objective: Outcome Measure:
To evaluate the effect of anifrolumab plus SOC2
compared with placebo plus SOCa on:
Proportion of subjects achieving at least Partial PRR or CRR
Renal Response (PRR) at Week 52 (and PRR is defined as meeting all of the
following:
Week 104)
= eGFR is:
At least PRR will include PRR and CRR. >60 mL/min/1.73 m2 or no confirmed
decrease of eGFR from baseline of 220%
The difference between PRR and the CRR is
the level of residual proteinuria = Improvement in 24-hour UPCR:
- For subjects with a baseline UPCR
53 mg/mg: <1.0 mg/mg
- For subjects with a baseline UPCR
>3 mg/mg: >50% improvement from
baseline and <3.0 mg/mg
= No discontinuation of IP or use of restricted
medicationb beyond the protocol-allowed
threshold before assessment
See above for definition of CRR
Proportion of subjects achieving CRR at CRR
Week 104
The relative difference in change from baseline 24-hour UPCR
to Week 104th 24 hour urine protein to
creatinine ratio (UPCR)
51
CA 03216395 2023-10-10
WO 2022/223771
PCT/EP2022/060670
Table 13: Exploratory Objective (3)
Exploratory Objective: Outcome Measure:
The relative difference in change from baseline eGFR
to Week 52 and Week 104 in eGFR
Time to achieve renal response modified to Time when the subject meets PRR
(spot UPCR)C or
include OCS tapering requirement (CRR and CRR (Spot UPCR)C, for subjects
who at Week 52,
PRR) through Week 52 (and Week 104) = Maintain response from this time
point until
Week 52 and
= Achieve OCS target dose (5_75 mg/day on and
after Week 24) and maintain it until Week 52
At Week 104
= Maintain response from this time point until
Week 104 and
= Achieve OCS target dose (.5.0 mg/day on and
after Week 80) and maintain it until Week 104
CRR and PRR (see definitions of CRR and PRR
above)
52
CA 03216395 2023-10-10
WO 2022/223771
PCT/EP2022/060670
Table 14: Exploratory Objectives (4)
Exploratory Objective: Outcome Measure:
Proportion of subjects meeting Graded aCRR Graded aCRR is defined as meeting
both the 24-hour
at Week 52 (and Week 104) UPCR and eGFR criteria:
= A decrease in 24-hour UPCR:
- For subjects with baseline UPCR >3 mg/mg:
UPCR <1 mg/mg
- For subjects with baseline UPCR <3 mg/mg:
UPCR <0.7 mg/mg
= eGFR:
>60 mlimin/1.73 in- or no confirmed
decrease of eGFR from baseline of >20%
= Inactive urine sediment defined as <10 RBC/hpf
= No discontinuation of IP or use of restricted
medicationb beyond the protocol-allowed
threshold before assessment
Proportion of subjects able to achieve Sustained reduction of OCS dose:
sustained reduction in oral corticosteroids = Week 52: Prednisone-
equivalent dose
(OCS) dose at Week 52 or Week 104 <7.5
mg/day by Week 24 and not exceeding this
dose through Week 52
= Week 104: Prednisone-equivalent dose
<5.0 mg/day by Week 80 and not exceeding this
dose through Week 104
and
= No discontinuation of IP or use of restricted
medicationb beyond the protocol-allowed
threshold before assessment
Proportion of subjects achieving CRR at CRR (see definition of CRR above)
Week 52 or Week 104 and achieving sustained Sustained reduction of OCS dose
(see definition
reduction of OCS dose above)
Proportion of subjects achieving at least PRR PRR or CRR (see definition
for PRR and CRR
at Week 52 or Week 104 and achieving above)
sustained reduction of OCS dose Sustained reduction of OCS dose (see
definition
above)
53
CA 03216395 2023-10-10
WO 2022/223771
PCT/EP2022/060670
Table 15: Exploratory Objectives (5)
Exploratory Objective: Outcome Measure:
Time to renal flare Renal flare is defined as an increase in
spot UPCR
and/or decline in renal function in subjects who
achieved PRR' or CRR" and then maintained it for at
least one subsequent visit. Flares will be characterised
as either protemuric or nephritic.
C. Proteinuric flare:
- In subjects achieving CRR: Spot UPCR
>1.5 mg/mg on two urine samples obtained
at least 2 weeks apart
- In subjects achieving PRR: >50%
increase in
spot UPCR from the average of the last two
measurements when PRR criteria were met
and spot UPCR >2.0 mg/mg on two urine
samples obtained at least 2 weeks apart
d. Neplintic flare:
- Presence of protemunc flare and
- >20% decrease in eGFR compared to the
average of the previous two visits, not
explained by change in comorbidities or
concomitant medications. A decrease in
eGFR has to be confirmed on at least two
samples at least 5 days apart after
non-systemic lupus erythematosus (non-
SLE) causes have been corrected or
excluded. One measurement is acceptable if
it leads to an increase in OCS or
inummosuppressive therapy
The relative difference in change from baseline Spot UPCR
to Week 52 (and to Week 104) in spot UPCR
Mean change in scores for overall disease SLEDAI-2K
activity from baseline to Week 52 (and to
Week 104)
Mean change in score measures of non-renal Non-renal components of SLEDAI-
2K
disease activity from baseline to Week 52 (and
to Week 104)
54
CA 03216395 2023-10-10
WO 2022/223771 PCT/EP2022/060670
Table 16: Exploratory Objective (6)
FNI)1,1,1tolv nputo)111f.- re
Physici sessment
md to
Mean change in the Systeraic Lupu SDI
International Collaborating C1inic!--1.1.can
egeofRheurnato1ogyiLICC ACR)
baseline to
\\ re. et:
Mean change m scores for patient-reported I A.:-sessment (Pt(3A
health status from baseline to Week 52 (and to
Week 104)
To evaluate the mununogeniciry Anti-drug antibodis ADA), amfrolumab
amfrolumab, pharinacc'klietic' ii tIon and ;'....rairieters, 21
gene type IF,4
phannacodynarnics (the PIC and gene signature
tunogeni..:ity results will be reported in the
f-11.
t-,Araluai. of MPA :xincentration and PK parameters
.mvcophenolic acid
'..\1,?::11.:.liang,? la lupus baseline Ai.11--1-µD7-
;..2,, mfibodies, C3 iplement
To Week 52 (an i.'_ WeA, 1-1
(ii i'ThUi
on ti = .e ¨ .
Pal. Soc. , PPS)
an = : Instimt,.-s of Heri
activity and
Standard of care (SOC) consisted of the combination of MMF and corticosteroids
cSpot UPCR was used instead of 24-hour UPCR for the PRR and CRR
classification, when evaluating time
to achieve renal response modified to include OCS tapering requirements as
well as for the PRR and CRR
classification for flare assessment.
[0192] Post hoc analyses included mean UPCR over time, cumulative proteinuria
(area under the curve
in UPCR standardized by expected follow-up time), the proportion of patients
with a CRR with UPCR
mg/mg (CRR0.5), and the time to CRR0.5 response sustained through Week 52.
[0193] Safety assessments were evaluated by an independent Data and Safety
Monitoring Board, and
included adverse events (AEs), laboratory assessments, and vital signs. AEs of
special interest (AESI)
were non-opportunistic serious infections, opportunistic infections,
malignancy, herpes zoster (HZ),
influenza, tuberculosis, hypersensitivity (including anaphylaxis or infusion-
related reactions), and major
adverse cardiovascular events (MACEs).
CA 03216395 2023-10-10
WO 2022/223771 PCT/EP2022/060670
8.2.4.4. Restricted medications
[0194] If a subject received one of the following after randomization, the
subject was considered a non-
responder for assessments such as CRR:
= Azathioprine
= M et h ot rexate
= Leflunomide
= Tacrolimus
= Mizoribine
= Cyclosporine
= Cholestyramine
= Increase in corticosteroids above the protocol-allowed doses or duration
= Corticosteroids with a long biologic half-life (eg, dexamethasone,
betamethasone)
8.2.4.5. Statistical Analysis
[0195] The primary endpoint was analyzed using a mixed model for repeated
measures fitted to
log-transformed 24-hour UPCR values, controlling for stratification factors,
and based on observed data
only up to discontinuation of trial intervention. The same analysis was used
for evaluating the change from
baseline in SLEDAI-2K, PGA, and PtGA, except that the data were not log-
transformed.
[0196] For secondary/exploratory binary endpoints, estimated responder rates
and 95% confidence
intervals (Cis) were calculated using a stratified Cochran¨Mantel¨Haenszel
approach controlled for
stratification factors. Patients who discontinued intervention, including
those withdrawn from the study, were
defined as nonresponders from that time point onward. Patients who were
missing data on single visits
were imputed using the last observation carried forward. If data were missing
on 2 or more sequential visits,
the patient was imputed as a nonresponder for any data missing from the second
visit onward. Time to
sustained response was analyzed post hoc using a Cox regression model
controlling for stratification
factors. The cumulative proteinuria was assessed using analysis of covariance
controlling for baseline
UPCR and stratification factors. Serologies (anti-dsDNA antibodies, C3/C4),
immunogenicity, PK and PD
were analyzed with summary statistics. Safety was also analyzed descriptively.
[0197] The efficacy and safety analyses included patients who received
dose of anifrolumab or placebo
(modified intention-to-treat [mITT] population). There was a protocol
amendment after the start of patient
recruitment modifying eGFR and 24-hour UPCR cutoff values for CRR criteria.
This was not accepted by
the Italian Medicine Agency or the Committee for Personal Protection (France)
so these patients were
excluded from all CRR analyses.
[0198] A 1:1:1 randomized sample size of 50 patients per treatment arm was
planned to provide ¨87%
power at the 2-sided alpha level of 0.0499 to detect a relative difference of
0.76 or less in the relative
56
CA 03216395 2023-10-10
WO 2022/223771 PCT/EP2022/060670
improvement of 24-hour UPCR (GMR) from baseline to Week 52 for combined
anifrolumab versus placebo,
assuming 1) reductions from baseline to Week 52 in 24-hour UPCR of 65% and 46%
for the combined
anifrolumab and placebo group, respectively, and 2) normal distribution of log-
transformed data with a
standard deviation (SD) of 0.8. Individual anifrolumab regimens versus placebo
analyses for efficacy
endpoints were conducted using a hierarchical testing strategy to control the
familywise error. All analyses
were performed with Statistical Analysis System (SAS ; SAS Institute Inc,
Cary, NC), version 9.3 or higher.
8.3. Results
8.3.1. Trial Population
[0199] 338 patients were screened, 147 of whom were randomized to receive
treatment (Figure 2B). The
mITT population consisted of 145 patients (45 receiving anifrolumab BR, 51
receiving anifrolumab IR, 49
receiving placebo).
[0200] Overall, 101 of 145 patients (69.7%) completed the 52-week treatment
period (Figure 2B). More
patients discontinued trial intervention early in the placebo (42.9%) group
than in both anifrolumab groups
(BR: 28.9%; IR: 19.6%; Figure 3), predominantly because of patient decision,
AEs, meeting the
discontinuation criteria, or lack of therapeutic response. Overall, 75
patients entered the second-year
extension period; only the first 52-week treatment period results are reported
here.
8.3.2. Efficacy
[0201] It was surprisingly observed that, due to increased proteinuria in
patients with proliferative LN, the
anifrolumab BR elicited suboptimal PK exposure and PD neutralization.
[0202] At Week 52, the mean 24-hour UPCR improved by 69% and 70% from baseline
to 0.92 mg/mg and
1.05 mg/mg in the combined anifrolumab group and the placebo group,
respectively, resulting in a GMR
between the treatment arms of 1.03 (95% Cl: 0.62, 1.71, P=0.905; GMR<1 favors
anifrolumab; Figure 4A,
Table 17).
Table 17: 24-Hour UPCR (mITT Population)
Anifrolumab BR Anifrolumab IR All Anifrolumab Placebo
(n=45) (n=51) (n=96) (n=49)
Patients included in the model
41 50 91 41
through Week 52, n
Baseline n 45 51 96 49
24-hour UPCR, mean
3.37 (2.50) 2.86 (1.85) 3.10 (2.18) 3.71 (3.20)
(SD), mg/mg
Week 52 n 29 37 66 25
24-hour UPCR, mean 0.97 (1.13) 0.88 (1.00) 0.92 (1.05)
1.05 (1.24)
(SD), mg/mg
GM a (95% CI) 0.33 0.29 0.31 0.30
(0.19,0.56) (0.18,0.46) (0.20,0.468) (0.18,0.50)
GMRb 1.10 0.96 1.03 NA
95% CI 0.61, 1.99 0.55, 1.69 0.62, 1.71
NA
P-valuec 0.741 0.895 0.905 NA
57
CA 03216395 2023-10-10
WO 2022/223771
PCT/EP2022/060670
Adjusted a lever NA NA 0.05 NA
BR, basic regimen; Cl, confidence interval; GM, geometric mean; GMR, geometric
mean ratio; IR, intensified
regimen; mITT, modified intention-to-treat; MMRM, mixed model for repeated
measures; NA, not applicable;
SD, standard deviation; UPCR urine protein-creatinine ratio. The model
includes fixed effects for treatment
group, visit, stratification factors, log-transformed 24-hour UPCR at
baseline, and treatment-by-visit
interaction. All data up to and including the date of discontinuation were
included in the analysis. a GM of the
ratio of 24-hour UPCR at the respective week over baseline. Values <1 indicate
improvement from baseline;
bGMR> 1 favors placebo; cAt Week 52, the P-values presented are unadjusted and
were compared with the
respective adjusted significance level (a). If a is not displayed, no formal
testing was performed and the
corresponding P-value was nominal. At all other visits, all P-values presented
are nominal.
[0203] In the anifrolumab IR group, there was a 71% improvement from baseline
in mean 24-hour UPCR
to 0.96 mg/mg at Week 52, resulting in a GMR versus placebo of 0.963 (95% Cl:
0.548, 1.693). Mean
UPCR improved over time across treatment groups (Table 18). There was a
numerically larger
improvement in 24-hour UPCR for the combined anifrolumab group and anifrolumab
IR group versus the
placebo group from Week 12 to Week 36, and for the anifrolumab IR group versus
anifrolumab BR group
at all time points (Figure 4A). There were no major differences in 24-hour
UPCR across predefined
subgroups (Figure 5A). Sensitivity post hoc analysis controlling for time from
LN diagnosis and baseline
24-hour UPCR did not reveal any major impact of these imbalances on primary
results. Both anifrolumab
groups had a numerically lower cumulative proteinuria than the placebo group
throughout the treatment
duration (Figure 6).
Table 18: 24-Hour UPCR (mg/mg) and Changes From Baseline by Visit, Summary
Statistics of the
mITT Population
Visit Treatment UPCR (mg/mg)
Change from baseline (mg/mg)
group
n Mean SD n Mean SD
Anifrolumab BR 45 3.37 2.50
Anifrolumab IR 51 2.86 1.85
Baseline
Combined
96 3.10 2.18
Anifrolumab
Placebo 49 3.71 3.20
Anifrolumab BR 35 2.63 2.60 35 -0.74 2.16
Anifrolumab IR 43 1.82 1.85 43 -0.87 1.81
Week 12
Combined 78 2.19 2.24 78 -0.81 1.96
Anifrolumab
Placebo 36 2.65 2.63 36 -0.63 1.78
Anifrolumab BR 35 1.76 1.76 35 -1.55 2.68
Anifrolumab IR 45 1.69 1.68 45 -1.23 1.84
Week 24
Combined 80 1.72 1.71 80 -1.37 2.24
Anifrolumab
Placebo 32 2.45 2.83 32 -0.87 2.03
Anifrolumab BR 30 1.34 1.37 30 -2.14 2.59
Week 36
Anifrolumab IR 32 1.11 1.39 32 -1.31 2.04
58
CA 03216395 2023-10-10
WO 2022/223771 PCT/EP2022/060670
Combined
Anifrolumab 62 1.22 1.38 62 -1.72 2.34
Placebo 28 1.33 1.08 28 -1.85 2.08
Anifrolumab BR 29 0.97 1.13 29 -2.39 2.52
Anifrolumab IR 37 0.88 1.00 37 -1.69 1.83
Week 52
Combined
Anifrolumab 66 0.92 1.05 66 -2.00 2.17
Placebo 25 1.05 1.24 25 -2.10 2.11
8.3.3. Secondary and Exploratory Endpoints
The percentages of patients with a CRR at Week 52 were similar in the combined
anifrolumab group and
the placebo group (31.0% vs 31.1%, difference -0.1% [95% Cl: -16.9, 16.8])
(Table 19). However,
anifrolumab IR elicited a numerically greater percentage of patients than did
placebo with a CRR (45.5%
vs 31.1%, difference 14.3% [95% Cl: -5.8, 34.5]), CRR05 (40.9% vs 26.7%,
difference 14.2% [95% Cl:
-5.4, 33.9]), and CRRa (40.9% vs 13.3%, difference 27.6% [95% Cl: 9.4, 45.7])
at Week 52 (Table 19).
Anifrolumab IR responses for all CRR definitions were observed as early as
Week 12 and sustained through
Week 52 (Figure 4B, Figure 4C; Figure 7A and Figure 7B). The time to sustained
CRRo5 was numerically
shorter with anifrolumab IR than with placebo (CRRo5 hazard ratio, 1.46; 95%
Cl: 0.71, 3.14) (Figure 4C).
By contrast, anifrolumab BR responses for all CRR definitions were generally
similar to or lower than the
placebo group at all time points apart from Week 12 Figure 4B; Figure 4C,
Figure 7A and Figure 7B).
59
CA 03216395 2023-10-10
WO 2022/223771
PCT/EP2022/060670
Table 19: Summary of Secondary and Exploratory Endpoints
Responders, Difference Nominal
Enpoints
n/N (Vo)9 (95% CI)e P-valueb
CRR at Week 52c Combined 27/87 (31.0) -0.1 (-16.9,16.8)
0.993
Basic 7/43 (16.3) -
14.8 (-32.9, 3.2) 0.107
Intensified 20/44 (45.5) 14.3 (-5.8, 34.5)
0.162
Placebo 14/45 (31.1) - -
CRRa at Week 52c Combined 21/87 (24.1) 10.8 (-3.3, 25.0)
0.134
Basic 3/43 (7.0) -6.4 (-20.6, 7.8)
0.380
Intensified 18/44 (40.9) 27.6 (9.4, 45.7)
0.003
Placebo 6/45 (13.3) - -
CRR0.5 at Week 52c,d Combined 25/87 (28.7) 2.1 (-14.3,18.4) -
Basic 7/43 (16.3) -10.4
(-28.1, 7.3) -
Intensified 18/44 (40.9) 14.2 (-5.4, 33.9) -
Placebo 12/45 (26.7) - -
Sustained oral Combined 31/67 (46.3) 12.9 (-7.3, 33.1)
0.209
glucocorticoid dosage
reduction (7.5 Basic 11/31(35.5) 2.2 (-21.4, 25.7)
0.858
mg/day, Week 24 to Intensified 20/36 (55.6) 22.2
(-0.8, 45.2) 0.058
Week 52e)
Placebo 11/33 (33.3) - -
CRR with sustained Combined 21/87 (24.1) -0.3 (-16.1, 15.5)
0.970
oral glucocorticoid
dosage reduction to Basic 6/43 (14.0) -
10.5 (-27.6, 6.6) 0.229
57.5 mg/dayc
Intensified 15/44(34.1) 9.7 (-9.5, 28.8)
0.323
Placebo 11/45 (24.4) - -
CI, confidence interval; CRR, complete renal response; ORR:is, CRR with UPCR
50.5 mg/mg; CRRa; CRR
with inactive sediment; n, number of patients meeting the criteria for a
response; N, number of patients
included in the analysis; UPCR, urine protein-creatinine ratio. aThe response
rates, differences between the
groups, and associated 95% Cls were calculated with a weighted Cochran-Mantel-
Haenszel method.
Differences between anifrolumab and placebo groups were calculated in
percentage points (the percentage
in the anifrolumab group minus the percentage in the placebo group); bNominal
P-values are unadjusted as
the primary outcome was not significant so all other comparisons are
considered nonsignificant; Patients from
France and Italy were excluded from the analysis; dAnalyzed post hoc;
eAnalyzed in patients with baseline
oral glucocorticoid dosage 20 mg/day.
CA 03216395 2023-10-10
WO 2022/223771 PCT/EP2022/060670
[0204] Anifrolumab IR was associated with a greater percentage of patients
versus placebo with sustained
glucocorticoid dosage reduction to mg/day (55.6% vs 33.3%, difference 22.2%
[95% Cl: ¨0.8, 45.2])
and a CRR with sustained glucocorticoid reduction (34.1% vs 24.4%, difference
9.7% [95% Cl: ¨9.5, 28.8],
Figure 5B).
[0205] Compared with placebo, anifrolumab IR elicited numerically greater
improvements from baseline
in measures of disease activity (SLEDAI-2K, PGA, PtGA) (Figure 11) and lupus
serologies (Figure 9).
Compared with the placebo group, patients positive for anti-dsDNA antibodies
at baseline had numerically
greater reductions in anti-dsDNA antibody levels with anifrolumab IR versus
placebo (Figure 9A). Patients
with low C3 at baseline had an increase in C3 levels across groups (Figure
9B). There were no clear
differences in C4 increases across groups (Figure 10). Compared with the
placebo group, the C3 increase
was numerically larger with anifrolumab IR from Week 36 and with anifrolumab
BR from Week 44 (Figure
9B). Overall, the incidence of antidrug antibody positivity at any time during
the study was low and similar
across groups (anifrolumab BR, 6.7%; anifrolumab IR, 3.9%; placebo, 4.1%).
8.3.4. Pharmacokinetics
[0206] The PK analysis included 95 patients who received anifrolumab and had
at least 1 quantifiable
serum PK observation after the first dose. Anifrolumab exhibited nonlinear PK
between the BR and IR
groups (Figure 12). In IFNGS-high patients (94.5%), the median Week 12
anifrolumab steady-state
concentration was 63.4 pg/mL with anifrolumab IR (Figure 13B) and 8.2 pg/mL
with anifrolumab BR (-50%
lower than in nonrenal SLE) (Figure 13A). When anifrolumab IR was tapered to
300 mg at Week 16, the
median trough concentrations at Weeks 24 and 36 were lower than in patients
with nonrenal SLE.
Anifrolumab clearance was higher among patients with baseline UPCR >3 mg/mg
than those with UPCR
mg/mg (Figure 15).
8.3.5. Pharmacodynamics
[0207] The PD analysis included 137 IFNGS-high patients. A median PD
neutralization >80% was
observed with anifrolumab IR across all visits (Weeks 12, 24, 36, and 52) and
with anifrolumab BR at Weeks
12 and 24 only, after which there was a rebound in IFNGS (Figure 8). Minimal
PD neutralization was
observed in the placebo group.
8.3.6. Safety and Tolerability
[0208] Safety was evaluated in the mITT population (Table 20).
[0209] The incidence of any AE was similar across groups. AEs that were more
common (5`)/0 difference)
in the combined anifrolumab group versus the placebo group were HZ (16.7% vs
8.2%), urinary tract
infection (16.7% vs 10.2%), and influenza (8.3% vs 2.0%). Serious AEs occurred
in 22.2%, 17.6%, and
16.3% of the anifrolumab BR, anifrolumab IR, and placebo groups, respectively.
The only serious AE
reported in >1 patient per treatment group was HZ. There were no deaths during
the treatment period;
61
CA 03216395 2023-10-10
WO 2022/223771 PCT/EP2022/060670
however, there was 1 fatal vascular neurologic AE in the anifrolumab BR group
during follow-up. AEs
leading to discontinuation of trial intervention occurred in 11% to 12% of
patients across groups.
[0210] Slightly more patients in the combined anifrolumab versus the placebo
group developed any
infection or infestation (72.9% vs 63.3%) and any serious infection or
infestation (10.4% vs 8.2%). However,
the incidences of protocol-specified AESI infections, apart from HZ, were low
and similar for the combined
anifrolumab group versus the placebo group, including non-opportunistic
serious infections (1.0% vs 6.1%),
opportunistic infections (1.0% vs 2.0%), influenza (5.2% vs 2.0%), and
tuberculosis (no patients). HZ
occurred in 20.0% and 13.7% patients in the anifrolumab BR and IR groups,
respectively. Of these 16
cases, 6 were serious, 5 were severe and 11 were of mild to moderate
intensity, and all were cutaneous
(13 localized, 3 disseminated). Most HZ events tended to occur early in the
trial and were resolved with
treatment. Other AESIs, including malignancy and MACEs, occurred in <1% of
patients across anifrolumab
groups. There were no reports of anaphylaxis, and there was 1 serious infusion-
related reaction in the
anifrolumab BR group. No clinically important worsening was observed in
hematology or chemistry panels,
urinalysis, vital signs, or electrocardiograms.
62
CA 03216395 2023-10-10
WO 2022/223771 PCT/EP2022/060670
Table 20: Anifrolumab safety
AEs during treatment, Anifrolumab Anifrolumab BR
Anifrolumab IR Placebo
mITT population combined (n=96) (n=45) (n=51)
(n=49)
Any AE 90 (93.8) 43 (95.6)
47 (92.2) 44 (89.8)
Any AE with outcome of death 0 0 0 0
Any SAE 19(19.8') 10(22.2')
9(17.6') 8(16.3')
Any AE leading to discontinuation
of trial intervention 11 (11.5) 5 (11.1)
6(11.8) 6 (12.2)
Adverse events of special interest
23 (24.0) 12 (26.7) 11 (21.6) 8(16.3)
Non-opportunistic serious 1 (1.0) 0 1 (2.0)
3 (6.1)
infectionsa
Opportunistic infectionsb 1 (1.0) 1 (2.2) 0
1 (2.0)
Anaphylaxis 0 0 0 0
Malignancy 1 (1.0) 0 1 (2.0) 0
Heroes zosterc 16 (16.7) 9(20.0) 7(13.7)
4(8.2)
Tuberculosis/LTB 0 0 0 0
Influenza 5 (5.2) 2 (4.4) 3 (5.9)
1 (2.0)
Vasculitis (non-SLE) 0 0 0 0
Major adverse cardiovascular
events according to the 0 0 0
1 (2.0)
CV-EAC
Any AEs ?VA) in the combined anifrolumab group
Urinary tract infection 16 (16.7) 10 (22.2)
6 (11.8) 5(10.2)
Herpes zoster 16 (16.7) 9(20.0) 7(13.7)
4(8.2
Nasogharvngitis 15 (15.6) 6 (13.3)
9 (17.6) 9 (18.4)
Upper respiratory tract
15 (15.6) 8 (17.8) 7 (13.7) 8 (16.3)
infection
Bronchitis 11 (11.5) 4 (8.9) 7 (13.7)
6 (12.2)
Influenza 8 (8.3) 2 (4.4) 6 (11.8)
1 (2.0)
Diarrhea 7(7.3) 3(6.7) 4(7.8)
10 (20.4)
Cough 7 (7.3) 4 (8.9) 3 (5.9)
4 (8.2)
Pharyngitis 7(7.3) 3(6.7) 4(7.8)
2(4.1)
Oral heroes 6(6.3) 3(6.7) 3(5.9)
2(4.1)
Headache 5 (5.2) 2 (4.4) 3 (5.9)
4 (8.2)
Heroes simplex 5(5.2) 3(6.7) 2(3.9)
2(4.1)
Nausea 5 (5.2) 1 (2.2) 4 (7.8)
2 (4.1)
AE, adverse event; BR, basic regimen; CV-EAC, Cardiovascular Event
Adjudication Committee; IR, intensified
regimen; LTB, latent tuberculosis; MedDRA, Medical Dictionary for Regulatory
Activities; mITT, modified
intention-to-treat; SAE, serious adverse event; SLE, systemic lupus
erythematosus. AEs are coded using
MedDRA version 22.1. Percentages are based upon the 145 patients in the mITT
who received at least 1
63
CA 03216395 2023-10-10
WO 2022/223771 PCT/EP2022/060670
dose of anifrolumab or placebo. Any AE occurring from the day of the first
dose to 28 days after the last dose
was included. aExcludes tuberculosis/latent tuberculosis and influenza;
bExcludes herpes zoster and visceral
disseminated herpes zoster; elncludes visceral disseminated herpes zoster.
8.4. Discussion
[0211] These data describe the results from a phase 2 TULIP-LN trial, which
explored the safety and
efficacy of adding 2 different anifrolumab dosages to standard therapy for
patients with active, proliferative
LN. The primary endpoint (UPCR improvement in the combined anifrolumab group
versus the placebo
group) was not met; however, anifrolumab IR was associated with numeric
efficacy across a range of
clinically meaningful renal endpoints, including proteinuria, multiple
stringent CRR definitions (requiring
UPCR improvement and inactive urinary sediment), and sustained glucocorticoid
dosage reductions.
[0212] Surprisingly, in contrast to previous observation in SLE from study
1013, study 05 and study 04,
intensified anifrolumab dosing was required to elicit clinical efficacy in
patients with LN, likely because
anifrolumab IR yielded similar serum exposure and PD neutralization to that
seen with anifrolumab BR (SLE
dosing) in nonrenal SLE. In contrast, because of the proteinuria in LN leading
to increased clearance,
anifrolumab BR elicited suboptimal serum exposure that was ¨50% lower in
patients with LN than in
patients with nonrenal SLE. Indeed, anifrolumab BR elicited limited PD
neutralization and clinical
responses.
[0213] Reduction of proteinuria is strongly associated with reduced risk of
end-stage kidney disease [33].
As such, attenuation of proteinuria is an appropriate, objective surrogate
endpoint for a phase 2 proof-of-
concept trial. Here, 24-hour UPCR improved by approximately 70% from baseline
across groups.
Furthermore, anifrolumab IR yielded a 30% numeric improvement over placebo at
Week 52 in cumulative
proteinuria, which is a unique endpoint in LN trials that adds clinical value
because it represents overall
proteinuria improvement overtime, making it less susceptible to short-term
confounders, such as collection
errors, diet, and exercise.
[0214] Anifrolumab IR was also associated with efficacy over placebo across
all CRR definitions as early
as Week 12. Anifrolumab IR yielded the strongest response (treatment
difference 28%) for CRRa, a highly
stringent criterion requiring no hematuria (a marker of glomerular
inflammation and acute kidney injury [34]).
Additionally, more patients with high baseline glucocorticoid dosages in the
anifrolumab IR group versus
the placebo group attained a sustained glucocorticoid dosage reduction or a
CRR with a sustained dosage
reduction.
[0215] Overall, the safety profile observed with anifrolumab in patients with
LN was consistent with that
observed in patients with nonrenal SLE, including numerically higher incidence
of influenza and cutaneous
HZ with anifrolumab versus placebo [11]. Most AEs were mild or moderate in
intensity, were nonserious,
and did not lead to discontinuation of the trial intervention. Notably,
anifrolumab IR was not associated with
higher incidence of AEs or AESIs, including HZ, compared with anifrolumab BR.
64
CA 03216395 2023-10-10
WO 2022/223771
PCT/EP2022/060670
[0216] Patients with LN are nearly double as likely to develop serious
infections and are at higher risk of
HZ infection than patients with nonrenal SLE [35]. In line with this, the
incidence of cutaneous HZ was
higher among patients with LN than those with nonrenal SLE, perhaps owing to
LN disease severity
requiring more potent background immunosuppressive treatments [5]. This theory
is supported by the
observation that cutaneous HZ tended to occur early in the trial when
glucocorticoid dosages were high.
[0217] Overall, the TULIP-LN results supports the efficacy and safety of
anifrolumab IR in LN. Anifrolumab
IR was superior over placebo for several clinically relevant endpoints and was
generally well tolerated over
a 52-week period.
8.5. Summary
[0218] This Phase ll LN study 07 was a 2-year global, multicenter,
exploratory, double-blind placebo-
controlled, study to explore the efficacy and safety of anifrolumab in
patients with active, Class III or IV
(both with or without Class V) LN. The study evaluated 2 anifrolumab dosing
regimens as compared with
placebo: a basic regimen using the proposed dose for SLE patients (300 mg IV
Q4VV) and an intensified
regimen (first 3 doses of 900 mg IV Q4W followed by 300 mg IV Q4W for the
remainder of the study). All
patients received MMF plus glucocorticoids as background SOC therapy. The 147
randomized patients
were allocated at a 1:1:1 ratio to the anifrolumab intensified, anifrolumab
basic or placebo group,
respectively. Despite the study not meeting its primary objective, relative
difference in UPCR change from
baseline to Week 52 for the anifrolumab groups combined vs placebo,
exploratory and post-hoc efficacy
analyses suggested a beneficial effect of anifrolumab intensified regimen vs
placebo on a range of clinically
meaningful endpoints at Week 52. The proportion of patients achieving CRR with
0.7 mg/mg UPCR
threshold was numerically larger in anifrolumab vs placebo group (treatment
difference 14.3%; 95% Cl:
¨5.8, 34.5). In addition, more anifrolumab-treated patients achieved CRR using
a more stringent UPCR
threshold 0.5
mg/mg) as compared with placebo (treatment difference 14.2%; 95% Cl: ¨5.4,
33.9).
[0219] One important treatment goal in LN is to achieve rapid and maintained
control of the renal disease;
in this study the time to achieve CRR 0.5 mg/mg UPCR threshold) that was
sustained over time through
Week 52 was numerically shorter with anifrolumab intensified dosing than with
placebo (hazard ratio, 1.46;
95% Cl: 0.71, 3.14). Moreover, numerically more patients in anifrolumab group
compared with placebo
achieved a sustained reduction of oral glucocorticoids, i.e., to a dose of 7.5
mg/day of prednisolone or
equivalent by Week 24 and maintaining this dose through Week 52 (treatment
difference 22.2%; 95% Cl:
¨0.8, 45.2).
[0220] In terms of anifrolumab exposure, this was likely suboptimal in the
basic dosing regimen due to
higher clearance associated with proteinuria in LN, whereas the exposure in
intensified regimen was more
comparable to exposure for 300 mg IV Q4W in non-renal SLE.
9. EXAMPLE 3: Subcutaneous administration of anifrolumab
CA 03216395 2023-10-10
WO 2022/223771 PCT/EP2022/060670
9.1. Phase I study MI-CP180 of IV anifrolumab in patients with SSc
[0221] Mean anifrolumab serum concentrations after a single-dose
administration based on body weight
are presented in Figure 16A. After a single-dose administration, anifrolumab
exhibited nonlinear-linear PK
at lower dose levels (<10.0 mg/kg) in both IFNGS high and IFNGS low patients.
A dose-proportional
increase in Cmax was observed, but an increase in AUC was more than dose
proportional between 0.1 and
10.0 mg/kg. Anifrolumab t1/2 was more prolonged in higher dose cohorts. At the
highest dose level
investigated (20.0 mg/kg), the terminal t1/2 was approximately 12 days.
9.2. Phase I of IV and SC anifrolumab in healthy volunteers (study 06)
[0222] In this Phase I randomized, placebo-controlled study, 30 healthy adults
were assigned to three
treatment cohorts (anifrolumab 300 mg Sc (n=6), anifrolumab 300 mg intravenous
(n=6), anifrolumab
600 mg Sc (n=6)) and placebo (n=4/cohort). After SC administration, exposure
to anifrolumab increased
dose proportionally from 300 mg to 600 mg based on area under the serum
concentration-time curve.
Arithmetic mean serum anifrolumab concentration-time profiles following single
IV and SC administration
are shown in Figure 16B. As reported in Tummala et al. 2018 [19], which is
incorporated herein by
reference in its entirety, this study estimated the bioavailability to
anifrolumab in healthy volunteers to be
87% of the intravenous exposure.
9.3. Phase ll of SC anifrolumab in SLE patients (study 08)
[0223] This study was designed to characterize the pharmacokinetics and
pharmacodynamics of
subcutaneously administered anifrolumab (Figure 17A).
[0224] The study explored the clinical pharmacology, safety, and exploratory
efficacy of subcutaneous
anifrolumab. Pharmacokinetics in study 08 were consistent with the high
bioavailability in study 06 (healthy
volunteers) and high CL in IFNGS high patients with SLE. Anifrolumab,
administered subcutaneously every
2 weeks to patients with SLE and moderate-to-severe skin manifestations had
non-linear pharmacokinetics
that were more than dose proportional, and neutralized the type I interferon
gene signature in a dose-
dependent manner (Figure 17B and Figure 17C). In particular, 150 mg or 300 mg
of subcutaneous
anifrolumab administered every 2 weeks for 50 weeks had non-linear
pharmacokinetics, whereby Ctrough
concentrations were more than dose proportional. The number of adverse events
with subcutaneous
anifrolumab was similar to the numbers observed following intravenous
administration in larger studies of
patients with SLE.
[0225] The results of study 08 are fully described in Bruce et al. [36], which
is incorporated herein by
reference in its entirety.
[0226] Study 08 was limited by small samples sizes, and no conclusions could
be drawn about the
biological effects of the study drug (e.g., on complement C3 or C4
concentrations) or its clinical efficacy.
The inclusion of only patients with high type I interferon gene signatures and
active skin disease also limited
66
CA 03216395 2023-10-10
WO 2022/223771 PCT/EP2022/060670
the generalizability of the study to patients with similar disease
characteristics. The study was further limited
by the increasing frequency of missing values with time.
9.4. Conclusion
[0227] The PK of anifrolumab consistently exhibited target mediated drug
disposition where the
concentrations or exposures decreased more than dose-proportional at lower
dose levels. High
bioavailability of anifrolumab administered via Sc injection was observed in
study 06 (healthy volunteers);
the ratio of the AUC of anifrolumab Sc to anifrolumab IV under 300 mg was
approximately 87%.
10. EXAMPLE 4: Determination of the optimal subcutaneous unit dose
10.1. Aim
[0228] In order to detect an optimal dosage regimen for subcutaneous
administration of anifrolumab, the
inventors developed a population PK and a PK/PD model, designed to utilize
existing human clinical trial.
The PK data from phase III studies 04 and 05 and phase II study 1013 were used
to assist the development
of the population PK model.
[0229] In studies 1013, 04, and 05, in SLE patients, treatment with a 300 mg
Q4W anifrolumab dose
resulted in a rapid and sustained neutralization of type I IFN 21-gene
signature of larger than 80% (Figure
18). Patients who received anifrolumab 150 mg showed a sub-optimal
neutralization of the type I IFN gene
signature and patients who received placebo did not show any neutralization.
Patients with higher PD
suppressions were associated with higher BICLA and SRI(4) response at Week 52.
[0230] An initial goal of the inventors was to detect a subcutaneous dose
providing an equivalent exposure
as a standard 300 mg IV (Q4VV) dose, while concomitantly allowing more regular
dosing that could be
provided in a lower volume. This was based on the understanding that 300 mg IV
Q4W provides optimal
clinical PK profiles and clinical efficacy (e.g. in terms of achieving BICLA
response in SLE patients) as
reported e.g. in Furie et. al. 2017 [11] which is incorporated herein by
reference in its entirety.
10.2. 5.3: Results
10.2.1. Initial selection of the subcutaneous dose for anifrolumab
[0231] In an initial analysis, the inventors determined specific dosage
regimens predicted to provide
equivalent exposure to that achievable with 300 mg Q4W IV. A dosage regimen of
105 mg subcutaneous
weekly (QW) was initially found to provide an AUC ratio close to (or slightly
greater than) 1 (Figure 19A),
even where projected bioavailability was reduced by ¨7% relative to that
reported in Tummal et. al.
2018 [19] (incorporated herein by reference in its entirety) to account for
inter-individual variance in
bioavailability (Figure 19B). 105 mg subcutaneous QW appeared to provide
comparable or improved
median trough concentrations and IFNGS suppression as the comparative 300 Q4W
mg IV dose (Figure
20A, Figure 20B). From these initial analyses it appeared that SC 105 mg QW
dose of anifrolumab should
67
CA 03216395 2023-10-10
WO 2022/223771 PCT/EP2022/060670
be selected as equivalent to a 300 mg Q4W and thus as having the optimal
efficacy/risk profile for the
treatment of SLE patients. Importantly these analyses assumed that the 300 mg
IV dose was on of close
to the plateau of the dose response curve for anifrolumab, i.e. that
increasing the dose beyond 300 mg IV
Q4W would provide not provide any meaningful benefit to patients, particularly
when taking into account
the increased risk of herpes zoster infection for higher doses.
10.2.2. Amended selection of the subcutaneous dose for anifrolumab
[0232] The inventors therefore first considered 105 mg QW to be the optimal SC
dose of anifrolumab for
the treatment of type I IFN mediated disease based on the data available from
the MUSE study, study 06
and study 08. However, to confirm the selection of the 105 mg SC dose, the
inventors conducted further
analysis of the data from the TULIP I (study 04) and TULIP II (study 05)
clinical trials.
[0233] Using the additional data, a positive-exposure-BICLA relationship in
IFNGS high patients was
demonstrated. Surprisingly, this relationship was observed even within the 300
mg IV Q4W group (Figure
21A and Figure 21 B) . BICLA response within the 300 mg IV Q4W patient group
was therefore variable.
Logistic regression of the week 52 BILCA response in patients confirmed that
PK exposure was a significant
covariate in both TULIP I and TULIP II. Cave was found to be statistically
significant in both the analysis of
all-comers and IFNGS high completed the treatments in both TULIP I and TULIP
ll independently and
pooled TULIP I and TULIP ll analysis. Exposure-response demonstrating higher
Cave were correlated with
higher BICLA and SRI(4) in pooled data from the TULIP I and TULIP ll studies.
In other words, there was
exposure-dependent variability in response to anifrolumab within lupus
patients administered 300 mg Q4W
IV (Figure 21A and Figure 21B).
[0234] Surprisingly, the 300 mg IV Q4W dose was thus found to reside on the
onset of the plateau of
exposure response, whilst the suboptimal 150 mg IV dose resided in the step
region of the exposure-
response curve (Figure 22A). As a consequence of these analyses, the inventors
determined that a 105
mg QW subcutaneous dose (previously considered equivalent to a 300 mg IV Q4W
dose) would not provide
the optimal balance of efficacy and safety in lupus patients. The inventors
thus determined to select another
dose for SC administration that would mitigate the impact of variability in
response a population of lupus
patients.
[0235] In summary, from initial analysis, it appeared that administration of a
subcutaneous dose of 105
mg QW anifrolumab would achieve at least a similar efficacy as 300 mg IV Q4W.
However, surprisingly,
following further analysis by the inventors of newly available data from
further studies, it was found that the
concentration of this weekly (QW) dose could be increased without reaching a
maximum threshold in terms
of bioavailability and efficacy. In other words, the QW dose could be
increased beyond 105 mg to provide
even greater blood plasma concentrations and IFNGS suppression, and to
mitigate the observed variability
in response in SLE patients. A dose of 105 mg would therefore be sub-optimal.
68
CA 03216395 2023-10-10
WO 2022/223771 PCT/EP2022/060670
[0236] The surprising additional dose-response curve data were further
validated by demonstrating that
the probability of meeting a relevant BICLA response (in IFNGS high patients)
was increased for weekly
subcutaneous administration with concentrations higher than the 105 mg dose
(Table 21). These data
demonstrate the unexpected position of the dose-response plateau (e.g. under
subcutaneous
administration), which shifts to the right for doses increasing above 105 mg
(Figure 22B), showing the
maximal BICLA response is in fact achievable with a dose of greater than 105
mg and that a higher dose
would be preferable (Table 21).
Table 21: SC Efficacy Projection assuming no dose delays/interruptions.
111
. _ õ,. ,õ ,,,õ
Eqwvalent IV dose - 300 mg IV 04W --400 mg IV
Q4VV -<450 mg IV 04W < 500 mg IV Q4'N
-300 mg SC 02 \ini
Median Cave ratio
to 300 mg IV 0.92 1.14 1.36 1.59 1.81
exceeded 95 33", 94% 20 33 5 48.9
percentile of 300 mg
IV
oveclappec1,iith Q.3 t8 1110 21;i.
z5th percentile of
1000 mg IV
IFNGS high pts 86 94 99%
with 55" chance of
BICLA response
% IFNGS high pis -10% -23% -38% -55% -68%
with 60% chance of
BICLA response
10.2.3. The bioavailability of anifrolumab is highly variable
[0237] Upon further investigation as to the bioavailability of anifrolumab,
the inventors elucidated that a
surprisingly high level of variability in anifrolumab bioavailability
subsequent to subcutaneous administration
may exist amongst different patients. The high level of variability in
anifrolumab bioavailability was not
appreciated in previous studies reporting >80% bioavailability for
subcutaneous administration (see
Example 3) [19]. The bioavailability (F1) of anifrolumab in Study 08 (SLE
patients, SC) was found to be
81% in healthy volunteers using the population PK model (Table 22).
[0238] The bioavailability of a typical monoclonal antibody via subcutaneous
injection ranged from 52-
80% [37]. The inventors conducted external validation of Study 08, Ph2 SC in
SLE, using a PPK model
developed with healthy volunteers and SLE patients from IV studies to
determine the bioavailability in lupus
population.
69
CA 03216395 2023-10-10
WO 2022/223771 PCT/EP2022/060670
Table 22: Anifrolumab bioavailability based on healthy volunteers
Final IV SLE model I Study 06 HVs
(including 6 subjects (300 mg IV: 6, 300
CL cIFNGS Iiijh) 0.193 L/day
CL (IFNGS low/HVs) 0.153 Liday 0.146 0.036 Liday
IIV: CL 0.109 (CV: 33.1%) 0.0431 (CV: 20.8%)
Fl
Ka 0.274 0.124 /day
IIV: Ka 0.221 (CV: 47%)
[0239] In-depth analysis of the data from study 08 revealed that
bioavailability was affected by SC
administration site. In particular, when the bioavailability of 300 mg at the
abdomen was estimated versus
IV, the bioavailability (F1) was estimated to be 85.4% compared to 81% when
the sites of injection was not
taken into consideration. As such, Ctroughs following injection at thigh
trended downward compared to
injection at abdomen (Figure 23A and Figure 23B). As such, it was surprisingly
concluded that
bioavailability may, in fact, be as low as 70%, taking into account
variability due to injection site and the
higher variability in bioavailability for lupus (SLE) patients compared to
healthy volunteers. Importantly, if a
bioavailability (F1) of 81-87% was assumed, 105 mg was initially projected to
provide a comparable Cave to
that of 300 mg IV (Figure 24). By contrast, when the estimated bioavailability
was reduced to ¨70% or less,
the median Cave of the 105 mg QW subcutaneous dose fell to below 1 (Figure
25A, Figure 25B and Table
23).
Table 23: Anifrolumab bioavailability
Bioavailability 90 mg SC 105 mg SC 120 mg SC 135 mg SC 150 mg Sc
QW QW QW QW QW
82% 0.92 1.14 1.36 1.59 1.81
0.73 0.92 1.11 1.31 1.49
0.57 0.73 0.89 1.06 1.22
Values = median Cave to 300 mg IV; SC= subcutaneous
[0240] Furthermore, there was an undesirable 30% overlap in Cave between 105
mg SC QW and the
suboptimal IV dose, 150 mg Q4W versus the only 16% overlap observed when the
bioavailability was
assumed to be 81% (Figure 25A). However, when a SC 120 mg dose was used, the
Cave overlap with the
150 mg IV dose was less than the overlap with the optimal IV dose of 300 mg
IV, even when a low
bioavailability of 70% was assumed (Figure 25B). Furthermore, the 120 mg SC QW
dose had minimal
overlap with the undesirable 1000 mg IV dose (Figure 25C), at which the risk
of herpes zoster infection is
increased (Figure 27). A 150 mg SC QW dose had an undesirable overlap with the
1000 mg IV Q4W dose.
CA 03216395 2023-10-10
WO 2022/223771 PCT/EP2022/060670
Even more surprisingly, a SC dose of 120 mg or more was projected to have
better PD suppression (Table
24) than the assumed optimal 300 mg IV dose (Table 25).
[0241] Selection of a dose higher than 105 mg, preferably 120 mg or higher,
therefore optimizes the
exposure-response by minimizing the impact of the variability of the onset of
response and bioavailability
in patients with SLE and LN (Table 24, Figure 26A and Figure 26B). A SC dose
of below 150 mg QW is
also desirable to reduce the risk of herpes zoster infection.
Table 24: Calculated % PD suppression at week 24, SC dose
SC VVK24 Suppression (%)
Dose (mg) 75% 80% 90%
90 89.0 84.6 63.8
105 92.9 89.8 69.2
120 94.8 91.9 74.2
135 96.0 93.9 75.8
150 96.5 94.6 80.2
Table 25: Calculated % PD suppression at week 24, IV dose
IV WK24 Suppression (%)
Dose (mg) 75% 80% 90%
300 74.2 68.3 42.5
400 82.9 77.9 54.7
450 85.9 80.8 56.4
500 88.7 84.8 62.5
600 92.7 88.8 68.9
1000 96.9 94.5 80.2
[0242] Doses of 120 mg and 135 mg QW particularly provide reasonable benefit-
risk profiles. At doses at
150 mg QW or above, there is an increase in safety risk e.g. an increase in
the risk of herpes zoster in
patients, given that a SC dose of 150 mg QW is equivalent to a 1000 mg IV Q4W
(Figure 25C, Figure 27).
A subcutaneous dose of less than 150 mg QW and more than 105 mg QW was
therefore determined as
the preferred dose. A subcutaneous dose of less than 150 mg QW and less or
equal to 135 mg was
determined as the more preferred dose. A subcutaneous dose of 120 mg was
determined as optimal dose.
[0243] To summarize, the inventors have surprisingly found that the optimal
subcutaneous dose of
anifrolumab may first appear to be 105 mg QW given the preliminary data that
was previously available
(FIG. 12). However, further data and analyses surprisingly revealed that a
dose of 105 mg QW or lower
would under-dose a significant proportion of patients (Figure 22B, Table 23).
Thus, a particularly
advantageous dosing regimen demonstrated by the inventors was doses higher
than 105 mg QW. A
particularly optimal dose was determined to be 120 mg subcutaneous QW, which
is equivalent to
71
CA 03216395 2023-10-10
WO 2022/223771 PCT/EP2022/060670
approximately 400 mg IV Q4W, depending on estimated bioavailability. The
optimal SC dose is therefore
surprisingly >30% higher than what would be considered optimal based solely on
a comparison with 300
mg IV Q4W and the previously understood bioavailability of anifrolumab.
[0244] The inventors have thus surprisingly demonstrated that a dose of
greater than 105 mg SC QW and
less than 150 mg SC QW, and in particular a dose of 120 mg QW (a) maximizes
efficacy whilst maintaining
an acceptable safety profile, (b) mitigates the impact of variability in
bioavailability and (c) mitigates the
impact of variability in the onset of response. Thus, dosing at greater than
105 mg QW advantageously
accounts for the variance in bioavailability, leading to improved therapeutic
outcome. A dose of less than
150 mg QW mitigates the risk of herpes zoster infection.
[0245] Pharmacokinetic data in healthy volunteers (study 06 [IV arm only]) and
in patients with SLE
(studies 1013, 02, 04, and 05) were also pooled to evaluate the impacts of
covariates, such as
demographics and renal/liver function tests, on PK exposure. Higher body
weight and type I IFN test high
patients were found to have significantly higher clearance (CL) and lower
concentrations. However,
surprisingly there was no clinically relevant impact of these covariates on
efficacy and safety. Surprisingly,
other covariates pertaining to specific populations evaluated in population PK
modeling were not found to
be significant including race/ethnicity/region, age, gender, renal/hepatic
function tests, standard of care
therapy (e.g., OCS, anti-malarial, azathioprine, methotrexate, mycophenolate
mofetil, mycophenolic acid,
mizoribine, and NSAIDs), and commonly used medications in SLE patients (ACE
inhibitors and HMG-CoA
reductase inhibitors).
10.3. Conclusion
[0246] The present inventors have demonstrated that an anifrolumab dose of
<150 mg QW and >105 mg
QW will provide at least similar or even a higher Cave over 52 weeks to that
of 300 mg IV Q4W. A 120 mg
SC QW dose will particularly provide an efficacy at least equivalent to that
demonstrated for a 300 mg IV
Q4W dose in LN and SLE patients. It is further plausibly demonstrated that a
120 mg SC QW dose will
provide an efficacy greater than that demonstrated for a 300 mg IV Q4W dose.
[0247] A dosing regimen of 900 mg anifrolumab IV Q4W for 6 doses followed by
120 mg anifrolumab SC
QW was thus selected based on a combination of PK/PD data and modelling of
data from the Phase ll LN
study (Study 07, see Section 8. and Table 8) and data from the anifrolumab IV
and SC clinical program in
SLE as described Section 10.2.
[0248] Study 07, assessed 2 dosing regimens: a basic regimen using the
proposed dose for SLE patients
(300 mg IV Q4VV) and an intensified regimen, which commenced with 3 doses of
900 mg IV Q4W followed
by 300 mg IV Q4W for the remainder of the study. The intensified regimen
showed results suggesting a
greater treatment benefit over the basic regimen.
[0249] However, the exposure in the initial phase 300 mg IV Q4W of both
regimens was suboptimal when
compared with the 300 mg IV Q4W dose in SLE without active renal disease.
Therefore, a more intensive
72
CA 03216395 2023-10-10
WO 2022/223771 PCT/EP2022/060670
dosing regimen was selected, with an initial dose of 900 mg IV Q4W for 6
doses, followed by 120 mg SC
QW or 300 mg IV Q4W. This regimen will provide sustained anifrolumab
exposure/PD suppression and
improved UPCR outcome compared with the previously evaluated dose regimens in
study 07. The 120 mg
Sc QW dose will provide at least similar or non-inferior exposure and PD
suppression to that of 300 mg IV
Q4W in patients with LN.
[0250] In summary, the primary objective of study 07 was to evaluate the
efficacy of anifrolumab as
assessed by 2 different dosing regimens in addition to standard therapy,
measured by the relative difference
between the combined anifrolumab treatment group and the placebo group in the
change from baseline to
Week 52 in 24-hour UPCR. The study did not meet this primary endpoint, but the
results showed efficacy
of the intensified anifrolumab dosing regimen compared with placebo across a
range of clinically meaningful
endpoints including CRR at Week 52 and sustained OCS tapering. In contrast,
anifrolumab exposure was
suboptimal with basic dosing regimen due to higher clearance associated with
proteinuria in LN.
[0251] The IV route of administration has primarily been used in the
anifrolumab clinical program in SLE
without active renal disease, but a more convenient SC route of administration
is also being developed.
Both the IV and SC routes of administration have been shown to be safe and
well tolerated in the
anifrolumab clinical development program in patients with SLE (IV and SC) and
in LN (IV). The SC route of
administration using aPFS for anifrolumab is expected to provide increased
convenience and dosing
flexibility and reduced exposure to infection risk related to clinic visits
for dosing (including but not limited
to influenza or COVID-19) for patients and/or caregivers and to improve
treatment accessibility and
compliance compared to IV dosing.
11. EXAMPLE 5: Selection of dosage regime for lupus nephritis
11.1. Introduction
[0252] Study 07 did not meet its primary and secondary endpoints for the
combined anifrolumab dosing
regimens compared with placebo, but the efficacy results for the intensified
dosing regimen plausibly
indicated a clinical benefit with an acceptable safety profile. By contrast,
the basic dosing regimen, whilst
providing a treatment effect, resulted in suboptimal anifrolumab exposure in
patients with active proliferative
LN as compared with SLE without active renal disease.
[0253] An aim of study 07 was to achieve the same exposure to anifrolumab as
for the proposed dose of
300 mg IV Q4W for SLE without active renal disease. Study 07 (NCT02547922,
Section 8) assessed 2
anifrolumab dosing regimens: a basic regimen using the proposed dose for SLE
patients (300 mg IV Q4VV)
and an intensified regimen, which commenced with 3 doses of 900 mg IV Q4W
followed by 300 mg IV Q4W
for the remainder of the study. As described in Section 8, the intensified
regimen showed results suggesting
a greater treatment benefit over the basic regimen. However, the exposure in
both regimens was
suboptimal when compared with the 300 mg IV Q4W dose in SLE without active
renal disease (Figure 13
and Figure 14).
73
CA 03216395 2023-10-10
WO 2022/223771 PCT/EP2022/060670
11.1.1. Pharmacokinetics
[0254] Anifrolumab binds to IFN-aR1 with high specificity and affinity and
prevents the formation of a
complex with IFN-aR2, leading to blockade of downstream signaling activities.
The antibody-receptor
complex is then rapidly internalized. Thus, the PK of anifrolumab exhibits
target receptor-mediated
clearance, with a more rapid clearance observed at lower concentration levels.
[0255] In study 07, consistent with earlier findings, nonlinear PK was
observed between patients in the
basic regimen (300 mg IV Q4VV) and patients in the intensified regimen (900 mg
IV Q4W for the first 3
doses followed by 300 mg IV Q4VV), all with active, proliferative LN. However,
lower concentrations were
observed during the maintenance phase of 300 mg IV Q4W in both the basic and
intensified regimens
compared with those of SLE (Figure 13 and Figure 14).
[0256] Initial population PK analysis of data from LN patients in study 07,
revealed a higher typical
clearance of anifrolumab in LN patients than that of SLE patients, 0.245 Uday
versus 0.193 LA:lay. In
addition to the previously identified covariates, patients with lower baseline
albumin and higher UPCR 24-
hour measurements had higher clearance. Prior to the subsequent addition of a
time-dependent UPCR
covariate, the initial model showed that the patients with larger decrease in
clearance over time showed
greater improvement of UPCR (Figure 28A and Figure 28B).
[0257] The change in clearance was estimated via a sigmoidal time-dependent
function that was multiplied
with the linear clearance of the final model presented in Section 3.5.
Equation 4 CL= Onexp (TMAX-time) f (X)encL
TCSO+time
Where:
On is typical clearance,
f (X) is covariate model X;
lin is inter-subject variability of clearance;
T MAX is the maximal possible change in the log of clearance; and
TC50 is the time to reach half the maximal change in log clearance.
11.1.2. Pharmacodynamics
[0258] Anifrolumab targets the IFN pathway. To follow the biologic effect of
anifrolumab on its target, a
21-gene assay was used to measure the expression of type I IFN-inducible genes
in whole blood in both
SLE and LN studies. Type I IFN gene signature test-low patients do not have
elevated gene signature, so
neutralization of the type I IFN PD signature is relevant for test-high
patients only. In studies 1013, 04, and
05, in SLE patients, treatment with a 300 mg Q4W anifrolumab dose resulted in
a rapid and sustained
neutralization of type I IFN 21-gene signature of larger than 80% (Figure 18).
[0259] For patients with LN, both the BR and IR showed a rapid and pronounced
neutralization of the type
I IFN PD signature following the first dose of anifrolumab, in common with the
SLE patients who received
74
CA 03216395 2023-10-10
WO 2022/223771 PCT/EP2022/060670
300 mg dose. The patients in the intensified regimen maintained a 80% median
neutralization of the
type I IFN PD signature across all study visits to Week 52 as per the SLE
patients, but lower PD suppression
was observed in patients from basic regimen (Figure 8). LN patients with high
proteinuria had higher
anifrolumab clearance. Thus, a numerically lower PD suppression was observed
in the patients with high
proteinuria, baseline UPCR > 3 mg/mg, that received basic regimen (300 mg IV
Q4VV), compared with that
in intensified regimen (900 mg IV Q4W for the first 3 doses followed by 300 mg
IV Q4VV) (Figure 29A).
Furthermore, for the patients with high proteinuria that were able to attain
an approximate PD suppression
of > 90%, a much larger UPCR improvement was observed (Figure 29B). This
suggests a higher PD
suppression as a result of higher dose could improve the likelihood of UPCR
outcome.
11.1.3. Pharmacokinetics/Pharmacodynamics relationship
[0260] A longitudinal population model was developed to characterize the
relationship between
anifrolumab PK and UPCR in LN patients. Anifrolumab was found to improve
proteinuria in an exposure-
dependent manner, and the improvement in proteinuria was, in turn, found to
lower the anifrolumab
clearance. After completion of the PK-UPCR model, a dropout model was
developed sequentially, and was
integrated with the PK-UPCR model. The resulting PK-UPCR dropout model was
used for simulation to
evaluate different doses and dosing regimens. The UPCR and treatment
discontinuation are variables of
particular interest since these are the 2 major drivers of the CRR endpoint.
11.1.3.1. PK-UPCR model
[0261] The UPCR dynamics model was described by a modified turnover model
defined by the differential
equation:
Equation 5 du(t) _ x log2 x
Where:
U(t) is the time-dependent UPCR;
Ea(t) is the time-dependent effect of anifrolumab on the UPCR dynamics;
k a characteristic time parameter;
Es. the constant effect of standard of care treatment on the UPCR
dynamics;
Ub is the baseline UPCR; and
x is a shape parameter.
[0262] The shape parameter x introduces flexibility that allows the UPCR
dynamics to deviate from a
perfect exponential behavior. The time-dependent effect of anifrolumab on the
UPCR dynamics was further
defined as:
Equation 6 Ea(t) =1+ a x c (t)
Where:
CA 03216395 2023-10-10
WO 2022/223771 PCT/EP2022/060670
a is a parameter determining the strength of the time-dependent effect of
anifrolumab on the UPCR dynamics; and
c(t) is the anifrolumab serum concentration measured in nM.
[0263] A parameter scaling factor was introduced into Equation 6t0 avoid a
small value of the parameter
a. When x = 1, and in the absence of anifrolumab so that Ea(t) = 1, the
parameter k becomes the half-
life of the equilibration process of U(t). Thus, according to this model, the
effect of anifrolumab can be
interpreted as the decrease of the UPCR equilibration half-life, or, when x #
1, the decrease of a more
general characteristic time for onset of effect. An additional effect of
anifrolumab on the UPCR steady state,
i.e., modulating the term ((1 ¨ Es) x Ub)x, was explored but did not improve
the model significantly.
[0264] Lognormal inter-individual variability was defined for the parameters
k, 14, and the standard
deviation of the residual error. The inter-individual variability for Es was
defined according to Es = 1 ¨
(1 ¨ EsTv)e, where EsTv is the typical value of Es and 7.7 is a random effect
parameter. This maneuver
effectively makes (1 ¨ Es) log normal but has the purpose of having parameter
Es in the model with the
interpretation of reduction of the UPCR baseline due standard of care
treatment.
[0265] The PK part of the PK-UPCR model was based a population PK model in
patients with SLE, but
with the following changes. The parameters Q and Kss were fixed to previously
estimated values due to the
relatively more limited and sparse PK data in LN patients compared with the
pooled PK data in SLE patients.
In addition, inter-individual variability of the parameter V2 was omitted.
Finally, and most importantly, the
anifrolumab linear clearance was redefined to include a dependence on the time-
dependent model state
variable describing UPCR, U(t), according to:
Equation 7 CL = CLTv x F 1FN X FwT X FupcR X ell
[0266] Here, CLTv is the typical value of the clearance and 7.7 is a random
effect parameter. The factor FIFN
is capturing the effect of the IFN test on clearance, with FIFN = 1 for IFN
high patients and FIFN = - - CL
IFNLOW
for IFN low patients, where CLIFNLOW is parameter to be estimated. The factor
FwT is capturing the effect of
body weight on clearance according to:
BW)CL WT
Equation 8 FwT = (¨
63.1
Where:
CLwT is a parameter to be estimated; and
the reference value 63.1 is the median body weight in study 07.
[0267] Fupc=R is capturing the time-dependent change in clearance due to UPCR
dynamics, according to:
Equation 9 FUPCR = 1 + CLupcR x (U(t)¨ 2.53)
76
CA 03216395 2023-10-10
WO 2022/223771 PCT/EP2022/060670
Where:
CLupcp is a parameter to be estimated; and
the reference value 2.53 is the observed median UPCR baseline.
[0268] The interpretation of the parameter CLupcp is the relative change in
anifrolumab clearance per
mg/mg change in UPCR.
[0269] A significant effect of anifrolumab on the onset of UPCR improvement
was estimated (a = 1.11, Cl
0.251-2.50). Furthermore, it was estimated that each mg/mg reduction in UPCR
would result in a 21.0%
(Cl 18.9 ¨23.0) decrease of the linear anifrolumab clearance, using the median
observed UPCR baseline
as a reference. The PK-UPCR model adequately described the UPCR and PK data,
as assessed by
dropout-corrected visual predictive check plots (Figure 30 and Figure 31).
11.2. Dropout model
[0270] After developing the PK-UPCR model, its population parameters were
fixed and the model was
expanded to account for dropout based on a time to event analysis. The purpose
of this analysis was to
identify whether anifrolumab exposure as such, or its impact on UPCR, could be
associated with the risk of
discontinuation. The following proportional hazards model was developed:
((f3K)xc(t)-FiquPcRxti(t))
Equation 10 )30/365) x e 103
Where:
/30 is the constant base hazard; and
/3pK and 8
LIPCR are parameters describing the association of risk with the
time-dependent concentrations of anifrolumab and UPCR.
[0271] Parameter scaling factors were introduced to avoid small values of the
parameters A0 and /3pK.
[0272] The parameter estimates of the dropout model are shown in Table 26.
This model adequately
described the dropout data (Figure 32). The dropout model suggested that
patients with higher UPCR
levels, as well as lower average anifrolumab concentration, were significantly
more likely to discontinue
from the treatment.
Table 26: Parameter estimates of the PK-UPCR dropout model
Parameter Unit Point estimate 95% confidence
interval
Constant base hazard, flo 1/year 0.253 0.0978 to
0.496
Association to anifrolumab 1/pM -4.94 -10.7 to -2.05
concentration, igpi(
Association to UPCR mg/mg 0.304 0.128 0.595
concentration, /3,K
PK, pharmacokinetic; UPCR, urine protein-creatinine ratio
77
CA 03216395 2023-10-10
WO 2022/223771 PCT/EP2022/060670
11.2.1. Simulations with the PK-UPCR-dropout model
[0273] The PK-UPCR-dropout model was used to simulate different dosing
regimens. For each simulated
scenario, the placebo-adjusted proportion of UPCR responders was computed as a
function of time. A
UPCR responder was defined as patient with UPCR 24-hour 0.5 mg/mg and not
discontinued from
treatment.
[0274] First, the impact of extending the intensified treatment period beyond
three 900 mg doses was
simulated. The PK-UPCR-dropout model found that increasing the duration of the
intensified phase of 900
mg doses to 24 weeks (six doses), from the 12 weeks (three doses) in used in
study 07, would speed up
the early onset of response with respect to placebo, and maintain that
response until Week 52 (Figure 33).
A further extension of the intensive phase to 36 or 52 weeks (nine or 13
doses) was however projected to
only result in an incremental benefit per additional dose.
[0275] Second, a more detailed simulation was performed for the proposed
regimen of an initial dose of
900 mg IV Q4W for 6 doses, followed by 120 mg SC QW (Figure 34). On top of the
PK-UPCR-dropout
model explained above, a previously developed model for the gene signature PD
marker in SLE was
incorporated to the model. The simulation shows that the initial 900 mg doses
are driving a reduction of
UPCR and thereby also a reduction of anifrolumab clearance. The largest part
of the change in clearance
occurs in the first half year and is reflected back in the PK profile, which
is showing a gradual increase in
concentration during this period. The weekly dosing after the switch from IV
to SC administration at Week
24 provides a sustained exposure that is resulting in a sustained PD
suppression. The median PD
suppression is projected to be greater than 90% and more than 9 out of 10
patients are projected to have
a PD suppression greater than 80%.
11.3. Subcutaneous loading dose for lupus nephritis
[0276] As described in above, an anifrolumab dosage regime of 900 mg IV Q4
loading dose (x3) followed
by 300 mg IV Q4 has demonstrated efficacy in lupus nephritis patients. A
intensified phase of 900 mg (x6)
followed by 300 mg IV Q4 is expected from PK/PD modelling to provide
additional benefit. Based on the
analysis above (see Section 10), the 300 mg IV dose for lupus nephritis may be
substituted with a
subcutaneous dose of greater than 105 mg and less than 150 mg QW, and
optionally with a subcutaneous
dose of 120 mg QW. Particularly, given 120 mg SC will provide similar exposure
and is expected to be
efficacious in SLE, a dose of 120 mg SC QW after the intensified phase in LN
is expected to provide at
least similar efficacy to the 300 mg IV dose in lupus nephritis patients.
[0277] It would also be advantageous for the loading dose for LN to be
provided to the patient by
subcutaneous delivery. The inventors employed modelling techniques to
determine the subcutaneous dose
corresponding to the 900 mg IV dose of anifrolumab in lupus nephritis
patients. Based on the modelling
described above for the PK/PD of anifrolumab in LN patients from study 07, a
dose of about 1150 mg was
78
CA 03216395 2023-10-10
WO 2022/223771 PCT/EP2022/060670
found to provide a similar AUC to 900 mg IV in healthy volunteers (Figure 35).
The predicted subcutaneous
to IV for AUCo_inf and Ctrough are shown in Figure 36.
Table 27: Predicted SC to IV ratio for AUCot and Ctrough
Bioavailability AUCO-inf Ctrough (week 4)
70 0.84 0.98
81 1.02 1.17
85 1.09 1.25
[0278] 1150 mg SC was also found to provide similar AUC to 900 mg IV in LN
patients (Figure 36). To
take account of volume constraints of a 150 mg/ml anifrolumab formulation
(e.g. the need to round the
volume to the nearest 101h of a ml), a dose of 1155 mg Sc anifrolumab may be
used for practical reasons,
and assumed to be equivalent to a 1150 mg dose.
11.4. Conclusion
[0279] A population model was developed based on study 07 data of longitudinal
anifrolumab exposure,
proteinuria (UPCR) levels, and IP discontinuation (dropout). Simulations with
this model suggested that
increasing the number of initial 900 mg IV Q4W doses from 3 to 6 doses would
result in a faster onset of
renal response as assessed by a decrease in UPCR. In addition, the model also
projected slightly lower
discontinuation rates for the proposed regimen of 6 initial IV Q4W doses of
anifrolumab as compared with
the intensified and basic dosing regimens studied in study 07. The projected
lower likelihood of
discontinuation of treatment could be due to better improvement in UPCR and
renal inflammation.
[0280] The inventors thus proposed a more intensive dosing regimen than study
07 of an initial dose of
900 mg IV Q4W for 6 doses (or about 1150 mg SC), followed by 300 mg IV Q4W (or
120 mg SC QW) in
patients with active, proliferative LN. This regimen is projected to provide
sustained anifrolumab
exposure/PD suppression, and improved UPCR outcome compared with the
previously evaluated dose
regimens in study 07 in patients with active, proliferative LN. The proposed
1150 mg SC and 120 mg SC
QW in patients with LN will provide at least similar or non-inferior exposure
and PD suppression to that of
900 mg IV Q4W and 300 mg IV Q4W respectively. The doses of the invention are
summarized in Table 28
and Table 29.
Table 28: Lupus nephritis doses for BR
Administration route Dose (mg) Frequency
lower limit 150 Q4W
IV selected 300 Q4W
upper limit 1000 Q4W
lower limit 105 QW
Sc selected 120 QW
upper limit 150 QW
79
CA 03216395 2023-10-10
WO 2022/223771 PCT/EP2022/060670
Table 29: Lupus nephritis doses for IR
Administration route Dose (mg) Frequency Dose no.
lower limit 900 Q4W 3
IV selected 900 Q4W 6
upper limit 1000 Q4W 6
lower limit 1150 Q4W 3
About 1150
SC selected
(e.g. 1155) Q4W 6
Optional upper
1155 Q4W 6
limit
[0281] The subcutaneous and intravenous dosage regimes of anifrolumab for the
treatment of LN are
interchangeable. A SC IR regime may be followed by an IV BR regime. Similarly,
an IV IR may be followed
by a SC BR.
12. EXAMPLE 6: LN urinary proteomics reveals common biological pathways
identified by distinct
disease measures
12.1. Background
[0282] LN is a severe consequence of SLE and there is a huge unmet need for
discovery of urine protein
biomarkers that provide non-invasive surrogates of disease activity and
response to therapy. The purpose
of this study was to measure protein biomarkers in urine samples from a
diverse cohort of LN patients and
to assess their correlations with patient demographics and clinical
characteristics including the renal
measures of estimated glomerular filtration rate (eGFR), SLEDAI-renal (SLEDAI-
R) and National Institutes
of Health Activity (NIH-Al) and chronicity (NIH-CI) indices.
12.2. Aim
[0283] To measure protein biomarkers in urine samples from a diverse cohort of
LN patients and to assess
correlations between the biomarkers and patient demographics and clinical
characteristics.
12.3. Methods
[0284] The demographics and characteristics of the cohort of 112 patients is
described in Table 30. All
patients fulfilled the 1997 ACR criteria for SLE and all had biopsy-proven LN.
Urine samples from patients
and 16 healthy donors (HD) were analyzed for 192 proteins by Luminex and 5 by
SimoaTM. Protein
concentrations were normalized to urinary creatinine levels. Log-
concentrations of each protein was
assessed for correlation with each clinical feature using linear regression
adjusted forage, gender, ethnicity,
disease duration, and treatment. eGFR was assessed using the cutoff of >60.
The Benjamini-Hochberg
procedure was used to calculate false discovery rates, with a cut-off of 0.1
used to determine significance.
CA 03216395 2023-10-10
WO 2022/223771 PCT/EP2022/060670
Statistical significance of intersections of protein lists was assessed via
permutation. Pathway assessments
were conducted using Ingenuity core analysis.
12.4. Results
12.4.1. Summary
[0285] Pre-filtering proteins for LN normalized mean concentrations to be
greater than the HD mean + 1.5
SD yielded 97 distinct upregulated proteins. The largest numbers of protein-
outcome associations were
confounded by age (but not disease duration), gender, and MMF dose. After
removing the influence of all
confounders, numerous proteins showed statistically significant differential
expression with respect to
eGFR, SLEDAI-2K, SLEDAI-R, serum C3 and C4, NIH-Al, and NIH-Cl. Conversely, no
proteins were
significantly correlated with LN class, race, or SDI (SLICC/ACR disease
Index). The highest numbers of
significant proteins were found for eGFR (55 proteins) followed by SLEDAI-R
(36) and NIH-Al (20). There
was a significant overlap of 11 proteins (Table 31) across these three lists
(intersection p=4.1 x 10⁻⁵),
indicating that these clinical renal measures share common biological
processes. Pathway analysis of the
11 common proteins indicated enrichment for functions known to be associated
with fatty acid/lipid
metabolism, cardiovascular disease, cellular trafficking and immune cell
infiltration.
12.4.2. Proteomic Urinary Biomarkers Upregulated in LN
[0286] Of the 197 proteins assessed, 97 were distinctly upregulated in LN
patients compared with healthy
donors. Of the five proteins analyzed by Simoa, three (BLC, IL-1[3 and IL-6)
were detectable in >70% of
patients and dysregulated in LN.
12.4.3. Association With Demographics and Clinical Characteristics
[0287] The strongest confounders of protein-outcome associations were age (but
not disease duration),
sex, and MMF dosage. Adjustment for oral corticosteroid dose, angiotensin-
converting enzyme inhibitor,
and angiotensin receptor blocker made no substantive difference to any of the
associations presented. No
proteins were significantly correlated with LN class, race, or SDI. After
controlling for the influence of all
confounders, numerous proteins showed significant differential expression with
respect to eGFR, SLEDAI-
2K, SLEDAI-R, serum C3 and C4, NIH-Al, NIH-CI, and the IFNGS.
/2.4.3./. C3 and C4
[0288] Many more proteins were associated with serum C4 than serum C3. Of the
4 proteins associated
with serum C3, C3, EN-RAGE, and IL-113 were also associated with serum C4.
Myeloperoxidase was
uniquely associated with serum C3, whereas 15 proteins including hemopexin
(Renal Activity Index for
Lupus [RAIL] biomarker), apolipoproteins, IL-6, APRIL, and CRP were unique to
serum C4.
81
CA 03216395 2023-10-10
WO 2022/223771 PCT/EP2022/060670
12.4.3.2. NIH-Al and NIH-CI:
[0289] Proteins associated with high NIH-Al or NIH-CI scores were largely
distinct (Figure 37A). 4 proteins
associated with both NIH-Al and NIH-CI were associated with cellular
senescence (cathepsin D, MCP-1)
and atherosclerotic risk (OPG, TIMP-1). Unique proteins (NIH-Al and NIH-C1)
were in the RAIL (adiponectin
and KIM-1) or associated with T-cell cytokines and apolipoproteins.
/2.4.3.3. ?4 clinical characteristics
[0290] Several proteins were associated with of the clinical
characteristics (Figure 37B).
/2.4.3.4. IFNGS
[0291] IFNGS associated significantly with inflammatory immune activator
proteins (EN-RAGE, ICAM-1,
VCAM-1); activation markers and cytokine activators of B cells (PEACAM-1,
BAFF); T cells, chemokines
and cytokines (RANTES, IP-10, IL-18); and innate cell activators (CD163, M-
CSF) (Figure 38A). Although
most associations were unique, IFNGS most commonly overlapped with SLEDAI-R.
12.4.3.5. eGFR, SLEDAI-R and NIH-Al
[0292] The most significant protein associations were found for eGFR (55
proteins) followed by SLEDAI-
R (36) and NIH-Al (20).
12.4.4. Proteins Overlapping With eGFR, SLEDAI-R, and High NIH-Al Score
[0293] 11 proteins associated with eGFR, SLEDAI-R, and NIH-Al overlapped
significantly (intersection
P=4.1 x10⁻⁵), indicating that these clinical renal measures share common
biological processes (Figure
38B). Of the 11 proteins common to eGFR, SLEDAI-R, and high NIH-Al score,
three were associated with
clinical characteristics: Apo B, Apo C-I, and LTF (Figure 37B). Pathway
analysis of the 11 common
proteins indicated enrichment for functions known to be associated with fatty
acid/lipid metabolism,
cardiovascular disease, cellular trafficking, and immune cell infiltration
(Figure 39A). Many of the disease
and molecular function categories and subcategories are associated with
vascular disease in SLE, including
lipid metabolism and cardiovascular disease, adhesion of immune cells,
accumulation of leukocytes, and
the degranulation of cells.
12.4.5. Unique Proteins Across All Clinical Features
[0294] Serum C3, C4, NIH-CI, and SLEDAI-2K did not associate with any proteins
that were unique. eGFR
had the most unique proteins, followed by IFNGS (Figure 39B). SLEDAI-R and NIH-
Al were associated
with two unique proteins
82
CA 03216395 2023-10-10
WO 2022/223771 PCT/EP2022/060670
12.5. Conclusions
[0295] By analyzing LN urinary proteomics, the inventors revealed that 3
clinical renal measures: eGFR,
SLEDAI-R and NIH-Al are commonly associated with various proteins and
pathways, most of which support
the emerging importance of renal vascular pathology in LN.
[0296] Luminex (192 proteins) and Simoa (5 proteins) can be successfully used
to measure dysregulated
urine protein in LN. This approach yields quantitative protein outcomes of
more than 100 proteins with no
special sample preparation and minimal sample volume. These results indicate
that multiple inflammatory
mediators and pathways contribute to LN pathophysiology. Three clinical renal
measures: eGFR, SLEDAI-
R, and NIH-Al were commonly associated with various LN proteins and pathways,
and may share common
biological processes. 11 proteins common to eGFR, SLEDAI-R, and NIH-Al were
associated with vascular
pathology in lupus, suggesting that alterations to renal vasculature may be
important to kidney damage in
LN. IFNGS was significantly associated with immune inflammatory pathways
including B-cell activation and
most commonly overlapped with SLEDAI-R associated proteins. Low serum C4 was
associated with more
dysregulated urine proteins than C3 despite a lower number of patients with
low serum C4. This suggests
serum C4 accumulates in the kidney in patients with low serum C4.
83
CA 03216395 2023-10-10
WO 2022/223771 PCT/EP2022/060670
Table 30: Demographics, treatment and disease characteristics
Demographics, treatment and disease characteristics
Age, years Median (range) 34.0
(18, 67)
Sex, n (%) Male 19
(17.0)
Race, n (%) Asian 18
(16.1)
Black/African American 7 (6.2)
American Indian/Alaska Native 2 (1.8)
Other 35
(31.2)
Native Hawaiian/Pacific Islander 1 (0.9)
White 49
(43.8)
Time from initial LN diagnosis, months Median (range) 8.3 (0,
307)
MMF before randomization, n (%) Yes 80
(71.4)
MMF Dosage, mg/day Mean (SD) 1.77
(0.46)
OCS Dosage, n (%) >20 mg/day 109
(97.3)
OCS Dosage, mg/day Mean (SD) 22.39
(10.71)
Concomitant ACEI/ARB treatment, n (%) Yes 81
(72.3)
Baseline 24-hour UPCR, mg/mg, Threshold, n (%) >3.0
46 (41.1)
Baseline 24-hour UPCR, mg/mg, Continuous Mean (SD) 3.34
(2.65)
Clinical outcomes
Baseline eGFR mUmin/1.73m2, Threshold, n (%) >60
86 (76.8)
Baseline eGFR mUmin/1.73m2, Continuous Mean (SD) 94.58
(42.86)
LN Class, n (%) Class ll 2 (2.0)
Class III 22
(21.8)
Class III and Class V 11
(10.9)
Class IV 59
(58.4)
Class IV and Class V 6 (5.9)
Class V 1(1.0)
SLEDAI-2K score, Continuous Mean (SD) 10.76
(4.74)
SLEDAI-R score, Continuous Mean (SD)
6.11(3.32)
SDI score, n (%) 0 70
(63.6)
1 29
(26.4)
2 9 (8.2)
3 1 (0.9)
84
CA 03216395 2023-10-10
WO 2022/223771 PCT/EP2022/060670
4 1 (0.9)
NIH Lupus Nephritis Activity Index, n (%) High (>8) 28
(27.7)
NIH Lupus Nephritis Chronicity Index, n (%) High(>4) 31
(30.7)
Serum 03, n (%) Low 03 75
(67.0)
Serum 04, n (%) Low 04 32
(28.6)
Table 31: 11 urinary proteins which reached statistical significance (false
discovery rate <0.1) for
association with eGFR, SLEDAI-R and NIH-Al
Urinary Protein
Adiponectin
Alpha-2-Macroglobulin (A2Macro)
Antithrombin-III (AT-III)
Apolipoprotein A-I (Apo A-I)
Apolipoprotein B (Apo B)
Apolipoprotein C-I (Apo C-I)
Apolipoprotein 0-Ill (Apo 0-Ill)
Fatty Acid-Binding Protein, heart (FABP, heart)
Lactoferrin (LTF)
Neuropilin-1
Omentin
Serum Amyloid P-Component (SAP)
von Willebrand Factor (vWF)
13. EXAMPLE 7: Delivery devices
[0297] Anifrolumab is administered by an injection device [1] [9] such as a
prefilled syringe (PFS) (Figure
40A) or an autoinjector (Al) (Figure 40B). Higher doses of anifrolumab may be
administered by an onboard-
delivery system.
13.1. Autoinjector
[0298] Anifrolumab may be administered by an autoinjector [1]. The
autoinjector is shown in exploded
view (Figure 41A) and in an assembled form (Figure 41B). A label [4] is
wrapped around and attached to
the autoinjector [1] (Figure 41C). The autoinjector has an autoinjector
housing [3], cap and cap remover
[2] and drive unit [5]. The liquid anifrolumab formulation unit dose [6] is
contained in the autoinjector housing
[3]. The unit dose [6] can be viewed through the viewing window [7].
CA 03216395 2023-10-10
WO 2022/223771 PCT/EP2022/060670
13.2. Accessorized pre-frilled syringe
[0299] Anifrolumab may be administered by accessorized pre-filled syringe
(APFS) [8]. The APFS [8]
includes the unit dose of anifrolumab [6] contained in a primary container [9]
shown in an assembled state
in Figure 42A and in an exploded view in Figure 42B. The primary container [9]
has a plunger stopper
[16]. The primary container has a nominal fill volume [17] of 0.8 ml but may
contain slightly more than 0.8
ml. The remainder of the space in the primary container [9] is taken up by an
air bubble [18]. The air bubble
[18] may have a size of 3-5mm, optionally, 4 mm. The primary container [9] has
a defined stopper position
[19].
[0300] The accessorized pre-filled syringe (APFS) primary container [9] is
provided in a PFS assembly [8]
including a needle guard [12], a finger flange [11] and a plunger rod [13]
(Figure 42C and Figure 42D). A
label [14] is provided with the primary container [9] in the PFS assembly [8].
The label [14] is wrapped
around the syringe [9] in the label placement position [15].
13.3. Packaging
[0301] The injection device [1] [8] is provided in a kit [20] (Figure 43). A
label [4] [14] is provided with the
APFS or autoinjector in the packaging. The label includes instruction for the
use of the injection device [1],
[8]. The packaging includes a tamper seal.
REFERENCES
All publications mentioned in the specification are herein incorporated by
reference.
[11 J. G. Hardy et al., Rheumatol. Oxf. Engl. 55, 252 (2016).
[2] E. C. Baechler et al., Proc. Natl. Acad. Sci. U. S. A. 100, 2610
(2003).
[31 J. J. Weening et al. , Kidney Int. 65, 521 (2004).
[4] N. Maroz and M. S. Segal, Am. J. Med. Sci. 346, 319 (2013).
[51 A. Fanouriakis et al., Ann. Rheum. Dis. 79, 713 (2020).
[6] E. M. Ginzler, A. J. Bollet, and E. A. Friedman, Annu. Rev. Med. 31,
463 (1980).
l71 H.-J. Anders et al., Nat. Rev. Dis. Primer 6, 7 (2020).
[8] R. Furie et al. , N. Engl. J. Med. (2020).
l91 C. Aniens et al., Ann. Rheum. Dis. 79, 172 (2020).
[10] B. H. Rovin et al., Kidney Int. 95, 219 (2019).
[11] R. Furie et al. , Arthritis Rheumatol. Hoboken Nj 69, 376 (2017).
[12] G. T. Ferguson et al. , J. Asthma Allergy 11,63 (2018).
[13] L. Peng et at, mAbs 7, 428 (2015).
[14] I. M. Bajerna et al., Kidney Int. 93, 789 (2018).
[15] A. S. Levey et al., Ann. Intern. Med. 150, 604 (2009).
[16] A. S. Levey et al., Ann. Intern. Med. 145, 247 (2006).
[17] B. H. Rovin et al., Lancet Lond. Engl. 397, 2070 (2021).
[18] M. Petri et al. , Arthritis Rheum. 58, 1784 (2008).
[19] R. Turrimala et al., Lupus Sci. Med. 5, e000252 (2018).
[20] ACR Meeting Abstracts (n.d.).
[21] B. W. Higgs et al. , Ann. Rheum. Dis. 73, 256 (2014).
[22] R. A. Furie et al. , Lancet Rheumatol. 1, e208 (2019).
[23] E. F. Morand et al. , N. Engl. J. Med. 382, 211 (2020).
[24] Y. Tanaka and R. Tummala, Mod. Rheumatol. 0, 1 (2020).
[25] B. Wang et al., Clin. Pharmacol. Ther. 93, 483 (2013).
[26] M. Aringer et al., Arthritis Rheumatol. Hoboken NJ 71, 1400 (2019).
[27] M. C. Hochberg, Arthritis Rheum. 40, 1725 (1997).
86
CA 03216395 2023-10-10
WO 2022/223771
PCT/EP2022/060670
[28] Y. Lin Chia et al. , Rheurnatol. Oxf. Engl. (2021).
[29] Y. Yao et al., Arthritis Res. Ther. 12, S6 (2010).
[30] D. D. Gladman, D. lbariez, and M. B. Urowitz, J. Rheumatol. 29, 288
(2002).
[31] M. Petri et al., Arthritis Rheum. 34, 937 (1991).
[32] Y. Yao et al., Hum. Genomics Proteomics HGP 2009, (2009).
[33] J. L. Gorriz and A. Martinez-Castelao, Transplant. Rev. Orlando Fla
26, 3 (2012).
[34] J. A. Moreno et al., Int. J. Mol. Sci. 20, (2019).
[35] J.-Y. Jung et al., Sci. Rep. 9, 9704 (2019).
[36] I. N. Bruce et al. , Lancet Rheurnatol. 0, (2020).
[37] J. T. Ryman and B. Meibohm, CPT Pharmacomet. Syst. Pharmacol. 6, 576
(2017).
87