Note: Descriptions are shown in the official language in which they were submitted.
CA 03219608 2023-11-08
WO 2023/277932 PCT/US2021/042039
DETECTION OF HUMAN LEUKOCYTE ANTIGEN LOSS OF HETEROZYGOSITY
CROSS-REFERENCE TO RELATED APPLICATIONS
[1] This application claims priority to U.S. Application No. 17/304,940,
filed June 28, 2021,
which is a Continuation-In-Part of U.S. Serial Application No. 16/789,413,
filed February 12,
2020, which claims priority to U.S. Provisional Patent Application No.
62/804,501, filed February
12, 2019, U.S. Provisional Patent Application No. 62/889,510, filed August 20,
2019, U.S.
Provisional Patent Application No. 62/932,090, filed November 7, 2019, and,
all of which are
hereby incorporated by reference in their entirety.
BACKGROUND
[1] The background description provided herein is for the purpose of
generally presenting
the context of the disclosure. Work of the presently named inventors, to the
extent it is
described in this background section, as well as aspects of the description
that may not
otherwise qualify as prior art at the time of filing, are neither expressly
nor impliedly admitted as
prior art against the present disclosure.
[2] Human Leukocyte Antigen Class I (HLA) proteins are expressed on the
surface of all
nucleated cells and are vital for immune surveillance. When tumor-specific
mutations
(neoantigens) are presented on HLA molecules to CD8+ T cells, this recognition
can drive
immune responses against the tumor and lead to tumor destruction. One
mechanism of immune
escape for tumors is loss of heterozygosity in HLA genes (HLA-LOH), which
reduces the total
number of neoantigens that can be presented to T cells. Due to the highly
polymorphic nature of
HLA, the copy number status of HLA genes is extremely challenging to assess by
standard
bioinformatics approaches.
SUMMARY
[3] In accordance with an example, a computer-implemented method of
detecting loss of
heterozygosity (LOH) of a human leukocyte antigen (HLA) gene in a subject, the
method
includes: obtaining HLA coverage feature metrics of a biological sample;
providing one or more
of the HLA coverage feature metrics to a three-class HLA loss of
heterozygosity (LOH)
modeling process trained to classify the biological sample as corresponding to
one of three LOH
classes, no LOH, partial LOH, or clonal LOH and determining the LOH class of
the sample and
determining, using the three-class HLA LOH modeling process, the LOH class for
the HLA
gene; and generating and storing a report of the determined LOH class for the
HLA gene.
1
CA 03219608 2023-11-08
WO 2023/277932 PCT/US2021/042039
[4] In an example, the three-class HLA LOH modeling process is a sequential
two stage
modeling process having a first LOH classifier model stage and a second LOH
classifier model
stage, wherein providing the one or more of the HLA coverage feature metrics
to the three-
class HLA LOH modeling process includes: providing at least one of the HLA
coverage feature
metrics to the first LOH classifier model and determining either no LOH or a
LOH for the
sample; and in response to determining LOH for the samples, providing at least
one of the HLA
coverage feature metrics to the second LOH classifier model stage and
determining the LOH
class as either partial LOH or clonal LOH for the sample.
[5] In an example, the one or more of the HLA coverage feature metrics
includes: read
depth of coverage of candidate HLA allele of the HLA gene; a ratio of a B
allele frequency (BAF)
of a stable allele in a tumor sample of the biological sample to the BAF of
the stable allele in a
normal sample of the biological sample; a difference between a log ratio
(logR) of coverage for
the stable allele between the tumor sample and the normal sample and a logR of
coverage of a
lost HLA allele of the HLA gene between the tumor sample and the normal
sample; tumor purity;
a ratio of a BAF of the lost allele in the tumor sample to the BAF of the lost
allele in the normal
sample; and a quotient of the observed logR difference minus the expected logR
difference
divided by the expected logR difference based on tumor purity.
[6] In an example, the observed logR difference is the difference between
the logR of
coverage of the stable allele and the logR of coverage of the lost allele.
[7] In an example, the observed logR difference is an average of
log(coverage in tumor /
coverage in normal), calculated for at least one nucleotide position in an HLA
gene.
[8] In an example, the log(coverage in tumor / coverage in normal) is
calculated for
nucleotide positions having a coverage of at least 40 sequence reads.
[9] In an example, the observed logR difference is an average of
log(coverage in tumor /
coverage in normal*match ratio), calculated for at least one nucleotide
position in an HLA gene,
wherein the match ratio is the ratio of the number of HLA reads in the normal
to number of HLA
reads in the tumor or the ratio of the number of unique reads in the normal
sample to the
number of unique reads in the tumor sample.
[10] In an example, log(coverage in tumor/coverage in normal * match ratio)
is calculated
for nucleotide positions having a coverage of at least 40 sequence reads.
2
CA 03219608 2023-11-08
WO 2023/277932 PCT/US2021/042039
[11] In an example, the observed logR difference is the cumulative area
between the logR
line associated with a first allele and the logR line associated with a second
allele.
[12] In an example, the expected logR difference is the log2(1-tumor
purity) and tumor purity
is a value between 0 and 1.
[13] In an example, the method further includes: for each gene, calculating
a ratio of a BAF of
a first allele in the tumor sample to the BAF of the first allele in the
normal sample and
calculating a ratio of a BAF of a second allele in the tumor sample to the BAF
of the second
allele in the normal sample; and comparing each ratio and selecting the allele
associated with
the lowest ratio as the allele that is more likely to be lost, before running
the modeling process.
[14] In an example, obtaining HLA coverage feature metrics of the
biological sample
includes: receiving next generation sequencing data generated from the
biological sample of the
subject; aligning the next generation sequencing data against a reference
genome to determine
a mapped reads dataset and an unmapped reads dataset; providing at least the
unmapped
reads dataset to an HLA typing process to identify at least one candidate HLA
allele for the HLA
gene; identifying a HLA sequence associated with each identified candidate HLA
allele; creating
a HLA reference genome using each identified HLA sequence; aligning the next
generation
sequencing data against the HLA reference genome and adjusting the HLA
reference genome
to account for a variant identified during the aligning; and aligning the next
generation
sequencing data against the adjusted HLA reference genome and, in response,
determining the
HLA coverage feature metrics associated with one or more identified candidate
HLA alleles.
[15] In an example, obtaining HLA coverage feature metrics of the
biological sample
includes: receiving normal next generation sequencing data generated from a
buffy coat
preparation of a blood sample of the subject; aligning the next generation
sequencing data
against a reference genome to determine a normal mapped reads dataset and a
normal
unmapped reads dataset; receiving tumor next generation sequencing data
generated from a
tumor specimen of the subject; providing at least a portion of the normal
unmapped reads
dataset to an HLA typing process to identify at least one candidate HLA allele
for the HLA gene;
identifying a HLA sequence associated with each identified candidate HLA
allele; creating a
HLA reference genome using each identified HLA sequence; aligning the normal
next
generation sequencing dataset against the HLA reference genome and adjusting
the HLA
reference genome to account for a variant identified during the aligning; and
aligning the normal
next generation sequencing dataset against the adjusted HLA reference genome
and aligning
the tumor next generation sequencing dataset against the adjusted HLA
reference genome to
3
CA 03219608 2023-11-08
WO 2023/277932 PCT/US2021/042039
determine the HLA coverage feature metrics associated with the identified
candidate HLA
alleles.
[16] In an example, determining the LOH class for the HLA gene includes
applying a logistic
regression model to the obtained HLA coverage feature metrics.
[17] In an example, the one or more of the HLA coverage feature metrics
includes: read
depth of coverage of a candidate allele of the HLA gene; a ratio of a B allele
frequency (BAF) of
a stable allele in a tumor sample of the biological sample to the BAF of the
stable allele in a
normal sample of the biological sample; a difference between a log ratio
(logR) of coverage for
the stable allele between the tumor sample and the normal sample and a logR of
coverage of a
lost HLA allele of the HLA gene between the tumor sample and the normal
sample; tumor purity;
a ratio of a BAF of the lost allele in the tumor sample to the BAF of the lost
allele in the normal
sample; and a quotient of the observed logR difference minus the expected logR
difference
divided by the expected logR difference based on tumor purity.
[18] In an example, the next generation sequencing data is generated using
short read
sequencing.
[19] In an example, a method for determining loss of heterozygosity for the
HLA-A, HLA-B,
and HLA-C genes, or for the HLA-E, HLA-F, and HLA-G genes, or for the DRA,
DRB1, DQA1,
DQB1, DPA1, and DPB1 genes uses, for each gene, methods herein.
[20] In an example, at least a portion of the reads data includes forward
reads from paired-
end reads.
[21] In an example, the HLA typing process applies an Optitype HLA typing
algorithm or a
Kourami HLA typing algorithm.
[22] In an example, the HLA reference genome further includes at least one
HLA
pseudogene sequence.
[23] In an example, providing at least a portion of the normal unmapped
reads dataset to the
HLA typing process to identify at least one candidate HLA allele for the HLA
gene includes
providing at least a portion of the normal unmapped reads dataset and a
portion of the normal
mapped reads dataset to the HLA typing process.
[24] In an example, aligning the tumor next generation sequencing dataset
against the
adjusted HLA reference genome to determine the HLA coverage feature metrics
includes
filtering the tumor next generation sequencing dataset.
4
CA 03219608 2023-11-08
WO 2023/277932 PCT/US2021/042039
[25] In an example, filtering the tumor next generation sequencing dataset
includes removing
reads that are not properly aligned, removing duplicate reads, and/or removing
a read based on
an edit distance associated with the read.
[26] In an example, the tumor specimen is a solid tumor specimen.
[27] In an example, the tumor specimen is a cell free DNA (cf DNA)
specimen.
[28] In an example, the tumor specimen is a lung tumor specimen, a
metastatic specimen, a
colorectal tumor specimen, or a pancreatic tumor specimen.
[29] In an example, the method is implemented on one or more microservices.
[30] In an example, the method further includes: for the biological sample
containing cancer,
when it is determined that the biological sample has an LOH class of no LOH in
the HLA gene,
treating the cancer by administering a checkpoint inhibitor therapy to the
subject.
[31] In an example, the checkpoint inhibitor therapy is selected from the
group consisting of
an anti-CTLA-4 therapy, an anti-PD-1 therapy, and an anti-PD-L1 therapy.
[32] In an example, the biological sample is selected from the group
consisting of a tumor
specimen and a buffy coat preparation.
BRIEF DESCRIPTION OF THE DRAWINGS
[33] The figures described below depict various aspects of the system and
methods
disclosed herein. It should be understood that each figure depicts an
embodiment of a particular
aspect of the disclosed system and methods, and that each of the figures is
intended to accord
with a possible embodiment thereof. Further, wherever possible, the following
description refers
to the reference numerals included in the following figures, in which features
depicted in multiple
figures are designated with consistent reference numerals.
[34] This patent or application file contains at least one drawing executed
in color. Copies of
this patent or patent application publication with color drawing(s) will be
provided by the United
States Patent and Trademark Office upon request and payment of the necessary
fee.
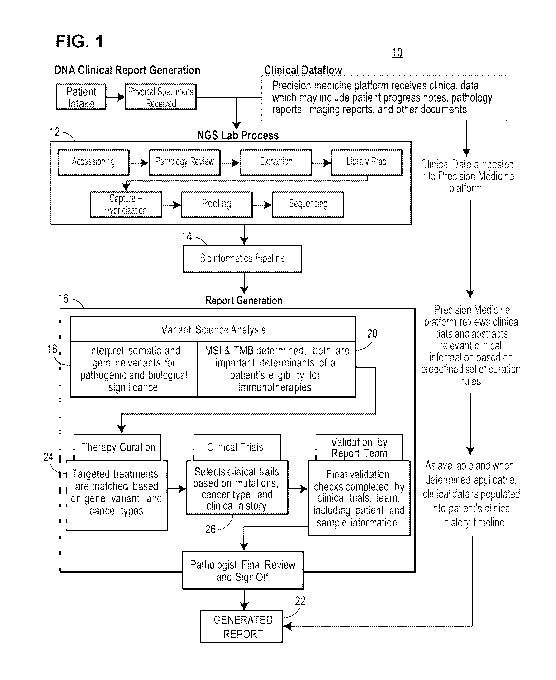
[35] FIG. 1 illustrates an example workflow 10 for next generation
sequencing, bioinformatics
processing, and report generation, in an example.
[36] FIG. 2 illustrates a schematic of an example process for Human
Leukocyte Antigen
Class I (HLA) detection and analysis.
CA 03219608 2023-11-08
WO 2023/277932 PCT/US2021/042039
[37] FIG. 3 illustrates an example process schematic for data flow for an
HLA typing model
and a loss of heterozygosity (LOH) in HLA genes (LOH) model (collectively the
HLA and HLA-
LOH model).
[38] FIG. 4 illustrates an example HLA typing report, generated in an
example.
[39] FIGS. 5A, 5B, and 50 collectively illustrate plots of coverage metrics
calculated for
different examples of the techniques herein, some in comparison to non-
technique examples,
and some without the filter steps. For example, FIG. 5A shows data that were
calculated using
all disclosed steps and features, FIG. 5B shows data calculated without
aligning
discarded/unmapped reads to HLA genes, and FIG. 50 shows data calculated
without replacing
the HLA reference sequences with the variants detected in the sequence data
generated by the
patient sample. Light colors (lighter blue and lighter red) indicate areas of
low coverage and
black dots indicate positions where the sequences of the two alleles diverge
from one another.
[40] FIG. 6 illustrates an example shallow decision tree showing the use of
coverage metrics
to predict HLA-LOH.
[41] FIGS. 7A and 7B collectively illustrate the results of an optional
biological assay used to
validate the predictions of the HLA and LOH model.
[42] FIGS. 8A, 8B, and 80 collectively illustrate coverage metrics plots
calculated by the
methods disclosed herein for different types of tissues. In this example, FIG.
8A shows
coverage data calculated for the non-cancer sample. FIG. 8B shows coverage
data calculated
for the cancer sample tissue extracted from the same patient as the non-cancer
sample. FIG.
80 shows coverage data for a tumor organoid derived from the cancer sample
tissue.
[43] FIGS. 9A, 9B, 90, and 9D collectively illustrate how various model
features lead to more
robust alignments and less noisy signal for downstream analysis by comparing
plots of
coverage metrics calculated for different examples of the techniques herein
with coverage
metrics calculated for non-technique examples, and some without the filter
steps.
[44] FIG. 10 illustrates an example system for HLA and HLA-LOH analysis
that may be
implemented on a network accessible processing system for performing the
processes
described herein.
[45] FIG. 11 illustrates how HLA-LOH can potentially lead to escape of
immune pressure.
[46] FIG. 12 illustrates relative differences in allele coverage metrics
calculated in order to
detect HLA-LOH, including B allele frequencies (BAF) and Log Coverage ratios,
between the
6
CA 03219608 2023-11-08
WO 2023/277932 PCT/US2021/042039
Tumor and Normal sample. The cancer specimen analyzed for these results
represents a
strong HLA-LOH. The allele predicted to have been lost and the allele
predicted to be stable
are highlighted in red and blue, respectively. Light colors (light blue and
light red) indicate areas
of low coverage and black dots indicate positions where the sequences of the
two alleles
diverge from one another.
[47] FIG. 13 is a table showing the percent and number of samples in the xT
500 cohort
predicted to have HLA-LOH by the model, categorized by cancer type.
[48] FIG. 14 illustrates predicted HLA-LOH status among all samples in the
xT 500 cohort.
Each column represents a sample, with the LOH status of each HLA gene (HLA-A,
HLA-B, or
HLA-C as denoted by the y-axis label) shown as Predicted LOH (red), Predicted
Stable (blue),
or Homozygous (grey).
[49] FIG. 15 illustrates the association or lack of association between
Tumor Mutational
Burden (TMB) and LOH status. These charts compare the log normalized TMB
between
samples with no HLA-LOH (blue) and predicted HLA-LOH (red). Significance was
determined
by Student's T test.
[50] FIG. 16 is a schematic of an example process for determining HLA LOH
status in a
three-class classification process having two classification stages.
[51] FIG. 17 is a schematic of an example HLA LOH classification stage of
FIG. 16.
[52] FIG. 18 illustrates normal sample plots of (i) read coverage (number
of reads) on the y-
axis for two different alleles (B*44:02 (red data points) and B*07:02 (blue
data points)) as a
function of nucleotide position, (ii) BAF for the two different alleles as a
function of nucleotide
position, and (iii) Log Ratio of read coverage in the tumor sample to the read
coverage in the
normal sample as a function of nucleotide position.
[53] FIG. 19 illustrates tumor sample plots of (i) read coverage (number of
reads) on the y-
axis for two different alleles (B*44:02 (red data points) and B*07:02 (blue
data points)) as a
function of nucleotide position, (ii) BAF for the two different alleles as a
function of nucleotide
position, and (iii) Difference between Log Ratio of the two different alleles
as a function of
nucleotide position, illustrating a partial LOH example.
[54] FIG. 20 illustrates normal and tumor sample plots of (i) read coverage
(number of reads)
on the y-axis for two different alleles (B*44:02 (red data points) and B*07:02
(blue data points))
as a function of nucleotide position, (ii) Log Ratio of read coverage in the
tumor sample to the
7
CA 03219608 2023-11-08
WO 2023/277932 PCT/US2021/042039
read coverage in the normal sample as a function of nucleotide position, and
(iii) Difference
between Log Ratio of the two different alleles as a function of nucleotide
position, illustrating a
clonal LOH example.
DETAILED DESCRIPTION
Definitions
[55] "Pseudogene" means a non-functional HLA gene (for example, HLA-Y) and/or
an HLA
gene that isn't expressed. HLA pseudogenes may not impact a patient's health,
immune
system activity and/or control of cancer cells, but these pseudogenes may have
genetic
sequences that are similar to the genetic sequences of functional HLA genes,
such that
sequence reads from HLA pseudogenes could potentially align to functional HLA
genes.
[56] "Genetic analyzer" means a device, system, and/or methods for
determining the
characteristics (including sequences) of nucleic acid molecules (including
DNA, RNA, etc.)
present in biological specimens (including tumors, biopsies, tumor organoids,
blood samples,
saliva samples, or other tissues or fluids).
[57] "Targeted Panel" means a combination of probes for next-generation
sequencing of a
patient's biological specimens (including tumors, biopsies, tumor organoids,
blood samples,
saliva samples, or other tissues or fluids) which are selected to map one or
more loci on one or
more chromosomes.
[58] "Sequencing probe" means a collection of chemicals which attach to a
locus of a
chromosome based on the expected sequence of nucleotides at the RNA or DNA
present at
that locus.
[59] "RNA read count" means the read counts of RNA or cDNA generated from a
genetic
analyzer.
[60] "Bioinformatics pipeline" means a series of processing stages of a
pipeline to instantiate
bioinformatics reporting regarding next-generation sequencing results of a
patient's tumor or
normal tissue or bodily fluids to extract and report on variants present in
the patient's genome.
[61] "Genetic profile" means a combination of one or more variants, RNA
transcriptomes, or
other informative genetic characteristics determined for a patient from next-
generation
sequencing.
[62] "Genetic sequence" means a recordation of a series of nucleotides
present in a patient's
RNA or DNA as determined from sequencing the patient's tissue or fluids.
8
CA 03219608 2023-11-08
WO 2023/277932 PCT/US2021/042039
[63] "Variant" means a difference in a genetic sequence or genetic profile
when compared to
a reference genetic sequence or expected genetic profile.
[64] "Expression level" means the number of copies of an RNA or protein
molecule
generated by a gene or other genetic locus, which may be defined by a
chromosomal location
or other genetic mapping indicator.
[65] "Gene product" means a molecule (including a protein or RNA molecule)
generated by
the manipulation (including transcription) of the gene or other genetic locus,
which may be
defined by a chromosomal location or other genetic mapping indicator.
[66] DNA Next-Generation Sequencing (NGS) revolutionized genomic research;
yet, an
inherent limitation to NGS is the requirement for a reference genome for data
analysis. The
reference genome serves as a template against which "reads" (i.e., short
oligonucleotide
sequences corresponding to portions of a target DNA or RNA, although NGS may
also include
long-read NGS and nanopore sequencing techniques) are aligned to elucidate the
full length
sequence of a target DNA or RNA. The requirement for a reference genome
severely
complicates use of the technology to characterize highly variable biomarkers,
such as HLA, as
the diversity of sequences is not reflected in reference genomes. More than
22,000 alleles have
been identified in worldwide populations at 12 expressed Class I and ll loci.
(Williams, J Mol
Diagn. 2001 Aug; 3(3): 98-104, citing European Bioinformatics Institute,
ha)://www.ebi.a.c.ukilmay.) Class I genes include HLA-A, -B, and ¨C, as well
as the non-
classical MHO-lb genes HLA-E, -F, and -G. Class II genes include DRA, DRB1,
DQA1, DQB1,
DPA1, and DPB1. Multiple alleles exist for each genetic locus.
[67] The polymorphic nature of HLA is an important evolutionary
development, as it allows
the population to display a wide range of antigens to the immune system. The
large degree of
polymorphism at the Class I and Class II loci, however, poses a significant
challenge for
detecting mutation and loss of heterozygosity.
[68] The instant disclosure provides methods and systems for overcoming the
limitations
associated with NGS to efficiently and accurately detect loss of
heterozygosity (LOH) of HLA
(also termed "HLA-LOH" herein) in a subject, especially in cancer cells within
a subject. HLA-
LOH may occur in cancer cells without occurring in the healthy/non-cancer
cells in a subject.
[69] The HLA-LOH processes herein may be executed on one or more network
accessible
computer processing systems, including network accessible devices
communicatively coupled
to other computer systems, such as other NGS systems. In some examples, the
processes
9
CA 03219608 2023-11-08
WO 2023/277932 PCT/US2021/042039
include, initially receiving genetic material (DNA or RNA) isolated from a
patient specimen and
sequenced, for example, using a NGS technique. In other examples, the
processes may
receive only the sequence data. The specimen may be any biological sample
obtained from the
patient, such as a tissue sample (e.g., tumor tissue from a biopsy), a cell
sample, blood, saliva,
urine, and the like. Both cancer and non-cancer specimens may be isolated and
sequenced by
the computer processing systems performing the HLA-LOH processes, and such
systems may
store the sequence data in a set of data files for the cancer specimens and a
set of data files for
non-cancer specimens. Each file may be configured to store the sequence of
each detected
read and the number of times (counts) that a sequence was detected. Example
data file formats
include a BCL file or a FASTQ file, where the FASTQ format further includes a
quality score for
each read.
[70] In some examples, the computer processing systems may pre-process the
sequence
data by filtering and/or cleaning the data and align that pre-processed data
against a reference
genome, for example, using a bioinformatics pipeline executed using the
computer processing
system. In some examples, the reference genome build is the hg19 genome (see,
e.g.,
GenBank assembly accession: GCA 000001405.1). In the genetic sequence of HLA
genes
there can be considerable variety from person to person, however the hg19
genome contains
only one allele for each HLA gene; therefore many reads detected from the HLA
genes may not
map to hg19. In some examples, the normalization and alignment for sequence
data occurs for
both cancer and non-cancer specimens, yielding a set of output files for
cancer specimens and
a set of output files for non-cancer specimens. The output files may store
genetic positions
indicating the location in the reference genome that matches the sequence of
each read, and
additional information relating to mapping attributes and mapping quality of
each read. Example
file formats include a Binary Alignment Map (BAM) file. For example, the
process generates
normal tissue BAM files and tumor tissue BAM files. Unmapped reads, that is,
reads that do not
match the genome with quality scores that exceed quality thresholds, are
stored in the BAM file
with corresponding read flags indicating that the read did not map
successfully. This may be
due to high numbers of mismatched bases or a high degree of multimapping. In
some
examples, reads bearing this unmapped flag are generally excluded from
downstream analysis
(variant calling, etc.).
[71] FIG. 1 illustrates an example workflow 10 for next generation
sequencing, bioinformatics
processing, and report generation, in an example. In various embodiments,
cancer samples
and non-cancer samples may be processed by DNA next generation sequencing
(NGS) 12,
CA 03219608 2023-11-08
WO 2023/277932 PCT/US2021/042039
designed to sequence either the whole exome or a targeted panel of cancer-
related genes, to
generate DNA sequencing data, and the DNA sequencing data may be processed by
a
bioinformatics pipeline 14 to generate HLA-LOH results (among other outputs)
for each sample.
The cancer sample may be a tissue sample or blood sample containing cancer
cells. In some
instances, a tumor organoid sample may be processed instead of the patient
cancer sample.
[72] In more detail, germline ("normal", non-cancerous) DNA may be
extracted from either
blood (for example, if a patient has cancer that is not a blood cancer) or
saliva (for example, if a
patient has blood cancer). Normal blood samples may be collected from patients
(for example,
in PAXgene Blood DNA Tubes) and saliva samples may be collected from patients
(for
example, in Oragene DNA Saliva Kits).
[73] Blood cancer samples may be collected from patients (for example, in
EDTA collection
tubes). Macrodissected FFPE tissue sections (which may be mounted on a
histopathology
slide) from solid tumor samples may be analyzed by pathologists to determine
overall tumor
amount in the sample and percent tumor cellularity as a ratio of tumor to
normal nuclei. For
each section, background tissue may be excluded or removed such that the
section meets a
tumor purity threshold (in one example, at least 20% of the nuclei in the
section are tumor
nuclei).
[74] Then, DNA may be isolated from blood samples, saliva samples, and
tissue sections
using commercially available reagents, including proteinase K to generate a
liquid solution of
DNA.
[75] Each solution of isolated DNA may be subjected to a quality control
protocol to
determine the concentration and/or quantity of the DNA molecules in the
solution, which may
include the use of a fluorescent dye and a fluorescence microplate reader,
standard
spectrofluorometer, or filter fluorometer.
[76] For each cancer sample and each normal sample, isolated DNA molecules may
be
mechanically sheared to an average length using an ultrasonicator (for
example, a Covaris
ultrasonicator). The DNA molecules may also be analyzed to determine their
fragment size,
which may be done through gel electrophoresis techniques and may include the
use of a device
such as a LabChip GX Touch.
[77] DNA libraries may be prepared from the isolated DNA, for example,
using the KAPA
Hyper Prep Kit, a New England Biolabs (NEB) kit, or a similar kit. DNA library
preparation may
include the ligation of adapters onto the DNA molecules. For example, UDI
adapters, including
11
CA 03219608 2023-11-08
WO 2023/277932 PCT/US2021/042039
Roche SeqCap dual end adapters, or UMI adapters (for example, full length or
stubby Y
adapters) may be ligated to the DNA molecules.
[78] In this example, adapters are nucleic acid molecules that may serve as
barcodes to
identify DNA molecules according to the sample from which they were derived
and/or to
facilitate the downstream bioinformatics processing and/or the next generation
sequencing
reaction. The sequence of nucleotides in the adapters may be specific to a
sample in order to
distinguish samples. The adapters may facilitate the binding of the DNA
molecules to anchor
oligonucleotide molecules on the sequencer flow cell and may serve as a seed
for the
sequencing process by providing a starting point for the sequencing reaction.
[79] DNA libraries may be amplified and purified using reagents, for
example, Axygen MAG
PCR clean up beads. Then the concentration and/or quantity of the DNA
molecules may be
quantified using a fluorescent dye and a fluorescence microplate reader,
standard
spectrofluorometer, or filter fluorometer.
[80] DNA libraries may be pooled (two or more DNA libraries may be mixed to
create a pool)
and treated with reagents to reduce off-target capture, for example Human COT-
1 and/or IDT
xGen Universal Blockers. Pools may be dried in a vacufuge and resuspended. DNA
libraries or
pools may be hybridized to a probe set (for example, a probe set specific to a
panel that
includes approximately 100, 600, 1,000, 10,000, etc. of the 19,000 known human
genes, IDT
xGen Exome Research Panel v1.0 probes, IDT xGen Exome Research Panel v2.0
probes,
other IDT probe panels, Roche probe panels, another probe panel that captures
the human
exome, or another probe panel), and amplified with commercially available
reagents (for
example, the KAPA HiFi HotStart ReadyMix).
[81] Pools may be incubated in an incubator, PCR machine, water bath, or
other temperature
modulating device to allow probes to hybridize. Pools may then be mixed with
Streptavidin-
coated beads or another means for capturing hybridized DNA-probe molecules,
especially DNA
molecules representing exons of the human genome and/or genes selected for a
genetic panel.
[82] Pools may be amplified and purified more than once using commercially
available
reagents, for example, the KAPA HiFi Library Amplification kit and Axygen MAG
PCR clean up
beads, respectively. The pools or DNA libraries may be analyzed to determine
the
concentration or quantity of DNA molecules, for example by using a fluorescent
dye (for
example, PicoGreen pool quantification) and a fluorescence microplate reader,
standard
spectrofluorometer, or filter fluorometer.
12
CA 03219608 2023-11-08
WO 2023/277932 PCT/US2021/042039
[83] In one example, the DNA library preparation and/or whole exome capture
steps of the
process 12 may be performed partially or wholly with an automated system,
using a liquid
handling robot (for example, a SciClone NGSx).
[84] The library amplification may be performed on a device, for example,
an IIlumina C-Bot2,
and the resulting flow cell containing amplified target-captured DNA libraries
may be sequenced
on a next generation sequencer, for example, an IIlumina HiSeq 4000 or an
IIlumina NovaSeq
6000 to a unique on-target depth selected by the user, for example, 300x,
400x, 500x, 10,000x,
etc. Samples may be further assessed for uniformity with each sample required
to have 95% of
all targeted bp sequenced to a minimum depth selected by the user, for
example, 300x. The
next generation sequencer may generate a FASTQ, BCL, or other file for each
flow cell or each
patient sample.
[85] In various embodiments, the bioinformatics pipeline 14 may filter
FASTQ data obtained
from the NGS Lab process 12. Filtering FASTQ data may include correcting
sequencer errors
and removing (trimming) low quality sequences or bases, adapter sequences,
contaminations,
chimeric reads, overrepresented sequences, biases caused by library
preparation, amplification,
or capture, and other errors. Entire reads, individual nucleotides, or
multiple nucleotides that
are likely to have errors may be discarded based on the quality rating
associated with the read
in the FASTQ file, the known error rate of the sequencer, and/or a comparison
between each
nucleotide in the read and one or more nucleotides in other reads that has
been aligned to the
same location in the reference genome. Filtering may be done in part or in its
entirety by
various software tools, for example Skewer (see doi.org/10.1186/1471-2105-15-
182). FASTQ
files may be analyzed for rapid assessment of quality control and reads, for
example, by a
sequencing data QC software such as AfterQC, Kraken, RNA-SeQC, FastQC, (see
IIlumina,
BaseSpace Labs or illumina.com/products/by-type/informatics-products/basespace-
sequence-
hub/apps/fastqc.html), or another similar software program. For paired-end
reads, reads may
be merged.
13
CA 03219608 2023-11-08
WO 2023/277932 PCT/US2021/042039
[86] As executed by the bioinformatics pipeline 14, for each FASTQ file,
each read in the file
may be aligned to the location in the human genome having a sequence that best
matches the
sequence of nucleotides in the read. There are many software programs designed
to align
reads, for example, Novoalign (Novocraft, Inc.), Bowtie, Burrows Wheeler
Aligner (BWA),
programs that use a Smith-Waterman algorithm, etc. Alignment may be directed
using a
reference genome (for example, hg19, GRCh38, hg38, GRCh37, other reference
genomes
developed by the Genome Reference Consortium, etc.) by comparing the
nucleotide sequences
in each read with portions of the nucleotide sequence in the reference genome
to determine the
portion of the reference genome sequence that is most likely to correspond to
the sequence in
the read. The alignment may generate a SAM file, which stores the locations of
the start and
end of each read according to coordinates in the reference genome and the
coverage (number
of reads) for each nucleotide in the reference genome. The SAM files may be
converted to
BAM files, BAM files may be sorted, and duplicate reads may be marked for
deletion, resulting
in de-duplicated BAM files.
[87] A BAM file may contain reads from both a cancer sample and a normal
sample, and
these samples may be derived from the same patient.
[88] In an example, a matched tumor-normal oncology targeted panel single-
site Next
Generation Sequencing (NGS) assay may be used for pre-processing. In an
example, the assay
is a laboratory-developed test (LDT). In another example, the assay is a
marketed assay
approved by a regulatory body. The assay may include reagents, software,
instruments, and
procedures for testing DNA extracted from formalin-fixed, paraffin-embedded
(FFPE) tumor
specimens and matched normal blood or saliva specimens. The assay is designed
to detect and
identify somatic alterations for use and interpretation by qualified
healthcare professionals to aid
in the clinical management of previously diagnosed cancer patients with solid
malignant
neoplasms. In one embodiment, the assay is a next generation sequencing-based
in vitro
diagnostic device intended for use in the detection of substitutions (single
nucleotide variants
(SNVs) and multi-nucleotide variants (MNVs)) and insertion and deletion
alterations (INDELs) in
648 genes, as well as microsatellite instability (MS I) status using DNA
isolated from formalin-
fixed paraffin embedded (FFPE) tumor tissue specimens, and matched normal
specimens, from
previously diagnosed cancer patients. The assay may provide tumor mutation
profiling to be
used by qualified health care professionals in accordance with professional
guidelines in
oncology for patients with malignant neoplasms.
14
CA 03219608 2023-11-08
WO 2023/277932 PCT/US2021/042039
[89] In one example, the assay workflow includes sample processing through
to the
completion of sequencing and creation of an aligned BAM file for patient-
matched tumor and
normal samples. In one example, HLA-LOH determination involves novel
bioinformatics pipeline
software to add a parallel analysis of sequencing results to support HLA-LOH
determination.
[90] In one example, the sequencing assay includes DNA extraction from FFPE
tissue
samples and matched normal saliva or blood samples. Extracted DNA undergoes
whole-
genome shotgun library construction and hybridization-based capture of
specified regions from
648 cancer-related genes (including intronic overhang and selected promoter
regions), 196 loci
for microsatellite instability (MS I), and the sequencing probes also include
probes specifically
designed to efficiently capture a diverse array of HLA alleles.
[91] The systems and methods described herein may be used to determine whether
a patient
sample has HLA-LOH, for example.
[92] In various embodiments, BAM files may be analyzed to detect genetic
variants, including
single nucleotide variants (SNVs), copy number variants (CNVs), gene
rearrangements, etc. For
example, following alignment and sorting, SNVs may be called by creating a
list of locations in
the reads associated with a sample where the nucleotide base is not the same
as the nucleotide
base in that position in the reference genome, and storing that list in a
variant call format (VCF)
file for the sample.
[93] To assess copy number, de-duplicated BAM files and a VCF generated from
the variant
calling pipeline may be used to compute read depth and variation in
heterozygous germline
SNVs between the tumor and normal samples (or between the tumor sample and a
pool of
process matched normal controls for tumor- only cases when the matched normal
sample is not
available). Circular binary segmentation may be applied and segments may be
selected with
highly differential 10g2 ratios between the tumor and its comparator (matched
normal or normal
pool). Approximate integer copy number may be assessed from a combination of
differential
coverage in segmented regions and an estimate of stromal admixture (for
example, tumor
purity, or the portion of a sample that is tumor vs. non-tumor) generated by
analysis of
heterozygous germline SNVs. In various embodiments, the copy number status of
chromosome
(chr) 6 and/or arms or other portions of chr 6 in the tumor sample and/or the
normal sample may
be detected by the bioinformatics pipeline and/or received by the systems and
methods.
[94] To detect gene rearrangements, following de-multiplexing, tumor FASTQ
files may be
aligned against the human reference genome using BWA for DNA files. DNA reads
may be
CA 03219608 2023-11-08
WO 2023/277932 PCT/US2021/042039
sorted and duplicates may be marked with a software, for example, SAMBlaster.
Discordant and
split reads may be further identified and separated. These data may be read
into a software, for
example, LUMPY, for structural variant detection. Structural alterations may
be grouped by type,
recurrence, and presence and stored within a database and displayed through a
fusion viewer
software tool. The fusion viewer software tool may reference a database, for
example, Ensembl,
to determine the gene and proximal exons surrounding the breakpoint for any
possible transcript
generated across the breakpoint. The fusion viewer tool may then place the
breakpoint 5' or 3'
to the subsequent exon in the direction of transcription. For inversions, this
orientation may be
reversed for the inverted gene. After positioning of the breakpoint, the
translated amino acid
sequences may be generated for both genes in the chimeric protein, and a plot
may be
generated containing the remaining functional domains for each protein, as
returned from a
database, for example, Uniprot.
[95] A report generation process 16 may be used for variant classification
and reporting. The
process 16 may detect variants and investigate detected variants following
criteria from known
evolutionary models, functional data, clinical data, literature, and other
research endeavors,
including tumor organoid experiments. At a process 18, variants may be
prioritized and
classified based on known gene-disease relationships, hotspot regions within
genes, internal
and external somatic databases, primary literature, and other features of
somatic drivers.
Variants may be added to a patient (or sample, for example, organoid sample)
report based on
recommendations from the AMP/ASCO/CAP guidelines. Additional guidelines may be
followed.
Briefly, pathogenic variants with therapeutic, diagnostic, or prognostic
significance may be
prioritized in the report. Non-actionable pathogenic variants may be included
as biologically
relevant, followed by variants of uncertain significance. Translocations may
be reported based
on features of known gene fusions, relevant breakpoints, and biological
relevance. Evidence
may be curated from public and private databases or research and presented as
1) consensus
guidelines 2) clinical research, or 3) case studies, with a link to the
supporting literature.
Germline alterations may be reported as secondary findings in a subset of
genes for consenting
patients. These may include genes recommended by the ACMG and additional genes
associated with cancer predisposition or drug resistance.
[96] For detecting microsatellite instability status (MSI), the probes used
during library
preparation before sequencing may target microsatellite regions (for example,
approximately 40,
50, 60, 100, 1,000 regions). At a process 20, a MSI classification algorithm
classifies tumors into
three categories: microsatellite instability-high (MSI-H), microsatellite
stable (MSS), or
16
CA 03219608 2023-11-08
WO 2023/277932 PCT/US2021/042039
microsatellite equivocal (MSE). MSI testing for paired tumor-normal patients
may use reads
mapped to the microsatellite loci with at least five, ten, fifteen, etc. bp
flanking the microsatellite
region. A minimum read threshold may be used. For example, the identification
of at least 10,
20, 30, etc. mapping reads in both tumor and normal samples may be required
for the locus to
be included in the analysis. A minimum coverage threshold may be used. For
example, At least
10, 15, 20, etc. of the total microsatellites on the panel may be required to
reach the minimum
coverage. Each locus may be individually tested for instability, as measured
by changes in the
number of nucleotide base repeats in tumor data compared to normal data, for
example, using
the Kolmogorov-Smirnov test. If p 0.05, the locus may be considered unstable.
The proportion
of unstable microsatellite loci may be fed into a logistic regression
classifier trained on samples
from various cancer types, especially cancer types which have clinically
determined MSI
statuses, for example, colorectal and endometrial cohorts. For MSI testing in
tumor-only mode,
the mean and variance for the number of repeats may be calculated for each
microsatellite
locus. A vector containing the mean and variance data may be put into a
support vector
machine classification algorithm. Both algorithms may return the probability
of the patient being
MSI-H as an output which may be compared to a threshold value.
[97] In one example, if there is a >70% probability of MSI-H status, the
sample may be
classified as MSI-H. If there is between a 30-70% probability of MSI-H status,
the test results
may be too ambiguous to interpret and those samples may be classified as MSE.
If there is a
<30% probability of MSI-HMSI-H status, the sample may be considered MSS.
[98] A patient report may be generated at a process 16. The report may be
presented to a
patient, physician, medical personnel, or researcher in a digital copy (for
example, a JSON
object, pdf file, or an image on a website or portal), a hard copy (for
example, printed on paper
or another tangible medium), as audio (for example, recorded or streaming
audio), or in another
format.
[99] The report may include information related to the lost or present HLA
alleles, including
clinical trials for which the patient is eligible, therapies that may match
the patient (for example,
the systems and methods may be used as a companion diagnostic for these
therapies) and/or
adverse effects predicted if the patient receives a given therapy, based on
the present or lost
HLA alleles in the patient's tumor (obtained using a process 24). For example,
the report may
include information related to whether the patient's tumor is potentially-
resistant to HLA-
restricted immunotherapies (for example, cellular TCR therapies, vaccines, and
immunotherapies designed to be most efficacious in the presence of a
particular HLA allele or
17
CA 03219608 2023-11-08
WO 2023/277932 PCT/US2021/042039
alleles, etc.). Alternatively, the report may include information related to
whether the patient's
tumor is potentially a good candidate for HLA-restricted immunotherapies (for
example, cellular
TCR therapies, vaccines, and immunotherapies designed to be most efficacious
in the absence
of a particular HLA allele or alleles, etc.). The report may state that the
patient may not respond
to immunotherapies that target HLA alleles that have been lost in the patient
sample, may or
may not be eligible for clinical trials listing the loss or presence of those
HLA alleles as inclusion
or exclusion criteria (obtained using a process 26). On the contrary,
treatments (for example,
immunotherapies) based on any HLA alleles present in the patient sample may be
matched to
the patient (for example, the systems and methods may be used as a companion
diagnostic for
these treatments) and the patient may be eligible for clinical trials listing
present HLA alleles as
inclusion criteria, and may not be eligible for clinical trials listing
present HLA alleles as
exclusion criteria (as obtained using process 26). The report may further
include the copy
number status of chr 6 and/or arms or portions of chr 6 in the tumor sample
and/or normal
sample. In various embodiments, if the copy number of at least a portion of
chr 6 (particularly
the short arm of chr6, for example 6p, including the regions surrounding the
HLA locus (for
example, the Class I and/or Class ll locus) is less than two in the tumor
sample (for example,
implying that there is a loss of a copy of at least a portion of a copy of chr
6) the report may infer
HLA-LOH for that sample.
[100] In one example, information related to a loss of a portion of chr 6
does not
specify which copy of an HLA allele was contained on the lost copy of a
portion of chr 6 but
provides supporting evidence that one of the HLA alleles was lost. For
example, the allele
specific systems and methods described herein conclude that coverage of Allele
B is lower than
coverage of Allele A, but the coverage of Allele B is close to the threshold
for calling LOH,
resulting in an equivocal LOH call, which may be caused by standard
variability in coverage or
may reflect a partial loss or actual loss of the HLA allele. In that case, the
chr6 LOH status
serves as an orthogonal way to confirm that loss or presence of the HLA
allele. For example, if
a copy of the portion of chr6 containing the HLA allele is lost, then the HLA
allele that was called
as equivocal loss status by the systems and methods described herein may be
called as LOH.
On the contrary, if no portions of chr6 are reported lost, the HLA allele with
an equivocal LOH
call may be determined to be present.
[101] In various embodiments, the HLA-LOH results may be used to analyze a
database of clinical data, especially to determine whether there is a trend
showing that a
therapy slowed cancer progression in other patients having the same or similar
lost/present
18
CA 03219608 2023-11-08
WO 2023/277932 PCT/US2021/042039
status as the results for a given HLA allele. The LOH results may also be used
to design tumor
organoid experiments. For example, an organoid may be genetically engineered
to have the
same HLA alleles present as a patient and may be observed after exposure to a
therapy to
determine whether the therapy can reduce the growth rate of the organoid, and
thus may be
likely to reduce the progression of cancer in the patient associated with the
specimen.
[102] FIG. 2 illustrates an overall schematic of an example process 100 for
HLA
detection and analysis that may be performed by an HLA and HLA-LOH analysis
system, such
as that shown in FIG. 10. In the example illustrated, the HLA and HLA-LOH
analysis system
access stored genomic sequence data collected from normal tissue and from
cancer tissue.
More specifically, in the illustrated example, the process 100 accesses BAM
files 102 containing
non-cancer specimens with sequence data stored in a normal BAM file 104 and/or
cancer
specimens with sequence data stored in a tumor BAM file 106. At a next step,
the process 100
retrieves normal tissue (or blood) HLA mapping reads 108 from the normal BAM
file 104 and
tumor tissue HLA mapping reads 110 from the tumor BAM file 106.
[103] In the illustrated example, the normal tissue HLA mapping reads and
the tumor
tissue HLA mapping reads, from files 108 and 110, respectively, are
communicated to or
accessed by an alignment process 112. As discussed further herein, the
alignment process 112
aligns tumor tissue data from the BAM file 106, i.e., the tumor HLA mapped
reads 110, with
normal tissue data from the BAM file 104, i.e., the normal HLA mapped reads
108. In various
examples, the alignment process 112 applies one or more read filters to the
BAM file data prior
to alignment. These filters may be applied to each HLA mapped reads data,
normal tissue and
tumor tissue. The filters may be applied to only one of the HLA mapped reads,
normal tissue or
tumor tissue. The filters may be stored in a hierarchical manner by the HLA
and HLA-LOH
analysis system, where the system applies a filters in order based on ranking,
with higher
ranking filters applied before lower ranked filters, and, in some examples,
with an assessment of
filter performance, whereby if a higher ranked filter achieves a desired
filtering result, lower
ranked filters are not executed by the system.
[104] The output from the alignment process 112 is provided to a coverage
statistics
process 114, that compares the aligned HLA mapped reads for normal tumor
tissue and
calculates coverage metrics for each allele for the normal tissue and tumor
tissue data. The
process 114 generates a report in the form of HLA allele-based coverage data
116, where that
report may be stored in the system, displayed to medical personnel, and/or
sent to a networked
19
CA 03219608 2023-11-08
WO 2023/277932 PCT/US2021/042039
connected device, database, etc. In this way, the processes 112, 114, and 116
form an example
HLA typing process.
[105] To generate HLA-LOH data, the HLA allele-based coverage data 116 is
provided
to an HLA-LOH process 118, which in the illustrated example is configured to
receive other
data, such as copy number data, tumor purity data, tumor ploidy data, and/or
genome-wide LOH
predictions (collectively data 120), and apply integrated metrics for
performing an HLA-LOH
classification on the received HLA allele-based coverage data. In some
examples, the data 120
may be generated by an external pathology system communicatively connected to
the
bioinformatics pipeline 14, e.g., the computing device 402. For example,
generating the data
120 may comprise a manual or automated assessment of one or more
histopathology slides
associated with the HLA allele-based coverage data 116. In some examples, the
data 120 may
be wholly or partially generated from a module within bioinformatics pipeline
14, e.g., the
computing device 402. For example, the bioinformatics pipeline module may
generate data 120
based on DNA-seq data, RNA-seq data, methylation data, and/or another type of
bioinformatics
data, and the generating may comprise a deconvolution process.
[106] In some examples, the process 100 includes analyzing the BAM files
102 and
additionally retrieving unmapped/discarded reads (i.e., reads from a BAM file
that are either
assigned locations within HLA gene loci or flagged as unmapped). In some
examples, such as
process 200 shown in FIG. 3, the HLA and HLA-LOH analysis system executes a
preprocessing
script that formats the unmapped reads (and the HLA mapped reads) from the BAM
files 104
and 106 into two FASTQ files, which are fed into the next process. For the two
FASTQ files,
one FASTQ file is generated and contains all of the forward reads from each
paired-end read,
while the other FASTQ file contains the reverse of each paired-end read. In
one example, the
pairs are listed in corresponding order in the files, so the first read in the
first FASTQ file will be
the pair of the first read in the second FASTQ file. In another example, both
forward and
reverse reads could be included in the same FASTQ file as alternating
sequences that share a
similar read name. In another example, single read sequencing data could be
included in a
single FASTQ, or paired reads could be considered independent, disregarding
their forward or
reverse status and included in a single FASTQ.
[107] If genetic sequence data from a normal, non-cancerous specimen from
the
patient that provided the cancer specimen is not available, sequencing data
from a panel of
exemplary normal specimens may be used. In one example, sequencing data from
the panel of
CA 03219608 2023-11-08
WO 2023/277932 PCT/US2021/042039
normal specimens having HLA genetic sequences most similar to the patient's
cancer sample
may be selected to create an HLA-matched panel of normal specimens.
[108] FIG. 3 illustrates example process 200 for the data flow for the HLA
typing and
the HLA-LOH model that may be implemented through the process 100. In some
examples, the
two FASTQ files may be used for both HLA typing to generate HLA type, and for
the LOH
model, which also receives the HLA type/patient reference as input.
[109] Initially BAM files 202 (such as files 102) are accessed on the HLA
and HLA-
LOH analysis system. These BAM files 202 may be stored on the system,
generated from
tissue and/or blood biological samples from a subject and from populations of
subjects, or
generated remotely and accessed by the system, for example, through a
bioinformatics pipeline
that includes network accessible NGS systems or databases. FASTQ files 204 are
generated
from the BAM files 202. The FASTQ files 204 may include a FASTQ file that
contains all of the
forward reads from each paired-end read, and another FASTQ file that contains
the reverse of
each paired-end read. In another example, the FASTQ files 204 may consist of a
single FASTQ
file that contains single end reads, or paired end reads that are being
considered as
independent reads. The FASTQ files 204 are provided to two different
processes, an HLA
typing process 206 and an HLA-LOH process 208. The HLA typing process 206
generates
candidate alleles in the form of HLA type data 210 for the subject's sequence
data in the BAM
files 202 sample. The HLA-LOH process 208 generates HLA-LOH data 212 for the
subject's
sequence data. Each of the HLA type data 210 and the HLA-LOH data 212 may be
stored by
the HLA and HLA-LOH analysis system and reported to clinicians or other
personnel.
[110] To generate the FASTQ files 204, in some examples, e.g., using the
process
112, an alignment is performed on the sequencing data in the BAM files 202,
wherein the
sequencing data is aligned against a reference genome. Further, the genetic
positions
indicating locations in the reference genome of mapped reads having a sequence
that map to
the reference genome is determined. Further still, unmapped reads in the next
generation
sequencing data are determined, as well, and the mapped reads data and
unmapped reads
data are stored in one or more FASTQ files 204 having sequence reads.
[111] These sequence read FASTQ files 204 are fed to the processes 206 and
208.
The process 206 identifies candidate HLA alleles and stores the candidate HLA
alleles as the
HLA type data 210 in an HLA reference file. In the example shown, the HLA type
data 210 from
the process 206 is additionally fed to the HLA-LOH process 208, which
determines the HLA-
21
CA 03219608 2023-11-08
WO 2023/277932 PCT/US2021/042039
LOH status for each identified HLA allele. The data 210 and 212 are then
stored and a report of
the HLA-LOH statuses for each of the HLA alleles may be generated.
[112] For the HLA typing, in an example of the process 206, an HLA typing
algorithm,
which may include the Optitype HLA Typing algorithm (Szolek et al., OptiType:
precision HLA
typing from next-generation sequencing data, Bioinformatics 2014, which is
hereby incorporated
by reference and in its entirety for all purposes) or the Kourami HLA typing
algorithm (Lee et al.,
Kourami: graph-guided assembly for novel human leukocyte antigen allele
discovery, Genome
Biology 2018, which is hereby incorporated by reference and in its entirety
for all purposes),
may be applied to the two FASTQ files 204 input to the HLA typing process. In
an example, the
HLA typing algorithm finds mapped reads (pairs of reads) and analyzes them to
predict which
HLA alleles the patient has. For example, the HLA typing algorithm generates a
list of predicted
HLA alleles for the sample, based on reads that map to either the original
reference HLA or any
known HLA genetic sequence, including those in the international
ImMunoGeneTics (IMGT)
database. In one example, the sequences of some of the most common Class I HLA
alleles are
well-characterized and available to download through the IMGT (imgt.org). In
one example,
there are at least 40,000 known HLA genetic sequences.
[113] In an example, the Optitype HLA Typing algorithm is used. The
Optitype HLA
Typing algorithm works on the premise that the correct genotype explains the
source of more
reads than any other genotype, where an allele is said to explain a read if
the read is aligned to
it with no more mismatches than to any other allele. Hence, the HLA Typing
algorithm finds an
allele combination, which maximizes the number of reads they explain. The HLA
Typing
algorithm includes three main steps. First, reads are mapped against a
carefully constructed
HLA allele reference. Because only exon 2 and 3 subsequences are available for
all alleles,
these regions are considered during read mapping so that no allele is
disadvantaged because
of incomplete sequence information. Additionally, for exome and genome
sequencing data, HLA
Typing algorithm may include flanking intronic regions and a process to impute
missing
sequence data based on phylogenetic information. Second, from the initial read
mapping
results, a binary matrix is generated indicating which alleles a specific read
could be aligned to
with the least number of mismatches. Finally, based on this matrix, a special
case of the set
cover problem is formulated as an integer linear program (ILP) that selects up
to two alleles for
each locus simultaneously, maximizing the number of mapped reads that can be
explained by
the predicted genotype. Besides the major HLA-I alleles A, B and C, minor
alleles G, H and J
22
CA 03219608 2023-11-08
WO 2023/277932 PCT/US2021/042039
are considered during optimization, as long subsequences of these minor loci
show high
similarity with major loci, occasionally causing ambiguous read alignments.
[114] In another example, the Kourami HLA typing algorithm is used. The
Kourami
HLA typing algorithm is a graph-guided assembly technique for classical HLA
genes, which can
construct allele sequences given high-coverage whole-genome sequencing data.
The Kourami
HLA typing algorithm takes advantage of partial-order graphs (POGs) to capture
all known
alleles. The Kourami HLA typing algorithm further modifies the graph to
include variants found
in the sequencing data so that the graph includes the paths of true alleles.
We a comprehensive
reference panel is created from a combined multiple sequence alignment (MSA)
of both full-
length and exon-only known alleles for each HLA locus. Reads mapped to all
known HLA loci in
the human reference genome are extracted and aligned to the comprehensive
reference panel.
Gene-wise POGs are constructed using the combined MSAs. The alignments of the
extracted
reads are projected onto the graphs so that each read alignment is stored as a
path in the
graphs and the read depths on the edges naturally become edge weights. When
these read- or
read-pair-backed paths connect two or more neighboring heterozygous sites of
two alleles, they
provide phasing information. During the alignment projection, the graphs are
modified by adding
nodes and edges to incorporate differences found by the alignment, such as
substitutions and
indels. Note that a sequence of an allele may be encoded as a path through the
entire graph.
Finally, using the weighted graphs with alignment paths, Kourami HLA typing
algorithm
formulates the problem of constructing the best pair of HLA allele sequences
as finding the pair
of paths through the graph. When finding the pair, the Kourami HLA typing
algorithm considers
consistent phasing information from the reads and coverage using base quality
scores.
Additionally, the pair of paths may be identical, to permit homozygous
alleles.
[115] Table 1 includes 150 examples of Class I HLA alleles.
HLA-A HLA-B HLA-C
A*01:01:01:01 B*07:02:01:01 C*01:02:01:01
AT1:01:01:02N 8T7:02:01:02 C01:02:01:02
23
CA 03219608 2023-11-08
WO 2023/277932
PCT/US2021/042039
A*01:01:01:03 8*07:02:01:03 C*01:02:01:03
4*01:01:01:04 8*07:02:01:04 C01:02:01:04
A*01:01:01:05 B*07:02:0105 a*01 :02:01:05
A*01:01:01:06 8*07:02:01:06 C*01:02:01:06
A*01:01:01:07 8*07:02:01:07 C*01:02:01:07
A*01:01:01:08 B*07:02:01:08 C*01:02:01:08
A*01:01:01:09 8*07:02:01:09 C*01:02:01:09
A*01:01:01:10 B*07:02:01:10 C*01:02:01:10
A*01:01:01:11 8*07:02:01:11 C*01:02:01:11
A*01:01:01:12 8*07:02:01:12 C*01:02:01:12
A*01:01:01:13 8*07:02:01:13 C*01:02:01:13
A*01:01:01:14 8*07:02:01:14 C*01:02:01:14
AT1:01:01:15 8*07:02:01:15 C*01:02:01:15
A*01:01:01:16 8*07:02:01:16 C*01:02:01:16
A*01:01:01:17 8*07:02:01:17 C*01:02:01:17
24
CA 03219608 2023-11-08
WO 2023/277932
PCT/US2021/042039
A*01:01:01:18 8*07:02:01:18 C*01:02:01:18
A*01:01:01:19 8*07:02:01:19 C*01:02:01:19
A*01:01:0120 8*0702:0120 a*01:02:0120
A*01:01:01:21 8*07:02:0121 C*01:02:01:21
A*01:01:01:22 8*07:02:01:22 C*01:02:01:22
A*01:01:01:23 8*07:02:01:23 C*01:02:01:23
A*01:01:01:24 8*07:02:01:24 C*01:02:01:24
A*01:01:01:25 8*07:02:0125 C*01:02:01:25
A*01:01:01:26 8*07:02:01:26 C*01:02:01:26
A*01:01:0127 8*07:02:0127 C101:02:01:27
A*01:01:01:28 8*07:02:01:28 C*01:02:0128
A*01:01:0129 W07:02:01:29 C*01:02:0129
A*01:01:01:30 B*07:02:01:30 C*01:02:01:30
A*01:01:01:31 8*07:02:01:31 C*01:02:01:31
A*01:01:01:32 8*07:02:01:32 C*01:02:01:32
CA 03219608 2023-11-08
WO 2023/277932
PCT/US2021/042039
A*01:01:01:33 8*07:02:01:33 C*01:02:01:33
1*01:01:01:34 8*07:02:01:34 C*01:02:01:34
A*01:01:01:35 B*07:02:01:35 C*01:02:02
A*01:01:01:36 8*07:02:01:36 C*01:02:03
A*01:01:01:37 8*07:02:01:37 C*01:02:04
A*01:01:01:38 B*07:02:01:38 C*01:02:05
A*01:01:01:39 8*07:02:01:39 C*01:02:06
A*01:01:01:40 8*07:02:01:40 C*01:02:07
A*01:01:01:41 8*07:02:01:41 C*01:02:08
A*01:01:01:42 8*07:02:01:42 C*01:02:09
A*01:01:01:43 8*07:02:01:43 C*01:02:10
A*01:01:01:44 8*07:02:01:44 C*01:02:11
A01:01:01:45 8*07:02:01:45 C*01:02:12
A*01:01:01:46 8*07:02:01:46 C*01:02:13
A*01:01:01:47 8*07:02:01:47 C*01:02:14
26
CA 03219608 2023-11-08
WO 2023/277932 PCT/US2021/042039
A*01:01:01 :48 B*07:02:01 :48 CO 1 :Oa 15
A*01:01:01:49 B*07:02:01:49 C*01:02:16
A'01 :01 :01 :50 807:02:01:50 1 7
Table 1
[116] In an example, the HLA alleles identified are HLA-A Allele 1:
A*02:01, HLA -A
Allele 2: A*01:01, HLA-B Allele 1: B*07:02, HLA-B Allele 2: B*07:02, HLA-C
Allele 1: 0*07:01,
HLA-C Allele 2: 0*07:02. Further still, in some examples, the HLA typing
algorithm generates
an accession number, which allows the user to retrieve an allele sequence. The
output from the
HLA typing algorithm is provided to downstream HLA-LOH models, e.g., the
process 208.
[117] Returning to FIG. 2, in some examples, the process 100 uses the list
of predicted
HLA alleles, such as data 210, to create a preliminary HLA reference file
composed of reference
sequences of the patient's predicted HLA alleles and all HLA pseudogenes. In
some examples,
the HLA reference file is automatically generated. In some examples, the HLA
reference file
may be automatically generated by pulling sequences from the Optitype (github)
source code,
especially the Optitype database/reference library (including the IMGT
dataset) or Kourami
reference library based on allele and accession number, for example using a
data converter to
maintain allele nomenclature consistency.
[118] In an example, predicted Class I HLA type data 122 is obtained and an
HLA
reference file is generated at a process 124, by adjusting to match the
predicted HLA alleles of
the non-cancer specimen. In various embodiments, the process 124 generates a
patient-
specific HLA reference file by writing the sequence associated with each of
the patient's
predicted Class I HLA types to a FASTA file. In one example, a FASTA file is
essentially a text
file where lines alternate between a sequence name (these lines start with a>
symbol by
convention followed by the sequence name, for example, HLA00001) and the
following line is
the nucleotide sequence corresponding to that sequence name. The process 124
writes the
name and sequence for each predicted Class I HLA type as well as the
pseudogenes. The
output from the process 124 is an HLA reference file as a FASTA file that, in
various
embodiments, is then converted or indexed to a novoalign index file for
alignment to generate a
.nix file. In one example, the .nix file is a specialized format that allows
novoalign software to
27
CA 03219608 2023-11-08
WO 2023/277932 PCT/US2021/042039
more quickly and efficiently align reads. If the patient is homozygous for a
given allele, it is
included only once in the reference. This HLA reference file then may be a
patient specific HLA
reference file.
[119] In various aspects, the HLA reference file is a sequence file that
includes the
patient's predicted HLA class I genes and all nonclassical HLA genes and HLA
pseudogenes to
ensure that a read maps to the correct gene, even though there is high
homology from gene to
gene. In some examples, the HLA reference file is expanded to include class II
HLA genes.
[120] A process 126 aligns HLA mapping reads, along with unmapped/discarded
reads
(from the two paired end FASTQ files mentioned above), to the predicted
patient reference file
(which is the FASTA file that has been indexed to be a .nix file), for
example, using Novalign to
generate a BAM file.
[121] The process 126 may filter the BAM file (in one example by using
pySAM) using
various filtering criteria, such as, for example, checking that: (1) the read
is properly paired, (2)
the read is not qc fail (failed by quality control checks), (3), the read is
not a duplicate, (4) the
edit distance to the reference sequence of the predicted allele is less than
or equal to 2, (5) the
read has less than or equal to 2 insertions compared to the reference sequence
of the predicted
allele, (6) the read has less than or equal to 2 deletions compared to
reference sequence of the
predicted allele, and/or (7) both ends of paired read must map to the same
predicted allele. A
filtered BAM file is generated as a result.
[122] Next, the process 126 may apply a variant calling process performed
on the
filtered alignment file (for example, the filtered BAM file), using freebayes
(available from
github), to identify any nucleotide positions where the patient's HLA
sequences diverge from the
HLA reference. In an example, implementation of the variant calling included
the following
criteria: the sequence data must include at least 3 reads supporting the
variant (indicating that
the patient has an alternate allele, meaning a sequence that is not identical
to the reference
sequence of the predicted allele), and fewer than 5 reads supporting the
reference sequence of
the predicted allele.
[123] Subsequently, a process 128 updates the patient specific reference by
replacing
portions of the reference sequences with the variant sequences that are
supported by at least 3
reads at the genomic positions of those variants to generate an updated
patient HLA reference
file. In this way, the updated patient HLA reference sequence file has been
adjusted to match
the exact nucleotide sequence of the non-cancer specimen HLA genes. In one
example, the
28
CA 03219608 2023-11-08
WO 2023/277932 PCT/US2021/042039
sequence is contained in a FASTA file that is then converted to a novoalign
index file. If the
patient is homozygous for a given allele, the sequence is included only once
in the reference.
[124] The updated HLA reference file may then be sent to the process 112.
In an
example implementation of the process 122, a Novalign alignment of HLA mapping
reads is
repeated along with aligning unmapped/discarded reads to the updated reference
file (if updates
were made). Strict filtering may be used, including read is properly paired;
read is not qc fail;
read is not a duplicate; edit distance to reference is 0; read has zero
insertions to reference;
read has zero deletions to reference; read is not mapped more than once. In
other words, in an
example, including only reads that have no edits, no indels (100% homology/no
edit distance),
and no multimapping (each read must map to one allele with a likelihood that
is greater than
50%, do not allow one read to equally map to both alleles) to generate a non-
cancer specimen
BAM file.
[125] In an example, for the cancer specimen data (i.e., the tumor HLA
mapped reads
110), the process 112 aligns HLA mapping reads along with unmapped/discarded
reads, to the
patient HLA reference sequence (the updated HLA reference sequence data from
process 128)
using Novalign and filters reads with pySAM, using strict filtering criteria
to generate a cancer
specimen BAM file.
[126] Next, the process 114 receives the aligned HLA mapping reads and data
from
the process 112 and calculates coverage (for example, the number of reads that
map to a single
nucleotide position) for normal HLA reads. In various embodiments, coverage
may be inferred
for nucleotide positions located between two appropriately-oriented paired
reads, for example, if
the two non-overlapping reads that comprise a paired-end read do not
explicitly include a
nucleotide position, but flank the nucleotide position, the presence of a
molecule containing this
intervening nucleotide position can be inferred, and thus the paired-end read
may be included in
the coverage metrics calculation for that nucleotide position. For example,
this paired-end read
would count as a read that maps to the nucleotide position even though the
nucleotide position
is located between the two ends of the paired-end read. In an example, the
process 114 uses
bedtools to assess coverage across each of the predicted HLA alleles in the
non-cancer
specimen BAM file. The result is a Table of Positional Coverage across each
HLA allele in the
non-cancer specimen. The process 114 generates a csv file (116) with the
number of reads that
uniquely map to a specific HLA allele at each nucleotide position along that
allele in the non-
cancer specimen. In one example, each column in the csv file represents a
nucleotide position
29
CA 03219608 2023-11-08
WO 2023/277932 PCT/US2021/042039
in an HLA gene and each row represents an allele. Each entry is a number
representing the
number of reads at that nucleotide position for that allele.
[127] The process 114 further calculates coverage for tumor HLA reads,
e.g., using
bedtools to assess coverage across each of the predicted HLA alleles in the
cancer specimen
BAM file. The result is a Table of Positional Coverage across each HLA allele
in the cancer
specimen, generating a csv file (116) with the number of reads that uniquely
map to a specific
HLA allele at each nucleotide position along that allele in the cancer
specimen. In one example,
the positional coverage for both the non-cancer and cancer specimen are
contained in one csv
file. For example, row 1 may represent allele A in the normal sample, row 2
may represent
allele B in the normal sample, row 3 may represent allele A in the tumor
sample, and row 4 may
represent allele B in the tumor sample. In one example, the cancer specimen is
circulating
tumor DNA (ctDNA) obtained from a blood sample and the coverage obtained from
NGS
analysis of ctDNA may differ from coverage obtained from NGS analysis of a
specimen that
contains solid tumor tissue or cancerous blood cells. The calculation of
coverage metrics may
be adjusted accordingly.
[128] The process 114 combines data from the Table of Positional Coverage
across
each HLA allele in the non-cancer specimen and the Table of Positional
Coverage across each
HLA allele in the cancer specimen, to generate higher level features to
describe relative
changes in coverage between the non-cancer specimen and cancer specimen and a
Combined
Coverage Metrics Table (e.g., using formulae for calculating, one example may
include formulae
from the following Python packages: pandas, NumPy, SciPy).
[129] This process 114 may generate a Combined Coverage Metrics Table, in
the form
of an expanded csv file that contains positional statistics on not only
coverage depth but
features including allelic frequencies of each allele, log ratios of each
allele between tumor and
normal, and areas of low sequencing coverage (See FIG. 9 for more details).
The process 114
may also generate a Summary Statistics Table, in the form of a csv file where
each row is an
HLA gene and the columns contain summary statistics describing the differences
in allele level
coverage that will be used to make HLA LOH determinations.
[130] FIG. 4 illustrates an example output report displaying the results of
HLA-LOH
classification. In this example, there are two detected copy losses (HLA-LOH)
for HLA class I
genes. For instance, an HLA-A allele (HLA-A*02:01) has been lost and an HLA-B
allele (HLA-
B*45:02) has been lost. No HLA-C alleles or HLA class II genes are reported
lost in this
CA 03219608 2023-11-08
WO 2023/277932 PCT/US2021/042039
example. All HLA alleles without the copy loss designation have been detected
as present in
the specimen.
[131] The report may include information related to the lost or present HLA
alleles,
including clinical trials for which the patient is eligible, therapies that
may match the patient
and/or adverse effects predicted if the patient receives a given therapy,
based on the present or
lost HLA alleles in the patient's tumor. For example, the report may include
information related
to whether the patient's tumor is potentially-resistant to HLA-restricted
immunotherapies. In this
instance, because the HLA-A*02:01 and HLA-B*45:02 alleles have been lost, the
report may
state that the patient may not respond to immunotherapies based on those lost
HLA alleles,
may not be eligible for clinical trials listing those lost HLA alleles as
inclusion criteria, and may
be eligible for clinical trials listing those lost HLA alleles as exclusion
criteria. On the contrary,
immunotherapies based on any present HLA alleles may be matched to the patient
and the
patient may be eligible for clinical trials listing present HLA alleles as
inclusion criteria, and may
not be eligible for clinical trials listing present HLA alleles as exclusion
criteria.
[132] FIGS. 5A-50 are plots of combined coverage metrics for different
examples of
the techniques herein, some in comparison to non-technique examples, and some
without the
filter steps. (See, FIGS. 9A-9D for more details). For example, FIG. 5A shows
data that were
calculated using all disclosed steps and features, FIG. 5B shows data
calculated without
aligning discarded/unmapped reads to HLA genes, and FIG. 50 shows data
calculated without
replacing the HLA reference sequences with the variants detected in the
sequence data
generated by the patient sample.
[133] With the Combined Coverage Metrics Table and Summary Statistics Table
formed (116), at the process 118, the process 100 may determine and report LOH
Status for
each HLA allele in the cancer (tumor) sample, with reference to the non-cancer
(normal)
sample. In an example without a normal sample extracted from the same patient
as the cancer
sample, the process 118 may report all HLA alleles present in the tumor sample
(known as
stable alleles, versus lost alleles that are missing, absent, or detected with
low coverage from
the tumor sample) or, the process 118 may compare to a normal sample from at
least one
distinct patient, where the sample(s) may have matched HLA types similar to
the HLA types in
the tumor sample to control for sequencing bias caused by hybrid capture, GC
content etc. In
one example, the more pure a tumor sample is, the stronger and more easily
detectable a signal
will be for a lost allele. As tumor purity decreases, the signal becomes
increasingly hard to
distinguish from background noise.
31
CA 03219608 2023-11-08
WO 2023/277932 PCT/US2021/042039
[134] In an example, the features from the Summary Statistics Table (116)
are input
into a machine learning classification model (of process 118) that returns a
likelihood of LOH. In
an example, alleles with a likelihood of LOH greater than 50% are reported as
LOH.
[135] In an example, LOH Status Predictions for each allele in the
predicted HLA
alleles are determined by the process 118 using a Shallow Decision Tree
machine learning
model. FIG. 6 illustrates an example shallow decision tree 300 that may be
executed by the
process 118. In one example, the first line of each node (represented by a box
in FIG. 6) is the
name of a feature that corresponds to a statistic selected from the Summary
Statistics Table
(116) and a cut-off threshold against which the sample's value for that
feature is compared. If
the value of the sample meets or does not meet the threshold criterion, the
sample is sorted into
the corresponding branch of the decision tree. For example, if delta expected
difference logR
of a sample is less than or equal to 0.123, the mean difference logR of the
sample is then
compared to a set threshold, etc. The other lines of text in a box may
indicate the gini index
value for that node, the number of samples (which may mean the number of HLA
genes that
were analyzed for LOH) sorted by that node, and during model training, "value"
may act as a
confusion matrix by indicating the number of samples (HLA genes) that were
sorted into that
node and that had manual annotations of either loss (right number) or stable
(left number) HLA
status.
[136] In one example, the decision tree 300 is shallow/short with few nodes
to avoid
overfitting, decisions are based on features from the Summary Statistics Table
(116), and
features or threshold values may change). In various examples, a decision tree
that is shallow
may be easier to interpret, making it easier to explain the classification of
a patient or
specimen, for example, if a physician calls to ask about a "borderline"
allele. Thus, the
classification models of process 118 may be particularly configured to reduce
processing time
and increase the speed by which particular alleles can be classified, for
faster ultimate
diagnosis. These decision tree models are also typically more resilient to
variations in
upstream sample analysis. If the decision tree is not as shallow, meaning
there are more
features, this may result in the model being more accurate and/or overfitted
and the model may
not correctly classify new data. In one example, decision tree outputs are
more discrete, for
example, three possible decision tree outputs could be clear loss of an HLA
allele, or clear
stability of an HLA allele, and one intermediate state. Another example may
include more than
one intermediate state. In other examples, LOH Status Predictions from the
process 118 may
be determined using other decisional techniques, such as Random Forest methods
which may
32
CA 03219608 2023-11-08
WO 2023/277932 PCT/US2021/042039
be slightly more accurate, and may yield a more continuous distribution of
probabilities/likelihoods, for example, 75% likelihood of a loss of an HLA
allele.
[137] In an example, the process 118 may apply a coverage threshold, such
that any
HLA allele with coverage below a threshold is reported by the process 118 as a
loss of
heterozygosity for that allele. The process 118 may be configured such that
the threshold may
be specific to the testing panel used for NGS sequencing. For example, the
coverage threshold
below which an allele is reported as lost may be approximately 75 reads for an
example
(targeted -600 gene) genomic sequencing panel or 35 reads for an example
(whole exome)
sequencing panel, where the process reports each allele as either stable or
lost. The model may
report an equivocal or uncertain status for an allele in a specimen that is
not obviously stable
(present in the specimen) or lost (absent from the specimen). In some
examples, coverage
metrics for an allele may fall in the middle of the distribution of coverage
metrics values
observed from all specimens, placing the coverage metrics in a range where the
allele has a
roughly equivalent probability of being either lost or stable.
[138] In some examples, further reporting is performed. For example, the
process 100
may match a patient with clinical trials and/or a therapy/therapies that are
likely to eliminate the
cancer cells, based on HLA alleles that are present in cancer sample as
predicted by the HLA
LOH model. This may help a physician make a therapy decision or identify a
matched set of
possible therapies or clinical trials in which the patient may participate. In
one example, the
clinical trials are matched to the patient's HLA LOH results based on the
trials having
inclusion/exclusion criteria based on the presence of specific HLA alleles in
tumor or cancer
cells.
[139] Optionally, in some examples, a biological assay to test for the
presence of any
of the alleles (especially an allele reported by the algorithm to be lost from
and/or not present in
the tumor or cancer cells) is performed. For example, an assay, which may
include
fluorescence activated cell sorting (FACS), may be performed employing a
number of
antibodies, for example, one detecting HLA allele A*02, one detecting A*03,
and one detecting
B*07, to confirm the presence or the absence of various HLA alleles.
Antibodies directed to
other alleles are known in the art, and additional antibodies to detect other
HLA alleles are in
development.
[140] In this example, the techniques described herein were used to analyze
a patient
non-cancer sample, a patient cancer sample, and a tumor organoid (TØ)
derived from the
patient cancer sample and predicted that the cancer sample and T.O. had lost
an A*02 HLA
33
CA 03219608 2023-11-08
WO 2023/277932 PCT/US2021/042039
allele but maintained a stable A*03 HLA allele (see FIGS. 8A-80). To test that
prediction, FACS
was used on the T.O. to detect the presence of these two HLA alleles, and the
results are
shown in FIGS. 7A & 7B.
[141] FIGs. 7A & 7B include the following FACS plots: the top row shows
FACS results
from an anti-A*03 antibody assay (FIG. 7A) and the bottom row shows FACS
results from an
anti-A*02 antibody assay (FIG. 7B). From left to right in each row, there is a
plot for a negative
A*02 control sample, a plot for the tumor organoid sample, and a plot for a
positive A*02 control.
The upper half of each plot indicates which cells bound the pan HLA Class-I
antibody, indicating
that those cells were expressing HLA Class-I molecules. The right half of each
plot indicates
which cells bound either the anti-A*03 antibody (top row) or the anti-A*02
antibody (bottom row),
indicating that those cells expressed the allele targeted by the antibody used
to generate that
plot. Horizontal and vertical lines within the plots indicate the location of
cut-offs used to
determine those percentages and numbers in the outer corners of the plots
indicate the
percentage of all data points in the plot that are located in each quadrant of
the plot.
[142] Each of the plots shows a cell population that expressed HLA Class-I
molecules,
demonstrated by the data points being located in the upper two quadrants of
each plot.
[143] The A*02 negative control and the tumor organoid plots in the bottom
row show a
cell population that is not expressing the A*02 allele, demonstrated by the
data points being
located in the left two quadrants of the plots. All remaining plots show a
cell population that
expressed either the A*02 allele (bottom row plots) or the A*03 allele (top
row plots),
demonstrated by the data points being located in the right two quadrants of
each plot.
[144] Overall, this confirms that the prediction generated by the technique
disclosed
herein: that the tumor organoid contained a stable A*03 allele but had lost
the A*02 allele.
[145] It is noted that if fresh tissue is not available, a tumor organoid
(TØ) may be
generated from a patient cancer cell sample, T.O. genetic material may be
sequenced to
generate T.O. sequence data, and the HLA LOH model may be used on the T.0
sequence
data. FIG. 8A-8C show examples of plots for different types of tissues. In
this example, FIG.
8A shows coverage data calculated by the methods disclosed herein for the non-
cancer sample
tissue. FIG. 8B shows coverage data calculated by the methods disclosed herein
for the cancer
sample tissue. FIG. 8C shows coverage data calculated by the methods disclosed
herein for a
tumor organoid derived from the cancer sample tissue. FIG. 8A shows
approximately
equivalent coverage for two HLA alleles (A*02:01 shown in red data points and
A*03:01 shown
34
CA 03219608 2023-11-08
WO 2023/277932 PCT/US2021/042039
in blue data points) in the non-cancer tissue. FIG. 8B shows reduced coverage
for the A*02:01
allele. The sequence reads from the cancer tissue mapping to the A*02:01
allele may be
explained by the presence of non-cancer cells in the cancer sample due to the
heterogeneity of
cancer samples that do not have 100% tumor purity. FIG. 80 shows a complete
loss of
coverage for the A*02:01 allele. The complete loss of the A*02:01 allele in
the T.O. may reflect
the absence of non-cancer cells in the T.O., which indicates that the T.O. has
100% "tumor
purity".
[146] FIGS. 9A-9D illustrate example plots of coverage (number of reads) on
the y-axis
(plots in the top row) or the fraction of cancer specimen coverage divided by
non-cancer
specimen coverage (B allele fraction) on the y-axis (plots in the bottom row).
These data are
plotted for two HLA alleles (plotted as data points having either shades of
red or shades of blue,
depending on which allele is associated with each data point) at each
nucleotide position
indicated by the x-axis. In this example the two alleles are B*44:03 (red data
points) and
B*15:10 (blue data points). In one example, lighter shades of red or blue
indicate that coverage
at that nucleotide position was below a user determined threshold and data
corresponding to
reads mapping to those positions were excluded from downstream summary
statistic
calculations.
[147] Each title ("Full Featured," "No Unmapped Reads," "No Update to
Patient HLA
Reference," or "No Pseudogenes in HLA Reference") indicates if a step of the
technique
disclosed here was skipped to achieve the data represented in the plots below
the title,
demonstrating the effect of that step on coverage.
[148] Compared to the Full Featured plots in the left column, the coverages
represented in the No Unmapped Reads plots were calculated without including
discarded/unmapped reads during the step of aligning reads to HLA genes. In
this example,
calculated coverages appear to be misleadingly lower, especially for the
B*44:03 allele.
[149] Compared to the Full Featured plots in the left column, the coverages
represented in the No Update to Patient HLA Reference plots were calculated
without replacing
the HLA reference sequences with the variants detected in the sequence data
generated by the
patient sample. In this example, calculated coverages appear to be
misleadingly lower for the
B*44:03 allele.
[150] Compared to the Full Featured plots in the left column, the coverages
represented in the No Pseudogenes in HLA Reference plots were calculated
without tailoring
CA 03219608 2023-11-08
WO 2023/277932 PCT/US2021/042039
the HLA reference sequences to the variants detected in the sequence data
generated by the
patient sample. In this example, calculated coverages appear to be similar,
which may be
explained by the HLA genetic sequences of the patient not being similar to
known HLA
pseudogene sequences. However, in another example, if the patient's HLA genes
had
sequences similar to HLA pseudogenes, coverages could appear higher because
sequence
reads may be incorrectly assigned as mapping to HLA genes when they actually
would map to
pseudogenes if the pseudogene sequences were included in the HLA reference.
[151] There are a number of features of the present techniques, including,
but not
limited to the following:
[152] Use of unmapped reads - during routine mapping of NGS reads to the
reference
genome (hg19) reads that fail to meet predefined mapping quality thresholds
are stored at the
end of the alignment file as unmapped reads. Due to the complex nature of the
HLA locus,
many of the reads that would map to the HLA genes will end up as unmapped
reads due to
either a high number of mismatched bases or a high degree of multimapping. As
a result, the
unmapped reads section contains a wealth of potentially informative and highly
useful reads.
The instant method is superior to previous methods by utilizing these
previously discarded
reads.
[153] Using four-digit HLA type as an input - because the output from the
Optitype
algorithm does not provide a personalized HLA sequence for the sample in
question, it is
important to ensure that the reference sequence used for alignment fully
matches the HLA
sequence of the sample, which may include the steps of calling variants and
updating the
patient HLA reference to replace reference sequences with detected variants.
The variant
calling process may be facilitated by using a reference sequence that is as
close as possible to
the patient's sequence. The present techniques can take advantage of the
finely curated IMGT
dataset that is provided by Optitype (the same software used to perform HLA
typing). This can
have several advantages. For example, the Optitype dataset is optimized to
have consistent
sequence lengths across each allele, inferring missing intronic sequence when
missing, which
reduces the need to normalize LOH signal across sequences of highly divergent
lengths (e.g., if
one allele is 1400bp and the other is only 400bp).
[154] Adaptive realigning to match patient reference - due the high degree
of
polymorphism in the HLA locus, it is important to be able to account for
germline differences
from reference sequences that may arise in a given HLA sequence in an
individual. In some
examples, the present technique first performs an alignment step using the
patient's normal
36
CA 03219608 2023-11-08
WO 2023/277932 PCT/US2021/042039
NGS data allowing for some degree of mismatch. By performing variant calling
against the
initial HLA reference, positions where the NGS data does not support the
initial chosen
reference can be identified. The reference can then be updated and the
alignment repeated
with the more appropriate reference sequence.
[155] Inclusion of all of the sample's HLA genes in the mapping reference -
while HLA
genes are highly polymorphic, they are also highly homologous to one another.
Of the Class I
HLA genes, HLA-A and HLA-C are the most divergent, and yet still most alleles
of these two
genes share greater than 90% homology with one another across their most
polymorphic
regions (Exons 2 and 3). Because of this homology, including all of the
patient's alleles in the
mapping reference ensures that reads do not erroneously cross map between HLA
genes or
multimap to two HLA genes and skew coverage metrics.
[156] Inclusion of pseudogenes in the mapping reference - In addition,
there are a
number of HLA pseudogenes (HLA-H, HLA-J, ...HLA-Z, etc.) with potential
homology to HLA-A,
HLA-B, and HLA-C. To ensure that reads are properly assigned to the
appropriate HLA gene
and allele, these different genes are included in the reference comparisons in
the instant
methods. Otherwise, relative coverage could be skewed (see, FIGs. 9A-9D).
[157] Use of unique HLA read counts in the remapped alignments of reads
(including
previously unmapped reads) as a normalization factor (match factor) between
the Normal and
Tumor Sample ¨ in some examples, the Loss of Heterozygosity determination may
hinge on
whether there is a relative loss of coverage for a particular HLA allele in a
tumor sample, relative
to its matched normal control. This calculation may include normalizing the
read counts
between normal and tumor NGS data when they may have been sequenced at
different depths.
The metric used for normalization may include the number of unique reads
mapping to the HLA
reference, total reads, total mapped reads, or total mapped reads minus
duplicates.
[158] Use of information about positions that do not mismatch ¨ an
advantage of NGS
sequencing approaches (relative to sanger sequencing) is that sequencing
information is not
strictly positional. It is possible to extract information not just about the
abundance of a
nucleotide at a specific position, but also information about the rest of the
150bp paired end
read that contributed to each observation of that nucleotide. By leveraging
this feature, HLA
allele specific coverage can be estimated at positions where the two HLA
alleles actually have
identical nucleotides.
37
CA 03219608 2023-11-08
WO 2023/277932 PCT/US2021/042039
[159] Including read depth as a filtering feature - In order to build a
method that
performs optimally on a range of samples whose sequencing depth may vary, it
is valuable to
set a filtering threshold on which positions will be used for subsequent
analysis. Without this
filtering, the coverage features may get extremely noisy and will make
accurate and precise
LOH calls difficult (though not impossible given the disclosure herein). We
have implemented a
coverage feature that ensures that we only assess positions where we are
confident in our
coverage across both normal alleles (see, FIGS. 9A-9D).
[160] Using Area based metrics rather than net scores - using area-based
metrics
rather than just the difference between values at mismatched positions has a
number of
different implications for the behavior of the method. For example, in this
case, power of the
method to distinguish LOH is less related to the number of mismatched
positions. While
samples with very high homology between two alleles of the same HLA gene may
be difficult to
resolve by NGS, as long as there is a minimal amount of divergence, the
coverage across the
entirety of the two alleles can be resolved. In other methods, a sample where
the alleles
diverge by 30 nt, will be more likely to be called LOH relative to one where
they only diverge by
nt. This is not necessarily the case with the method described herein. Power
to distinguish
LOH is more of a function of coverage and estimates of tumor purity. In
addition, these area-
based metrics, when integrated with depth and coverage features, also
incorporate some
measure of how confident the model is in its ability to resolve the two
alleles (e.g. a higher area-
based score means there are more positions that meet the read depth threshold
and diverge
between the two alleles).
[161] Using Area between LogR as a feature - LogR is the 10g2 ratio of the
read
coverage in the tumor sample, divided by the read coverage in the normal
sample, normalized
by a match factor. When a sample has LOH the logR between the two alleles
across the length
of the HLA gene will be different, and in particular, the logR of the lost
allele will significantly
decrease. Calculating the cumulative area between the two logR lines for a
pair of alleles,
defined in this patent as the "observed difference in logR," provides
increased sensitivity for
detection of LOH.
[162] Using the difference in area between the variant allele frequency
(VAF) curves as
a feature - the B allele frequency (BAF) at any given position is the ratio of
reads supporting
each allele. The area between the two BAF curves defines how much the NGS
reads have
been skewed towards a particular allele. In cases where there is evidence of
strong LOH, the
BAF is almost 1.0 and 0 for the stable and lost allele, respectively. Thus,
the tumor specific
38
CA 03219608 2023-11-08
WO 2023/277932 PCT/US2021/042039
difference in BAF is an incredibly sensitive metric of allele loss. However,
it is important to also
normalize for any differences in coverage that may occur in the normal sample.
In a normal
sample, the BAF will fluctuate across the length of a gene but generally land
somewhere around
0.5 for each allele, however it is not impossible for one allele to be
slightly more well covered
than the other (possibly due to better homology with sequencing probes). By
subtracting this
baseline coverage, the method arrives at a feature that is robust to noise and
still very sensitive
to allelic imbalance.
[163] Calculating an expected difference in logR value based on tumor
purity may be
determined as follows. Tumor samples that are prepared for sequencing by NGS
are generally
heterogeneous and contain a mixture of tumor cells, healthy stroma and immune
cells. As a
result, a fully clonal loss may not necessarily appear as full loss of one
allele sequence. For the
sequencing specimen, it is advantageous to account for tumor purity when
determining how
much loss would be expected. Tumor purity may be estimated by methods that
include but are
not limited to assessing a histopathological slide corresponding to the sample
that was
sequenced by NGS, by analyzing DNA sequence data, or by analyzing RNA sequence
data.
Expected difference in logR may be defined as 10g2 of (1- tumor purity).
[164] Calculating delta expected difference logR. An areawise difference
between
the observed difference in logR value and the expected difference in logR
value for a complete
LOH sample, defined in this patent as delta expected difference logR, may be
determined by
comparing the observed difference in logR to the expected value generated by
our tumor purity
estimate, the method more effectively determines whether the loss of HLA reads
observed in
the tumor sample represents a loss that would be on par with clonal LOH.
[165] A loss of heterozygosity in a specific HLA gene (such as HLA-A, HLA-
B, or HLA-
C) in a cancer specimen may be determined in accordance with a threshold
value, which may
be set if, for instance, a significant difference exists between the read
counts of the first tumor
allele for the HLA gene and the read counts of the second tumor allele for the
HLA gene. A
significant difference may exist, for instance, if the difference between the
read counts of the
first tumor allele for the HLA gene and the read counts of the second tumor
allele for the HLA
gene is significantly more than the difference between the read counts of the
first normal allele
for such HLA gene and the read counts of the second normal allele for such HLA
gene.
"Significantly more" may be confirmed, for instance, when the delta expected
difference logR
value for the HLA gene is significant. For instance, the delta expected
difference logR value
may be significant if it is between 0 and -2. "Significantly" more may be
confirmed, for instance
39
CA 03219608 2023-11-08
WO 2023/277932 PCT/US2021/042039
in circumstances where LOH is partial rather than complete, when the
delta expected difference logR value for the HLA gene is between 0 and .1,
between 0 and
0.2, between 0 and 0.25, between 0 and 0.5, or between 0 and 1.
[166] Using predictions from neighboring genes to inform LOH decision -
clonal HLA
LOH almost always occurs as LOH in all three adjacent HLA genes. The methods
described
herein also account for this by adjusting LOH predictions based on the
predictions of the
neighboring HLA genes.
[167] Determination of whether an HLA gene suffers a LOH can help further
determine
whether certain treatment options may be appropriate for patients. When it is
determined that
the cancer in the subject does not have a loss of heterozygosity in the HLA
gene, treating the
cancer by administering a therapy known to be effective against HLA-
heterozygous cancers
may be appropriate. For instance, a checkpoint inhibitor therapy may be
appropriate for a
subject with an HLA-heterozygous cancer. The checkpoint inhibitor therapy may
be selected
from the group consisting of an anti-CTLA-4 therapy, an anti-PD-1 therapy, and
an anti-PD-L1
therapy, for example. Examples may include ipilimumab, nivolumab,
pembrolizumab,
pidilizumab, atezolizumab, 1pilimumab, and/or tremelimumab, and may include
combination
therapies, such as nivolumab + ipilimumab. As another example, a cancer
vaccine may be
appropriate, such as a cancer vaccine targeted to a specific HLA allele. One
example is a
peptide cancer vaccine available through Shiga University to treat HLA-A*02-
positive advanced
non-small cell lung cancer (NCT01069640). Another example is a peptide cancer
vaccine
available through Shiga University to treat HLA-A*24-positive advanced small
cell lung cancer
(NCT01069653).
[168] FIG. 10 illustrates an example system 400 for HLA and HLA-LOH
analysis that
may be implemented on a network accessible processing system for performing
the processes
described herein. The system 400 may be part of a precision medicine platform.
The example
system may be part of an NGS system or implemented on one or more network
accessible
processing systems (e.g., servers) communicatively coupled to an NGS system, a
network
accessible sequencing database, digital reporting system, or other processing
system.
[169] The HLA and HLA-LOH analysis system 400 may be configured for
performing
the methods described herein including those of processes 100 and 200. The
system 400 may
include a computing device 402, and more particularly may be implemented on
one or more
processing units 404, e.g., Central Processing Units (CPUs), and/or on one or
more or
Graphical Processing Units (GPUs) 406, including clusters of CPUs and/or GPUs.
Features
CA 03219608 2023-11-08
WO 2023/277932 PCT/US2021/042039
and functions described may be stored on and implemented from one or more non-
transitory
computer-readable media 408 of the computing device. The computer-readable
media 408 may
include, for example, an operating system 410 and software modules, or
"engines," that
implement the methods described herein, including those of processes 100 and
200 and other
processes illustrated and described herein.
[170] The computer-readable media 408 stores an HLA analysis system 412 for
performing the HLA typing processes and HLA-LOH processes described herein. In
the
illustrated example, the HLA analysis system 412 includes an HLA typing
process 414 and an
HLA-LOH process 416, both similar to those described in examples of FIGS. 2
and 3. An HLA-
LOH report generator 418 is configured to store and generate HLA allele
predictions and LOH
allele reports, also in accordance with the examples herein.
[171] More generally, the computer-readable media 408 may store sequence
data
processing instructions, including BAM file analysis instructions, sequence
data filtering
instructions, FASTQ file generation instructions, and normalization processes
instructions for
implementing the techniques herein. The computing device 402 may be a
distributed computing
system, such as an Amazon Web Services cloud computing solution. The computing
device
402 may be implemented on one network accessible processing device 450 or
distributed
across multiple such devices 450, 452, 454, etc.
[172] The computing device 402 includes a network interface 420
communicatively
coupled to network 422, for communicating to and/or from a portable personal
computer, smart
phone, electronic document, tablet, and/or desktop personal computer, or other
computing
devices for communicating overlay maps, predicted tile classifications and
locations, predicted
cell classifications and locations, etc. Such information may also be stored
in a database 424.
The computing device 402 further includes an I/O interface 426 connected to
devices, such as
digital displays 428 for displaying generator overlay maps, user input devices
430, etc. A
dashboard generator 432 may be used to generate GUI and/or other digital
displays allowing a
user to review and interact with and adjust generated HLA allele reports and
HLA-LOH allele
reports.
[173] The network 422 may be a public network such as the Internet, a
private network
such as that of a research institution or a corporation, or any combination
thereof. Networks
can include, local area network (LAN), wide area network (WAN), cellular,
satellite, or other
network infrastructure, whether wireless or wired. The networks can utilize
communications
protocols, including packet-based and/or datagram-based protocols such as
Internet protocol
41
CA 03219608 2023-11-08
WO 2023/277932 PCT/US2021/042039
(IP), transmission control protocol (TOP), user datagram protocol (UDP), or
other types of
protocols. Moreover, the networks can include a number of devices that
facilitate network
communications and/or form a hardware basis for the networks, such as
switches, routers,
gateways, access points (such as a wireless access point as shown), firewalls,
base stations,
repeaters, backbone devices, etc.
[174] The computer-readable media 408 may include executable computer-
readable
code stored thereon for programming a computer (e.g., comprising a
processor(s) and GPU(s))
to the techniques herein. Examples of such computer-readable storage media
include a hard
disk, a CD-ROM, digital versatile disks (DVDs), an optical storage device, a
magnetic storage
device, a ROM (Read Only Memory), a PROM (Programmable Read Only Memory), an
EPROM (Erasable Programmable Read Only Memory), an EEPROM (Electrically
Erasable
Programmable Read Only Memory) and a Flash memory. More generally, the
processing units
of the computing device may represent a CPU-type processing unit, a GPU-type
processing
unit, a field-programmable gate array (FPGA), another class of digital signal
processor (DSP),
or other hardware logic components that can be driven by a CPU.
EXAMPLE 1
[175] Methods: A total of 434 colorectal or non-small cell lung cancer
samples
underwent DNA sequencing on a genomic sequencing panel using paired, FFPE
tumor and
normal (blood or saliva) samples. To detect HLA-LOH from NGS data, we took
advantage of
accurate NGS-based HLA typing to resolve the patient's most likely HLA
haplotype. Based on
this haplotype, we adaptively realigned reads, extracted a number of features
that describe the
relative allele coverage in the tumor and normal sample, and used these
features to make a
confident determination of allelic loss in the patient's tumor sample.
[176] Results: We found evidence of HLA-LOH in 16.32% of non-small cell
lung
tumor samples and 17.65% of colorectal tumor samples. We did not observe a
significant
association between LOH status and tumor mutational burden or neoantigen load.
In the
colorectal cancer cohort, we observed HLA-LOH in tumor samples that were
classified as
microsatellite instability high (MSI-H); however, the association between HLA-
LOH status and
MSI status was not statistically significant in this example.
[177] Conclusions: We have developed novel techniques for determining HLA-
LOH
by NGS DNA sequencing, and demonstrate that, with the present techniques, HLA-
LOH may
now be detected in human tumors. Our results highlight the complexity of
antigen presentation,
the potential importance of HLA-LOH as a biomarker of immunotherapy response
and
42
CA 03219608 2023-11-08
WO 2023/277932 PCT/US2021/042039
resistance, and lays the groundwork for future investigations. Moreover,
because the specific
variety (allele) of HLA molecules presented by a patient's cancer cells may
affect how the
patient responds to various cancer treatments and may be an exclusion or
inclusion criterion for
clinical trials, the present techniques used for detecting/predicting loss of
heterozygosity for HLA
genes (HLA LOH) can be quite useful in guiding therapy decisions. The present
techniques
may also help pharmaceutical companies better understand why subsets of
patients do and
don't respond during a clinical trial.
EXAMPLE 2
[178] Background and Introduction: To investigate the prevalence of HLA-
LOH, we
utilized the specialized pipeline described above to detect HLA-LOH by DNA
next-generation
sequencing (NGS). Class I HLA alleles are highly polymorphic and most
individuals have two
distinct alleles for each HLA gene. Each allele allows for presentation of a
unique pool of short
peptides (approximately 8-11 amino acids in length) derived from the cellular
products being
made by each cell in the body. When an HLA allele has the capacity to present
a peptide
derived from a tumor-derived somatic mutation, this is known as a neoepitope.
[179] HLA Loss of Heterozygosity is a potential escape mechanism for tumors
under
immune pressure, where tumors can lose one copy of HLA and thereby avoid
presenting potent
neoepitopes. (See FIG. 11 and Tran et al., New England Journal of Medicine
2016;
McGranahan et al., Cell 2017; Chowell et al., Science 2018)
[180] As immunotherapies become increasingly targeted to specific tumor
targets, HLA
LOH could be an especially important escape mechanism to identify in target
populations.
[181] Methods: General Approach. The HLA-LOH process 100 was used. The HLA-
LOH process 100 takes as inputs BAM files 102 from a matched Tumor and Normal
Sample,
respectively, as well as two digit HLA type 122 (similar to those generated by
Optitype/Kourami/etc.), and tumor purity and ploidy information 120. (See FIG.
2) A full length
HLA sequence is not required.
[182] The process 100 then maps all HLA mapping reads as well as all
unmapped
reads to a new HLA reference 124 & 126. After accounting for potential
germline variants
present in the sample's HLA genes, it updates alignments and determines allele
specific
coverage.
43
CA 03219608 2023-11-08
WO 2023/277932 PCT/US2021/042039
[183] By comparing changes in coverage between alleles, in the context of
the
expected tumor purity, the process 100 then determines, at 128, whether any
reduction in allele
coverage is consistent with a clonal loss of a specific HLA allele.
[184] The output of the HLA-LOH process 100 is a prediction of LOH status
for HLA-A,
HLA-B, and HLA-C genes.
Method Development:
[185] Leveraging Tumor Normal Sequencing - Because we perform paired-tumor
normal sequencing in this example, we are able to leverage the relative HLA
coverage in the
patient's normal sample to serve as a reference for the expected coverage in
an HLA stable
tumor.
[186] Positional Feature Generation - Once we have allele specific
coverage, we
then calculate higher order features that help us describe the relative
differences in allele
coverage. These include B allele frequencies (BAF) and Log Coverage ratios
between the
Tumor and Normal sample (See FIG. 12).
[187] Gene Feature Generation - The initial intuition is to think that we
can only
distinguish the two HLA alleles at nucleotides where they differ in sequence.
However, because
these alignments are based on much longer NGS reads we can actually infer the
allele of origin
for reads mapping to bases where the two alleles are identical, based on the
presence of
distinguishing polymorphisms elsewhere in the read.
[188] Model Improvements and Advantages of this Model - The core of the
algorithm
hinges on accurately identifying HLA mapping reads and correctly assigning
them to one of the
patient's HLA alleles. As such, we are careful to control for any potential
germline variation the
patient may have from the reference HLA sequence, or potential cross-mapping
caused by
pseudogenes. Finally, because many aligners have trouble correctly aligning
HLA reads due to
the high degree of homology, we also rescue HLA reads from the unmapped reads
pool (See
FIGS. 9A-9D).
Results:
[189] The prevalence of HLA LOH across cancer types - We first wanted to
assess
the relative prevalence of HLA LOH across a range of different cancer types.
To address this we
ran our HLA LOH algorithm on Tempus' recently published pan-cancer xT 500
cohort (Beaubier
et al., Nature Biotechnology 2019).
44
CA 03219608 2023-11-08
WO 2023/277932 PCT/US2021/042039
[190] Overall, we found that prevalence varied between different cohorts,
with Lung
and Colorectal cancer having the highest rates of LOH and Prostate and Brain
having the
lowest (See FIG. 13)
[191] HLA LOH occurs across the entire locus - We next wanted to better
understand the nature of LOH in these samples. One feature that stood out was
the fact that in
the majority of cases (44/80), when LOH was observed at one gene in the HLA
locus it was also
observed across the other genes in that locus (HLA-A, HLA-B, and/or HLA-C
genes),
suggesting that the Class I locus is often lost together (See FIG. 14).
[192] Association between HLA LOH and TMB - Given the use of Tumor
Mutational
Burden (TMB) as a pan-cancer metric for assessing tumor antigenicity, we were
curious
whether samples with high TMB would be more likely to undergo HLA LOH. In this
example,
there was a weak association between HLA LOH and TMB. Given the previous
observation that
certain cancer types in this cohort (for example, lung and colorectal) have a
higher prevalence
of HLA LOH, and those cancer types are known to have higher TMBs on average,
it is possible
that this association is mainly being driven by that effect. When we look more
closely at the
association within cancer type the association is less pronounced or absent.
(See FIG. 15)
Validation of Model Results by Biological Assay:
[193] We wanted to confirm that our LOH algorithm was identifying a
biologically
relevant LOH event. From our internal library of tumor derived organoids, we
were able to
identify a tumor organoid with very strong LOH (See FIGS. 8A-8C, an
experimental design to
confirm HLA LOH NGS results. Overview of HLA LOH NGS data for Normal sample,
Original
Tumor, and Tumor- derived Organoid).
[194] As a first pass, we used our HLA LOH model to assess the LOH by NGS
in both
the healthy control (See FIG. 8A), bulk DNA sequencing of the tumor (See FIG.
8B), and tumor-
derived organoid sequencing (See FIG. 8C). While we still detect residual
A*02:01 signal in the
bulk sequencing, the A*02:01 reads are almost entirely absent in the organoid,
likely due to an
absence of healthy normal tissue.
[195] Because there is an antibody clone that can specifically detect the
lost A*02:01
allele (BB7.2) we could actually confirm that this predicted LOH resulted in a
loss of HLA-
A*02:01 protein expression on the tumor-derived organoid.
[196] Staining of the organoid sample, relative to control PBMC populations
found that
while the tumor-derived organoid retained strong expression of A*03:01,
expression of A*02:01
CA 03219608 2023-11-08
WO 2023/277932 PCT/US2021/042039
was no longer detectable. (See FIGS. 7A and 7B, which are flow cytometry
experiment results
showing the expression of the stable and lost allele relative to a pan HLA
antibody. Gated on
live cells.)
[197] We developed a method of determining HLA-LOH by DNA NGS and
demonstrated that HLA-LOH is a detectable feature in human tumors, using our
algorithm
disclosed here.
[198] By assessing HLA LOH across a range of cancer types from a published
cohort,
we find that there is variability in the prevalence of HLA LOH across
different cancer types.
[199] While there may be some pan-cancer association between HLA-LOH and
TMB,
further analysis must be done to determine the nature of the interaction.
[200] Using flow cytometry we can confirm that the signal detected by the
algorithm
results in a biologically-relevant loss of protein. (See FIGS. 7A through 80)
[201] These results highlight the complexity of antigen presentation, the
potential
importance of HLA-LOH as a biomarker of immunotherapy response and resistance,
and lays
the groundwork for future investigations.
[202] In processes herein implementing machine learning classifiers, a
machine
learning algorithm (MLA) or a neural network (NN) may be trained from a
training data set.
MLAs include supervised algorithms (such as algorithms where the
features/classifications in
the data set are annotated) using linear regression, logistic regression,
decision trees,
classification and regression trees, Naïve Bayes, nearest neighbor clustering;
unsupervised
algorithms (such as algorithms where no features/classification in the data
set are annotated)
using Apriori, means clustering, principal component analysis, random forest,
adaptive boosting;
and semi-supervised algorithms (such as algorithms where certain
features/classifications in the
data set are annotated) using generative approach (such as mixture of Gaussian
distributions,
mixture of multinomial distributions, hidden Markov models), low density
separation, graph-
based approaches (such as mincut, harmonic function, manifold regularization),
heuristic
approaches, or support vector machines. NNs include conditional random fields,
convolutional
neural networks, attention based neural networks, long short term memory
networks, or other
neural models where the training data set includes a plurality of samples and
RNA expression
data for each sample. While MLA and neural networks identify distinct
approaches to machine
learning, the terms may be used interchangeably herein. Thus, a mention of MLA
may include a
corresponding NN or a mention of NN may include a corresponding MLA.
46
CA 03219608 2023-11-08
WO 2023/277932 PCT/US2021/042039
[203] Training may include identifying common expression characteristics
shared
across RNA gene expressions in tissue normal samples, primary samples, and
metastatic
samples, such that the MLA may predict the ratio of a metastases tumor from
the background
tissue and identify which portion of an input RNA expression set may be
attributed to the tumor
and which portion may be attributed to the background tissue. Common
expression
characteristics may include which genes are expected to be overexpressed,
expressed, and/or
underexpressed for each type of tissue and/or tumor and may be identified for
each k cluster as
the corresponding genes. In one example, for training a supervised MLA, the
annotations
provided for each sample would be a full transcriptome gene expression
dataset, cancer type,
tissue site, and background tissue percentage.
[204] The methods and systems described above may be utilized in
combination with
or as part of a digital and laboratory health care platform that is generally
targeted to medical
care and research. It should be understood that many uses of the methods and
systems
described above, in combination with such a platform, are possible. One
example of such a
platform is described in U.S. Patent Application No. 16/657,804, titled "Data
Based Cancer
Research and Treatment Systems and Methods", and filed 10/18/2019, which is
incorporated
herein by reference and in its entirety for all purposes.
[205] For example, an implementation of one or more embodiments of the
methods
and systems as described above may include microservices constituting a
digital and laboratory
health care platform supporting detection of LOH in a cancer specimen,
especially in HLA
genes. Embodiments may include a single microservice for executing and
delivering HLA LOH
detection or may include a plurality of microservices each having a particular
role which together
implement one or more of the embodiments above. In one example, a first
microservice may
execute alignment of reads to HLA genes in order to deliver HLA reference
sequences to a
second microservice for calculating coverage metrics. Similarly, the second
microservice may
execute calculating coverage metrics to deliver coverage metrics according to
an embodiment,
above. A third microservice may receive coverage metrics from a second
microservice and may
execute HLA LOH modeling to deliver an LOH status for each HLA allele in a
specimen.
[206] Where embodiments above are executed in one or more micro-services
with or
as part of a digital and laboratory health care platform, one or more of such
micro-services may
be part of an order management system that orchestrates the sequence of events
as needed at
the appropriate time and in the appropriate order necessary to instantiate
embodiments above.
A micro-services based order management system is disclosed, for example, in
U.S. Prov.
47
CA 03219608 2023-11-08
WO 2023/277932 PCT/US2021/042039
Patent Application No. 62/873,693, titled "Adaptive Order Fulfillment and
Tracking Methods and
Systems", filed 7/12/2019, which is incorporated herein by reference and in
its entirety for all
purposes.
[207] For example, continuing with the above first and second
microservices, an order
management system may notify the first microservice that an order for HLA
typing has been
received and is ready for processing. The first microservice may execute and
notify the order
management system once the delivery of HLA typing is ready for the second
microservice.
Furthermore, the order management system may identify that execution
parameters
(prerequisites) for the second microservice are satisfied, including that the
first microservice has
completed, and notify the second microservice that it may continue processing
the order to
calculate coverage metrics according to an embodiment, above.
[208] Where the digital and laboratory health care platform further
includes a genetic
analyzer system, the genetic analyzer system may include targeted panels
and/or sequencing
probes. An example of a targeted panel is disclosed, for example, in U.S.
Prov. Patent
Application No. 62/902,950, titled "System and Method for Expanding Clinical
Options for
Cancer Patients using Integrated Genomic Profiling", and filed 9/19/19, which
is incorporated
herein by reference and in its entirety for all purposes. In one example,
targeted panels may
enable the delivery of next generation sequencing results for HLA LOH
detection according to
an embodiment, above. An example of the design of next-generation sequencing
probes is
disclosed, for example, in U.S. Prov. Patent Application No. 62/924,073,
titled "Systems and
Methods for Next Generation Sequencing Uniform Probe Design", and filed
10/21/19, which is
incorporated herein by reference and in its entirety for all purposes.
[209] Where the digital and laboratory health care platform further
includes a
bioinformatics pipeline, the methods and systems described above may be
utilized after
completion or substantial completion of the systems and methods utilized in
the bioinformatics
pipeline. As one example, the bioinformatics pipeline may receive next-
generation genetic
sequencing results and return a set of binary files, such as one or more BAM
files, reflecting
DNA and/or RNA read counts aligned to a reference genome. The methods and
systems
described above may be utilized, for example, to ingest the DNA and/or RNA
read counts and
produce HLA LOH detection as a result.
[210] When the digital and laboratory health care platform further includes
an RNA
data normalizer, any RNA read counts may be normalized before processing
embodiments as
described above. An example of an RNA data normalizer is disclosed, for
example, in U.S.
48
CA 03219608 2023-11-08
WO 2023/277932 PCT/US2021/042039
Patent Application No. 16/581,706, titled "Methods of Normalizing and
Correcting RNA
Expression Data", and filed 9/24/19, which is incorporated herein by reference
and in its entirety
for all purposes.
[211] When the digital and laboratory health care platform further includes
a genetic
data deconvoluter, any system and method for deconvoluting may be utilized for
analyzing
genetic data associated with a specimen having two or more biological
components to
determine the contribution of each component to the genetic data and/or
determine what
genetic data would be associated with any component of the specimen if it were
purified. An
example of a genetic data deconvoluter is disclosed, for example, in U.S.
Patent Application No.
16/732,229 and PCT19/69161, both titled "Transcriptome Deconvolution of
Metastatic Tissue
Samples", and filed 12/31/19, U.S. Prov. Patent Application No. 62/924,054,
titled "Calculating
Cell-type RNA Profiles for Diagnosis and Treatment", and filed 10/21/19, and
U.S. Prov. Patent
Application No. 62/944,995, titled "Rapid Deconvolution of Bulk RNA
Transcriptomes for Large
Data Sets (Including Transcriptomes of Specimens Having Two or More Tissue
Types)", and
filed 12/6/19 which are incorporated herein by reference and in their entirety
for all purposes.
[212] When the digital and laboratory health care platform further includes
an
automated RNA expression caller, RNA expression levels may be adjusted to be
expressed as
a value relative to a reference expression level, which is often done in order
to prepare multiple
RNA expression data sets for analysis to avoid artifacts caused when the data
sets have
differences because they have not been generated by using the same methods,
equipment,
and/or reagents. An example of an automated RNA expression caller is
disclosed, for example,
in U.S. Prov. Patent Application No. 62/943,712, titled "Systems and Methods
for Automating
RNA Expression Calls in a Cancer Prediction Pipeline", and filed 12/4/19,
which is incorporated
herein by reference and in its entirety for all purposes.
[213] The digital and laboratory health care platform may further include
one or more
insight engines to deliver information, characteristics, or determinations
related to a disease
state that may be based on genetic and/or clinical data associated with a
patient and/or
specimen. Exemplary insight engines may include a tumor of unknown origin
engine, a tumor
mutational burden engine, a PD-L1 status engine, a homologous recombination
deficiency
engine, a cellular pathway activation report engine, an immune infiltration
engine, a
microsatellite instability engine, a pathogen infection status engine, and so
forth. An example
tumor of unknown origin engine is disclosed, for example, in U.S. Prov. Patent
Application No.
62/855,750, titled "Systems and Methods for Multi-Label Cancer
Classification", and filed
49
CA 03219608 2023-11-08
WO 2023/277932
PCT/US2021/042039
5/31/19, which is incorporated herein by reference and in its entirety for all
purposes. An
example of a tumor mutational burden (TMB) engine is disclosed, for example,
in U.S. Prov.
Patent Application No. 62/804,458, titled "Assessment of Tumor Burden
Methodologies for
Targeted Panel Sequencing", and filed 2/12/19, which is incorporated herein by
reference and in
its entirety for all purposes. An example of a PD-L1 status engine is
disclosed, for example, in
U.S. Prov. Patent Application No. 62/854,400, titled "A Pan-Cancer Model to
Predict The PD-L1
Status of a Cancer Cell Sample Using RNA Expression Data and Other Patient
Data", and filed
5/30/19, which is incorporated herein by reference and in its entirety for all
purposes. An
additional example of a PD-L1 status engine is disclosed, for example, in U.S.
Prov. Patent
Application No. 62/824,039, titled "PD-L1 Prediction Using H&E Slide Images",
and filed
3/26/19, which is incorporated herein by reference and in its entirety for all
purposes. An
example of a homologous recombination deficiency engine is disclosed, for
example, in U.S.
Prov. Patent Application No. 62/804,730, titled "An Integrative Machine-
Learning Framework to
Predict Homologous Recombination Deficiency", and filed 2/12/19, which is
incorporated herein
by reference and in its entirety for all purposes. An example of a cellular
pathway activation
report engine is disclosed, for example, in U.S. Prov. Patent Application No.
62/888,163, titled
"Cellular Pathway Report", and filed 8/16/19, which is incorporated herein by
reference and in its
entirety for all purposes. An example of an immune infiltration engine is
disclosed, for example,
in U.S. Patent Application No. 16/533,676, titled "A Multi-Modal Approach to
Predicting Immune
Infiltration Based on Integrated RNA Expression and Imaging Features", and
filed 8/6/19, which
is incorporated herein by reference and in its entirety for all purposes. An
additional example of
an immune infiltration engine is disclosed, for example, in U.S. Patent
Application No.
62/804,509, titled "Comprehensive Evaluation of RNA Immune System for the
Identification of
Patients with an Immunologically Active Tumor Microenvironment", and filed
2/12/19, which is
incorporated herein by reference and in its entirety for all purposes. An
example of an MSI
engine is disclosed, for example, in U.S. Patent Application No. 16/653,868,
titled "Microsatellite
Instability Determination System and Related Methods", and filed 10/15/19,
which is
incorporated herein by reference and in its entirety for all purposes. An
additional example of an
MSI engine is disclosed, for example, in U.S. Prov. Patent Application No.
62/931,600, titled
"Systems and Methods for Detecting Microsatellite Instability of a Cancer
Using a Liquid
Biopsy", and filed 11/6/19, which is incorporated herein by reference and in
its entirety for all
purposes.
[214] When
the digital and laboratory health care platform further includes a report
generation engine, the methods and systems described above may be utilized to
create a
CA 03219608 2023-11-08
WO 2023/277932 PCT/US2021/042039
summary report of a patient's genetic profile and the results of one or more
insight engines for
presentation to a physician. For instance, the report may provide to the
physician information
about the extent to which the specimen that was sequenced contained tumor or
normal tissue
from a first organ, a second organ, a third organ, and so forth. For example,
the report may
provide a genetic profile for each of the tissue types, tumors, or organs in
the specimen. The
genetic profile may represent genetic sequences present in the tissue type,
tumor, or organ and
may include variants, expression levels, information about gene products, or
other information
that could be derived from genetic analysis of a tissue, tumor, or organ. The
report may include
therapies and/or clinical trials matched based on a portion or all of the
genetic profile or insight
engine findings and summaries. For example, the therapies may be matched
according to the
systems and methods disclosed in U.S. Prov. Patent Application No. 62/804,724,
titled
"Therapeutic Suggestion Improvements Gained Through Genomic Biomarker Matching
Plus
Clinical History", filed 2/12/2019, which is incorporated herein by reference
and in its entirety for
all purposes. For example, the clinical trials may be matched according to the
systems and
methods disclosed in U.S. Prov. Patent Application No. 62/855,913, titled
"Systems and
Methods of Clinical Trial Evaluation", filed 5/31/2019, which is incorporated
herein by reference
and in its entirety for all purposes.
[215] The report may include a comparison of the results to a database of
results from
many specimens. An example of methods and systems for comparing results to a
database of
results are disclosed in U.S. Prov. Patent Application No. 62/786,739, titled
"A Method and
Process for Predicting and Analyzing Patient Cohort Response, Progression and
Survival", and
filed 12/31/18, which is incorporated herein by reference and in its entirety
for all purposes. The
information may be used, sometimes in conjunction with similar information
from additional
specimens and/or clinical response information, to discover biomarkers or
design a clinical trial.
[216] When the digital and laboratory health care platform further includes
application
of one or more of the embodiments herein to organoids developed in connection
with the
platform, the methods and systems may be used to further evaluate genetic
sequencing data
derived from an organoid to provide information about the extent to which the
organoid that was
sequenced contained a first cell type, a second cell type, a third cell type,
and so forth. For
example, the report may provide a genetic profile for each of the cell types
in the specimen. The
genetic profile may represent genetic sequences present in a given cell type
and may include
variants, expression levels, information about gene products, or other
information that could be
derived from genetic analysis of a cell. The report may include therapies
matched based on a
51
CA 03219608 2023-11-08
WO 2023/277932 PCT/US2021/042039
portion or all of the deconvoluted information. These therapies may be tested
on the organoid,
derivatives of that organoid, and/or similar organoids to determine an
organoid's sensitivity to
those therapies. For example, organoids may be cultured and tested according
to the systems
and methods disclosed in U.S. Patent Application No. 16/693,117, titled "Tumor
Organoid
Culture Compositions, Systems, and Methods", filed 11/22/2019; U.S. Prov.
Patent Application
No. 62/924,621, titled "Systems and Methods for Predicting Therapeutic
Sensitivity", filed
10/22/2019; and U.S. Prov. Patent Application No. 62/944,292, titled "Large
Scale Phenotypic
Organoid Analysis", filed 12/5/2019, which are incorporated herein by
reference and in their
entirety for all purposes.
[217] When the digital and laboratory health care platform further includes
application
of one or more of the above in combination with or as part of a medical device
or a laboratory
developed test that is generally targeted to medical care and research, such
laboratory
developed test or medical device results may be enhanced and personalized
through the use of
artificial intelligence. An example of laboratory developed tests, especially
those that may be
enhanced by artificial intelligence, is disclosed, for example, in U.S.
Provisional Patent
Application No. 62/924,515, titled "Artificial Intelligence Assisted Precision
Medicine
Enhancements to Standardized Laboratory Diagnostic Testing", and filed
10/22/19, which is
incorporated herein by reference and in its entirety for all purposes.
[218] In various embodiments, techniques herein may be extended to include
LOH loss
type classifications, using a two-layer HLA LOH classifier model developed to
classify
specimens as having a LOH status of loss, no loss, and for specimens having a
loss of
heterozygosity a further classification of whether the loss is a complete
(clonal) loss of
heterozygosity (for example, nearly all of the cancer cells in a specimen are
predicted to have
LOH) or partial loss of heterozygosity (for example, only a portion of the
cancer cells in a
specimen are predicted to have LOH). The result is a three class model of HLA
LOH status.
Further, by implementing the three class model using a two layer classifier
model, these
techniques can be agnostic to the type of initial HLA LOH classifier used. For
example, in
various embodiments, these techniques can be implemented with input
classification data from
the HLA LOH classifications described above with reference to FIGS. 2 and 3
and/or input
classification data developed using other types of HLA LOH classifiers.
Further still, these
techniques can advantageously identify mis-classified HLA LOH status and
correctly reclassify,
e.g., detecting previously classified no loss of heterozygosity specimens as
partial loss of
heterozygosity thereby allowing for more accurate classification results that
lead to more
52
CA 03219608 2023-11-08
WO 2023/277932 PCT/US2021/042039
accurate decisions on matched therapy types and/or determination of meeting
eligibility criteria
in order to match clinical trials to a patient or specimen.
[219] FIG. 16 illustrates an example process 500 for determining LOH
status, as may
be executed by the bioinformatics pipeline 14, the computing device 400, and
in particular the
HLA analysis system 412. Biological sample data 502 is provided to HLA LOH
classification
process 504 that identifies the sample as corresponding to one of two LOH
classifications, loss
of heterozygosity or no loss of heterozygosity. The data 502 may include data
in accordance
with examples herein, such as HLA reads, HLA reference data, alignment data
between the
two, coverage feature metrics (e.g., statistics), and/or the determination of
allelic imbalance
data, etc. The process 504 may be implemented by the LOH modeling processes of
processes
100 and 200 of FIGS. 2 and 3, respectively, where process 118 determines LOH
status for an
entire sample and/or for each HLA allele in the sample, by referencing to a
normal sample. In
the illustrated example, the classification process 504 generates one of two
classification
outputs that may be reported out, a "No loss" (no loss of heterozygosity (no
LOH)) classification
506 or a "Loss" (loss of heterozygosity (LOH)) classification 508. Such
determination
corresponds to a first layer 510 of the two layer configuration of the process
500.
[220] In the case of the LOH classification 508, HLA reads, HLA reference
data,
alignment data between the two, coverage feature metrics (e.g., statistics),
and/or the
determination of allelic imbalance data, etc. may be provided to a second
layer 512 that
contains a second HLA LOH classification process 514 designed to classify the
sample as a
partial LOH 516 or clonal LOH 518.
[221] The first layer 510 may be implemented in accordance with the example
methods
like that described above in reference to FIGS. 1-3. However, an advantage of
some
embodiments herein is that the second layer 512 may be implemented agnostic to
the source of
initial 2-state LOH classification data provided thereto.
[222] FIG. 17 illustrates an example process 600 that may be implemented by
the
processes 504 and 514. Initial HLA reads are identified or otherwise obtained,
at a block 602.
Then, a patient-specific HLA reference (genome or partial genome) is generated
using normal
HLA mapping reads, at a block 604, from which the HLA reads are aligned to the
HLA
reference, at a block 606. Coverage feature metrics from that alignment are
computed at a
block 608 and a determination of allelic imbalance(s) are made at a block 610,
from which a
determination of LOH status is performed at block 612. In some examples, the
block 612 may
be implemented as a two-stage LOH classification process, executing processes
504 and 514,
53
CA 03219608 2023-11-08
WO 2023/277932 PCT/US2021/042039
e.g., using models based on any of the coverage features and other metrics of
processes 504
and 514. In some examples, the HLA coverage feature metrics described herein
may be initially
received at the process 608, without needing to be determined. For example,
the process 600
may be truncated to start at process 608 and the receipt of HLA coverage
feature metrics that
have been determined from an external source based on any number of sequence
read
alignment and filtering processes.
[223] An example analysis is described in the context of identifying HLA-
LOH for the
HLA-A gene; and the HLA-A*02:01 allele is discussed to illustrate analysis for
LOH of a
particular HLA allele. However, it is noted, this same process applies to
determining HLA-LOH
for any HLA gene (i.e., HLA-A, HLA-B, HLA-C) or allele of any of those genes.
[224] In an example implementation, identifying HLA reads at block 602 was
performed
as follows. Because a number of informative HLA reads lack sufficient homology
to the
standard human reference genome to successfully map during routine analysis,
specimen
sequence reads of interest for HLA LOH determination were collected from two
sources: reads
already mapped to an HLA gene in the hg19-aligned BAM output; and unmapped
reads from
the BAM output that align to a reference file having a large number of HLA
alleles collected from
a database, such as the IEDB Database. These reads are then combined together
into a single
file for each of the normal sample and the tumor sample and referred to as
normal HLA
mapping reads and tumor HLA mapping reads, respectively. Reads from the
received sample
are compared against these combined reads to identify the HLA reads for
analysis.
[225] As to block 604 and generating a patient-specific HLA reference using
normal
HLA mapping reads, in order to assess relative coverage across a patient's two
HLA-A alleles,
and ultimately determine whether one has been lost based on HLA-A coverage in
a matched
tumor sample, the block 604 first identifies the sequences of the two HLA-A
alleles that are
present. In an example, this may be achieved using Optitype, in accordance
with examples
described hereinabove. At the block 604, normal HLA mapping reads are passed
into Optitype
and the pair of HLA sequences that explain the greatest proportion of HLA
mapping reads with
the least amount of error is returned (or a single sequence in the case of a
homozygous
sample). These sequences are then extracted from the reference file and used
to create a new
HLA-specific reference for the sample being tested. For HLA-A, HLA-B, and HLA-
C, for
example, each reference allele contains intron1, exon 2, intron 2, exon 3, and
intron 3 of the
allele, referred to as the HLA Region of Interest. The reference file
generated includes the
sequences that were determined for the HLA-A, HLA-B, and HLA-C genes as well
as a pool of
54
CA 03219608 2023-11-08
WO 2023/277932 PCT/US2021/042039
non-classical HLA genes and HLA pseudogenes to minimize issues that may arise
from
homology between these genes and HLA-A.
[226] At block 606, aligning HLA mapping reads to the HLA-specific
reference. To
determine HLA-LOH for the HLA-A gene, HLA-A mapping reads are re-aligned to
the HLA-A
specific reference generated at block 604, e.g., using a Novoalign process. To
ensure that the
block 606 accurately considers reads that may map equally well to multiple
alleles, in an
example, Novoalign may be executed with parameters that allow a read to be
mapped in more
than one location provided those locations both have equivalent mapping
qualities (as opposed
to one location being selected at random). As a post-alignment filtering step,
reads may then be
removed that have more than one mismatch, insertion, or deletion relative to
the reference.
[227] In some instances, there may be a small number of single nucleotide
polymorphisms that need to be updated in the HLA reference file. Therefore, in
some
embodiments, following the alignment and post-alignment filtering described,
the HLA reference
file may be assessed to determine whether the sequences present are fully
supported by the
reads in the sample. For example, Freebayes (v1.1.0) may be used to detect any
positions in
the HLA reference file where another germline sequence is more supported by
the sequencing
results. In practice, reads may be updated in cases where there are at least
40 reads covering a
position, and fewer than 5 of those reads support the current reference
position. In any case,
such information may be provided to the block 604 for updating the HLA
reference file or the
HLA reference file may be updated at the block 606. In cases where reference
updates are
needed, the alignment and post alignment filtering described above is repeated
at the block
606.
[228] Once concordance between the patient-specific HLA reference and HLA
mapping reads has been confirmed for the specific HLA gene being analyzed, a
more stringent
filtering is performed to remove any read that has any single nucleotide
polymorphisms,
insertions or deletions relative to the reference. In addition, reads that map
equally well to two
positions may also be discarded, as not informative for distinguishing between
the two alleles.
The reference sequences for each allele are also compared to one another and
the number of
unique positions between them is calculated. In some examples, for adequate
signal to resolve
LOH events, block 606 was configured such that the two alleles are to differ
by greater than 5
positions. If they meet this criteria, then LOH determination can proceed.
This cutoff, however,
can be higher or lower depending on the implementation.
CA 03219608 2023-11-08
WO 2023/277932 PCT/US2021/042039
[229] At the block 608, computing allele coverage feature metrics and
normalization
may be performed as follows. Following alignment and filtering at block 606,
in an example,
Bedtools (v 2.26.0) was used to calculate the number of reads that support
each allele at each
position across a region of interest. In some embodiments, the block 608 can
further perform
de-noising across the region of interest. For example, to minimize the effect
of fluctuations in
coverage, in an example, the block 608 is configured to apply a fourth order
Savitzky Golay filter
with a window length set in base pairs (e.g., 801bp) to all coverage values.
[230] The coverage depth of each allele along the length of the region of
interest is
then used by the block 608 to generate a number of higher order coverage
feature metrics. In
an example, these higher order features include B allele frequency (BAF), the
proportion of
reads supporting each allele at each position. The features further include
log ratio (logR), i.e.,
the ratio of coverage for an allele between the tumor and normal sample. A
negative log ratio
indicates that the allele is less abundant in the tumor than in the normal.
This ratio may be
calculated as the 10g2(tumor read depth/normal read depth * normalization
factor), where the
normalization factor is the ratio of the number of mapped paired primary reads
in the final
normal and tumor alignment files. This factor normalizes for any baseline
differences in
coverage depth between the tumor and normal sample. The allele with the lower
mean logR
value is designated the "target allele", and a further determination procedure
is used to
determine whether the target allele has undergone Loss of Heterozygosity
relative to the
"stable" allele.
[231] Returning to FIG. 16, in various embodiments, each of the processes
504 and
514 may contain trained classifier models. The process 504, for example, may
be a classifier
trained to determine allelic imbalance from which all samples with partial or
clonal loss of
heterozygosity are collectively classified separate from samples classified as
no loss of
heterozygosity. The process 514, by contrast, may be a classifier trained for
sequential
assessment using specific data for tumor and normal samples with the
application of
predetermined thresholds. The coverage features and thresholds applied by each
of the
processes 504 and 514 may be established empirically using training data. The
processes 504
and 514 may be implemented by respective logistic regression models. In an
example,
coverage feature selection and threshold determination for the models of 504
and 514 were
established empirically using a training set of 189 samples across 34 cancer
types that
underwent manual classification by two expert reviewers to annotate partial
and clonal LOH.
477 loci (295 with no loss, 92 with a partial loss and 90 with a clonal loss)
across 186 samples
56
CA 03219608 2023-11-08
WO 2023/277932 PCT/US2021/042039
with concordant results and tumor purity >30% were selected for training.
Initial performance of
both models was evaluated on a hold-out (validation) dataset of 203 loci
across 77 samples
(128 with no loss, 37 with a partial loss, 37 with a clonal loss).
[232] In an embodiment, the process 504 performs classification for allelic
imbalance
based on three coverage features metrics, where training data corresponding to
each feature
individually and/or collectively is issued for training the allelic imbalance
model at process 504.
The first feature is the ratio of B allele frequency (BAF) of stable allele
between tumor and
normal samples, which captures the magnitude of the LOH signal between a tumor
sample and
a normal sample. While the BAF in the normal sample should always be
approximately 0.5, in
samples with clonal LOH, the BAF of the retained allele in the tumor will
increase substantially
as tumor purity increases, for example. Training data that includes normal
samples and tumor
samples of different BAF values, in particular at different tumor purity
levels therefore may be
used during model training.
[233] The second feature is the mean difference in LogR values between the
target
allele and the stable alleles. This logR value represents the change in
coverage for a given
allele from the normal to the tumor sample. For an allele that has undergone
LOH, its logR will
decrease significantly, and the logR of the corresponding stable allele will
generally increase
slightly. The difference between these two values represents the magnitude of
the total change.
Training data that includes normal samples and tumor samples of alleles with
different coverage
amounts may be used during model training. The third feature is tumor purity.
For example,
training data may include samples of different tumor purity as determined by a
pathologist. As
tumor purity approaches the limit of detection there may be a greater degree
of uncertainty
around the determination of allelic imbalance.
[234] The allelic imbalance model of the process 504 returns a probability
of having
allelic imbalance. In an example, samples with a probability of less than 0.5
are classified as
LOH negative (classification 506); and samples that have a probability of
greater than 0.5 are
classified as LOH positive (classification 508) and assessed by a second
classification model at
process 514. In some examples, these probability thresholds are determined by
the model
training and therefore may be different than that listed. Further, the model
training process may
determine that the cut off probabilities for determining classifications 506
and 508 may be
different values.
57
CA 03219608 2023-11-08
WO 2023/277932 PCT/US2021/042039
[235] The process 514 uses a LOH modeling process independent from that of
process 504, namely a clonal LOH model that uses three coverage features
metrics to classify
the loss of heterozygosity as either clonal or partial LOH. The coverage
features of process 514
may include the expression: (observed logR difference - expected logR
difference) / expected
logR difference, i.e., the ratio of the difference between observed and
expected logR difference
to the expected logR difference. The difference in LogR values between the
target and stable
allele represent the magnitude of the loss event. For a clonal loss in a
sample with a given
tumor purity, the expected Log R difference can be calculated as the log2(1-
TP), where TP is the
tumor purity. The ratio of observed to expected logR describes whether the
loss event observed
meets or exceeds the expected loss for a clonal LOH event.
[236] In some examples, the observed logR difference is the difference
between the
logR of coverage of the stable allele and the logR of coverage of the lost
allele. In some
examples, the observed logR difference is an average of log(coverage in tumor
/ coverage in
normal), calculated for at least one nucleotide position in an HLA gene. For
example, the
log(coverage in tumor / coverage in normal) may be calculated for nucleotide
positions having a
coverage of at least 40 sequence reads. In some examples, the observed logR
difference is an
average of log(coverage in tumor / coverage in normal*match ratio), calculated
for at least one
nucleotide position in an HLA gene, wherein the match ratio is the ratio of
the number of HLA
reads in the normal sample to the number of HLA reads in the tumor sample or
the ratio of the
number of unique reads in the normal sample to the number of unique reads in
the tumor
sample. For example, the log(coverage in tumor / coverage in normal * match
ratio) may be
calculated for nucleotide positions having a coverage of at least 40 sequence
reads. In some
examples, the observed logR difference is the cumulative area between the logR
line
associated with a first allele and the logR line associated with a second
allele. In some
examples, the expected logR difference is the log2(1-tumor purity) and tumor
purity is a value
between 0 and 1.
[237] To identify a lost allele, in some examples, the process 514 may
calculate, for
each allele, a ratio of a BAF of a lost allele in the tumor sample to the BAF
of the lost allele in
the normal sample. Then, the process 514 may compare each ratio for the
alleles and select
the allele associated with the lowest ratio as the allele that is more likely
to be lost. The process
514 may do this determination before determining LOH classification.
[238] The coverage features of the process 514 may further include the
ratio of BAF of
the target allele between tumor and normal samples. This feature captures the
magnitude of
58
CA 03219608 2023-11-08
WO 2023/277932 PCT/US2021/042039
the LOH signal between the tumor and normal sample. While the BAF in the
normal sample
should always be approximately 0.5, the BAF in the tumor will decrease
substantially in samples
with Clonal LOH as tumor purity increases. Additionally, the coverage features
of the process
514 may include tumor purity, where, as the tumor purity approaches the limit
of detection, there
may be a greater degree of uncertainty around the determined classification.
[239] Based on a logistic regression from these coverage features, the
clonal LOH
model returns a probability of clonal loss of heterozygosity. If the
probability of clonal LOH is
greater than 0.5, the process 514 will return a result of clonal LOH for the
target allele. For
example, if the target allele is A*02:01, then the process 514 will return a
status of "A*02:01
LOH Positive", corresponding to classification 518. If the probability is 0.5
or less, the process
514 will return a result of partial LOH for the target allele, e.g., "A*02:01
LOH Partial",
corresponding to classification 516.
[240] FIG. 18 illustrates three plots. A top plot is of the read coverage
(number of
reads) on the y-axis for two different alleles (B*44:02 (red data points) and
B*07:02 (blue data
points)) as a function of nucleotide position, for a normal sample. A middle
plot is of the BAF for
two different alleles as a function of nucleotide position, for the normal
sample. A bottom plot is
of Log Ratio of read coverage in the tumor sample to the read coverage in the
normal sample,
as a function of nucleotide position. FIG. 19 illustrates three plots. A top
plot is of the read
coverage (number of reads) on the y-axis for two different alleles (B*44:02
(red data points) and
B*07:02 (blue data points)) as a function of nucleotide position, for a tumor
sample. A middle
plot is of the BAF for two different alleles as a function of nucleotide
position, for the tumor
sample. A bottom plot is the difference between the log Ratio of the two
different alleles as a
function of nucleotide position and illustrates a partial LOH classification
example. FIG. 20
illustrates four plots. Two top plots correspond to read coverage as a
function of nucleotide
position for normal and tumor samples, respectively. One bottom plot is of Log
Ratio of read
coverage in the tumor sample to the read coverage in the normal sample, as a
function of
nucleotide position. The other bottom plot is the difference between log Ratio
of the two
different alleles as a function of nucleotide position and illustrates a
clonal loss classification
example. In the read coverage plots in FIGS. 18, 19, and 20 a gray line is
shown for each of the
allele plots and represents the read coverage after a smoothing filter was
applied, in these
examples, a Savitzky-Golay filter. Smoothing the read coverage allows for less
noise in
downstream determined coverage features.
59
CA 03219608 2023-11-08
WO 2023/277932 PCT/US2021/042039
Example - colorectal cancer
[241] The two-layer clonal LOH determination process 500 can be used with
any
number of cancer types to provide decisional support for identifying targeted
therapies. For
example, the HLA-LOH determination may be performed for patients having a
colorectal cancer
diagnosis. In an example, the process 500 may be focused on an HLA-LOH
determination on
one specific HLA-A allele (HLA-A*02:01), and may be used as a companion
diagnostic, for
example, to a chimeric antigen receptor (CAR) T-cell therapy or another
therapy indicated for
treatment of tumors having HLA-LOH (including HLA-LOH of a specific HLA
allele).
[242] For example, the CAR therapy is targeted to the tumor-specific
antigen CEA, a
well-known tumor-selective antigen highly expressed in all colorectal cancers
and a subset of
other epithelial neoplasms. The CAR may further comprise a synthetic AND/NOT
logic gate
system that reacts to two antigens in the body. In one example, the CAR
includes an activating
(for example, A module) receptor that can bind to CEA, and a blocking (for
example, B module)
receptor that blocks T-cell activation and binds to an HLA allele. In one
example, the HLA allele
is the HLA-A*02 allele. In this example, for patients having germline HLA-
A*02:01 expression, if
their tumor cells express CEA but have lost expression of HLA-A*02:01, the
tumor cells will be
susceptible to tumor-cell killing by the CAR-T cell described here, but normal
cell killing is
blocked.
[243] In patients with a germline HLA-A*02:01 allele, all normal cells
express HLA-
A*02:01 on their surface. Therefore, this CAR-T cell should not be activated
by normal cells
because the B module will bind the HLA-A*02 protein on normal cells, which
will block T-cell
activity by overriding the A module, even if normal cells express CEA. In
contrast, for tumor
cells where the HLA-A*02:01 allele has been lost by LOH, the CAR-T cell will
be activated to kill
those cells because the A module activator engages CEA surface proteins on the
tumor cell and
the CAR-T cell will be unimpeded by the B module blocker because the tumor
cells will not
express the HLA-A*02 protein. Thus, as shown, identifying a sample as having
no LOH, clonal
LOH, or partial LOH for the HLA-A*02:01 allele can be used in identifying
whether to use CAR
therapy or, as may be the case with partial LOH, use a combo therapy that
combines a therapy
directed at a subpopulation of cancer cells having HLA LOH and another therapy
directed at a
subpopulation of cancer cells without HLA LOH.
[244] It should be understood that the examples given above are
illustrative and do not
limit the uses of the systems and methods described herein in combination with
a digital and
laboratory health care platform.
CA 03219608 2023-11-08
WO 2023/277932 PCT/US2021/042039
[245] Throughout this specification, plural instances may implement
components,
operations, or structures described as a single instance. Although individual
operations of one
or more methods are illustrated and described as separate operations, one or
more of the
individual operations may be performed concurrently, and nothing requires that
the operations
be performed in the order illustrated. Structures and functionality presented
as separate
components in example configurations may be implemented as a combined
structure or
component. Similarly, structures and functionality presented as a single
component may be
implemented as separate components or multiple components. These and other
variations,
modifications, additions, and improvements fall within the scope of the
subject matter herein.
[246] Additionally, certain embodiments are described herein as including
logic or a
number of routines, subroutines, applications, or instructions. These may
constitute either
software (e.g., code embodied on a machine-readable medium or in a
transmission signal) or
hardware. In hardware, the routines, etc., are tangible units capable of
performing certain
operations and may be configured or arranged in a certain manner. In example
embodiments,
one or more computer systems (e.g., a standalone, client or server computer
system) or one or
more hardware modules of a computer system (e.g., a processor or a group of
processors) may
be configured by software (e.g., an application or application portion) as a
hardware module that
operates to perform certain operations as described herein.
[247] In various embodiments, a hardware module may be implemented
mechanically
or electronically. For example, a hardware module may comprise dedicated
circuitry or logic that
is permanently configured (e.g., as a special-purpose processor, such as a
microcontroller, field
programmable gate array (FPGA) or an application-specific integrated circuit
(ASIC)) to perform
certain operations. A hardware module may also comprise programmable logic or
circuitry (e.g.,
as encompassed within a processor or other programmable processor) that is
temporarily
configured by software to perform certain operations. It will be appreciated
that the decision to
implement a hardware module mechanically, in dedicated and permanently
configured circuitry,
or in temporarily configured circuitry (e.g., configured by software) may be
driven by cost and
time considerations.
[248] Accordingly, the term "hardware module" should be understood to
encompass a
tangible entity, be that an entity that is physically constructed, permanently
configured (e.g.,
hardwired), or temporarily configured (e.g., programmed) to operate in a
certain manner or to
perform certain operations described herein. Considering embodiments in which
hardware
modules are temporarily configured (e.g., programmed), each of the hardware
modules need
61
CA 03219608 2023-11-08
WO 2023/277932 PCT/US2021/042039
not be configured or instantiated at any one instance in time. For example,
where the hardware
modules comprise a processor configured using software, the processor may be
configured as
respective different hardware modules at different times. Software may
accordingly configure a
processor, for example, to constitute a particular hardware module at one
instance of time and
to constitute a different hardware module at a different instance of time.
[249] Hardware modules can provide information to, and receive information
from,
other hardware modules. Accordingly, the described hardware modules may be
regarded as
being communicatively coupled. Where multiple of such hardware modules exist
contemporaneously, communications may be achieved through signal transmission
(e.g., over
appropriate circuits and buses) that connects the hardware modules. In
embodiments in which
multiple hardware modules are configured or instantiated at different times,
communications
between such hardware modules may be achieved, for example, through the
storage and
retrieval of information in memory structures to which the multiple hardware
modules have
access. For example, one hardware module may perform an operation and store
the output of
that operation in a memory device to which it is communicatively coupled. A
further hardware
module may then, at a later time, access the memory device to retrieve and
process the stored
output. Hardware modules may also initiate communications with input or output
devices, and
can operate on a resource (e.g., a collection of information).
[250] The various operations of the example methods described herein can be
performed, at least partially, by one or more processors that are temporarily
configured (e.g., by
software) or permanently configured to perform the relevant operations.
Whether temporarily or
permanently configured, such processors may constitute processor-implemented
modules that
operate to perform one or more operations or functions. The modules referred
to herein may, in
some example embodiments, comprise processor-implemented modules.
[251] Similarly, the methods or routines described herein may be at least
partially
processor-implemented. For example, at least some of the operations of a
method can be
performed by one or more processors or processor-implemented hardware modules.
The
performance of certain of the operations may be distributed among the one or
more processors,
not only residing within a single machine, but also deployed across a number
of machines. In
some example embodiments, the processor or processors may be located in a
single location
(e.g., within a home environment, an office environment or as a server farm),
while in other
embodiments the processors may be distributed across a number of locations.
62
CA 03219608 2023-11-08
WO 2023/277932 PCT/US2021/042039
[252] The performance of certain of the operations may be distributed among
the one
or more processors, not only residing within a single machine, but also
deployed across a
number of machines. In some example embodiments, the one or more processors or
processor-
implemented modules may be located in a single geographic location (e.g.,
within a home
environment, an office environment, or a server farm). In other example
embodiments, the one
or more processors or processor-implemented modules may be distributed across
a number of
geographic locations.
[253] Unless specifically stated otherwise, discussions herein using words
such as
"processing," "computing," "calculating," "determining," "presenting,"
"displaying," or the like
may refer to actions or processes of a machine (e.g., a computer) that
manipulates or
transforms data represented as physical (e.g., electronic, magnetic, or
optical) quantities within
one or more memories (e.g., volatile memory, non-volatile memory, or a
combination thereof),
registers, or other machine components that receive, store, transmit, or
display information.
[254] As used herein any reference to "one embodiment" or "an embodiment"
means
that a particular element, feature, structure, or characteristic described in
connection with the
embodiment is included in at least one embodiment. The appearances of the
phrase "in one
embodiment" in various places in the specification are not necessarily all
referring to the same
embodiment.
[255] Some embodiments may be described using the expression "coupled" and
"connected" along with their derivatives. For example, some embodiments may be
described
using the term "coupled" to indicate that two or more elements are in direct
physical or electrical
contact. The term "coupled," however, may also mean that two or more elements
are not in
direct contact with each other, but yet still co-operate or interact with each
other. The
embodiments are not limited in this context.
[256] As used herein, the terms "comprises," "comprising," "includes,"
"including,"
"has," "having" or any other variation thereof, are intended to cover a non-
exclusive inclusion.
For example, a process, method, article, or apparatus that comprises a list of
elements is not
necessarily limited to only those elements but may include other elements not
expressly listed
or inherent to such process, method, article, or apparatus. Further, unless
expressly stated to
the contrary, "or" refers to an inclusive or and not to an exclusive or. For
example, a condition A
or B is satisfied by any one of the following: A is true (or present) and B is
false (or not present),
A is false (or not present) and B is true (or present), and both A and B are
true (or present).
63
CA 03219608 2023-11-08
WO 2023/277932 PCT/US2021/042039
[257] In addition, use of the "a" or "an" are employed to describe elements
and
components of the embodiments herein. This is done merely for convenience and
to give a
general sense of the description. This description, and the claims that
follow, should be read to
include one or at least one and the singular also includes the plural unless
it is obvious that it is
meant otherwise.
[258] This detailed description is to be construed as an example only and
does not
describe every possible embodiment, as describing every possible embodiment
would be
impractical, if not impossible. One could implement numerous alternative
embodiments, using
either current technology or technology developed after the filing date of
this application.
64