Note: Descriptions are shown in the official language in which they were submitted.
WO 2022/272021
PCT/US2022/034839
HEAT FLOW-BASED PROCESS FLUID TEMPERATURE ESTIMATION SYSTEM
WITH THERMAL TIME RESPONSE IMPROVEMENT
BACKGROUND
[ 0 0 0 1 ] The process industry employs process variable transmitters to
monitor process
variables associated with substances such as solids, slurries, liquids,
vapors, and gases in
chemical, pulp, petroleum, pharmaceutical, food and other fluid process
plants. Process
variables includes pressure, temperature, flow, level, turbidity, density,
concentration,
chemical composition, and other properties.
[ 0 0 0 2 ] A process fluid temperature transmitter provides an output related
to a process fluid
temperature. The temperature transmitter output can be communicated over a
process control
loop to a control room, or the output can be communicated to another process
device such that
the process can be monitored and controlled.
[ 0 0 0 3 ] Traditionally, process fluid temperature transmitters were coupled
to or employed
thermowells which provided a temperature sensor in thermal communication with
a process
fluid but otherwise protected the temperature sensor from direct contact with
the process fluid.
The therinowell is positioned within the process fluid in order to ensure
substantial thermal
contact between the process fluid and the temperature sensor disposed inside
the thermowell.
Thennowells are typically designed using relatively robust metal structures
such that the
thermowell can withstand a number of challenges provided by the process fluid.
Such
challenges can include physical challenges, such as process fluid flowing past
the thermowell
at a relatively high rate; thermal challenges, such as extremely high
temperature; pressure
challenges. such as the process fluid being conveyed or stored at a high
pressure; and chemical
challenges, such as those provided by a caustic process fluid. Further,
thermowells can be
difficult to design into a process installation. Such thermowells require a
process intrusion
where the thermowell is mounted to and extends into a process vessel such as a
tank or pipe.
This process intrusion itself must be carefully designed and controlled such
that the process
fluid does not leak from the vessel at the intrusion point.
[ 0 0 4 ] There are a number of factors that can compromise the structural
integrity of a
thermowell. In some cases, not all factors may be fully considered and
thermowells have
sometimes bent or even broken thereby requiring the process installation to be
shut down for a
significant period of time. For some applications, a thermowell simply cannot
be used without
potential damage. in such applications, it may be beneficial, or even
required, to use a non-
invasive process fluid temperature calculation system. With such a system, a
pipe clamp sensor
is used to couple a temperature sensor to a process vessel, such as a pipe.
While such a non-
CA 03222877 2023- 12- 14
WO 2022/272021
PCT/ITS2022/034839
2
invasive process fluid temperature calculation provides the benefit of not
requiring a process
intrusion, nor subjecting a thermowell directly to the process fluid, there is
a tradeoff
Specifically, a non-invasive temperature calculation system is typically less
accurate in
detecting the process fluid temperature than a thermowell which extends into
the process fluid
and measures the temperature directly.
[ 0 0 0 5 ] The desire to use non-intrusive temperature sensors located on the
exterior of the
pipe such as described above is significant, however, users are generally more
familiar with
the response times of thermowell sensors. This creates similar expectations
when using heat
flow-based temperature estimation systems. Improving the response time of the
heat flow-
based temperature estimation system sensor will help remove this barrier and
facilitate user
adoption, as well as increase the application areas currently enjoyed by
thermowells.
SUMMARY
[0006] A process fluid temperature estimation system includes a mounting
assembly
configured to mount the process fluid temperature estimation system to an
external surface of
a process fluid conduit. A sensor capsule has at least one temperature
sensitive element
disposed therein and is configured to sense at least a temperature of the
external surface of the
process fluid conduit. Measurement circuitry is coupled to the sensor capsule
and is configured
to detect a characteristic of at least one temperature sensitive element that
varies with
temperature and provide sensor capsule temperature information. A controller
is coupled to the
measurement circuitry and is configured to obtain a temperature measurement of
the external
surface of the process fluid conduit and to obtain a reference temperature and
employ a heat
transfer calculation with the reference temperature, the external surface
temperature
measurement and a known thermal relationship between the external surface
temperature
sensor in the sensor capsule and the reference temperature to generate an
estimated process
fluid temperature output. The controller is also configured to improve
response time of the
process fluid estimation system mathematically.
BRIEF DESCRIPTION OF THE DRAWINGS
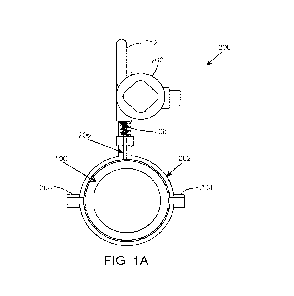
[ 0 0 0 7 ] FIG. IA is diagrammatic view of a process fluid temperature
estimation system
with which embodiments described herein are particularly applicable.
[00 0 8 ] FIG. 1B is a block diagram of a process fluid temperature estimation
system with
which embodiments described herein are particularly applicable.
[ 0 0 0 9 ] FIG. IC is a diagrammatic view modelling heat flow relative to a
process fluid
conduit as an electrical circuit.
CA 03222877 2023- 12- 14
WO 2022/272021
PCT/ITS2022/034839
3
[00 1 0 ] FIG. 2 is a diagrammatic view of a lumped parameter thermal model.
[00 1 1 ] FIG. 3 is a diagrammatic view of a simplified form of the lumped
parameter thermal
model.
[ 0 0 12 ] FIGS. 4A and 4B illustrate an example problem (using an arbitrary
system tau value
of 140 seconds) where an input temperature Tprocess is presented to the
thermal system of
FIG. 3.
[ 0 0 13 ] FIG. 4C illustrates the Tmeasured curve tracking with the
calculated input Tprocess
curve of FIG. 4A.
[ 0 0 1 4 ] FIG. 5A illustrates another example where an input temperature
Tprocess is
comprised of increasing and decreasing thermal ramps.
[00 1 5] FIG. 5B illustrates the Tmeasured curve tracking with the calculated
Tprocess.
[ 0 0 1 6 ] FIG. 6A is an example showing an input made of steps and
sinusoidal temperature
swings.
[ 0 0 1 7 ] FIG. 6B is the measured response and calculated response using
embodiments
described herein.
[00 1 8 ] FIG. 7 is a chart illustrating a step process fluid temperature
input and measured
response.
[00 1 9] FIGS. 8A and 8B illustrate first and second time derivatives,
respectively, of the
measured temperature for a step process fluid temperature change.
[ 0 0 2 0 ] FIG. 9 illustrates the real-time extracted tau value during a
period of validity for a
step input
[ 0 0 2 1 ] FIG. 10 illustrates a process fluid temperature ramp input and a
measured response.
[002 2 ] FIGS. 11A and 11B illustrate first and second time derivatives,
respectively, of the
measured temperature for a ramp change in the process fluid temperature.
[ 0 0 2 3 ] FIG. 12A shows the first-order time derivative-extracted tau value
for a ramp input
versus time during the period of validity.
[ 0 0 2 4 ] FIG. 12B shows the second-order time derivative-extracted tau
value for a ramp
input versus time during the period of validity.
DETAILED DESCRIPTION OF ILLUSTRATIVE EMBODIMENTS
[0025] FIG. lA is diagrammatic view of a process fluid temperature estimation
system
with which embodiments described herein are particularly applicable. As
illustrated, system
200 generally includes a pipe clamp portion 202 that is configured to clamp
around a conduit
or pipe 100. Pipe clamp 202 may have one or more clamp ears 204 in order to
allow the clamp
CA 03222877 2023- 12- 14
WO 2022/272021
PCT/ITS2022/034839
4
portion 202 to be positioned and clamped to pipe 100. While the clamp
illustrated with respect
to FIG. lA is particularly useful, any suitable mechanical arrangement for
securely positioning
system 200 about an exterior surface of a pipe can be used in accordance with
embodiments
described herein.
[ 002 6] System 200 includes heat flow sensor capsule 206 that is forced
against the external
diameter of a pipe by a spring 208. The term "capsule" is not intended to
imply any particular
structure or shape and can thus be formed in a variety of shapes, sizes and
configurations.
Sensor capsule 206 generally includes one or more temperature sensitive
elements, such as
resistance temperature devices (RTDs) or thermocouples. Sensors within capsule
206 are
electrically connected to transmitter circuitry within housing 260, which
circuitry is configured
to obtain one or more temperature measurements from sensor capsule 206 and
calculate an
estimate of the process fluid temperature based on the measurements from
sensor capsule 206,
and a reference temperature, such as a temperature measured within housing
260, or otherwise
provided to circuitry within housing 260.
[0 0 2 7 ] In one example, the basic heat flow calculation can be
simplified into:
Tcorrected = Tskin (Tskin ¨ Treference) * (Rpipeasensor).
[0 0 2 8 ] In this equation, Tskin is the measured temperature of
the external surface of pipe
100. Treference is a second temperature obtained relative to a location having
a known thermal
impedance , (R
--ensor) from the temperature sensitive element that measures Tskin.
Treference may be
sensed by a dedicated sensor within housing 260. However, Treference can be
sensed or inferred
in other ways as well. For example, a temperature sensor can be positioned
external to the
transmitter to replace the terminal temperature measurement in the heat
transfer calculation.
This external sensor would measure the temperature of the environment
surrounding the
transmitter. As another example, industrial electronics typically have on-
board temperature
measurement capabilities. This electronics temperature measurement can be used
as a
substitute to the terminal temperature for the heat transfer calculation. As
another example, if
the thermal conductivity of the system is known and the ambient temperature
around the
transmitter is fixed or user-controlled, the fixed or user-controlled
temperature can be used as
the reference temperature.
[ 002 9 ] Rpipe is the thermal impedance of the conduit and can be obtained
manually by
obtaining pipe material information, pipe wall thickness, et cetera.
Alternatively, a parameter
related to Rpipe can be determined during calibration and stored for
subsequent use.
Accordingly, using a suitable heat flux calculation, such as that described
above, circuitry
CA 03222877 2023- 12- 14
WO 2022/272021
PCT/ITS2022/034839
within housing 260 is able to calculate an estimate for the process fluid
temperature (Tcorrecied)
and convey an indication regarding such process fluid temperature to suitable
devices and/or a
control room. In the example illustrated in FIG. 1, such information can be
conveyed wirelessly
via antenna 212.
[ 00 3 0 ] FIG. 1B is a block diagram of circuitry 210 within housing 260 of
heat flow
measurement system 200, with which embodiments of the present invention are
particularly
applicable. Circuitry 210 includes communication circuitry 220 coupled to
controller 222.
Communication circuitry 220 can be any suitable circuitry that is able to
convey information
regarding the estimated process fluid temperature. Communication circuitry 220
allows heat
flow measurement system 200 to communicate the process fluid temperature
output over a
process communication loop or segment. Suitable examples of process
communication loop
protocols include the 4-20 milliamp protocol, Highway Addressable Remote
Transducer
(HART*) protocol, FOUNDATIONTm Fieldbus Protocol, and the WirelessHART
protocol
(IEC 62591).
[ 0 0 3 1 ] Heat flow measurement system 200 also includes power supply module
224 that
provides power to all components of system 200 as indicated by arrow 226. In
embodiments
where heat flow measurement system 200 is coupled to a wired process
communication loop,
such as a HART loop, or a FOUNDATIONTm Fieldbus segment, power module 224 may
include suitable circuitry to condition power received from the loop or
segment to operate the
various components of system 200. Accordingly, in such a wired process
communication loop
embodiments, power supply module 224 may provide suitable power conditioning
to allow the
entire device to be powered by the loop to which it is coupled. In other
embodiments, when
wireless process communication is used, power supply module 224 may include a
source of
power, such as a battery and suitable conditioning circuitry.
[ 0 0 3 2 ] Controller 222 includes any suitable arrangement that is able to
generate a heat-
flow based process fluid temperature estimate using measurements from
sensor(s) within
capsule 206 and an additional reference temperature, such as a terminal
temperature within
housing 210. In one example, controller 222 is a microprocessor. Controller
222 is
communicatively coupled to communication circuitry 220.
[ 00 3 3 ] Measurement circuitry 228 is coupled to controller 222 and provides
digital
indications with respect to measurements obtained from one or more temperature
sensors 230.
Measurement circuitry 228 can include one or more analog-to-digital converters
and/or suitable
multiplexing circuitry to interface the one or more analog-to-digital
converters to sensors 230.
CA 03222877 2023- 12- 14
WO 2022/272021
PCT/ITS2022/034839
6
Additionally, measurement circuitry 228 can include suitable amplification
and/or linearization
circuitry as may be appropriate for the various types of temperature sensors
employed.
[ 00 3 4 ] For a heat flow-based temperature sensor, its heat transfer
function is denoted as
H(t), which describes its thermal response to a change in the process fluid
temperature. In
addition, Tp(t) is defined to be the process temperature that is to be
computed and Tm(t) to be
the measured output. The problem is then determining the value of Tp(t) (i.e.,
the process fluid
temperature), given H(t) and a measured value of Tm(t). This procedure
essentially removes
the time response of the heat flow sensor since the process temperature is
being extracted
directly in real time.
[ 00 3 5 ] The approach can be better understood by considering a simple case
that can be
generalized to more complex systems. For the heat flow-based temperature
estimation system
shown in FIG. 1A, the fluid, pipe, and module are approximated as a lumped
parameter thermal
system as depicted in FIG. 1C. Such a system can be viewed as an electrical
circuit comprised
of thermal resistors and capacitors with nodal temperatures being the analog
equivalents to
voltages.
[ 0036 ] In FIG. 1C, Reonvection is the effective thermal impedance due to
heat convection
from the process fluid to the inside pipe wall. Rpipe and Cpipe represent the
pipe's thermal
resistance and heat capacity. (Note, the lumped parameter model can be broken
into smaller
elements to better approximate the continuum system, but the solution
procedure is essentially
the same, so this simplified model can be used). Lastly, the thermal
resistance and heat capacity
associated with the module remain fixed regardless of the process fluid
conditions.
[ 00 3 7 ] FIG. 2 shows the same lumped parameter thermal model, along with
each section's
associated time constants (tau), and nodal temperature points. Since the
module section is fixed,
it can be added later once the basic system is understood. Hence, for clarity,
it is ignored in the
following analysis.
[ 00 3 8 ] FIG. 3 is a simplified form of the lumped parameter thermal model.
In FIG. 3 the
simplified form of the problem is depicted. Note that Rconvection and Rpipe
have been
combined into Rtotal since they are in series. The R-C product has units of
time and is denoted
by (i.e., = Rtotal.Cpipe). Typically, to solve such a problem for arbitrary
inputs Tp(t)
(shorthand for Tprocess(t)) and Tm(t) (Shorthand for Tmeasured(t) - the
measured response
temperature), work can be done in the time domain solving convolution
integrals or in the
complex frequency domain using Laplace transforms. The Laplace transform
representation of
the simplified system can be written as:
CA 03222877 2023- 12- 14
WO 2022/272021
PCT/ITS2022/034839
7
[0039] Tin(s)= Tp(s) = H(s)
Equation 1
[00 4 0 ] where H(s) for the configuration shown in FIG. 3 is simply 1/(1+ s=
r). In general,
the Laplace transform of an arbitrary function is defined according to:
[0041] F(s) = fo f (t)e -st dt
Equation 2
[ 0 0 4 2 ] where s is a complex number frequency parameter S=G ico with real
numbers G
and co. The advantage of this formulation is that the solution for Tp(s) is
solved by simple
algebra, viz
[ 0 0 4 3 ] Tp(s) = ¨
Equation 3
H(s)
[ 00 4 4 ] However, to be useful, Tp(s) needs to be converted back into the
time domain using
an inverse Laplace transform, which symbolically is written as:
[0045] Tp(t)= L-1.17;n(s)-1
Equation 4
tfics)
[00 4 6 ] where the inverse Laplace transform is defined according to:
[0047] f (t) = L-1(F)(t) = ¨1 iim estF(s)ds
Equation 5
271 T¨)00 Y
[0048] Unfortunately, the inverse Laplace computation is difficult to
implement in real
time on a continuous basis. Because of this difficulty, Laplace transforms are
usually rendered
in terms of Z-transforms, which lend themselves to discrete time-sampled data.
This is the
preferred approach for complex transfer functions, however, for the case of
FIG. 3, it can be
solved in an even simpler, more direct fashion. Recall the problem to solve is
for a measured
temperature Tm(t), Tp(t) needs to be computed on a continuous time basis.
Rtotal and Cpipe
are known, and therefore "I (= Rtotal-Cpipe) is known as well. Hence,
mathematically Tp(t) can
be computed. The differential equation that solves the 1st-order system of
FIG. 3 is:
[0049] Tp(t) = Tni(t) + T '07'7,1n
Equation 6
[0050] which can be converted into a finite difference equation for discrete
time steps At.
T¨Tni(t ¨
[0051] Tp(t) = Tni(t) + Tni (t) At)
Equation 7
At
[ 00 52 ] Equation 7 is an example of a discretized differential equation that
can be used to
improve the time response of the process fluid temperature estimation system.
This equation
can be solved in real time on a computer or microprocessor using data taken at
a sampling
period of At.
[0053] FIGS. 4A and 4B illustrate an example problem (using an arbitrary tau
value of 140
seconds) where an input temperature Tprocess (reference number 300) is
presented to the
thermal system of FIG. 3. The resulting Tmeasured temperature is labeled at
reference numeral
CA 03222877 2023- 12- 14
WO 2022/272021
PCT/ITS2022/034839
8
302 in FIG. 4B. Comparing the two curves we can see a noticeable lag on the
order of tau in
the measured response. This is the time response to be sped up.
[ 0 0 5 4 ] Using Equation 7 on the measured data yields the curve labeled 304
in FIG. 4C.
Clearly, the calculated Tprocess (Calc) curve in FTG. 4C, tracks with the
actual input Tprocess
curve (300) of FIG. 4A. Hence, the use of Equation 7, given the correct value
of tau (t) (i.e.,
the value of tau for the actual system response), effectively eliminates the
delayed response in
Tmeasured. It should be noted that the input process temperature is not being
predicted, but
rather extracted from Tmeasured, which has the information buried within it
along with the
system response which is characterized by tau in this simple example. Note
that the use of a
tau value of 140 seconds is specific to the modelled system. Other values
could have been used.
For example, if tau is greater than 140 seconds in this example, there would
be less lag, and if
less than 140 seconds there would be more lag.
[ 0 0 5 5 ] FIGS. 5A and 5B illustrate another example where an input
temperature Tprocess
(reference numeral 306) is comprised of up and down temperature ramps.
Equation 7 was used
to read Tmeasured (reference numeral 308 curve in FIG. 5B) and then extract
Tprocess(Calc)
(reference numeral 310 curve), again assuming a system response having a T
value of 140
seconds. As in the previous example, the calculated Tprocess(Calc) 310 line in
FIG. 5B using
Equation 7 reproduces to a high level, the actual Tprocess values (curve 306
in FIG. 5A).
[ 0 0 5 6 ] One last example showing an input made of steps and sinusoidal
temperature
swings is displayed in FIG 6A. FIG. 6B is the measured response (reference
numeral 312) and
the calculated response (reference numeral 314) using Equation 7. Again,
excellent fidelity is
shown in the extraction of the actual process temperature from the measured
temperature data.
[0057] The above examples illustrate the validity of the described approach
and present a
methodology to effectively speed up the response time of heat flow-based
process temperature
fluid estimation systems using the measured signal provided the process
response function is
known, or equivalently, the system effective tau value. While the time
response of the module
has been ignored in the calculations above, its time constant can be easily
characterized and
added to the system response function either by simply adding it to the
process tau as an
approximation (provided it is much smaller than the process tau), or more
correctly, by
incorporating it into the transfer function via a Z-transform formulation.
[ 0 0 5 8 ] Knowing the process tau value is important for the described
procedure and depends
on the particulars of the pipe (e.g., line size, wall thickness, and pipe
material) as well as on
the fluid properties (e.g., liquid or gas, flow velocity, temperature, et
cetera.) There are suitable
CA 03222877 2023- 12- 14
WO 2022/272021
PCT/ITS2022/034839
9
formulas to estimate with reasonable accuracy the values of the thermal
impedances and
convection values for pipe materials and line sizes, as well as flow
conditions. However, it is
more desirable and more accurate to extract the system response time constant
directly from
the raw measured temperature data. To see how this can be accomplished,
consider Equation
6 and its second time derivative, labeled as Equation 8.
3a7' = 1_ aT, a2Tin
[ 0059 ]
Equations
at at dt2
[00 6 0 ] There are two specific cases where the value T can be determined
from the measured
temperature data using these equations.
[00 6 1 ] In the first case, if the process changes temperature in a step-like
fashion, there will
be a period of time, just after the end of the step, where the process
temperature is constant, but
the measured temperature is still changing. Over this window, Tp(t1) = Tp(t2)
(but
Tm(tlYTm(t2)) for the two different times, ti and t2. When this condition is
satisfied, Equation
6 can be used to evaluate T according to,
[0062] T ¨ acinnt((t.,2 ))- aTTm,n((t.,,))
Equation 9
a __ t at
[ 0 0 6 3 ] where Tm = Tmeasured.
[00 6 4 ] In the second case, when the process temperature is ramping up or
down and if the
ramp rate is roughly constant (i.e., the derivatives at two different time
steps are approximately
the same such that dTp(t1)/dt --z __ ,' dTp(t2)/dt, then from Equation 8 it
can be shown that,
5rat(t2) drat(ti)
[ 0 0 6 5 ] T = a 2 T,ant(ti) a 2 Taint (t,, ) [
a t 2
Equation 10
__________________________ a t2
[ 0 0 6 6 ] In order to use Equations 9 or 10, some knowledge of when they can
be
appropriately applied is required. Unfortunately, this is not known from Tp(t)
directly, since
that is what needs to be extracted. However, there is information buried in
the time derivatives
of Tm(t) that can help determine the domains of applicability.
[00 6 7 ] For Case 1, the validity range can be determined by monitoring the
first and second
order time derivatives of the measured temperature. Consider when there is
step in the process
temperature (illustrated at reference numeral 316 in FIG. 7) and a measured
response
(illustrated at reference numeral 318) in FIG. 7.
[00681 FIGS. 8A and 8B plot the first (reference numeral 320 in FIG. 8A), and
second
(reference numeral 322 in FIG. 8B) time derivatives of the measured
temperature for a step
change in the process temperature (324). The derivative values are shown on
the right-side
axes. Examining FIG. 8A, there is a sharp discontinuity in the first time
derivative of Tm(t) at
CA 03222877 2023- 12- 14
WO 2022/272021
PCT/ITS2022/034839
the start of the Tprocess step change. In addition, shown in FIG. 8B, there is
a sign inversion
in the second order time derivative of Tm(t) at the start of the step. These
are signals that a
temperature step transition has occurred in the process temperature and that
application of
Equation 9 is justified to extract a value of tau.
[ 00 6 9 ] FIG. 9 shows the real-time extracted tau value at reference numeral
326 using
Equation 9 during the period of validity. The extracted tau value (right axis)
is very close to
140 seconds, which is the actual system response. Note that after the system
has reached steady-
state and Tmeasured(t) = Tprocess(t), the derivatives are zero and the
extraction method of
Equation 9 can no longer be used.
[ 0 0 7 0 1 For Case 2, and a temperature ramp input, the validity range can
be determined as
was done in Case 1, by monitoring in real time the first and second order time
derivatives of
the measured temperature. The process ramp (reference numeral 328) and
measured response
(reference numeral 330) are displayed in FIG. 10.
[ 0 0 7 1 ] FIGS. 11A and 11B show the first (332) and second (334), time
derivatives,
respectively, of the measured temperature for a ramp change in the process
temperature (336).
Again, the derivative values are the right-side axes. Examining FIG. 11A,
there is a gradual
rise in the first time derivative of Tm(t) during the Tprocess ramp. In
addition, there is an
inversion in the second order time derivative of Tm(t) during the ramp. The
gradual change
regions are signals that a temperature ramp transition has occurred in the
process temperature
and that Equation 10 is justified to extract a value of tau.
[ 0 0 7 2 ] FIG 12A shows the real-time extracted tau value (338) using
Equation 10 during
the period of validity. The extracted tau value is very close to 140 seconds,
which is the actual
system response. In addition, Equation 9 can also be applied once the ramp has
concluded with
the result displayed in Figure 12B. As in Case 1, note that after the system
has reached steady-
state and Tmeasured = Tprocess, the derivatives are zero and the extraction
method of
Equations 9 or 10 can no longer be used as evidenced by the increased noise
(small oscillations
in lines 338 and 340 of FIGS. 12A and 12B, respectively).
[ 00 7 3 ] The above examples illustrate that it is possible to enhance the
time response of the
heat flow-based process fluid temperature estimation system using only the
measured output
provided the system transfer function is known. For thermal systems, this
translates into
knowing what the system's time response function is, or for most cases,
knowing the first order
response time, i.e., the value of tau. The value of tau appropriate to the
system can be
CA 03222877 2023- 12- 14
WO 2022/272021
PCT/US2022/034839
11
determined from the process conditions and pipe configuration, or as
illustrated, directly from
the measured temperature under specific conditions.
CA 03222877 2023- 12- 14