Note : Les descriptions sont présentées dans la langue officielle dans laquelle elles ont été soumises.
2~.~~13
WO 93/18402 PCT/GB93/00458
Ana~tical or Monitoring A~naratus and Method
This invention relates to apparatus and method for analysis or monitoring of
biological material and particularly, but not exclusively, to apparatus for
monitoring or
analysis of cellular biological material, in which a response is obtained from
enzymes
retained within cell membranes.
We have described in our U.K. patent specification 2247530 a method and
apparatus for analysis of biological cell material, substrates therefor, or
inhibitors of cell
metabolism for cell material, the method comprising applying an AC electrical
potential
across a sample of the biological material so as to produce a non-linear
dielectric spectrum,
and obtaining a detectable signal corresponding to said spectrum.
The apparatus described in our prior specification, which (as previously
indicated) is for analysing biological cell material, substrates therefor, or
inhibitors of cell
metabolism for cell material, comprises:
(a) retaining means for retaining a sample of biological material;
(b) means for applying an AC electrical potential across the sample so as to
produce a
non-linear dielectric spectrum; and
(c) means for obtaining a detectable signal corresponding to the spectrum.
According to the present invention, apparatus for monitoring or analysing a
determinand associated with cellular biological material, which apparatus
comprises:
(a) means for applying an AC electrical potential at one or more discrete
frequencies to cellular biological material;
(b) means for determining a response of the material at one or more
frequencies
which were substantially absent from the applied AC potential; and
(c) means for comparing the response to a stored characteristic of the
determinand.
The~~terminand may be a concentration or other variable in cellular biological
material (such as viable or living tissue in, for example, an animal, such as
a human animal).
An example of a preferred determinand is glucose concentration. The response
obtained at
one or more frequencies absent from the applied AC potential is referred to as
a non-linear
dielectric spectrum, as described in more detail in the above U.K.
specification.
WO 93/18402 PCT/GB93/00458
The apparatus according to the invention can be used, by way of example, in
a method of monitoring the ability of living or viable cell maeerial to
transduce exogenous
electric field energy. We have discovered that the particular harmonics
present in the non-
linear dielectric spectrum obtained from a cellular biological material are
indicative of the
metabolic state of living cells in the biological material.
The means for applying an AC potential preferably comprises a plurality of
appropriate electrodes, a coil or the like, generally of known type; the
electrodes are
preferably arranged to be substantially flush with the skin of a patient so
that the apparatus
can be used for non-invasive monitoring of physiological parameters of the
patient.
The means for determining a response of the material at one or more
frequencies which were substantially absent from the applied AC potential may
be
substantially as described in the abovementioned prior specification.
It is therefore not necessary according to the invention to provide a
reference
non-linear dielectric spectrum; the apparatus may be calibrated by techniques
described
hereinafter for a f rst subject, and then used for further subjects of the
same general type.
The apparatus according to the invention is preferably provided with means
for obtaining a detectable signal, which may, for example, include a chart
recorder, screen
display, digital display or digital readout.
The mode of operation of apparatus according to the invention, in the method
according. to the invention, will now be described; by way of illustration, in
more detail.
When a field of appropriately low frequency is applied to cellular biological
material
contained between two or more macroscopic electrodes or within a coil, the
charging of the
membrane capacitance may cause an effective "amplification" of the macroscopic
field across
the membrane. In certain cases in which the membrane of interest contains
appropriate
enzymes, this can cause performance of useful biological work in ~a field- and
frequency
dependent fashion. A general mechanism underlying this effect is that enzymes
are not
dipolar "billiard balls;' and can relax between different conformations, some
of which may
_._
and some of which may not have different vectorial dipole moments from each
other.
The electrical potential applied to the biological material may comprise a
relatively high field applied to excite the material and a relatively low
probing AC voltage
to register the field-dependent dielectric properties of the material,
WO 93/18402 ~ ~ ~ ~ ~ ~ ~ PCT/GB93/00458
_ .;_
It is preferred to use a sinusoidal AC field to excite the material and the
entire
frequency range of interest is observed by performing a transformation to see
the extent to
which the non-linearities of the biological material are manifest by the
generation of
harmonics. By varying the frequency and amplitude of the exciting current, a
multi-
dimensional non-linear dielectric spectrum can be built up which can act as a
dielectric
fingerprint of the sample under test.
Preferably the frequency of the excitation signal is below the range in which
~i-dispersion of~the dielectric permittivity of the test material occurs.
Typically therefore the
excitation signal frequency is a maximum of 100 kHz (preferably a maximum of 1
kHz).
Also, typically the excitation signal has a peak-to-peak value of 20 volts
(preferably 4 volts):
typically the outer electrodes are 2cm apart giving a field strength of ~5
volts/cm for a
signal of 20 volts peak-to-peak (or ~ 1 volt/cm for a signal of 4 volts peak-
to-peak).
Membrane proteins (typically in living tissue) are particularly powerful
candidates for interacting with electrical fields for a variety of reasons,
including the
following: (i) the membrane protein cannot rotate from one side of the
membrane to the other
and dissipate electrical energy by simple Debye-like rotation of this type;
(ii) as described
above, the membrane can "amplify" the exciting signal; and (iii) membrane
proteins have
substantial dipole moments. In addition, of course, in common with all
proteins, they can
effect transitions between different conformational states possessing
different dipole moments.
Thus in seeking a mechanistic basis for the remarkable generation of non-
linear dielectric
spectra that we have observed one is led to consider the membrane properties
of cell material
present in the biological material under test.
The apparatus is arranged to apply an electrical potential of one or more
initial frequencies to the biological material, and to measure the response of
the material at
at least one response frequency substantially absent from (substantially not
overlapping with)
the initial frequency or frequencies. In some embodiments, the electrical
potential comprises
a relatively high fie_ld.applied to excite the system, and a relatively low
probing AC voltage
to register the field-dependent dielectric properties of the biological
material.
In the apparatus according to the invention, the abovementioned potential is
preferably sinusoidal, and the entire frequency range of interest is
preferably observed by
performing a translation or vector transformation to ascertain the extent to
which the non-
linearities of the material are manifest by the generation of harmonics.
CA 02127355 2003-04-14
-4-
Other features of the apparatus according to the invention, and its mode of
use
may be substantially as described in our prior U.K. specification 2247530, as
referred to
above.
Features of the invention will now be described, by way of example only, with
reference to the accompanying drawings, in which:
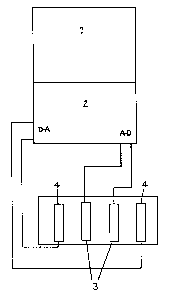
Figure 1 shows, schematically, certain features of exemplary apparatus
according to the invention; and
Figures 2 to 7 show results achieved in exemplary analyses using method and
apparatus according to the invention.
In the embodiment shown in Figure 1, an AC potential of predetermined
frequency is applied by generator 2 via digital-to-analogue conversion D-A
between an outer
pair of electrodes 4 in order to excite the system, and cause an alternating
potential to arise
between an inner pair of electrodes 3. The AC potential arising between the
inner pair of
electrodes includes harmonics of the excitation frequency. A computer 1
carries out a
Fourier transformation on the signal received from the inner pair of
electrodes via analogue-
to-digital conversion A-D, to determine the power levels at the first five
(for example)
harmonics. The process is repeated with different voltages of the excitation
signal, and then
at different excitation frequencies.
The excitation signal may consist of a sinusoidal waveform. Alternatively the
excitation signal may consist of a relatively high DC with a relatively low AC
component
superimposed on it.
In order that features of the present invention may be more fully understood,
the following examples are given by way of illustration only.
In the examples, non-linear dielectric spectroscopy was carried out largely as
described in U.K. patent specification 2247530, using in this case a matrix of
5 voltages
(zero-to-peak (as measured on the outer electrodes of apparatus as illustrated
in Figure 1) and
9 frequencies (in Hz), as follows:
0.500000
0.750000
1. 000000 Voltages
1.250000
1.500000
WO 93/18402 PCT/GB93/00458
2~.~'~:~ ~5
_>_
10. 000000
17.782794
31.622777
56.234133
100.000000 Frequencies
' 177.82?941
316:227766
562.341325
1000.000000
A sweep consisted of 45 individual spectra, averaging each for 10 blocks.
Further sweeps were taken at appropriate intervals. The sampling rate at the
inner electrodes
was adjusted to be 16 times the value of the frequency applied, such that no
windowing was
needed and after (Fourier) transformation the power in each consecutive
harmonic appears
in each consecutive bin. To avoid the need for a reference run (without
cells), the following
procedure was adopted. The data matrix, consisting of the powers in each of
the first S
harmonics .(including the fundamental) at each voltage and frequency, was
subjected to
multivariate calibration using the partial least squares (PLS) algorithm,
fully cross-validated
by the leave-one-out method. Such multivariate calibrations are well known to
those skilled
in the chemometric art.
xm
A spot was marked on a human subject's forearm to ensure repeatable
placement of a probe with flush electrodes on subsequent sweeps. The probe was
also
marked to ensure repeatability of orientation. Before each spectrum was taken,
the probe
was moistened in 150 mM NaCI to ensure good electrical coupling.
The first two experiments (3 figures) were carried out as follows. Baseline
swaps were taken after the subject had eaten no food for 16 hours, using the
same voltages
and frequencies as above. Glucose measurements were taken on finger-pricked
blood with
an optical blood glircose monitoring instrument commercially available under
the trade mark
"Reflolux" as the reference method. About 100g of glucose were given orally,
and further
sweeps taken at approx one minute intervals, checking with the Reflolux
instrument every
minutes and interpolating these reference readings. To improve the ability of
the
calibration models to generalise, an iterative method for removing outliers
was performed,
as follows. First the data from a given run (run 1, me8) were used to make the
best model,
WO 93/18402 ~ ~ PCT/GB93100458
21~'~3~~
-6-
as judged by cross-validation, leave-one-out self-prediction. The model was
used to predict
run 2 (me7), and then the points chosen that are closest (within 0.5 mM) to
the 1: I line and
the others assumed to be real outliers, i.e. bad data. These "good points"
were then used
to make a new model, again the best as judged by cross-validated, leave-one-
out self-
prediction. Finally, a calibration model was formed on the first run with
outliers removed
according to the revised prediction from the second run. The data for the self
model so
formed, fully cross validated, using 2 PLS factors, are shown in Figure 2.
Figure 3 shows the predictions from a calibration model of the same data
produced on alternate (odd-numbered) points predicting the even-numbered
points from the
same run.
Figure 4 shows the prediction of the pruned dataset of me7 as predicted from
the model formed on the pruned dataset of me8.
Data was acquired from a separate (and diabetic) subject, who had just eaten
a meal, his blood glucose followed using the Reflolux instrument and non-
linear dielectric
spectra acquired exactly as above. The same calibration model as above (formed
on the first
subject) was used to predict blood glucose data from the second subject (when
these were
within the range that had been covered by the calibration model), as shown in
Figure 5 (in
which the dotted lines show accuracies of ~ 10%, the claimed best precision of
the reference
method).
Finally, a combined modet was produced for a separate pair of subjects (one
diabetic, one non-diabetic). Figure 6 shows the self-calibration, fully cross-
validated, using
PIS factors, whilst Figure 7 shows the predictions using data from the same
subjects but
which had not been included in the calibration model. In each case, the solid
line is the line
of identity whilst the dotted lines are identity ~ 10%. This shows that the
method according
to the invention has excellent predictive power.