Note : Les descriptions sont présentées dans la langue officielle dans laquelle elles ont été soumises.
CA 02743820 2011-06-21
SEEDING APPARATUS AND METHOD OF DETERMINING
A SEED SPACING VARIABILITY VALUE
Cross Reference to Related Applications
This application claims priority from provisional application number
61/361,156, filed 02 July 2010.
Brief Description of the Drawings
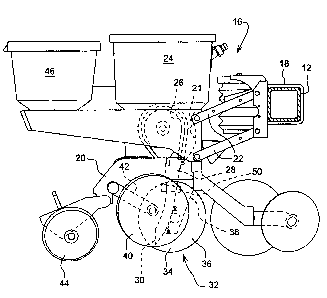
Fig. 1 is a side view of a planter and row unit;
Fig. 2 is a plan view of a seed monitor housing and visual display
illustrating a
row unit seed spacing information;
Fig. 3 is a plan view like Fig. 2 of a seed monitor housing and visual display
illustrating alternative row unit seed spacing information;
Fig. 4 is a plan view like Figs. 2 and 3 of a seed monitor housing and visual
display illustrating yet another alternative row unit seed spacing
information;
Fig. 5 is a plan view of the seed monitor housing and visual display
illustrating
planter and sectional seed spacing information;
Fig. 6 is a portion of a field map of seed spacing information; and
Fig. 7 is a portion of a field map of harvest yield information.
Detailed Description
Agronomic research has indicated the importance of proper seed spacing for
optimal yields in certain crops such as corn. However, producers, i.e.
farmers, have
not had a method of accurately determining seed spacing while planting, when
there
is an opportunity to take corrective action if there are any performance
issues.
Rather, producers had to wait until the plants emerged and then evaluate
planter
performance in terms of seed spacing. At best the producer could learn from
the
current crop to make improvements in planting the next year.
With reference to Fig. 1, a seeding apparatus in the form of a planter
is shown. Planter 10 includes a tool bar 12 as part of a planter frame.
Mounted to
the tool bar at spaced locations along the tool bar are multiple planting row
units 16,
only one of which is shown. The row unit 16 is mounted to the tool bar 12 by U-
bolts
18. The row unit 16 is provided with a frame member 20 having a pair of
upwardly
CA 02743820 2011-06-21
extending arms 21 at the forward end thereof. The arms 21 connect to a
parallel
linkage 22 for connecting the row unit 16 to the tool bar 12 for up and down
relative
movement therebetween in a known manner. Seed is stored in seed hopper 24 and
provided to seed meter 26. The seed meter singulates seed from the hopper and
sequentially discharges seeds. From the seed meter 26, the seed is dropped
through
a seed tube 28. The lower end 30 of the seed tube is positioned just above a
seed
trench formed in the soil by a trench opener 32. The trench opener 32 consists
of a
pair of disks 34 that are mounted on axes inclined to one another such that
the disks
34 meet at a point 36 at the tower front portion of the disks. The disks 34
are
mounted to a downwardly extending arm 38 of the row unit frame member 20. The
seed tube 28 is disposed immediately behind the arm 38, between the two disks
34
of the trench opener. Gauge wheels 40 are positioned one on each of the outer
sides
of the opener disks 34 and are positioned slightly rearward of the disks 34.
The
gauge wheels 40 are mounted to the: row unit frame by arms 42 pivotally
connected
to the frame member 20. A gauge wheel adjustment mechanism (not shown)
enables of the vertical position of the gauge wheels 40 to be adjusted
relative to the
opener disks 34. This establishes the depth to which the openers are inserted
into
the soil, i.e. the depth of the seed trench.
Seed drops through the open lower end 30 of the seed tube into the
trench formed by the opener 32. A pair of closing wheels 44 are mounted to the
frame member 20 rearward of the gauge wheels 40. The closing wheels 44 are
also
mounted on axes inclined to one another. The closing wheels push on the side
walls
of the seed trench to a close the trench over the seed therein. A chemical or
fertilizer
hopper 46 may also be provided on the row unit. The large seed hopper 24 may
be
replaced with a mini-hopper mounted to the seed meter and supplied with seed
by a
central seed delivery system. The row unit 16 is only shown to illustrate the
planter,
the particular structure of the row unit and meter can vary. Any of several
types of
structures can be used.
A seed sensor 50 is mounted to the seed tube 28. In response to seeds
passing the sensor, the sensor generates a seed signal. A seed monitor 60 is
provided at the operator station, typically in a towing vehicle, such as a
tractor. The
2
CA 02743820 2011-06-21
monitor 60 includes a visual display 62. A monitor 60 has a housing 61 that
also
contains a processor 63 and memory 65 therein, shown as being beneath the
display 62. The seed sensor 50 is operably coupled to the monitor 60 either by
an
electrical wire, fiber-optic cable, wireless communication device, etc. to
communicate
the generated seed signals from the sensor 50 to the monitor 60. Sensor 50 can
be
located anywhere downstream of the seed meter to sense passing seed.
The processor is configured or programmed to process the seed signals to
determine therefrom a seed spacing variability value. One way to do so is to
use the
time interval between seed signals. To do this, the seed monitor records the
time
between each seed signal for each row of the planter equipped with a sensor.
The
time interval between each seed signal is then calculated. The seed monitor
determines the seed spacing variability value for each sample period, such as
one
second. Sample periods of other lengths can also be used. The seed monitor
counts
the number of seed signals in each one second period and records the time
interval
between each seed signal. The number of seed signals and the time between each
signal together with the planter travel speed are then used to determine the
seed
spacing variability value (SSW). The seed spacing variability value can also
be
determined using seed location data versus time intervals. In this case, the
location
of the row unit is recorded for each seed signal. The distance between
adjacent
seeds is then determined by comparing the locations of the adjacent seeds. The
spacing, or distance, between seeds in the sample period is then used to
determine
the SSW. The location of the row unit for each seed signal is determined from
a
localizing system such as GPS, the use of which is well know in agricultural
applications.
Three different example seed spacing variability value calculations are
described below. It is possible to calculate other values which are within the
meaning
of the claimed "seed spacing variability value." The three seed spacing
variability
values described below include: 1) the standard deviation; 2) the coefficient
of
variation (CV); and 3) the coefficient of uniformity (CU). The monitor may
also
receive a speed signal for the speed of the planter during the sample period
and
convert the time interval into seed spacing distance if desired.
3
CA 02743820 2011-06-21
A sample set of seed signal data is provided and used in all three
calculations
below of a seed spacing variability value. A population rate of 34,848 seeds
per acre
with 30 inch row spacing produces a desired seed spacing of six inches. The
following table shows a series of seed signals, the time between signals and a
calculated seed spacing distance based on the time and the planter speed
input, in
this example, five miles per hour. At the given speed and seed spacing, the 15
seed
signals below is the number of seeds signals in one second sample period.
Time Spacing
Seed Signal (sec) inches
1
2 0.0455 4.0
3 0.0909 8.0
4 0.0515 4.5
0.0725 6.4
6 0.0805 7.1
7 0.0765 6.7
8 0.0495 4.4
9 0.0841 7.4
0.0555 4.9
11 0.0848 7.5
12 0.0455 4.0
13 0.0901 7.9
14 0.0485 4.3
0.0798 7.0
Seed Spacing Variability Value - Method I
The seed spacing variability value (SSW) when using the standard deviation
is:
SSVV = SD
where SD is the normal statistical calculation for standard deviation, which
is:
SD (X-M)z
n-1
where J= sum of
X = individual values
4
CA 02743820 2011-06-21
M = mean of the individual values
n = sample size
Using the.sample data above with the time between seed signals:
SSVV = SD = 0.0178 sec.
Using the spacing data:
SSW = SD = 1.56 inches
Seed Spacing Variability Value - Method 2
The seed spacing variability value, SSW, using the coefficient of variation
(CV) is:
SSVV = CV = SD IM
where SD = standard deviation as calculated above
M = mean of the individual values
This is a dimensionless number, and thus is the same for the time data and the
spacing data. With the above data:
SSVV = CV = 0.2604
Seed Spacing Variability Value - Method 3
The seed spacing variability value, SSW, using the coefficient of uniformity
(CU) is:
YIx-M)
SSW=cu= nM
where X = the individual values
M = the mean if the individual values
n = the sample size
CA 02743820 2011-06-21
With the above data, the CU = 0.237. Again, since this is a dimensionless
value, the
CU is the same with both the time interval data and the seed spacing data.
The seed spacing variability value when using the CV or CU can be
expressed as:
SSVV = 1- CV
or
SSVV 1-CU
This may be a more natural value for the operator with I being the optimum in
terms
of no variation in seed spacing. Alternatively, the SSW can be expressed as a
percentage by:
SSVV 100(1- CV)
or
SSVV = 100(1-CU)
with 100% being the optimum with no variation.
When using the CV or the CU, the same degree of variability in seed spacing,
in terms of how far the seeds are from the desired location, will produce the
same
SSW regardless of the seed population, i.e. the desired spacing. Thus, an
operator
can compare planter performance from field to field where the populations
differ.
With standard deviation however, the same variation will produce a different
standard deviation for different populations. This makes it harder to compare
between different fields. However, the studies conducted to determine the
effect of
seed spacing variability on yield, generally use the standard deviation since
within
each study, the population is typically the same for all test plots. As a
result, an
operator may prefer to use the standard deviation for the SSW so the SSW can
be
compared to test data.
Once calculated, the seed spacing variability value, SSW, is displayed to the
operator in real time, that is, during the planting operation, as the seed
spacing
variability values are calculated. The SSW display could be refreshed each
sample
period. Alternatively, the display could be refreshed less often with the most
recent
SSW being displayed each time it is refreshed. As another alternative, the
seed
6
CA 02743820 2011-06-21
spacing variability values could be averaged over a larger time period than
one
sample period, for example, ten seconds, or ten sample periods, and the
average
number displayed. This would avoid refreshing the display too often for the
operator
to make sense of the constantly changing data. With reference to Fig. 2, a
sample
display of the seed spacing variability is shown. On the visual display 62, a
seed
spacing window 64 is shown providing the seed spacing variability value as the
standard deviation in inches. This sample is for a particular row identified
as row 1.
The standard deviation could also be provided in time. Fig. 3 shows the row 1
detail
in which the seed spacing variability value is expressed in terms of the CV.
Fig. 4
shows the row 1 detail in which the seed spacing variability value is
expressed in
terms of the CU.
In figure 5, a planter detail screen is shown in which the SSW is provided for
each row of a 16 row planter. An upper window 66 displays a bar chart showing
the
SSW for each row of the planter. The window 68 provides a planter composite
seed
spacing variability value for the entire planter in terms of CV. The planter
composite
seed spacing variability value can be determined one of two ways. One way is
to
average the seed spacing variability values of each row. The other way is to
calculate a seed spacing variability value by using the seed.signals from all
rows
during the sample period.
Windows 70 and 72 provide a section composite seed spacing variability
value for a section of the planter. Section 1 represents rows 1-8 of the
planter and
shows the section composite seed spacing variability value for those rows.
Window
72 shows section 2 of the planter, comprising rows 9-16. The section composite
seed spacing variability values can be calculated in the same way as the
planter
composite seed spacing variability value, by calculating an average the seed
spacing
variability values for the selected rows or by using the seed signal data from
the
selected rows to calculate the composite values.
Window 74 provides a high and low row seed spacing variability value. By
knowing which row unit has the worst seed spacing performance, the operator
can
identify possible performance issues with that row and take corrective action.
Other
information (not shown) provided on the display can help the operator diagnose
the
7
CA 02743820 2011-06-21
problem and determine the proper corrective action.
The seed spacing variability values for each sample period are stored in the
seed monitor 60 memory 65. Location data for the apparatus is also collected.
This
can be most easily done by global positioning system (GPS) geo-reference
position
data. However, other types of location data can be collected such as but not
limited
to, an in field localization that determines relative location of the planter
for each
seed signal relative to point in the field versus a global location. The
location data for
each sample period is stored in the memory 65 and is associated with the SSW
for
that sample period. The SSW data and the location data are later used to
generate
a planting field map of the seed spacing variability values for the field.
Each sample
period represents one pixel 76 of the field 78 shown in Fig. 5. The pixel
represents of
the width of the total planter or the width of each section of the planter by
the length
of the field traveled therein in the sample time. In the example above, the
sample
period is one second, which at 5 miles an hour, is approximately 7.3 feet. A
similar
map of the field of 78 is produced during harvest of the subsequent crop
showing the
yield for each pixel 80 of the field. Crop yield data is stored in a memory
during
harvest for use in creating a harvest field map of the yield data. The size of
each
pixel 80 of the harvest data will be determined by the data collection rate of
the
harvester. By analyzing, i.e. comparing, the planting field map and the
harvest field
map, either manually or by a computer with appropriate software, the producer
can
begin to correlate seed spacing variability with yield. Over time, the
producer can
determine what level of seed spacing variability is acceptable or achievable.
Furthermore, the producer has the data to make decisions about changes in the
planting operation knowing how those will affect seed spacing variability and
thus the
yield. Pixels 76 of the SSW data can be combined to better match the pixels 80
of
the yield data. Conversely, if needed, the pixels 80 of the yield data can be
combined
to better match the planter SSW data. The rows selected to provide sectional
data
are chosen to form sections that match the width of the harvester so that
pixel width
of the planter SSW data matches pixel width of the harvester data. The
planting
field map could be based on the row unit seed spacing variability values, the
section
composite seed spacing variability values, or the planter composite seed
spacing
8
CA 02743820 2011-06-21
variability values. However, the most useful data to compare with the harvest
field
map will be planting seed spacing variability value data for a width of the
planter
matching a width of the harvesting machine since the harvest yield data is
generated
over the entire width of the harvesting machine. Given that harvester
technology may
change, any width of the planter, from a single row, multiple rows or the
entire
planter can be used to generate a planter field map. Thus, as used herein and
in the
following claims, "section composite seed spacing variability value" can be a
selected single row, selected multiple rows or all rows of the planter.
While the processor 63 and memory 65 are shown and described above as
being contained in the housing 61 of the monitor 60, the invention as claimed
is not
limited to this arrangement. The processor or memory can be located remote
from
the monitor. Furthermore, multiple processors and memory devices can be used
and
shall be included in the terms "processor" and "memory" as used herein and in
the
following claims.
Having described the preferred embodiment, it will become apparent that
various modifications can be made without departing from the scope of the
invention
as defined in the accompanying claims.
9