Note : Les descriptions sont présentées dans la langue officielle dans laquelle elles ont été soumises.
CA 02746705 2011-06-13
WO 2010/069378 PCT/EP2008/067815
1
Method and device to supervise a power network
The invention is related to a method and a device to supervise a power
network,
where graphical data representing at least a part of the power network are
processed
by a data processing unit, the processed graphical data are displayed on a
graphical
display unit as a first visualization of the power network at a less detailed
zoom level
and where a user request on how to modify the first visualization is processed
by the
data processing unit, the user request being received from a user input unit.
In the art, different tools are known with which a power network can be
supervised.
Under the term power network, various network configurations can be
summarized,
depending on the kind of systems which are connected via the network and
depending on the voltage level on the network lines. Such power networks are
for
example:
= a power generation network interconnecting dispersed energy generation units
and energy storage utilities,
= a power distribution network interconnecting power consumer utilities at
a
lower voltage level and
= a power transmission network interconnecting power generation facilities
with
power distribution networks at a higher voltage level.
All these different types of power networks need to be continuously monitored
and
controlled, which is done partly automatically but also partly with the help
of human
supervisors which use a network supervising tool in order to get information
on the
status of the power network and in order to interact with the power network by
communicating with external control systems connected to the power network. In
general, such tools to supervise a geographically distributed system like a
power
network are summarized under the term SCADA (Supervisory Control And Data
Acquisition).
One supervising tool for power networks on the market is Network Manager by
ABB.
This tool has a graphical user interface (GUI) which presents the supervisor
of the
CA 02746705 2011-06-13
WO 2010/069378 PCT/EP2008/067815
2
power network with all the data he needs to perform his monitoring task. Via
the GUI,
the supervisor or user may input data by using a text input unit, such as a
keyboard,
or by using a selection device, such as a mouse or a trackball. The data input
by the
user are processed by Network Manager and the processed results are either
output
on the GUI or sent to external systems for storing, further processing or for
performing
actions on the power network.
One way known in the art to represent data related to the power network is a
so called
world map. In such a world map, the power network is shown in a graphical
visualization of its geographical distribution, by showing the main objects of
the power
network, such as power plants, substations and considerable loads, in the form
of
symbols and by showing the power transmission or distribution lines between
these
objects in form of links connecting the symbols. An example of a world map
shown in
the Network Manager can be seen in figure 5 of "Mapping the weakest link" by
Mats
Larsson et. al, ABB Review 1/2007, pp. 44-48.
The world map is zoomable, where the user can continuously choose which area
of
the world map he or she would like to see at which zoom level. The combination
of
adjusting the zoom level and choosing the area in the zoomed-in map which
should
be visible on screen is known as "zoom and pan". In order to help the user not
to lose
the overview of which area of the world map is currently shown, it is known in
the art
to display a small overview window in addition to the zoomed-in window, where
in the
overview window a small representation of the zoomed-out world map is seen
with a
rectangle on top of it which marks the zoomed-in area. The rectangle moves
over the
world map in the overview window synchronously with any panning performed by
the
user.
The opportunity to choose the zoom level and pan position freely and
continuously is
not always experienced as an advantage. For example, if the supervisor of a
power
network needs to monitor frequently and repeatedly the same different parts of
the
network, the zoom and pan every time can become quite tedious and time
consuming.
The concentration of the supervisor is unnecessarily bound to the task of zoom
and
pan instead of being focused on the actual status of the power network.
CA 02746705 2011-09-12
3
Another known way to navigate inside a world map is the possibility to jump
between
different displays and thereby between different views of the whole map or of
portions
of the map. With every jump, a new graphical window opens showing the
requested
view. In this solution, no time-consuming zoom and pan is necessary, but
instead it
may happen that a considerable number of windows are opened after some
operational time, thereby making it difficult to maintain an overview of what
is
happening in each window and to recognize which window was opened coming from
which window, i.e. which window is owned by which.
It is therefore an object of the invention to provide a method and a device to
supervise
a power network with which the task of a supervisor is facilitated.
This object is achieved by a method and a device as described herein.
More specifically, the present invention provides a method to supervise a
power
network, where
data representing at least a part of the power network are processed and
transformed into graphical data;
the graphical data are displayed on a graphical display unit as a first
visualization of the power network at a first zoom level;
a user request on how to modify the first visualization is processed,
where the user request is received from a user input unit;
at least two selectable elements, which are selectable via the user input
unit and which are assigned to predefined portions of the power network and to
at
least one second zoom level, the at least one second zoom level being more
detailed than the first zoom level, are displayed in the first visualization;
after a user request is received indicating that one of the two selectable
elements was selected by a user, the predefined portion of the power network
assigned to said one of the two selectable elements is displayed at the
corresponding second zoom level as a second visualization on top of the first
visualization; and
when a user request is received which indicates that the other of the two
selectable elements was selected, the predefined portion of the power network
assigned to the other of the two selectable elements is displayed as a third
visualization at the corresponding second zoom level,
wherein the second visualization is placed close to but not covering the
corresponding selectable element and thereafter replaced by the third
visualization at the same position.
CA 02746705 2013-09-04
3a
The present invention also provides a device for supervising a power network
comprising:
a data processing unit to process data which represents at least a part of
the power network and to transform them into graphical data;
a graphical display unit to display the graphical data as a first
visualization of the power network at a first zoom level; and
a user input unit to send user input data to the data processing unit,
where the user input data represents a user request on how to modify the first
visualization,
wherein the first visualization comprises at least two selectable elements
which are selectable via the user input unit and which are assigned to a
predefined portion of the power network and to a second zoom level the second
zoom level being more detailed than the first zoom level,
wherein, when the data processing unit receives a first user request
which indicates that one of the at least two selectable elements was selected
by a
user, the data processing unit causes the graphical display unit to display
the
predefined portion of the power network assigned to said one of the at least
two
selectable elements at a corresponding second zoom level as a second
visualization on top of the first visualization,
wherein, when the data processing unit receives a second user request
which indicates that a second of the at least two selectable elements was
selected by the user, the data processing unit causes the graphical display
unit to
display the predefined portion of the power network assigned to the second of
the
at least two selectable elements as a third visualization at a corresponding
second zoom level, and
wherein the data processing unit causes the graphical display unit to
place the second visualization close to but not covering the corresponding
selectable element and there after replace the second visualization by the
third
visualization at the same position.
The present invention also provides a method to supervise a power network,
where
data representing at least a part of the power network are processed and
transformed into graphical data;
the graphical data are displayed on a graphical display unit as a first
visualization of the power network at a first zoom level;
CA 02746705 2014-03-21
3h
at least two selectable elements, which are selectable via a user input unit
and which are assigned to predefined portions of the power network and to at
least
one second zoom level, the at least one second zoom level being more detailed
than the first zoom level, are displayed in the first visualization;
a first user request by a user to modify the first visualization by selecting
one of the at least two selectable elements is processed, where the first user
request is received from the user input unit;
after the first user request is received indicating that one of the at least
two
selectable elements was selected, the predefined portion of the power network
assigned to said one of the at least two selectable elements is displayed at
the
corresponding second zoom level as a second visualization on top of the first
visualization; and
when a second user request is received which indicates that a second of
the at least two selectable elements was selected, the predefined portion of
the
power network assigned to the second of the at least two selectable elements
is
displayed as a third visualization at the corresponding second zoom level,
wherein the second visualization is placed close to but not covering the
corresponding selectable element and thereafter replaced by the third
visualization
at the same position.
The present invention also provides a method to supervise a power network,
where
data representing at least a part of the power network are processed and
transformed into graphical data;
the graphical data are displayed on a graphical display unit as a first
visualization of the power network at a first zoom level;
at least two selectable elements, which are selectable via a user input unit
and which are assigned to predefined portions of the power network and to at
least
one second zoom level, the at least one second zoom level being more detailed
than the first zoom level, are displayed in the first visualization;
a first user request by a user to modify the first visualization by selecting
one of the at least two selectable elements is processed, where the first user
request is received from the user input unit;
after the first user request is received indicating that one of the at least
two
selectable elements was selected, the predefined portion of the power network
assigned to said one of the at least two selectable elements is displayed at
the
corresponding second zoom level as a second visualization on top of the first
visualization; and
CA 02746705 2014-03-21
3c
when a second user request is received which indicates that a second of
the at least two selectable elements was selected, the predefined portion of
the
power network assigned to the second of the at least two selectable elements
is
displayed as a third visualization at the corresponding second zoom level,
wherein the second visualization is placed closer to the one of the at least
two selectable elements of the first visualization than the other of the at
least two
selectable elements of the first visualization, but not covering the one of
the at
least two selectable elements of the first visualization and thereafter
replaced by
the third visualization at the same position.
The present invention also provides a device for supervising a power network
comprising:
a data processing unit to process data which represents at least a part of
the power network and to transform them into graphical data;
a graphical display unit to display the graphical data as a first
visualization
of the power network at a first zoom level; and
a user input unit to send user input data to the data processing unit, where
the user input data represents a user request on how to modify the first
visualization,
wherein the first visualization comprises at least two selectable elements
which are selectable via the user input unit and which are assigned to a
predefined
portion of the power network and to a second zoom level the second zoom level
being more detailed than the first zoom level,
wherein, when the data processing unit receives a first user request which
indicates that one of the at least two selectable elements was selected by a
user,
the data processing unit causes the graphical display unit to display the
predefined
portion of the power network assigned to said one of the at least two
selectable
elements at a corresponding second zoom level as a second visualization on top
of
the first visualization,
wherein, when the data processing unit receives a second user request
which indicates that a second of the at least two selectable elements was
selected
by the user, the data processing unit causes the graphical display unit to
display
the predefined portion of the power network assigned to the second of the at
least
two selectable elements as a third visualization at a corresponding second
zoom
level, and
wherein the data processing unit causes the graphical display unit to place
the second visualization closer to the one of the at least two selectable
elements of
the first visualization than the other of the at least two selectable elements
of the
first visualization, but not covering the one of the at least two selectable
elements
CA 02746705 2014-03-21
3d
of the first visualization and thereafter replace the second visualization by
the third
visualization at the same position.
According to the invention, there is displayed in the first, less detailed,
visualization
of the power network at least one selectable element which is selectable via
the
user input unit and which is assigned to a predefined portion of the power
network
and to a more detailed zoom level. After a user request is received which
indicates
that the selectable element was selected by a user, the predefined portion of
the
power network is displayed at the more detailed zoom level as a second
visualization. This second visualization is placed on top of the first
visualization.
In the device according to the invention, the above described user request
indicating that the selectable element was selected is received by the data
processing unit from the user input unit. The data processing unit then causes
the
graphical display unit in response to that user request to display the
predefined
portion of power network at the more detailed zoom level.
In other words, a selectable element is presented in the zoomed-out map of the
power
network which after its selection leads to the display of a pre-selected area
of the map
at a pre-selected more detailed zoom level on top of the zoomed-out map.
Thereby,
CA 02746705 2011-06-13
WO 2010/069378 PCT/EP2008/067815
4
zoom and pan becomes unnecessary. Instead, just one selection action ¨ usually
a
mouse-click ¨ is necessary to directly get a zoomed-in visualization. This
simplifies
the monitoring and control task for the supervisor, since valuable operation
time is
saved and can be spent on more important issues.
Besides, the result of the one selection action is absolutely reproducable,
i.e. the
visual impression the supervisor gets from the same area or portion of the
power
network remains the same for each time he takes a zoomed-in look at it. This
will
make comparisons of the status of that area at different points in time
easier, since
differences should mainly been due to differences in status rather than
differences in
the way the area is displayed.
In addition, the number of visible windows on the screen remains the same, as
the
zoomed-in portion of the map is placed on top of the zoomed-out map, thereby
keeping the map display straightforward and easily manageable. For example it
is
easily recognizable that the second visualization is owned by the first
visualization,
and the amount of visible information is limited to the two different
visualizations.
In an embodiment of the invention, at least two selectable elements are
displayed in
the first visualization. After a first user request is received indicating
that one of the
two selectable elements was selected by the user, the predefined portion of
the power
network assigned to that one of the two selectable elements is displayed as a
second
visualization at the corresponding more detailed zoom level. Afterwards, when
a
further user request is received which indicates that the other of the two
selectable
elements was selected, the predefined portion of the power network assigned to
that
other of the two selectable elements is displayed as a third visualization at
the
corresponding more detailed zoom level, where the second visualization is
replaced
by the third visualization.
By keeping the number of displayed zoomed-in visualizations to one, the above
described advantages are achieved also in case for more than just one
selectable
elements. Accordingly, it becomes possible for the user to quickly and
effortlessly
switch between different zoomed-in visualizations, while at the same time the
visible
CA 02746705 2011-06-13
WO 2010/069378 PCT/EP2008/067815
information is limited. No extra user actions are necessary in order to close
windows
which were opened earlier.
In a further embodiment, the second visualization is placed on top of the
first
5 visualization close to but not covering the corresponding selectable
element. Thereby
it is achieved that the user still has an overview of where in the zoomed-out
visualization of the power network he currently was working. If in addition
the selected
element is identified by either marking it or by showing a link between the
selected
element and the zoomed-in visualization, the user has in addition the
possibility to
check if the correct element was chosen and where within the power network
this
element is situated.
In an even further embodiment, the second visualization is placed completely
inside
the first visualization, in order to keep the same arrangement of graphical
windows on
the GUI, no matter if the power network is visualized only zoomed-out or also
with one
additional zoomed-in visualization.
Advantageously, a user request indicating a requested zoom and/or pan action
is
disabled in the second visualization. Since the second visualization is
presented from
the beginning with a pre-selected zoom level and pan position, the look-and-
feel
would be destroyed if those two parameters would afterwards be changed by
hand,
might it just be by mistake. Especially the advantage with getting always the
same
reproducible visual information would be given up, if zoom and pan were
allowed.
In one embodiment of the invention, the same possible user requests are
attached to
the first and the second visualization, except that no selectable elements
which are
assigned to a predefined portion of the power network and to a more detailed
zoom
level are displayed in the second visualization. In other words, for each of
the two
graphical windows containing a visualization, the usual user actions as move,
resize,
hide, select items from menus etc are allowed. The only exception is that
within the
second visualization no further zoomed-in visualizations can be selected.
CA 02746705 2011-06-13
WO 2010/069378 PCT/EP2008/067815
6
In an alternative embodiment, such a selection would instead be allowed,
whereby at
least one selectable subelement is displayed. The subelement is selectable via
the
user input unit and is assigned to a predefined subportion of the power
network and to
an even more detailed zoom level. After a user request is received indicating
that the
selectable subelement was selected by a user, the predefined subportion of the
power
network at the even more detailed zoom level is displayed as a fourth
visualization on
top of the first visualization, replacing the second visualization. This
embodiment
allows further detailed representations of the power network by maintaining
the
general advantages of the invention, i.e. by maintaining the number of extra
windows
on top of the first visualization to one and by pre-selecting the zoom level
and pan
position.
Other features and advantages of the present invention will become more
apparent to
a person skilled in the art from the following detailed description in
conjunction with
the appended drawings in which:
Fig. 1 shows a simplified power network supervised from a SCADA
station,
Fig. 2 shows a simplified block diagram of the SCADA station of Fig.
1,
Fig. 3 shows a first visualization of the power network of Fig. 1,
Fig. 4 shows a second visualization on top of the first visualization
of Fig. 3,
Fig. 5 shows the method steps according to the invention performed by the
SCADA station of Fig. 2
The power network 1 shown in Fig. 1 would be classified as a power
transmission
network, since it comprises five substations 2 interconnected by high voltage
power
transmission lines 12. The five substations 2 are linked via data
communication
channels, which are shown as dashed lines, to a SCADA station, which in this
example is just one main computer 3. In bigger power networks, a SCADA station
could comprise several servers which itself could be part of a SCADA system
comprising several stations. The data communication channels are used for data
transfer in both directions, mainly to collect information from the
substations 2 about
their operational status and about the status of the transmission lines 12
connected to
the respective substation 2 and to transmit control information from the main
computer
3 to the substations 2.
CA 02746705 2011-06-13
WO 2010/069378 PCT/EP2008/067815
7
The main computer 3 shown in Fig. 2 comprises a data processing unit 4 to
process
all kinds of data, among others the status information collected from the
substations 2
and topology information about the setup of the power network 1. The data
processing
unit 4 is connected to a user input unit 6 in order to receive user input data
Ul. The
user input unit 6 can be any kind of known input device, such as a mouse
and/or a
keyboard and/or a trackball and/or the touch functionality of a touch screen.
The data
processing unit 4 is in addition connected to a graphical display unit 5. The
processed
status information and topology information are transformed by the data
processing
unit 4 into graphical data PG which represent the power network 1, and the
graphical
data PG are sent by the data processing unit 4 to the graphical display unit 5
where
they are displayed as a first visualization 7 of the power network 1 at a less
detailed
zoom level Zoom 1.
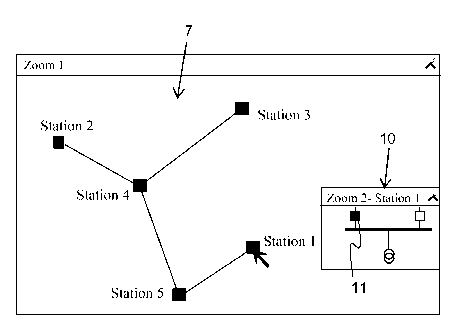
Such a first visualization 7 is shown in Fig. 3, where the substations 2 are
represented
by icons 9 interconnected by solid lines which represent the power
transmission lines
12. In the first visualization, each substation 2 is marked with a unique
name. The first
visualization 7 is represented in a graphical window 13 which allows the
common user
input actions as known in the art. This is indicated by the "close window"-
cross 14 in
the upper right corner of the menu bar 15. Such usual user input actions are
for
example moving and resizing the window 13, scrolling inside the window 13,
choosing
action items (not shown) in the menu bar 15 etc. A cursor 8 indicates that the
user
input unit 6 is connected and waiting for a user input.
The data processing unit 4 has attached to the icons 9 a selection function,
i.e. the
user may select each of the icons 9 by simply clicking on them. It is assumed
that the
user has selected icon 9 corresponding to the substation "Station 1". As a
result, a
second visualization 10 is opened in a second window and displayed on top of
the first
visualization 7, as shown in Fig. 4. In the second visualization 10, a
predefined portion
of the power network 1, which is the part which comprises the close
environment of
the substation "Station 1" and the substation itself, is represented in a more
detailed
zoom level Zoom 2. The zoom level Zoom 2 as well as the pan position, i.e.
which
portion of the power network 1 is to be shown, are both predefined parameters
which
CA 02746705 2011-06-13
WO 2010/069378 PCT/EP2008/067815
8
had been attached to the corresponding icon 9. In the example shown in Fig. 4,
the
second visualization 10 is presented close to the icon 9 of substation
"Station 1"
without hiding the icon, and the second visualization 10 is placed completely
inside
the first visualization 7. At the same time, there could be other windows
opened on the
graphical display unit 5, the presentation of whom would not be disturbed by
the
second visualization 10. In order to allow the user to adjust the arrangement
of the
second with respect to the first visualization, user input actions as moving
and resizing
the second visualization 10 are permitted.
The main steps performed by the data processing unit 4 when reacting on the
selection of icon 9 of "Station 1" are depicted in Fig. 5, where in step 16
the user
request to show substation "Station 1" in a more detailed representation is
received. In
the next step 17, the graphical data PG are generated, where the graphical
data PG
comprise all graphical information which is required in order to show the
second
visualization 10 of the substation at the correct zoom level and in the
correct position
on the screen and which is required to present the second visualization 10
with all the
functionality desired, which in this embodiment are the same user input
actions as
possible for the first visualization 7 except for any zoom or pan request. In
the
following step 18, the graphical data PG is sent to the graphical display unit
5 for
displaying.
If the user would, after having seen the visualization of "Station 1", want to
see
substation "Station 3" in further detail, he would have to click on the
corresponding
icon 9. As a result, the second visualization 10 would disappear and a third
visualization of the substation "Station 3" and its close environment would be
opened
and displayed at a more detailed zoom level, preferrably at the same position
as the
second visualization 10. In an alternative embodiment, the third visualization
could be
displayed at a position close to the icon 9 of substation "Station 3", i.e. a
little bit
further up to the upper right corner of the first visualization 7. This more
detailed zoom
level could be exactly the same as used for "Station 1", which would be
appropriate if
the area of the power network 1 to be shown would have approximately the same
size. But it could as well be any other zoom level which is more detailed than
the less
detailed zoom level Zoom 1.
CA 02746705 2011-06-13
WO 2010/069378
PCT/EP2008/067815
9
In the embodiment shown in Fig. 4, there is presented one part of the
substation
"Station 1" in the second visualization 10 as a selectable icon 11. If the
user clicks on
icon 11, the second visualization 10 is replaced by a fourth visualization
showing a
portion of the substation "Station 1" and thereby a subportion of the power
network 1
at an even more detailed zoom level.