Note : Les descriptions sont présentées dans la langue officielle dans laquelle elles ont été soumises.
CA 03077798 2020-04-01
WO 2018/081580 PCT/US2017/058789
DETECTION METHOD
CROSS REFERENCE TO RELATED APPLICATIONS
[0001] This application claims priority to U.S. Provisional Application
Serial No.
62/413,708, filed October 27, 2016, U.S. Provisional Application Serial No.
62/523,511, filed
June 22, 2017, and U.S. Provisional Application Serial No. 62/547,046, filed
August 17, 2017,
the disclosures of which are herein expressly incorporated by reference in
their entirety.
FIELD OF THE INVENTION
[0002] The present invention relates to the extraction of eukaryotic
nucleic acids from
stool samples and the use of the nucleic acids for diagnosis and treatment of
intestinal disease.
BACKGROUND
[0003] Gastrointestinal disorders, for example gastrointestinal cancer
and other digestive
diseases such as inflammatory bowel disease, irritable bowel syndrome, and
Crohn's disease are
widespread. In the US, gastrointestinal disorders are estimated to affect 60
to 70 million people
annually. For some disorders, early screening and diagnosis has resulted in a
reduction in
mortality rates and improved quality of life for the patients. However,
standard methods of
diagnosis, such as colonoscopy, are invasive, time-consuming, and are
associated with relatively
high costs. Gastrointestinal disorders can also affect animals, for example,
animals kept as pets,
such as cats and dogs. Veterinary methods of screening for such disorders are
similarly invasive
and costly. There is a continuing need for noninvasive methods of diagnosing
gastrointestinal
disorders in both humans and animals.
SUMMARY
[0004] Provided herein are materials and methods for isolating eukaryotic
nucleic acid
from a stool sample. The method can include the steps of mixing the sample
with a buffer, a
surfactant and a ribonuclease inhibitor to form a suspension; separating the
suspension into a
portion enriched for eukaryotic cells and a portion enriched for bacterial
cells and retaining the
portion enriched for eukaryotic cells; adding a chaotropic agent and
optionally a surfactant to the
portion enriched for eukaryotic cells to form a lysate; fractioning the lysate
into a cell debris
CA 03077798 2020-04-01
WO 2018/081580 PCT/US2017/058789
layer, a layer comprising eukaryotic nucleic acids and a lipid layer; and
collecting the layer
comprising eukaryotic nucleic acids and optionally the lipid layer. The stool
sample can be a
human or non-human animal stool sample. In some embodiments, the nonhuman
animal stool
sample can be a sample obtained from a dog or a cat. The method can further
include extracting
the eukaryotic nucleic acids from the collected layer comprising eukaryotic
nucleic acids. The
nucleic acid can include DNA, RNA, total RNA, mRNA, tRNA, rRNA, ncRNA, smRNA,
or sno
RNA, or a combination of any of DNA, RNA, total RNA, mRNA, tRNA, rRNA, ncRNA,
smRNA, or sno RNA.
[0005] Also provided are materials and methods for detecting a eukaryotic
biomarker in a
stool sample. The method can include the steps of analyzing the extracted
nucleic acid by
microarray sequencing, molecular barcoding, probe capture, polymerase chain
reaction (PCR),
ddPCR, RT-PCR, RT-qPCR, or nucleic acid sequencing. In some embodiments, the
eukaryotic
biomarker is selected from the biomarkers listed in Figure 6 (Panel A) or
Figure 13 (Panel B). In
some embodiments, the eukaryotic biomarker can be a B cell marker, a T cell
marker, or an
immunoglobulin.
[0006] Also provided are materials and methods for determining whether a
subject is at
risk for colorectal cancer. The method can include the steps of measuring the
level of expression
of two or more colorectal neoplasm biomarker genes selected from any of the
colorectal
neoplasm biomarker genes listed in Figure 6 (Panel A) or Figure 13 (Panel B)
in a biological
sample from the subject; comparing the measured expression level of the two or
more colorectal
neoplasm biomarker genes in the sample with the measured expression level of
the two or more
colorectal neoplasm biomarker genes in a control, wherein a difference in the
measured
expression level of the two or more genes in the biological sample relative to
the measured
expression level of the two or more genes in the control indicates that the
subject is at risk for
colorectal cancer. In some embodiments, the colorectal neoplasm biomarker
genes can be
contained within the 200 differentially expressed transcript clusters shown in
Figure 5A and
contained within the common pathways associated with colorectal cancer shown
in Figure 5B. In
some embodiments, the colorectal neoplasm biomarker gene can be selected from
the biomarkers
listed in Figure 6 (Panel A) or Figure 13 (Panel B).
2
CA 03077798 2020-04-01
WO 2018/081580 PCT/US2017/058789
[0007] Also provided are materials and methods for a clinical plan for a
subject having or
at risk for colorectal cancer. The method can include the steps of: measuring
the level of
expression of two or more colorectal neoplasm biomarker genes selected from
any of the
colorectal neoplasm biomarker genes listed in Figure 6 (Panel A) or Figure 13
(Panel B) in a
biological sample from the subject; comparing the measured expression level of
the two or more
colorectal neoplasm biomarker genes in the sample with the measured expression
level of the
two or more colorectal neoplasm biomarker genes in a control, wherein a
difference in the
measured expression level of the two or more genes relative to the measured
expression level of
the two or more genes in the control indicates that the subject has or is at
risk for colorectal
cancer; and selecting a clinical plan based on the a difference in the
measured expression level of
the two or more genes relative to the measured expression level of the two or
more genes in the
control indicates that the subject has or is at risk for colorectal cancer.
[0008] Also provided are methods and compositions for determining whether
a
nonhuman animal is at risk for a gastrointestinal disorder. The method can
include the steps of
measuring the level of expression of one or more B cell, T cell, or
immunoglobulin genes in a
biological sample from the subject; comparing the measured expression level of
the one or more
B cell, T cell, or immunoglobulin genes in the sample with the measured
expression level of one
or more B cell, T cell, or immunoglobulin genes in a control, wherein a
difference in the
measured expression level of the one or more genes in the biological sample
relative to the
measured expression level of the one or more genes in the control indicates
that the subject is at
risk for a gastrointestinal disorder. The gastrointestinal disorder can be
gastrointestinal
lymphoma or inflammatory bowel disease. The non-human animal can be a cat or a
dog. The
biological sample can be a stool sample.
BRIEF DESCRIPTION OF THE DRAWINGS
[0009] These and other features and advantages of the present invention
will be more
fully disclosed in, or rendered obvious by, the following detailed description
of the preferred
embodiment of the invention, which is to be considered together with the
accompanying
drawings wherein like numbers refer to like parts and further wherein:
3
CA 03077798 2020-04-01
WO 2018/081580 PCT/US2017/058789
[0010] Figure 1 is an electrophoresis file run. The electrophoretic
analysis was used to
check the quality of the extracted RNA.
[0011] Figure 2 is an electropherogram. The electropherogram was used to
check the
quality of the extracted RNA.
[0012] Figure 3 is an extraction summary. This depicts a summary of
quality check for
120 samples that were evaluated using the extraction method described in
Example 2.
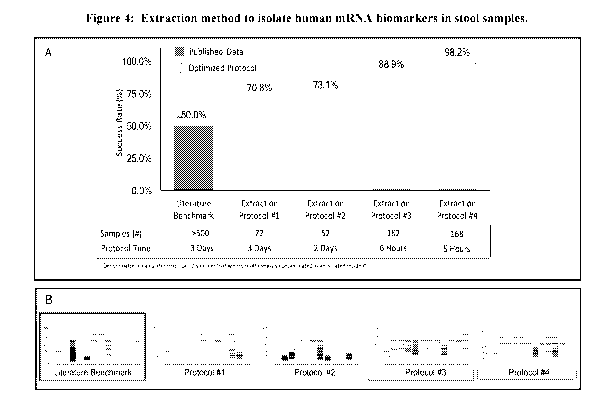
[0013] Figure 4A is a graph depicting the results of an experiment
comparing total RNA
extraction methods. Figure 4A shows the total number of samples passing
quality check using
the extraction method described in Example 2.
[0014] Figure 4B depicts five electrophoresis runs from various
extraction methods
[0015] Figure 5A is a heat map showing differentially expressed
transcript clusters. As
shown, a heat map was generated using 200 transcript clusters, which were
mapped to 187
different genes, and the 265 samples analyzed in the training set. Samples are
ordered by groups:
cancer (red), precancerous adenoma (orange), and normal (green).
[0016] Figure 5B shows differentially expressed GO terms and pathways
using GAGE
R-Package (p<0.05). The height of each bar details the set size of enriched
genes within each
pathway and the blue line shows the -log(p-value) for each pathway. The red
dotted line
indicates significance (p=0.05).
[0017] Figure 6 shows a listing of genes identified as differentially
expressed in
colorectal neoplasms.
[0018] Figure 7A depicts an electrophoresis run showing 4 individual
feline samples and
4 individual canine samples.
[0019] Figure 7B shows the RNA Integrity Numbers (RIN) for 4 individual
feline
samples and 4 individual canine samples and the average of all eight samples.
4
CA 03077798 2020-04-01
WO 2018/081580 PCT/US2017/058789
[0020] Figure 7C shows estimated eukaryotic RNA concentration (ng/uL)
from an
electrophoresis run, for 4 individual feline samples and 4 individual canine
samples and the
average mass for all 8 samples.
[0021] Figure 8A depicts RT-qPCR results for the IgM CI.t heavy chain
region to identify
the presence of lymphocyte related transcripts in canine samples.
[0022] Figure 8B depicts RT-qPCR results for two recombinations of the T
cell receptor
gamma region in canine samples.
[0023] Figure 9 depicts RT-qPCR results for Actin-B in feline samples.
[0024] Figure 10A depicts 4 technical replicates of 70,524 transcript
cluster expression
levels using Affymetrix Human Transcriptome Arrays.
[0025] Figure 10B depicts 4 biological replicates of 70,524 transcript
cluster expression
levels using Affymetrix Human Transcriptome Arrays.
[0026] Figure 10C depicts 6 technical replicates tested 6 months apart to
analyze 70,524
transcript cluster expression levels using Affymetrix Human Transcriptome
Arrays.
[0027] Figure 11A depicts 4 technical replicates of 5,149 transcript
cluster expression
levels using Affymetrix Human Transcriptome Arrays.
[0028] Figure 11B depicts 4 biological replicates of 5,149 transcript
cluster expression
levels using Affymetrix Human Transcriptome Arrays.
[0029] Figure 11C depicts 6 technical replicates tested 6 months apart to
analyze 5,149
transcript cluster expression levels using Affymetrix Human Transcriptome
Arrays.
[0030] Figure 12A depicts a comparative electropherogram and
electrophoresis file run
from extraction methods in the literature.
[0031] Figure 12B depicts an electropherogram and an electrophoresis file
run from
extraction methods described in Example 2.
CA 03077798 2020-04-01
WO 2018/081580 PCT/US2017/058789
[0032] Figure 13 shows a listing of genes identified as differentially
expressed in
colorectal neoplasms, as well as genes implicated in cancer, colorectal
neoplasms and/or
gastrointestinal health.
[0033] Figure 14 depicts an electrophoresis file run for 8 samples
derived from 4
individual cats demonstrating the consistency of eukaryotic and prokaryotic
RNA signatures
among biological replicates.
[0034] Figure 15A is a table showing primers used for RT-qPCR analysis of
canine
samples.
[0035] Figure 15B is a table showing primers used for RT-qPCR analysis of
feline
samples.
[0036] Figure 16A depicts RT-qPCR results for two rearrangements of B-
cell
immunoglobulins to identify the presence of lymphocyte-specific transcripts in
canine samples.
[0037] Figure 16B depicts RT-qPCR results for the six rearrangements of
the T-cell
receptor gamma region to identify the presence of lymphocyte-specific
transcripts in feline
samples.
DETAILED DESCRIPTION
[0038] This description of preferred embodiments is intended to be read
in connection
with the accompanying drawings, which are to be considered part of the entire
written
description of this invention. The drawing figures are not necessarily to
scale and certain features
of the invention may be shown exaggerated in scale or in somewhat schematic
form in the
interest of clarity and conciseness. In the description, relative terms such
as "horizontal,"
"vertical," "up," "down," "top" and "bottom" as well as derivatives thereof
(e.g., "horizontally,"
"downwardly," "upwardly," etc.) should be construed to refer to the
orientation as then described
or as shown in the drawing figure under discussion. These relative terms are
for convenience of
description and normally are not intended to require a particular orientation.
Terms including
"inwardly" versus "outwardly," "longitudinal" versus "lateral" and the like
are to be interpreted
relative to one another or relative to an axis of elongation, or an axis or
center of rotation, as
6
CA 03077798 2020-04-01
WO 2018/081580 PCT/US2017/058789
appropriate. Terms concerning attachments, coupling and the like, such as
"connected" and
"interconnected," refer to a relationship wherein structures are secured or
attached to one another
either directly or indirectly through intervening structures, as well as both
movable or rigid
attachments or relationships, unless expressly described otherwise. The term
"operatively
connected" is such an attachment, coupling or connection that allows the
pertinent structures to
operate as intended by virtue of that relationship. When only a single machine
is illustrated, the
term "machine" shall also be taken to include any collection of machines that
individually or
jointly execute a set (or multiple sets) of instructions to perform any one or
more of the
methodologies discussed herein. In the claims, means-plus-function clauses, if
used, are intended
to cover the structures described, suggested, or rendered obvious by the
written description or
drawings for performing the recited function, including not only structural
equivalents but also
equivalent structures.
[0039] The present invention is based in part on the inventors'
development of a method
to separate eukaryotic cells from bacterial cells in a stool sample, for
example, a stool sample
obtained from a mammal. Within the colon, there are about approximately 1012
bacterial cells per
gram of intestinal content. This colonic microflora can include between 300-
1000 species. A
stool or fecal sample is a complex macromolecular mixture that includes not
only eukaryotic
cells sloughed off from the intestinal lumen of the gastrointestinal tract,
but microbes, including
bacteria and any gastrointestinal parasites, indigestible unabsorbed food
residues, secretions from
intestinal cells, and excreted material such as mucous and pigments. Normal
stool is made up of
about 75% water and 25% solid matter. Bacteria make up about 60% of the total
dry mass of
feces. The high bacterial load can contribute to an unfavorable signal-to-
noise ratio for the
detection of eukaryotic biomarkers from a stool sample. Furthermore, the
eukaryotic signals can
be heavily degraded. Extraction and processing of such eukaryotic nucleic
acids can promote or
accelerate degradation, which severely limits further analysis.
[0040] The methods and materials disclosed herein include methods for
isolating
eukaryotic nucleic acids from a stool sample. Such eukaryotic nucleic acids
can be evaluated for
levels of specific biomarkers that may be indicative of a gastrointestinal
disorder or disease in a
eukaryote, for example, a mammal. The mammal can be a human or a non-human
animal, for
example, a human, dog, cat, non-human primate, ruminant, ursid, equid, pig,
sheep, goat,
7
CA 03077798 2020-04-01
WO 2018/081580 PCT/US2017/058789
camelid, buffalo, deer, elk, moose, mustelid, rabbit, guinea pig, hamster,
rat, mouse, pachyderm,
rhinoceros, or chinchilla.
[0041] The inventors have found that that they could effectively separate
eukaryotic cells
from bacterial cells in a eukaryotic stool sample. The inventors have also
found that they could
detect eukaryotic biomarkers in the RNA isolated from such eukaryotic cells.
Such biomarkers
may be useful for the detection of gastrointestinal disorders, for example,
colorectal cancer,
celiac disease, Crohn's disease, gastritis, gastroenteritis, gastric cancer,
gastric ulcers, necrotizing
enterocolitis, gastrointestinal stromal tumors, gastrointestinal lymphoma,
gastrointestinal
neoplasia, lymphosarcoma, adenocarcinoma, inflammatory bowel disease,
irritable bowel
syndrome, pancreatic neoplasia, hepatic neoplasia, cholangiocarcinoma,
colitis, feline leukemia
virus, bovine viral diarrhea, jejunal hemorrhage syndrome, gastroenteritis,
malignant catarrhal
fever, feline panleukopenia, small intestinal fibrosis, infiltrative colonic
disease,
cryptosporidiosis, coccidiosis, and other zoonotic parasitic infections, or
coronavirus, parvovirus,
astrovirus, norovirus, or rotavirus infections. Provided herein are materials
and methods for
determining whether a subject, for example, a human, a dog or a cat, is at
risk for gastrointestinal
disease, for example, colorectal cancer, lymphoma or inflammatory bowel
disease or other
diseases. Also provided are materials and methods for diagnosis of disease and
methods of
identifying the health status of a subject.
[0042] The methods and compositions disclosed herein are generally and
variously useful
for the detection, diagnosis, and treatment of gastrointestinal health.
Methods of detection can
include measuring the expression level in a stool sample of one, two, or more
biomarkers in a
sample from a subject, for example, a patient, having a gastrointestinal
disorder or suspected of
having a gastrointestinal disorder and comparing the measured expression level
to the measured
expression level of one, two, or more biomarkers in a control. A difference in
the measured
expression level of one, two, or more biomarkers in a subject's sample
relative to the measured
expression level of the one, two, or more biomarkers in a control is an
indication that the subject
has a gastrointestinal disorder. In some embodiments, a difference in the
measured expression
level of one, two, or more biomarkers in a subject's sample relative to the
measured expression
level of the one, two, or more biomarkers in a control is an indication that
the subject, for
example, a patient, is at risk for a gastrointestinal disorder.
8
CA 03077798 2020-04-01
WO 2018/081580 PCT/US2017/058789
[0043] In another embodiment, methods of detection of disease can include
measuring
the relative expression level proportion, for example, the relative ratios, of
one, two, or more
biomarkers in a subject's stool sample and comparing the relative proportion
of these biomarkers
to the relative expression level proportion of one, two, or more biomarkers in
a control. A
difference in the measured relative expression level proportion of one, two,
or more biomarkers
in a subject's sample relative to a control is an indication that the subject
has a gastrointestinal
disease. In some embodiments, a difference in the measured expression level
proportion of the
one, two, or more biomarkers in a subject's sample relative to the measured
expression level
proportion of the one, two, or more biomarkers in a control is an indication
that the subject is at
risk for a gastrointestinal disorder.
[0044] The methods can include determining the level of expression of two
or more
colorectal neoplasm biomarkers in the human RNA isolated from a stool sample
obtained from a
patient by determining whether the levels of the two or more colorectal
neoplasm biomarker
genes are different relative to the levels of the same two or more colorectal
neoplasm biomarker
genes in a control. Exemplary colorectal neoplasm biomarker genes are shown in
Figure 6 (Panel
A) and Figure 13 (Panel B). Some or all of the colorectal neoplasm biomarker
genes listed in
Figure 6 (Panel A) and Figure 13 (Panel B) can form a panel. In some
embodiments, the
colorectal neoplasm biomarker genes listed in Figure 6 (Panel A) and Figure 13
(Panel B) can
also include subsets of colorectal neoplasm biomarker genes. The compositions
can include gene
arrays and probe sets configured for the specific detection of the panels of
markers disclosed
herein. The compositions can also include kits comprising gene arrays and
probe sets configured
for the specific detection of the panels of markers disclosed herein.
[0045] Provided herein are colorectal neoplasm biomarker genes and panels
of colorectal
neoplasm biomarker genes for use in diagnosis of colorectal cancer or
precancerous lesions. A
biomarker is generally a characteristic that can be objectively measured and
quantified and used
to evaluate a biological process, for example, colorectal neoplasm
development, progression,
remission, and recurrence. Biomarkers can take many forms including, nucleic
acids,
polypeptides, metabolites, or physical or physiological parameters.
9
CA 03077798 2020-04-01
WO 2018/081580 PCT/US2017/058789
[0046] These biomarkers from eukaryotic cells can include: a) a sequence
of
deoxyribonucleic acid (DNA), b) a sequence of ribonucleic acid (RNA), c) a
predicted sequence
of amino acids, which comprise the backbone of protein, d) expression levels
of ribonucleic acid
biomarkers, e) a predicted expression level of an amino acid sequence or f)
any combination of
the above. In some embodiments, the biomarker can be T cell marker or B cell
marker. In some
embodiments, the biomarker can be a biomarker that is useful for the detection
of clonal
expansion of T cells or B cells. Exemplary biomarkers can include IgA, IgM,
IgG, IgE, IgD, T
cell gamma receptor, T cell alpha receptor, T cell beta receptor, the T cell
delta receptor region,
or B-cell complementary determining region. In some embodiments, biomarkers
can be used for
normalization, such as GADPH. In some embodiments, biomarkers can be used for
detection of
specific cell types, such as using Actin-B for the detection of epithelial
cells or IgM C-mu for the
detection of lymphocytes. In some embodiments, biomarkers can be used for
detection of disease
specific markers, such as detection of T cell receptor gamma for detection of
clonal expansion of
lymphocytes. In some embodiments, biomarkers can comprise those for the
detection of viruses
and parasites, including those for capsids, capsomeres, replicases, and oocyst
wall proteins.
[0047] A biological sample can be a sample that contains cells or other
cellular material
from which nucleic acids or other analytes can be obtained. A biological
sample can be a control
or an experimental sample. A biological sample can be a stool sample. The
biological sample can
be obtained immediately following defecation in a toilet, on the ground, or
into a collection
device. In some embodiments, the biological sample can be obtained following a
procedure, such
as an enema or an endoscopy. The biological sample can be tested immediately.
Alternatively,
the biological sample can be stored in a buffer prior to testing, for example
an aqueous buffer, a
glycerol based buffer, a polar solvent based buffer, an osmotic balance
buffer, or other buffer
sufficient for preserving the biological sample. Additionally, or
alternatively, the biological
sample can be collected and stored refrigerated, for example, at 4 C, or
frozen, for example, at
0 C, -20 C, -80 C, -140 C, or lower prior to testing. The biological sample
can be stored for 1
month, 2 months, 4 months, 6 months, 1 year, 2 years or more prior to testing.
[0048] The biological sample can be derived from a eukaryote, for example
a mammal.
The mammal can be a human or a non-human animal, for example, a human, dog,
cat, non-
CA 03077798 2020-04-01
WO 2018/081580 PCT/US2017/058789
human primate, ruminant, ursid, equid, pig, sheep, goat, camelid, buffalo,
deer, elk, moose,
mustelid, rabbit, guinea pig, hamster, rat, mouse, pachyderm, rhinoceros, or
chinchilla.
Methods
[0049] Useful methods for isolation of nucleic acids from a biological
sample, for
example a stool sample, that are enriched for eukaryotic nucleic acids are
provided herein. The
method can include disrupting the stool sample with buffer. The sample can be
subjected to
vortexing, shaking, stirring, rotation, or other method of agitation
sufficient to disperse the solids
and the stool bacteria. The temperature at which the agitation and
centrifugation steps are carried
out can vary, for example, from about 4 C to about 20 C, from about 4 C to
about 1 C, from
about 4 C to about 10 C, from about 4 C to about 6 C. Following disruption,
the sample can be
subjected to one or more rounds of centrifugation. In some embodiments, the
disruption step and
the centrifugation can be repeated one, two, three, or more additional times.
Commercially
available reagents, for example Nuclisens EasyMag reagents can be used for
stool disruption,
washing, and cell lysis. Lysis buffer can also be to lyse the eukaryotic
cells. The lysate can be
further centrifuged and the supernatant used for input into an automated RNA
isolation machine,
for example EasyMag instrument. In some embodiments, the extracted nucleic
acids can be
treated with DNase to clear the solution of DNA. Other methods can be used
including
mechanical or enzymatic cell disruption followed by a solid phase method such
as column
chromatography or extraction with organic solvents, for example, phenol-
chloroform or
thiocyanate-phenol-chloroform extraction. In some embodiments, the nucleic
acid can be
extracted onto a functionalized bead. In some embodiments, the functionalized
bead can further
comprise a magnetic core ("magnetic bead"). In some embodiments, the
functionalized bead can
include a surface functionalized with a charged moiety. The charged moiety can
be selected
from: amine, carboxylic acid, carboxylate, quaternary amine, sulfate,
sulfonate, or phosphate.
[0050] For extraction of nucleic acids, the stool sample can be disrupted
in the presence
of one or more of a buffer, a surfactant, and a ribonuclease inhibitor to form
a suspension. The
buffer can be a biologically compatible buffer, for example, Hanks balanced
salt solution,
Alsever's solution, Earle's balanced salt solution, Gey's balanced salt
solution, Phosphate
buffered saline, Puck's balanced salt solution, Ringer's balanced salt
solution, Simm's balanced
salt solution, TRIS-buffered saline, or Tyrode's balanced salt solution. The
surfactant can be an
11
CA 03077798 2020-04-01
WO 2018/081580 PCT/US2017/058789
ionic or non-ionic surfactant, for example, Tween-20, or Triton-X-100. The
ribonuclease
inhibitor can be solvent based, protein based, or other type of method to
prevent RNA
destruction, including, for example, Protector RNase Inhibitor (Roche),
RNasing (Promega),
SUPERase-InTM (Thermo Fisher Scientific), RNAseOUTTm (Thermo Fisher
Scientific), ANTI-
RNase, Recombinant RNase Inhibitor, or a cloned RNAse Inhibitor. The stool
sample can be
disrupted in a variety of ways, for example by vortexing, shaking, stirring,
rotating, or other
method of agitation sufficient to disperse the solids and the stool bacteria.
In some embodiments,
the stool sample can be disrupted using: coated beads, magnetic beads, or a
stirring implement,
such as a glass rod, a metal rod, a wooden stick or a wooden blade.
[0051] The suspension can then be separated into a liquid portion and a
solid portion.
The separation can be carried out, for example, by centrifugation, filtration,
targeted probes that
specifically bind eukaryotic cells, antibodies, column-based filtration, bead-
based filtration, or
chromatographic methods. The liquid portion is enriched for bacterial nucleic
acid and can be
discarded. The solid portion can be re-suspended in a buffer either in the
presence or absence of
a surfactant and in the presence or absence of a ribonuclease. The separation
step can be repeated
one, two, three, four, five, six, seven, eight, or more times.
[0052] The temperature at which the disruption and separation steps are
carried out can
vary, for example, from about 4 C to about 20 C, from about 4 C to about 15 C,
from about 4 C
to about 10 C, from about 4 C to about 6 C.
[0053] The resulting pellet obtained from the separation step can be
suspended in a lysis
buffer, for example, a buffer comprising a chaotropic agent and optionally a
surfactant to form a
lysate. In some embodiments, the chaotropic agent can be guanidium thiocyanate
and the
surfactant can be Triton-X-100. In some embodiments, the lysis buffer can
include or exclude
Tris-HC1, ethylenediaminetetraacetic acid (EDTA), sodium dodecyl sulfate
(SDS), Nonidet P-40,
sodium deoxycholate, or dithiothreitol.
[0054] The lysate can be fractionated into a portion enriched for
eukaryotic nucleic acid.
The fractionation can be carried out, for example by centrifugation,
filtration, targeted probes
that specifically bind eukaryotic nucleic acid, antibodies, column-based
filtration, bead-based
filtration, or chromatographic methods. In some embodiments, fractionation by
centrifugation
12
CA 03077798 2020-04-01
WO 2018/081580 PCT/US2017/058789
can result in the formation of a bottom layer (a pellet), comprising cell
debris, a hydrophilic
middle layer comprising eukaryotic nucleic acids, and a hydrophobic top layer
comprising lipids
and membrane fractions. The middle layer can be collected. In some
embodiments, the middle
layer and the top layer can be collected together. The middle layer can be
collected through a
narrow bore orifice. The narrow bore orifice can be a pipette tip or a syringe
fitted with a needle.
The pipette tip can be, for example, a 1, 5, 10, 20 uL or 100 uL pipette tip.
The needle can be, for
example, an 18-gauge or a 15-gauge needle.
[0055] The collected layer comprising eukaryotic nucleic acids can be
subjected to
further extraction. The method of further extraction can vary. Exemplary
methods include
magnetic particle-based methods, column based methods, filter-based methods,
bead-based
methods, or organic solvent-based methods. Magnetic particle-based methods can
include
commercially available reagents, for example Nuclisens EasyMag reagents
(bioMerieux).
[0056] The extracted nucleic acids can be analyzed for eukaryotic
biomarkers that are
relevant to gastrointestinal disorders or gastrointestinal cells. The
biomarkers can provide
information on the health of an individual, i.e., the subject. These
biomarkers from eukaryotic
cells can include: a) a sequence of deoxyribonucleic acid (DNA), b) a sequence
of ribonucleic
acid (RNA), c) a predicted sequence of amino acids, which comprise the
backbone of protein, d)
expression levels or proportions of expression levels of RNA biomarkers, e) a
predicted
expression level or a predicted expression level proportion of an amino acid
sequence, or f) any
combination of the above. Isolation of biomarkers from eukaryotic cells can
allow for
comparison between an experimental sample and a control. Isolation of these
biomarkers from
eukaryotic cells can provide a method for detection of intestinal disease in
the experimental
sample. Comparison can include evaluation for: a) variation in a DNA sequence,
b) variation in
an RNA sequence, c) variation in the predicted amino acid sequence, d)
variation in expression
levels or the variation of the proportion of expression levels of RNA
biomarkers, e) variation in
the predicted expression level or variation in the prediction expression level
proportion of an
amino acid sequence, or f) a variation constituting any combination of the
above. A variation can
be determined when the measured biomarker of an experimental sample is
different from the
measured biomarker in a control.
13
CA 03077798 2020-04-01
WO 2018/081580 PCT/US2017/058789
[0057] The method can include obtaining an experimental sample and a
control, for
example, a stool sample. The stool sample contains sloughed off eukaryotic
cells that can be
evaluated for biomarkers. In some embodiments, the eukaryotic cells can be
enterocytes,
lymphocytes, enterochromiffin-like cells, entero-endocrine cells, neuro-
endocrine cells,
pancreatic cells, hepatic cells, gastric cells, or others. The method provides
a way whereby the
eukaryotic cells in the stool sample can be evaluated for eukaryotic
biomarkers. The biomarkers
can include a sequence of DNA, a sequence of RNA, a predicted sequence of
amino acids, an
expression level or proportion of expression level of RNA biomarkers, a
predicted expression
level or a predicted expression level proportion of an amino acid sequence or
any combination of
the above. In one aspect, the evaluation step comprises of any type of
microarray sequencing,
polymerase chain reaction (PCR), nucleic acid sequencing, molecular barcoding,
or probe-
capture.
[0058] The methods and compositions are also useful for selecting a
clinical plan for an
individual suffering from intestinal disease. Through this method, the
clinical plan can include
administration of further diagnostic procedures. In some embodiments, the
clinical plan can
include a method of treatment.
[0059] The levels of the eukaryotic biomarkers can be evaluated using a
variety of
methods. Expression levels can be determined either at the nucleic acid level,
for example, the
RNA level or at the polypeptide level. RNA expression can encompass expression
of total RNA,
mRNA, tRNA, rRNA, ncRNA, smRNA, miRNA, and snoRNA. Expression at the RNA level
can
be measured directly or indirectly by measuring levels of cDNA corresponding
to the relevant
RNA. Alternatively, or in addition, polypeptides encoded by the RNA, RNA
regulators of the
genes encoding the relevant transcription factors, and levels of the
transcription factor
polypeptides can also be assayed. Methods for determining gene expression at
the mRNA level
include, for example, microarray analysis, serial analysis of gene expression
(SAGE), RT-PCR,
blotting, hybridization based on digital barcode quantification assays,
multiplex RT-PCR, digital
drop PCR (ddPCR), NanoDrop spectrophotometers, RT-qPCR, qPCR, UV spectroscopy,
RNA
sequencing, next-generation sequencing, lysate based hybridization assays
utilizing branched
DNA signal amplification such as the QuantiGene 2.0 Single Plex, and branched
DNA analysis
methods. Digital barcode quantification assays can include the BeadArray
(Illumina), the xMAP
14
CA 03077798 2020-04-01
WO 2018/081580 PCT/US2017/058789
systems (Luminex), the nCounter (Nanostring), the High Throughput Genomics
(HTG)
molecular, BioMark (Fluidigm), or the Wafergen microarray. Assays can include
DASL
(I1lumina), RNA-Seq (I1lumina), TruSeq (I1lumina), SureSelect (Agilent),
Bioanalyzer (Agilent)
and TaqMan (ThermoFisher).
[0060] We may use the terms "nucleic acid" and "polynucleotide"
interchangeably to
refer to both RNA and DNA, including cDNA, genomic DNA, synthetic DNA, and DNA
(or
RNA) containing nucleic acid analogs, any of which may encode a polypeptide of
the invention
and all of which are encompassed by the invention. Polynucleotides can have
essentially any
three-dimensional structure. A nucleic acid can be double-stranded or single-
stranded (i.e., a
sense strand or an antisense strand). Non-limiting examples of polynucleotides
include genes,
gene fragments, exons, introns, messenger RNA (mRNA) and portions thereof,
transfer RNA,
micro RNA, ribosomal RNA, siRNA, micro-RNA, ribozymes, cDNA, recombinant
polynucleotides, branched polynucleotides, plasmids, vectors, isolated DNA of
any sequence,
isolated RNA of any sequence, nucleic acid probes, and primers, as well as
nucleic acid analogs.
In the context of the present invention, nucleic acids can encode a fragment
of a biomarker, for
example, a biomarker for B cell or T cell clonal expansion, or a biologically
active variant
thereof.
[0061] An "isolated" nucleic acid can be, for example, a DNA molecule or
a fragment
thereof, provided that at least one of the nucleic acid sequences normally
found immediately
flanking that DNA molecule in a genome is removed or absent. Thus, an isolated
nucleic acid
includes, without limitation, a DNA molecule that exists as a separate
molecule, independent of
other sequences (e.g., a chemically synthesized nucleic acid, or a cDNA or
genomic DNA
fragment produced by the polymerase chain reaction (PCR) or restriction
endonuclease
treatment). An isolated nucleic acid also refers to a DNA molecule that is
incorporated into a
vector, an autonomously replicating plasmid, a virus, or into the genomic DNA
of a prokaryote
or eukaryote. In addition, an isolated nucleic acid can include an engineered
nucleic acid such as
a DNA molecule that is part of a hybrid or fusion nucleic acid. A nucleic acid
existing among
many (e.g., dozens, or hundreds to millions) of other nucleic acids within,
for example, cDNA
libraries or genomic libraries, or gel slices containing a genomic DNA
restriction digest, is not an
isolated nucleic acid.
CA 03077798 2020-04-01
WO 2018/081580 PCT/US2017/058789
[0062] Isolated nucleic acid molecules can be produced in a variety of
ways. For
example, polymerase chain reaction (PCR) techniques can be used to obtain an
isolated nucleic
acid containing a nucleotide sequence described herein, including nucleotide
sequences encoding
a polypeptide described herein. PCR can be used to amplify specific sequences
from DNA as
well as RNA, including sequences from total genomic DNA or total cellular RNA.
Generally,
sequence information from the ends of the region of interest or beyond is
employed to design
oligonucleotide primers that are identical or similar in sequence to opposite
strands of the
template to be amplified. Various PCR strategies also are available by which
site-specific
nucleotide sequence modifications can be introduced into a template nucleic
acid.
[0063] Isolated nucleic acids also can be chemically synthesized, either
as a single
nucleic acid molecule (e.g., using automated DNA synthesis in the 3' to 5'
direction using
phosphoramidite technology) or as a series of oligonucleotides. For example,
one or more pairs
of long oligonucleotides (e.g., >50-100 nucleotides) can be synthesized that
contain the desired
sequence, with each pair containing a short segment of complementarity (e.g.,
about 15
nucleotides) such that a duplex is formed when the oligonucleotide pair is
annealed. DNA
polymerase is used to extend the oligonucleotides, resulting in a single,
double-stranded nucleic
acid molecule per oligonucleotide pair, which then can be ligated into a
vector.
[0064] Two nucleic acids or the polypeptides they encode may be described
as having a
certain degree of identity to one another. For example, a colorectal neoplasm
biomarker gene
selected from Figure 6 (Panel A) or Figure 13 (Panel B) and a biologically
active variant thereof
may be described as exhibiting a certain degree of identity. Alignments may be
assembled by
locating short sequences in the Protein Information Research (PIR) site
(http://pir.georgetown.edu), followed by analysis with the "short nearly
identical sequences"
Basic Local Alignment Search Tool (BLAST) algorithm on the NCBI website
(http://www.ncbi.nlm.nih.gov/blast).
[0065] As used herein, the term "percent sequence identity" refers to the
degree of
identity between any given query sequence and a subject sequence. For example,
a colorectal
neoplasm biomarker gene sequence listed in Figure 6 (Panel A) or Figure 13
(Panel B) can be the
query sequence and a fragment of a colorectal neoplasm biomarker gene sequence
listed in
16
CA 03077798 2020-04-01
WO 2018/081580 PCT/US2017/058789
Figure 6 (Panel A) or Figure 13 (Panel B) can be the subject sequence.
Similarly, a fragment of a
colorectal neoplasm biomarker gene sequence listed in Figure 6 (Panel A) or
Figure 13 (Panel B)
can be the query sequence and a biologically active variant thereof can be the
subject sequence.
[0066] To determine sequence identity, a query nucleic acid or amino acid
sequence can
be aligned to one or more subject nucleic acid or amino acid sequences,
respectively, using a
computer program, for example, ClustalW (version 1.83, default parameters),
which allows
alignments of nucleic acid or protein sequences to be carried out across their
entire length (global
alignment).
[0067] The nucleic acids and polypeptides described herein may be
referred to as
"exogenous". The term "exogenous" indicates that the nucleic acid or
polypeptide is part of, or
encoded by, a recombinant nucleic acid construct, or is not in its natural
environment. For
example, an exogenous nucleic acid can be a sequence from one species
introduced into another
species, i.e., a heterologous nucleic acid. Typically, such an exogenous
nucleic acid is introduced
into the other species via a recombinant nucleic acid construct. An exogenous
nucleic acid can
also be a sequence that is native to an organism and that has been
reintroduced into cells of that
organism. An exogenous nucleic acid that includes a native sequence can often
be distinguished
from the native sequence by the presence of non-natural sequences linked to
the exogenous
nucleic acid, e.g., non-native regulatory sequences flanking a native sequence
in a recombinant
nucleic acid construct. In addition, stably transformed exogenous nucleic
acids typically are
integrated at positions other than the position where the native sequence is
found.
[0068] Nucleic acids of the invention can include nucleic acids having a
nucleotide
sequence of any one of the colorectal neoplasm biomarkers listed in Figure 6
(Panel A) or Figure
13 (Panel B), or a nucleic acid sequence that is at least about 70%, at least
about 75%, at least
about 80%, at least about 85%, at least about 90%, at least about 95%, at
least about 99%
identical to the nucleic acids listed in Figure 6 (Panel A) or Figure 13
(Panel B).
[0069] A nucleic acid, for example, an oligonucleotide (e.g., a probe or
a primer) that is
specific for a target nucleic acid will hybridize to the target nucleic acid
under suitable
conditions. We may refer to hybridization or hybridizing as the process by
which an
oligonucleotide single strand anneals with a complementary strand through base
pairing under
17
CA 03077798 2020-04-01
WO 2018/081580 PCT/US2017/058789
defined hybridization conditions. It is a specific, i.e., non-random,
interaction between two
complementary polynucleotides. Hybridization and the strength of hybridization
(i.e., the
strength of the association between the nucleic acids) is influenced by such
factors as the degree
of complementary between the nucleic acids, stringency of the conditions
involved, and the
melting temperature (Tm) of the formed hybrid. The hybridization products can
be duplexes or
triplexes formed with targets in solution or on solid supports.
[0070] In some embodiments, the nucleic acids can include short nucleic
acid sequences
useful for analysis and quantification of the colorectal neoplasm biomarker
genes listed in Figure
6 or 13. Such isolated nucleic acids can be oligonucleotide primers. In
general, an
oligonucleotide primer is an oligonucleotide complementary to a target
nucleotide sequence, for
example, the nucleotide sequence of any of the colorectal neoplasm biomarker
genes listed in
Figure 6 or 13, that can serve as a starting point for DNA synthesis by the
addition of nucleotides
to the 3' end of the primer in the presence of a DNA or RNA polymerase. The 3'
nucleotide of
the primer should generally be identical to the target sequence at a
corresponding nucleotide
position for optimal extension and/or amplification. Primers can take many
forms, including for
example, peptide nucleic acid primers, locked nucleic acid primers, unlocked
nucleic acid
primers, and/or phosphorothioate modified primers. In some embodiments, a
forward primer can
be a primer that is complementary to the anti-sense strand of dsDNA and a
reverse primer can be
a primer that is complementary to the sense-strand of dsDNA. We may also refer
to primer pairs.
In some embodiments, a 5' target primer pair can be a primer pair that
includes at least one
forward primer and at least one reverse primer that amplifies the 5' region of
a target nucleotide
sequence. In some embodiments, a 3' target primer pair can be a primer pair at
least one forward
primer and at least one reverse primer that amplifies the 3' region of a
target nucleotide
sequence. In some embodiments, the primer can include a detectable label, as
discussed below.
In some embodiments, the detectable label can be a quantifiable label.
[0071] Oligonucleotide primers provided herein are useful for
amplification of any of the
colorectal neoplasm biomarker gene sequences listed in Figure 6 (Panel A) or
Figure 13 (Panel
B). In some embodiments, oligonucleotide primers can be complementary to two
or more of the
colorectal neoplasm biomarker genes disclosed herein, for example, the
colorectal neoplasm
biomarker genes listed in Figure 6 (Panel A) or Figure 13 (Panel B). The
primer length can vary
18
CA 03077798 2020-04-01
WO 2018/081580 PCT/US2017/058789
depending upon the nucleotide base sequence and composition of the particular
nucleic acid
sequence of the probe and the specific method for which the probe is used. In
general, useful
primer lengths can be about 8,9, 10, 11, 12, 13, 14, 15, 16, 17, 18, 19, 20,
21, 22, 23, 24, 25, 26,
27, 28, 29, 30 nucleotide bases. Useful primer lengths can range from 8
nucleotide bases to about
60 nucleotide bases; from about 12 nucleotide bases to about 50 nucleotide
bases; from about 12
nucleotide bases to about 45 nucleotide bases; from about 12 nucleotide bases
to about 40
nucleotide bases; from about 12 nucleotide bases to about 35 nucleotide bases;
from about 15
nucleotide bases to about 40 nucleotide bases; from about 15 nucleotide bases
to about 35
nucleotide bases; from about 18 nucleotide bases to about 50 nucleotide bases;
from about 18
nucleotide bases to about 40 nucleotide bases; from about 18 nucleotide bases
to about 35
nucleotide bases; from about 18 nucleotide bases to about 30 nucleotide bases;
from about 20
nucleotide bases to about 30 nucleotide bases; from about 20 nucleotide bases
to about 25
nucleotide bases.
[0072] Also provided are probes, that is, isolated nucleic acid fragments
that selectively
bind to and are complementary to any of the colorectal neoplasm biomarker gene
sequences
listed in Figure 6 (Panel A) and Figure 13 (Panel B). Probes can be
oligonucleotides or
polynucleotides, DNA or RNA, single- or double-stranded, and natural or
modified, either in the
nucleotide bases or in the backbone. Probes can be produced by a variety of
methods including
chemical or enzymatic synthesis.
[0073] The probe length can vary depending upon the nucleotide base
sequence and
composition of the particular nucleic acid sequence of the probe and the
specific method for
which the probe is used. In general, useful probe lengths can be about 8, 9,
10, 11, 12, 13, 14, 15,
16, 17, 18, 19, 20, 21, 22, 23, 24, 25, 26, 27, 28, 29, 30, 35, 40, 50, 55,
60, 65, 70, 75, 80, 85, 90,
100, 110, 120, 140, 150, 175, or 200 nucleotide bases. In general, useful
probe lengths will range
from about 8 to about 200 nucleotide bases; from about 12 to about 175
nucleotide bases; from
about 15 to about 150 nucleotide bases; from about 15 to about 100 nucleotide
bases from about
15 to about 75 nucleotide bases; from about 15 to about 60 nucleotide bases;
from about 20 to
about 100 nucleotide bases; from about 20 to about 75 nucleotide bases; from
about 20 to about
60 nucleotide bases; from about 20 to about 50 nucleotide bases in length. In
some embodiments
the probe set can comprise probes directed to at least 2, 3, 4, 5, 6, 7, 8, 9,
10, 11, 12, 13, 14, 15,
19
CA 03077798 2020-04-01
WO 2018/081580 PCT/US2017/058789
16, 17, 18, 19, 20, 21, 22, 23, 24, 25, 26, 27, 28, 29, 30, 31, 32, 33, 34,
35, 40, 45, 50, 60, 70, 80,
90, 100, 125, 150, 175, 200, 225, 250, 275, 300, 325, 350, 375, 400, 425, 450,
475, 500, 525,
550, 575 or more, or all, of the colorectal neoplasm biomarker genes in Figure
6 (Panel A) and
Figure 13 (Panel B).
[0074] The primers and probes disclosed herein can be detectably labeled.
A label can be
a molecular moiety or compound that can be detected or lead to a detectable
response, which
may be joined directly or indirectly to a nucleic acid. Direct labeling may
use bonds or
interactions to link label and probe, which includes covalent bonds, non-
covalent interactions
(hydrogen bonds, hydrophobic and ionic interactions), or chelates or
coordination complexes.
Indirect labeling may use a bridging moiety or linker (e.g. antibody,
oligomer, or other
compound), which is directly or indirectly labeled, which may amplify a
signal. Labels include
any detectable moiety, e.g., radionuclide, ligand such as biotin or avidin,
enzyme, enzyme
substrate, reactive group, chromophore (detectable dye, particle, or bead),
fluorophore, or
luminescent compound (bioluminescent, phosphorescent, or chemiluminescent
label). Labels can
be detectable in a homogeneous assay in which bound labeled probe in a mixture
exhibits a
detectable change compared to that of unbound labeled probe, e.g., stability
or differential
degradation, without requiring physical separation of bound from unbound
forms.
[0075] Suitable detectable labels may include molecules that are
themselves detectable
(e.g., fluorescent moieties, electrochemical labels, metal chelates, etc.) as
well as molecules that
may be indirectly detected by production of a detectable reaction product
(e.g., enzymes such as
horseradish peroxidase, alkaline phosphatase, etc.) or by a specific binding
molecule which itself
may be detectable (e.g., biotin, digoxigenin, maltose, oligohistidine, 2,4-
dintrobenzene,
phenylarsenate, ssDNA, dsDNA, etc.). As discussed above, coupling of the one
or more ligand
motifs and/or ligands to the detectable label may be direct or indirect.
Detection may be in situ,
in vivo, in vitro on a tissue section or in solution, etc.
[0076] In some embodiments, the methods include the use of alkaline
phosphatase
conjugated polynucleotide probes. When an alkaline phosphatase (AP)-
conjugated
polynucleotide probe is used, following sequential addition of an appropriate
substrate such as
fast blue or fast red substrate, AP breaks down the substrate to form a
precipitate that allows in-
CA 03077798 2020-04-01
WO 2018/081580 PCT/US2017/058789
situ detection of the specific target RNA molecule. Alkaline phosphatase may
be used with a
number of substrates, e.g., fast blue, fast red, or 5-Bromo-4-chloro-3-indoly1-
phosphate (BCIP).
See, e.g., as described generally in US 5,780,277 and US 7,033,758.
[0077] In some embodiments, the fluorophore-conjugates probes can be
fluorescent dye
conjugated label probes, or utilize other enzymatic approaches besides
alkaline phosphatase for a
chromogenic detection route, such as the use of horseradish peroxidase
conjugated probes with
substrates like 3,3'-Diaminobenzidine (DAB).
[0078] The fluorescent dyes used in the conjugated label probes may
typically be divided
into families, such as fluorescein and its derivatives; rhodamine and its
derivatives; cyanine and
its derivatives; coumarin and its derivatives; Cascade BlueTM and its
derivatives; Lucifer Yellow
and its derivatives; BODIPY and its derivatives; and the like. Exemplary
fluorophores include
indocarbocyanine (C3), indodicarbocyanine (C5), Cy3, Cy3.5, Cy5, Cy5.5, Cy7,
Texas Red,
Pacific Blue, Oregon Green 488, Alexa Fluor -355, Alexa Fluor 488, Alexa Fluor
532, Alexa
Fluor 546, Alexa Fluor-555, Alexa Fluor 568, Alexa Fluor 594, Alexa Fluor 647,
Alexa Fluor
660, Alexa Fluor 680, JOE, Lissamine, Rhodamine Green, BODIPY, fluorescein
isothiocyanate
(FITC), carboxy-fluorescein (FAM), phycoerythrin, rhodamine, dichlororhodamine
(dRhodamineTm), carboxy tetramethylrhodamine (TAMRATm), carboxy-X-rhodamine
(ROXTm),
LIZTM, VICTM, NEDTM PETTm, SYBR, PicoGreen, RiboGreen, and the like.
Descriptions of
fluorophores and their use, can be found in, among other places, R. Haugland,
Handbook of
Fluorescent Probes and Research Products, 9th ed. (2002), Molecular Probes,
Eugene, Oreg.; M.
Schena, Microarray Analysis (2003), John Wiley & Sons, Hoboken, N.J.;
Synthetic Medicinal
Chemistry 2003/2004 Catalog, Berry and Associates, Ann Arbor, Mich.; G.
Hermanson,
Bioconjugate Techniques, Academic Press (1996); and Glen Research 2002
Catalog, Sterling,
Va. Near-infrared dyes are expressly within the intended meaning of the terms
fluorophore and
fluorescent reporter group.
[0079] In some embodiments, levels of the eukaryotic biomarkers can be
analyzed on a
gene array. Microarray analysis can be performed on a customized gene array.
Alternatively, or
in addition, microarray analysis can be carried out using commercially-
available systems
according to the manufacturer's instructions and protocols. Exemplary
commercial systems
21
CA 03077798 2020-04-01
WO 2018/081580 PCT/US2017/058789
include Affymetrix GENECHIP technology (Affymetrix, Santa Clara, CA), Agilent
microarray
technology, the NCOUNTER Analysis System (NanoString Technologies) and the
BeadArray Microarray Technology (I1lumina). Nucleic acids extracted from a
stool sample can
be hybridized to the probes on the gene array. Probe-target hybridization can
be detected by
chemiluminescence to determine the relative abundance of particular sequences.
[0080] In some embodiments, the probes and probe sets can be configured
as a gene
array. A gene array, also known as a microarray or a gene chip, is an ordered
array of nucleic
acids that allows parallel analysis of complex biological samples. Typically,
a gene array
includes probes that are attached to a solid substrate, for example a
microchip, a glass slide, or a
bead. The attachment generally involves a chemical coupling resulting in a
covalent bond
between the substrate and the probe. The number of probes in an array can
vary, but each probe
is fixed to a specific addressable location on the array or microchip. In some
embodiments, the
probes can be about 18 nucleotide bases, about 20 nucleotide bases, about 25
nucleotide bases,
about 30 nucleotide bases, about 35 nucleotide bases, or about 40 nucleotide
bases in length. In
some embodiments, the probe set comprises probes directed to at least 1, 2, 3,
4, 5, 6, 7, 8, 9, 10,
11, 12, 13, 14, 15, 16, 17, 18, 19, 20, 21, 22, 23, 24, 25, 26, 27, 28, 29,
30, 31, 32, 33, 34, 35, 40,
45, 50, 60, 70, 80, 90, 100, 125, 150, or more, or all, of the colorectal
neoplasm biomarker genes
in Figure 6 (Panel A) and Figure 13 (Panel B). The probe sets can be
incorporated into high-
density arrays comprising 5,000, 10,000, 20,000, 50,000, 100,000, 200,000,
300,000, 400,000,
500,000, 600,000, 700,000, 800,000, 900,000, 1,000,000, 2,000,000, 3,000,000,
4,000,000,
5,000,000, 6,000,000, 7,000,000, 8,000,000 or more different probes.
[0081] Methods of gene array synthesis can vary. Exemplary methods
include synthesis
of the probes followed by deposition onto the array surface by "spotting," in
situ synthesis, using
for example, photolithography, or electrochemistry on microelectrode arrays.
[0082] The levels of eukaryotic markers can be evaluated using a variety
of methods.
Expression levels can be determined either at the nucleic acid, for example,
the RNA level or at
the polypeptide level. RNA expression can encompass expression of total RNA,
mRNA, tRNA,
rRNA, ncRNA, smRNA, miRNA, and snoRNA. Expression at the RNA level can be
measured
directly or indirectly by measuring levels of cDNA corresponding to the
relevant RNA.
22
CA 03077798 2020-04-01
WO 2018/081580 PCT/US2017/058789
Alternatively, or in addition, polypeptides encoded by the RNA, RNA regulators
of the genes
encoding the relevant transcription factors, and levels of the transcription
factor polypeptides can
also be assayed. Methods for determining gene expression at the mRNA level
include, for
example, microarray analysis, serial analysis of gene expression (SAGE), RT-
PCR, blotting,
hybridization based on digital barcode quantification assays, multiplex RT-
PCR, digital drop
PCR (ddPCR), NanoDrop spectrophotometers, qRT-PCR, qPCR, UV spectroscopy, RNA
sequencing, next-generation sequencing, lysate based hybridization assays
utilizing branched
DNA signal amplification such as the QuantiGene 2.0 Single Plex, and branched
DNA analysis
methods. Digital barcode quantification assays can include the BeadArray
(Illumina), the xMAP
systems (Luminex), the nCounter (Nanostring), the High Throughput Genomics
(HTG)
molecular, BioMark (Fluidigm), or the Wafergen microarray. Assays can include
DASL
(Illumina), RNA-Seq (Illumina), TruSeq (Illumina), SureSelect (Agilent),
Bioanalyzer (Agilent)
and TaqMan (ThermoFisher).
[0083] Levels of the eukaryotic biomarkers can also be analyzed by DNA
sequencing.
DNA sequencing can be performed by sequencing methods such as targeted
sequencing, whole
genome sequencing or exome sequencing. Sequencing methods can include: Sanger
sequencing
or high-throughput sequencing. High throughput sequencing can involve
sequencing-by-
synthesis, pyrosequencing, sequencing-by-ligation, real-time sequencing,
nanopore sequencing,
and Sanger sequencing. In some embodiments, isolated RNA can be used to
generate a
corresponding cDNA and the cDNA can be sequenced.
[0084] The sequencing methods described herein can be carried out in
multiplex formats
such that multiple different target nucleic acids are manipulated
simultaneously. In some
embodiments, different target nucleic acids can be treated in a common
reaction vessel or on a
surface of a particular substrate, enabling convenient delivery of sequencing
reagents, removal of
unreacted reagents and detection of incorporation events in a multiplex
manner. In some
embodiments where surface-bound target nucleic acids are involved, the target
nucleic acids may
be in an array format. In an array format, the target nucleic acids may be
typically coupled to a
surface in a spatially distinguishable manner. For example, the target nucleic
acids may be bound
by direct covalent attachment, attachment to a bead or other particle or
associated with a
polymerase or other molecule that is attached to the surface. The array may
include a single copy
23
CA 03077798 2020-04-01
WO 2018/081580 PCT/US2017/058789
of a target nucleic acid at each site (also referred to as a feature) or
multiple copies having the
same sequence can be present at each site or feature. Multiple copies are
produced by
amplification methods such as bridge amplification, PCR, or emulsion PCR.
[0085] In some embodiments, a normalization step can be used to control
for nucleic acid
recovery and variability between samples. In some embodiments, a defined
amount of exogenous
control nucleic acids can be added ("spiked in") to the extracted eukaryotic
nucleic acids. The
exogenous control nucleic acid can be a nucleic acid having a sequence
corresponding to one or
more eukaryotic sequences. Alternatively, or in addition, the exogenous
control nucleic acid can
have a sequence corresponding to the sequence found in another species, for
example a bacterial
sequence such as a Bacilis subtilis sequence. In some embodiments, the methods
can include
determining the levels of one or more housekeeping genes. In some embodiments,
the methods
can include normalizing the expression levels of biomarkers to the levels of
the housekeeping
genes.
[0086] The methods include the step of determining whether the measured
expression
levels of one, two, or more biomarkers in an experimental sample are different
from the
measured expression levels of one, two, or more biomarkers in a control. In
another embodiment,
the methods include the step of determining whether the proportion of
expression levels of one,
two, or more biomarkers in an experimental sample are different from the
proportion of
measured expression levels of one, two, or more biomarkers in a control. A
difference in
expression level or a proportion of expression levels can be an increase or a
decrease.
[0087] The compositions disclosed herein are generally and variously
useful for the
detection, diagnosis and treatment of colorectal cancer. Methods of detection
can include
measuring the expression level in a stool sample of two or more colorectal
neoplasm biomarkers
selected from the biomarkers listed in any of Figure 6 (Panel A) or Figure 13
(Panel B) and
comparing the measured expression level of the two or more colorectal neoplasm
biomarker
genes in the sample with the measured expression level of two or more
colorectal neoplasm
biomarker genes in a control. A difference in the measured expression level of
two or more
colorectal neoplasm biomarker genes in a patient's sample relative to the
measured expression
level of the two or more colorectal neoplasm biomarker genes in a control is
an indication that
24
CA 03077798 2020-04-01
WO 2018/081580
PCT/US2017/058789
the patient has colorectal cancer. In some embodiments, a difference in the
measured expression
level of two or more colorectal neoplasm biomarker genes in a patient's sample
relative to the
measured expression level of the two or more colorectal neoplasm biomarker
genes in a control
is an indication that the patient has a precancerous lesion and/or is at risk
for colorectal cancer.
These methods can further include the step of identifying a subject (e.g., a
patient and, more
specifically, a human patient) who has a colorectal neoplasm, for example,
colorectal cancer or a
precancerous lesion, or who is at risk for developing a colorectal neoplasm.
[0088] A
colorectal neoplasm can include any form of colorectal cancer. A colorectal
neoplasm can also include a polyp, for example a precancerous lesion.
Colorectal cancer
typically begins as a growth, termed a polyp, in the luminal lining of the
colon or rectum.
Colorectal polyps are generally divided into two categories: adenomatous
polyps, also called
adenomas; and hyperplastic and inflammatory polyps. Adenomatous polyps can
give rise to
colorectal cancer. The most common form of colorectal cancer, adenocarcinoma,
originates in
the intestinal gland cells that line the inside of the colon and/or rectum.
Adenocarcinomas can
include tubular adenocarcinomas, which are glandular cancers on a pedunculated
stalk, and
villous adenocarcinomas, which are glandular cancers that lie flat on the
surface of the colon.
Other colorectal cancers are distinguished by their tissue of origin. These
include gastrointestinal
stromal tumors (GIST), which arise from the interstitial cells of Cajal;
primary colorectal
lymphomas, which arise from hematologic cells; leiomyosarcomas, which are
sarcomas arising
from connective tissue or smooth muscle; melanomas, which arise from
melanocytes: squamous
cell carcinomas which arise from stratified squamous epithelial tissue and are
confined to the
rectum; and mucinous carcinomas, which are epithelial cancers generally
associated with poor
prognosis.
[0089]
Symptoms of colorectal cancer can include, but are not limited to, a change in
bowel habits, including diarrhea or constipation or a change in the
consistency of the stool
lasting longer than four weeks, rectal bleeding or blood in the stool,
persistent abdominal
discomfort such as cramps, gas or pain, a feeling that the bowel does not
empty completely,
weakness or fatigue, and unexplained weight loss. Patients suspected of having
colorectal cancer
may receive peripheral blood tests, including a complete blood count (CBC), a
fecal occult blood
test (FOBT), a liver function analysis, a fecal immunochemical test (FIT),
and/or other analysis
CA 03077798 2020-04-01
WO 2018/081580 PCT/US2017/058789
of certain tumor markers, for example carcinoembryonic antigen (CEA) and CA19-
9. Colorectal
cancer is often diagnosed based on colonoscopy. During colonoscopy, any polyps
that are noted
are removed, biopsied and analyzed to determine whether the polyp contains
colorectal cancer
cells or cells that have undergone a precancerous change. Each one of the
specific cancers listed
above can look different when viewed through an endoscope. Villous adenomas
melanomas, and
squamous cell carcinomas are typically flat or sessile, whereas tubular
adenomas, lymphomas,
leiomyosarcomas and GIST tumors are typically pedunculated. However, flat and
sessile
adenomas can be missed by gastroenterologists during colonoscopies. Biopsy
samples can be
subjected to further analysis based on genetic changes of particular genes or
microsatellite
instability.
[0090] Other diagnostic methods can include, sigmoidoscopy, imaging
tests, for
example, computed tomography (CT or CAT) scans; ultrasound, for example
abdominal,
endorectal or intraoperative ultrasound, magnetic resonance imaging (MM)
scans, for example
endorectal Mill. Other tests such as angiography and chest x-rays can be
carried out to determine
whether a colorectal cancer has metastasized.
[0091] A variety of methods for staging colorectal cancer have been
developed. The most
commonly used system, the TNM system is based on three factors: 1) the
distance that the
primary tumor (T) has grown into the wall of the intestine and nearby areas;
2) whether the
tumor has spread to nearby regional lymph nodes (N); 3) whether the cancer has
metastasized to
other organs (M). Other methods of staging include Dukes staging and the
Astler-Coller
classification.
[0092] The TNM system provides a four-stage classification of colorectal
cancer. In
Stage 1 (Ti) colorectal cancer, the tumor has grown into the layers of the
colon wall, but has not
spread outside the colon wall or into lymph nodes. If the cancer is part of a
tubular adenoma
polyp, then simple excision is performed and the patient can continue to
receive routine testing
for future cancer development. If the cancer is high grade or part of a
flat/sessile polyp, more
surgery might be required and larger margins will be taken; this might include
partial colectomy
where a section of the colon is resected. In Stage 2 (T2) colorectal cancer,
the tumor has grown
into the wall of the colon and potentially into nearby tissue but has not
spread to nearby lymph
26
CA 03077798 2020-04-01
WO 2018/081580 PCT/US2017/058789
nodes. Surgical removal of the tumor and a partial colectomy is generally
performed. Adjunct
therapy, for example, chemotherapy with agents such as 5-fluorouracil,
leucovorin, or
capecitabine, may be administered. Such tumors are unlikely to recur, but
increased screening of
the patient is generally needed. In Stage 3 (T3) colorectal cancer, the tumor
has spread to nearby
lymph nodes, but not to other parts of the body. Surgery to remove the section
of the colon and
all affected lymph nodes will be required. Chemotherapy, with agents such as 5-
fluorouracil,
leucovorin, oxaliplatin, or capecitabine combined with oxaliplatin is
typically recommended.
Radiation therapy may also be used depending on the age of the patient and
aggressive nature of
the tumor. In Stage 4 (T4) colorectal cancer, the tumor has spread from the
colon to distant
organs through the blood. Colorectal cancer most frequently metastasizes to
the liver, lungs
and/or peritoneum. Surgery is unlikely to cure these cancers and chemotherapy
and or radiation
are generally needed to improve survival rates.
[0093] The methods disclosed herein are generally useful for diagnosis
and treatment of
colorectal cancer. The level of two or more colorectal neoplasm biomarker
genes is measured in
a biological sample, that is a sample from a subject. The subject can be a
patient having one or
more of the symptoms described above that would indicate the patient is at
risk for colorectal
cancer. The subject can also be a patient having no symptoms, but who may be
at risk for
colorectal cancer based on age (for example, above age 50), family history,
obesity, diet, alcohol
consumption, tobacco use, previous diagnosis of colorectal polyps, race and
ethnic background,
inflammatory bowel disease, and genetic syndromes, such as familial
adenomatous polyposis,
Gardner syndrome, Lynch syndrome, Turcot syndrome, Peutz-Jeghers syndrome, and
MUTYH-
associated polyposis, associated with higher risk of colorectal cancer. The
methods disclosed
herein are also useful for monitoring a patient who has previously been
diagnosed and treated for
colorectal cancer in order to monitor remission and detect cancer recurrence.
[0094] In some embodiments, the disease-state of a subject, that is, a
human or non-
human animal patient, is determined by pathological evaluation. For example,
in one type of
disease, such as colorectal cancer, the extent of disease is classified as
stage 1 (Ti), stage 2 (T2),
stage 3 (T3), and stage 4 (T4). The colorectal cancer can be a tubular
adenocarcinoma, a villous
adenocarcinoma, a gastrointestinal stromal tumor, a primary colorectal
lymphoma, a
leiomysarcoma, melanoma, a squamous cell carcinoma, or a mucinous carcinoma.
In another
27
CA 03077798 2020-04-01
WO 2018/081580 PCT/US2017/058789
type of disease, such as inflammatory bowel disease, the disease-state is
determined by location
of the disease along the intestinal tract and histological features such as
granulomas, leukocyte
infiltrates and/or crypt abscesses. Other methods for determining disease-
state such as physician
determination, physical symptoms, fecal occult blood test, a fecal
immunochemical test,
sigmoidoscopy, FIT-DNA, CT Colonography, or a colonoscopy can also be used in
conjunction
with the methods disclosed herein.
[0095] Also provided are methods of determining whether a subject is at
risk for
intestinal disease. Intestinal disease can include intestinal cancer,
colorectal cancer, adenomatous
polyps indicative of pre-cancerous change, irritable bowel syndrome,
ulcerative colitis, Crohn's
disease or other intestinal disease. The method of determining whether a
subject is at risk for
intestinal disease can be determined by using the invention to detect a) a
sequence of
deoxyribonucleic acid (DNA), b) a sequence of ribonucleic acid (RNA), c) a
predicted amino
acid sequence, which comprises the backbone of protein, d) expression levels
of ribonucleic acid
biomarkers, e) prediction in the variation of a sequence in amino acid or f)
any combination of
the above, wherein a difference between the control and the experimental
sample can indicate
that the subject is at risk for intestinal disease.
[0096] The methods and compositions are also useful for selecting a
clinical plan for a
subject suffering from intestinal disease. Through this method, the clinical
plan can include
administration of further diagnostic procedures. In some embodiments, the
clinical plan can
include a method of treatment.
[0097] The level of two or more colorectal neoplasm biomarker genes
selected from
Figure 6 (Panel A) or Figure 13 (Panel B) can be analyzed in a subject at risk
for or having
colorectal cancer. In some embodiments, the level of one, two, or more
colorectal neoplasm
biomarker genes selected from Figure 6 (Panel A) or Figure 13 (Panel B) can be
analyzed in a
subject at risk for or having colorectal cancer. The colorectal neoplasm
biomarker genes listed in
Figure 6 (Panel A) or Figure 13 (Panel B) can form a panel. In some
embodiments, the two or
more biomarkers can include combinations of 2, 3, 4, 5, 6, 7, 8, 9, 10, 11,
12, 13, 14, 15, 16, 17,
18, 19, 20, 21, 22, 23, 24, 25, 30, 35, 40, 45, 50, 60, 70, 80, 90, 100, 120,
140, 160, 180 or more
of the markers in Figure 6 (Panel A) or Figure 13 (Panel B). In some
embodiments, the markers
28
CA 03077798 2020-04-01
WO 2018/081580 PCT/US2017/058789
can be contained within differentially expressed transcript clusters and/or
common pathways
associated with colorectal cancer. Exemplary pathways include microsatellite
instability (MSI),
chromosomal instability (CIN), and CpG island methylator phenotype (CIMP). In
some
embodiments, the pathways can be cellular components pathways, cellular
response to stress,
stress, and RNA binding pathways.
[0098] Algorithms for determining diagnosis, status, or response to
treatment, for
example, can be determined for particular clinical conditions. The algorithms
used in the
methods provided herein can be mathematic functions incorporating multiple
parameters that can
be quantified using, without limitation, medical devices, clinical evaluation
scores, or
biological/chemical/ physical tests of biological samples. Each mathematic
function can be a
weight-adjusted expression of the levels (e.g., measured levels) of parameters
determined to be
relevant to a selected clinical condition. Because of the techniques involved
in weighting and
assessing multiple marker panels, computers with reasonable computational
power can be used
to analyze the data.
[0099] Thus, the method of diagnosis can include obtaining a stool sample
from a patient
at risk for or suspected of having colorectal cancer; determining the
expression of two or more
colorectal neoplasm biomarker genes selected from Figure 6 (Panel A) or Figure
13 (Panel B)
and providing a test value by the machine learning algorithms that incorporate
a plurality of
colorectal neoplasm biomarker genes selected from any of the panels of
colorectal neoplasm
biomarker genes with a predefined coefficient. Exemplary machine learning
algorithms include
Support Vector Machine, Gradient Boosting, Adaptive Boosting, Random Forest,
Naive Bayes,
Decision Tree, and k-Nearest Neighbors. A significant change in expression of
a plurality of
colorectal neoplasm biomarker genes relative to the control, for example, a
population of healthy
individuals, indicates an increased likelihood that the patient has colorectal
cancer and/or a
precancerous lesion. In some embodiments, the expression levels measured in a
sample are used
to derive or calculate a probability or a confidence score. This value may be
derived from
expression levels. Alternatively, or in addition, the value can be derived
from a combination of
the expression value with other factors, for example, the patient's medical
history, age, and
genetic background. In some embodiments, the method can further comprise the
step of
communicating the test value to the patient.
29
CA 03077798 2020-04-01
WO 2018/081580 PCT/US2017/058789
[0100] Standard computing devices and systems can be used and
implemented, e.g.,
suitably programmed, to perform the methods described herein, e.g., to perform
the calculations
needed to determine the values described herein. Computing devices include
various forms of
digital computers, such as laptops, desktops, mobile devices, workstations,
personal digital
assistants, servers, blade servers, mainframes, and other appropriate
computers. In some
embodiments, the computing device is a mobile device, such as personal digital
assistant, cellular
telephone, smartphone, tablet, or other similar computing device.
[0101] In some embodiments, a computer can be used to communicate
information, for
example, to a healthcare professional. Information can be communicated to a
professional by
making that information electronically available (e.g., in a secure manner).
For example,
information can be placed on a computer database such that a health-care
professional can access
the information. In addition, information can be communicated to a hospital,
clinic, or research
facility serving as an agent for the professional. Information transferred
over open networks
(e.g., the interne or e- mail) can be encrypted. Patient's gene expression
data and analysis can be
stored in the cloud with encryption. The method 256-bit ABS with tamper
protection can be used
for disk encryption; SSL protocol preferably can ensure protection in data
transit, and key
management technique SHA2-HMAC can allow authenticated access to the data.
Other secure
data storage means can also be used.
[0102] The results of such analysis above can be the basis of follow-up
and treatment by
the attending clinician. If the expression level of two or more colorectal
neoplasm biomarker
genes selected from Figure 6 (Panel A) or Figure 13 (Panel B) is not
significantly different from
the expression level of the same two or more colorectal neoplasm biomarkers in
a control, the
clinician may determine that the patient is presently not at risk for
colorectal cancer or a
precancerous lesion. Such patients can be encouraged to return in the future
for rescreening. The
methods disclosed herein can be used to monitor any changes in the levels of
the colorectal
neoplasm markers over time. A subject can be monitored for any length of time
following the
initial screening and/or diagnosis. For example, a subject can be monitored
for at least 2, 4, 6, 8,
10, 12, 14, 16, 18, 20, 25, 30, 35, 40, 45, 50, 55, or 60 months or more or
for at least 1, 2, 3, 4, 5,
6, 7, 8, 9, 10, 11, 12, 13, 14, 15, 16, 17, 18, 19, 20 or more years.
CA 03077798 2020-04-01
WO 2018/081580 PCT/US2017/058789
[0103] The methods and compositions disclosed herein are useful for
selecting a clinical
plan for a subject at risk for or suffering from colorectal neoplasm. The
clinical plan can include
administration of further diagnostic procedures, for example, a fecal occult
blood test, a fecal
immunochemical test, or a colonoscopy to remove polyps or precancerous
lesions. In some
embodiments, the clinical plan can include a method of treatment. In some
embodiments, the
methods include methods of selecting a treatment for a subject having
colorectal cancer. If the
expression level of two or more colorectal neoplasm biomarker genes selected
from Figure 6
(Panel A) or Figure 13 (Panel B) is significantly different from the
expression level of the same
two or more colorectal neoplasm biomarker genes in a control, the patient may
have colorectal
cancer. In these instances, further screening may be recommended, for example,
increased
frequency of screening using the methods disclosed herein, as well as a fetal
occult blood test, a
fecal immunochemical test, and/or a colonoscopy. In some embodiments,
treatment may be
recommended, including, for example, a colonoscopy with removal of polyps,
chemotherapy, or
surgery, such as bowel resection. Thus, the methods can be used to determine
the level of
expression of two or more colorectal neoplasm biomarker genes and then to
determine a course
of treatment. A subject, that is a patient, is effectively treated whenever a
clinically beneficial
result ensues. This may mean, for example, a complete resolution of the
symptoms of a disease, a
decrease in the severity of the symptoms of the disease, or a slowing of the
disease's progression.
These methods can further include the steps of a) identifying a subject (e.g.,
a patient and, more
specifically, a human patient) who has colorectal cancer; and b) providing to
the subject an
anticancer treatment, for example, a therapeutic agent, surgery, or radiation
therapy. An amount
of a therapeutic agent provided to the subject that results in a complete
resolution of the
symptoms of a disease, a decrease in the severity of the symptoms of the
disease, or a slowing of
the disease's progression is considered a therapeutically effective amount.
The present methods
may also include a monitoring step to help optimize dosing and scheduling as
well as predict
outcome. Monitoring can also be used to detect the onset of drug resistance,
to rapidly
distinguish responsive patients from nonresponsive patients or to assess
recurrence of a cancer.
Where there are signs of resistance or nonresponsiveness, a clinician can
choose an alternative or
adjunctive agent before the tumor develops additional escape mechanisms.
[0104] The methods disclosed herein can also be used in combination with
conventional
methods for diagnosis and treatment of colorectal cancer. Thus, the diagnostic
methods can be
31
CA 03077798 2020-04-01
WO 2018/081580 PCT/US2017/058789
used along with standard diagnostic methods for colorectal cancer. For
example, the methods can
be used in combination with a fecal occult blood test, a fecal immunochemical
test, or a
colonoscopy. The methods can also be used with other colorectal cancer
markers, for example,
KRAS, NRAS, BRAF, CEA, CA 19-9, p53, MSL, DCC and MMR.
[0105] The diagnostic methods disclosed herein can also be used in
combination with
colorectal cancer treatments. Colorectal cancer treatment methods fall into
several general
categories: surgery, chemotherapy, radiation therapy, targeted therapy and
immunotherapy.
Surgery can include colectomy, colostomy along with partial hepatectomy, or
protectomy.
Chemotherapy can be systemic chemotherapy or regional chemotherapy in which
the
chemotherapeutic agents are placed in direct proximity to an affected organ.
Exemplary
chemotherapeutic agents can include 5-fluorouracil, oxaliplatin or derivatives
thereof, irinotecan
or a derivative thereof, leucovorin, or capecitabine, mitomycin C, cisplatin
and doxorubicin.
Radiation therapy can be external radiation therapy, using a machine to direct
radiation toward
the cancer or internal radiation therapy in which a radioactive substance is
placed directly into or
near the colorectal cancer. Targeted agents can include anti-angiogenic agents
such as
bevacizumab) or EGFR inhibitor monoclonal antibody (cetuximab, panitumumab),
ramuciramab
(anti-VEGFR2), aflibercept, regorafenib, tripfluridine-tipiracil or a
combination thereof.
Targeted agents can also be combined with standard chemotherapeutic agents.
Immunotherapy
can include administration of specific antibodies, for example anti-PD-1
antibodies, anti-PD-L-1
antibodies, and time-CTLA-4 antibodies, anti--CD 27 antibodies; cancer
vaccines, adoptive cell
therapy, oncolytic virus therapies, adjuvant immunotherapies, and cytokine-
based therapies.
Other treatment methods include stem cell transplantation, hyperthermia,
photodynamic therapy,
blood product donation and transfusion, or laser treatment.
[0106] We may use the terms "increased", "increase" or "up-regulated" to
generally mean
an increase in the level of a biomarker by a statistically significant amount.
In some
embodiments, an increase can be an increase of at least 10% as compared to a
control, for
example an increase of at least about 20%, or at least about 30%, or at least
about 40%, or at
least about 50%, or at least about 60%, or at least about 70%, or at least
about 80%, or at least
about 90% or up to and including a 100% increase or any increase between 10-
100% as
compared to a control, or at least about a 0.5-fold, or at least about a 1.0-
fold, or at least about a
32
CA 03077798 2020-04-01
WO 2018/081580 PCT/US2017/058789
1.2-fold, or at least about a 1.5-fold, or at least about a 2-fold, or at
least about a 3-fold, or at
least about a 4-fold, or at least about a 5-fold or at least about a 10-fold
increase, or any increase
between 1.0-fold and 10-fold or greater as compared to a control.
[0107] We may use the terms "decrease", "decreased", "reduced",
"reduction" or "down-
regulated" to refer to a decrease in the level of a eukaryotic biomarker by a
statistically
significant amount. In some embodiments, a decrease can be a decrease of at
least 10% as
compared to a control, for example a decrease of at least about 20%, or at
least about 30%, or at
least about 40%, or at least about 50%, or at least about 60%, or at least
about 70%, or at least
about 80%, or at least about 90% or up to and including a 100% decrease (i.e.
absent level as
compared to a control), or any decrease between 10-100% as compared to a
control, or at least
about a 0.5-fold, or at least about a 1.0-fold, or at least about a 1.2-fold,
or at least about a 1.5-
fold, or at least about a 2-fold, or at least about a 3-fold, or at least
about a 4-fold, or at least
about a 5-fold or at least about a 10-fold decrease, or any decrease between
1.0-fold and 10-fold
or greater as compared to a control.
[0108] The statistical significance of an increase in a eukaryotic
biomarker or a decrease
in a eukaryotic biomarker can be expressed as a p-value. Depending upon the
specific eukaryotic
biomarker, p-value can be less than 0.05, less than 0.01, less than 0.005,
less than 0.002, less
than 0.001, or less than 0.0005.
[0109] A control can be a biological sample obtained from a patient or a
group of
patients. In some embodiments, the control can be a reference value. A control
can be obtained
from an individual, or a population of individuals, who have been diagnosed as
healthy. Healthy
individuals can include, for example, individuals who have tested negative in
a fecal parasitic
test, a fecal bacteria test, or an endoscopy within the last year. A control
can be obtained from an
individual, or a population of individuals, who have been diagnosed as
diseased. Diseased
individuals can include, for example, individuals who have tested positive in
a fecal parasitic
test, a fecal bacterial test, or an endoscopy within the last year. A control
can be obtained from
an individual, or a population of individuals, who had previously been
diagnosed with disease
but are currently in remission or are not currently suffering from the
disease. A control can be
obtained from an individual at one, two, or more points in time. For example,
a control can be a
33
CA 03077798 2020-04-01
WO 2018/081580 PCT/US2017/058789
biological sample obtained from a subject at an earlier point in time. A
control can be a standard
reference value for a particular biomarker. A standard reference value can be
derived based on
evaluating individuals of similar age, sex, gender, body size, breed, ethnic
background, or
general health.
[0110] An experimental sample can be a biological sample obtained from a
subject. An
experimental sample can be obtained from a subject with known or unknown
health status. In
some embodiments, health status of a subject can be determined, for example,
by analysis of an
experimental sample, biopsy, physical examination, laboratory findings, visual
inspection or
genetic analysis. The health status of a subject that can be determined via an
experimental
sample can be diseased, at risk for disease, or healthy.
Articles of Manufacture
[0111] Also provided are kits for detecting and quantifying selected
colorectal neoplasm
biomarkers in a biological sample, for example, a stool sample. Accordingly,
packaged products
(e.g., sterile containers containing one or more of the compositions described
herein and
packaged for storage, shipment, or sale at concentrated or ready-to-use
concentrations) and kits,
are also within the scope of the invention. A product can include a container
(e.g., a vial, jar,
bottle, bag, microplate, microchip, or beads) containing one or more
compositions of the
invention. In addition, an article of manufacture further may include, for
example, packaging
materials, instructions for use, syringes, delivery devices, buffers or other
control reagents.
[0112] The kit can include a compound or agent capable of detecting RNA
corresponding
to two or more of the colorectal neoplasm biomarker genes selected from Figure
6 (Panel A) or
Figure 13 (Panel B) in a biological sample; and a standard; and optionally one
or more reagents
necessary for performing detection, quantification, or amplification. In some
embodiments, the
kit can include a compound or agent capable of detecting RNA corresponding to
two or more of
a B cell marker, a T cell marker, or an immunoglobulin, in a biological
sample; and a standard;
and optionally one or more reagents necessary for performing detection,
quantification, or
amplification. The compounds, agents, and/or reagents can be packaged in a
suitable container.
The kit can further comprise instructions for using the kit to detect and
quantify nucleic acid.
For example, the kit can include: (1) a probe, e.g., an oligonucleotide, e.g.,
a detectably labeled
34
CA 03077798 2020-04-01
WO 2018/081580 PCT/US2017/058789
oligonucleotide, which hybridizes to a nucleic acid sequence corresponding to
a two or more of
the colorectal biomarker genes selected from selected from Figure 6 (Panel A)
or Figure 13
(Panel B) or a B cell marker, a T cell marker, or an immunoglobulin or (2) a
pair of primers
useful for amplifying a nucleic acid molecule corresponding to two or more of
the colorectal
biomarker genes selected from selected from Figure 6 (Panel A) or Figure 13
(Panel B) or a B
cell marker, a T cell marker, or an immunoglobulin. The kit can further
include probes and
primers useful for amplifying one or more housekeeping genes. The kit can also
include a
buffering agent, a preservative, and/or a nucleic acid or protein stabilizing
agent. The kit can
also include components necessary for detecting the detectable agent (e.g., an
enzyme or a
substrate). The kit can also contain a control or a series of controls which
can be assayed and
compared to the test sample contained. Each component of the kit can be
enclosed within an
individual container and all of the various containers can be within a single
package, along with
instructions for interpreting the results of the assays performed using the
kit. In some
embodiments, the kits can include primers or oligonucleotide probes specific
for one or more
control markers. In some embodiments, the kits include reagents specific for
the quantification
of two or more of the colorectal biomarkers selected from selected from Figure
6 (Panel A) or
Figure 13 (Panel B) or a B cell marker, a T cell marker, or an immunoglobulin.
[0113] In some embodiments, the kit can include reagents specific for the
separation of
human cells from bacterial cells and other stool components and extraction of
human mRNA
from a patient's stool sample. Thus, the kit can include buffers, emulsion
beads, silica beads,
stabilization reagents and various filters and containers for centrifugation.
The kit can also
include instructions for stool handling to minimize contamination of samples
and to ensure
stability of human mRNA in the stool sample. The kit can also include items to
ensure sample
preservation, for example, coolants or heat packs. In some embodiments, the
kit can include a
stool collection device.
[0114] The product may also include a legend (e.g., a printed label or
insert or other
medium describing the product's use (e.g., an audio- or videotape or computer
readable
medium)). The legend can be associated with the container (e.g., affixed to
the container) and
can describe the manner in which the reagents can be used. The reagents can be
ready for use
(e.g., present in appropriate units), and may include one or more additional
adjuvants, carriers or
CA 03077798 2020-04-01
WO 2018/081580 PCT/US2017/058789
other diluents. Alternatively, the reagents can be provided in a concentrated
form with a diluent
and instructions for dilution.
EXAMPLES
Example 1: Human Stool Sample Procurement
[0115] Human Stool Collection: Patients were asked to defecate into a
bucket that fit
over a toilet seat and the resulting samples were stored in a freezer until
they were transported to
the Kharkiv National Medical University (Kharkiv, Ukraine). The stool was
aliquoted into 50
mL conical tubes and stored at -80 C. The samples were shipped from Kharkiv
National Medical
University on dry ice to Capital Biosciences (Gaithersburg, MD) and
immediately transferred to
a -80 C freezer. From there, the samples were shipped on dry ice to
BioGenerator Labs (Saint
Louis, MO) where they were stored in a -80 C freezer until extraction.
[0116] Human Sample Types: Stool samples were obtained from 195 patients
with
colorectal cancer (stage I-TV), 126 patients with pre-cancerous adenomas, 125
patients had
negative findings on a colonoscopy, and 8 patients had benign polyps.
resulting in 454 aggregate
samples. Healthy individuals were patients with no history of colorectal
cancer, inflammatory
bowel disease, celiac disease, irritable bowel syndrome, diarrhea within the
last 20 days or any
other gastrointestinal disease. Diseased individuals were patients diagnosed
with colorectal
cancer and precancerous polyps. Colorectal cancer patients had been diagnosed
with stage I-
stage IV colorectal cancer via colonoscopy and subsequent biopsy within the
last month and had
not yet received any post-biopsy treatment, which can include chemotherapy,
radiation, and/or
surgery. Polyp patients provided a stool sample prior to undergoing a
colonoscopy where the
physician detected a polyp that was deemed to be precancerous via a subsequent
biopsy and
histological evaluation. The healthy individuals were matched with polyp and
cancer patients
based on gender and age brackets (50-60 years, 60-70 years, 70-80 years and 80-
90 years). The
patients used for this study were consented by Capital Biosciences. The
Schulman Internal
Review Board provided ethical oversight for this study.
Example 2: Human Nucleic Acid Extraction
36
CA 03077798 2020-04-01
WO 2018/081580 PCT/US2017/058789
[0117] Total Nucleic Acid Extraction: Each stool sample was placed into a
50 mL
conical tube. Approximately 1,000-25,000 mg of stool were added to each tube.
An additional
20-40 mL of solution were added to each tube. This solution contained a
mixture of Hanks
Balanced Salt Solution (HB SS) (Sigma-Aldrich) with 0.05% Tween-20 (Sigma-
Aldrich) and
0.0002% RNAse Inhibitor (Sigma-Aldrich). The stool was suspended into solution
and rotated at
approximately 0-10 C for 0-10 minutes. The solution was centrifuged at 1000
rpm at 4 C for 10
minutes and the supernatant was discarded. Approximately 4-10 mL of EasyMagg
Lysis Buffer
(bioMerieux) was added to the pellet and the pellet was re-suspended into
solution. The solution
was centrifuged at 2500-3500 rpm at 20-25 C for 10-15 minutes. During the
differential
centrifugation, the solution separated into three layers. The bottom layer
included solid cellular
debris, the middle layer was a hydrophilic layer enriched for human nucleic
acid and the top
layer was a hydrophobic lipid layer. The top two layers were transferred to a
new 15 mL conical
tube and the solution was again centrifuged at 2500 rpm at 20-25 C for 10
minutes. The result
from this centrifugation step was separation into three layers: the bottom
layer was solid cellular
debris, the middle layer was a hydrophilic layer enriched for human nucleic
acid and the top
layer was a hydrophobic lipid layer. To screen large debris from the solution,
a 20uL pipette tip
was placed onto a lmL pipette tip and 2mL of the hydrophilic layer was
pipetted from the 15mL
tube and transferred to an EasyMagg Disposable cartridge (bioMerieux).
Additionally, 60 uL of
EasyMagg Magnetic Silica (bioMerieux) was added to the cartridge. The beads
were mixed into
the solution for 0.5-1 minute using a pipette. The nucleic acids, which were
bound to the beads,
were eluted into a buffer solution using the Specific A Protocol according to
the manufacturer's
directions. The volume of the eluted nucleic acids was 70 uL. This nucleic
acid solution was
pipetted into a 1.5mL tube and placed on ice. The same EasyMagg Disposable
cartridges
(bioMerieux) that were used in the previous step were then reloaded with an
additional 2mL of
the hydrophilic layer from the same solution in the 15mL tube used previously
using the same
technique to screen out large debris. An additional 20 uL of EasyMagg Magnetic
Silica
(bioMerieux) was added to the cartridge. The beads were mixed into the
solution for 0.5-1
minute using a pipette. As described above, the nucleic acids, which were
bound to the beads,
were eluted into a buffer solution using the Specific A Protocol according to
the manufacturer's
directions. The volume of the eluted nucleic acids was 70 uL. This nucleic
acid solution was
37
CA 03077798 2020-04-01
WO 2018/081580 PCT/US2017/058789
pipetted into the original 1.5mL tube that already contained first 70 uL
eluate and the combined
solution was placed on ice.
[0118] DNAse Treatment: The 140 uL solution was treated with Baseline-
Zero- DNase
(Epicenter) at 35-40 C for 20-40 minutes. A 1-2 mL aliquot of EasyMagg Lysis
Buffer was
added to the DNAse treated solution and the sample was transferred to a new
EasyMagg
Disposable cartridge. The entire solution was added to the new cartridge along
with 60 uL of
EasyMagg Magnetic Silica. The nucleic acids, which were bound to the beads,
were eluted into
a buffer solution using the EasyMagg Generic Protocol according to the
manufacturer's
directions. The volume of the eluted nucleic acids was 25 uL. This nucleic
acid solution was
pipetted into a 1.5mL tube and stored at 0-6 C.
Example 3: Measurement of Human Nucleic Acid Levels in Human Stool Samples
[0119] Extraction Results: Using the sample that was extracted above, 1
uL was
evaluated for total nucleic acid and RNA integrity using the Agilent 2100
Bioanalyzer. The
samples were analyzed qualitatively and quantitatively. Electrophoretic
analysis was used to
check the quality of the extracted RNA. The results of the Bioanalyzer output
were analyzed by
gel electrophoresis as shown in Figure 1 and Figure 2. The electrophoresis
file (Figure 1) was
read by comparing the bands for each sample to the bands represented by the
size markers in the
RNA ladder (shown in the first lane of the electropherogram) and identifying
the 18S and 28S
ribosomal RNA bands. The ribosomal RNA (rRNA) are the two large and prominent
bands
around the 2,000 nucleotide marker on the standardization ladder.
Qualitatively, adequate
banding and darker band intensities indicated that ample intact nucleic acid
was available for
further analysis such as microarray sequencing, polymerase chain reaction
(PCR), nucleic acid
sequencing, molecular barcoding, or probe-capture. Figure 2 shows an example
of an
electropherogram. The electropherogram is a graphical representation for each
electrophoresis
with a quantification of the total RNA mass, RIN, and total rRNA mass. The gel
electrophoresis
analysis provided information on the total nucleic acid and the RNA integrity.
Electrophoresis
diagrams and electropherograms were analyzed for each sample to determine if
the sample was
eligible for downstream analysis. In one example, 120 sample that were
extracted using the
38
CA 03077798 2020-04-01
WO 2018/081580 PCT/US2017/058789
methods described in the invention were analyzed for RNA quality such that of
the 120 samples
analyzed, 110 passed quality check in terms of RNA Integrity and RNA mass
(Figure 3).
[0120] The electropherograms and electrophoresis traces were used to
compare samples
passing quality check using the RNA extraction methods described in the
invention compared to
the RNA extraction methods described in the literature. In comparison to the
protocol described
in the literature, the nucleic acid extraction method described above
increased the average RIN to
4.88 (n=168). Additionally, the total time required to complete the protocol
was decreased from
3 days to 5 hours. The total RNA extraction method significantly increased the
number of
samples eligible for transcriptome analysis from 50%, as described in the
literature, to 98.2% in
the described protocol (n=168; p<0.0001) as measured by ribosomal RNA
integrity and mass
(Figure 4).
Example 4: Analysis of RNA transcripts
[0121] Of the 454 samples that were subjected to total RNA extraction,
399 of these
samples were eligible for transcriptome analysis based on direct visualization
of the ribosomal
RNA bands using an Agilent Bioanalyzer. Subsequently, 342 samples were
randomly selected
from the 399 available samples to undergo whole-transcriptome analysis using
the Affymetrix
GeneChipTM Human Transcriptome Array 2.0 (Santa Clara, CA). Of these 342
samples, 4
samples failed amplification and 8 patients with polyps were determined to
have hyperplastic
benign polyps through a subsequent biopsy. These 12 samples were removed from
the analysis,
resulting in 330 samples for final analysis.
[0122] Approximately 100 ng of DNase-free fecal RNA was amplified with
the Ambio
WT-pico kit with subsequent hybridization to the Affymetrix GeneChipTM Human
Transcriptome Array 2.0 as per the manufacturer's protocol. All samples were
normalized using
the Signal Space Transformation-Robust Multiarray Analysis (SST-RMA) with the
Affymetrix
Expression ConsoleTM.
[0123] Of the 70,523 transcript clusters in the Affymetrix Microarray, a
subset of 5,149
transcript clusters that correspond to 3,977 genes were preselected to
evaluate for differential
expression. This initial selection reduced the false discovery rate and
filtered out genes that have
39
CA 03077798 2020-04-01
WO 2018/081580 PCT/US2017/058789
no known function in cancer development and progression. We explored seven
machine learning
classifiers (Support Vector Machine, Gradient Boosting, Adaptive Boosting,
Random Forest,
Naive Bayes, Decision Tree, and k-Nearest Neighbors) for colorectal neoplasm
detection.
[0124] The 330 individuals were split into a training set of 265
individuals and a testing
set of 65 individuals. The training set was used to identify the
differentially expressed genes and
build a computational model, whereas the testing set was used to determine the
detection
accuracy of the computational model. The standard LIMMA package was used to
identify a
subset of RNA transcript clusters which were differentially expressed between
individuals with
either precancerous adenomas or CRC and individuals with no findings on a
colonoscopy. All
biomarkers were ranked according to the log odds scores and the 200 highest
ranked biomarkers
(p<0.05) served as the features in building the machine learning model (Figure
4). A heat map
describing the hierarchical clustering of these genes is summarized in Figure
5A and significant
pathways associated with the differentially expressed genes are summarized in
Figure 5B. There
were five gene clusters associated with the differentially expressed
transcripts within the three
populations to segregate individuals with colorectal neoplasm from healthy
individuals. The
differentially expressed pathways showed enrichment for 22 Common GeneGO
Canonical
Pathways where the vast majority (77.7%) were upregulation of the Cellular
Components
pathway. Most notable was the upregulation of cellular response to stress,
response to stress, and
RNA binding. Common pathways associated with the disease were identified by
analyzing the
top 200 differentially expressed transcript clusters with GAGE software. The
pathways
associated with the disease are shown in Figure 5B. The Support Vector Machine
Model (v-
SVM) with RBF kernel was chosen for model development. The kernel function
allows for the
calculation of the distance between individuals by expanding the features into
a higher
dimensional space which is not explicitly computed. SVM finds the maximum
margin
hyperplane that separates the label groups. The parameter v defines the lower
bound of the
fraction of individuals that are used to determine the maximum margin. The SVM
model was
trained using expression levels for the 200 transcripts from all 265
individuals in the training set.
This multi-target RNA biomarker algorithm was used on the 65 individuals
within the testing set
and detected 79% (34 out of 43) of all individuals that had positive findings
on a screening
colonoscopy. The algorithm correctly predicted 95% of individuals with
precancerous adenomas
ranging in size from 5mm to 12mm, 57% of individuals with Stage I colorectal
cancer, 75% of
CA 03077798 2020-04-01
WO 2018/081580 PCT/US2017/058789
individuals with Stage II colorectal cancer, 66% of individuals with Stage II
colorectal cancer,
and 83% of individuals with Stage IV colorectal cancer. The model's
sensitivity for colorectal
cancer was directly correlated with size such that 60% of tumors < 3.5cm were
accurately
detected whereas 83% of tumors > 5.0cm in size were accurately detected. The
model attained a
specificity of 59% whereby 13 of the 22 individuals with negative findings on
a colonoscopy
were correctly identified by the model. Overall, the model attained a
sensitivity for colorectal
neoplasms of 79%, a sensitivity for precancerous adenomas of 95% and a
specificity of 59%.
[0125] Technological and biological replicates showed a high concordance
for
luminescence levels for all genes (Figure 10). Perfect technical replicates,
whereby the RNA was
isolated and evaluated on the same day, showed the highest level of
concordances (R2>0.990)
(Figure 10A). Technological replicates that were separated by time also showed
a high level of
concordance (R2>0.989). These replicates were derived by extracting RNA for
both replicates on
the same day, however one replicate was analyzed on day 0 and a second
replicate was analyzed
6 months later (Figure 10B). Finally, biological replicates also showed a high
level of
concordances (R2>0.986). These biological replicates were developed by taking
samples from
different segments of a stool that was derived from the same individual
(Figure 10C). The RNA
was extracted separately and analyzed on different days.
[0126] When analyzing only 5,149 genes that have been implicated in
colorectal cancer
development or progression, a subset of the whole transcriptome, adjusted R-
squared values
improved for all three cohorts of replicates. These replicates showed
comparable levels of
concordance as described above (Figure 11A-C).
Example 5: Animal Stool Sample Procurement
[0127] Stool Collection: Samples were collected locally in St. Louis, MO
by cat and dog
owners. Once cats defecated into a litter box, feline owners were asked to
transfer the sample
into a 50 mL conical tube and store the tube at -20 C. Once dogs defecated
outdoors, canine
owners were asked to transfer the sample into a 50 mL conical tube and store
the tube at -20 C.
Within one week of collection, samples were collected and manually transferred
to BioGenerator
Labs (Saint Louis, MO) where they were stored in a -80 C freezer until
extraction.
41
CA 03077798 2020-04-01
WO 2018/081580 PCT/US2017/058789
[0128] Sample Types: Stool samples were all obtained from healthy animals
of varying
ages, breeds and genders. 4 samples were collected from 4 different cats and
an additional 4
samples were collected from 4 different dogs, resulting in 8 aggregate
samples. One cat had
recently been diagnosed with ringworm, but all other animals were asymptomatic
and had not
exhibited any signs of gastrointestinal distress within the last 30 days.
Example 6: Animal Nucleic Acid Extraction
[0129] Total Nucleic Acid Extraction: Each stool sample was placed into a
50 mL
conical tube. Approximately 1,000-25,000 mg of stool were added to each tube.
An additional
20-40 mL of solution were added to each tube. This solution contained a
mixture of Hanks
Balanced Salt Solution (HB SS) (Sigma-Aldrich) with 0.05% Tween-20 (Sigma-
Aldrich) and
0.0002% RNAse Inhibitor (Sigma-Aldrich). The stool was suspended into solution
and rotated at
approximately 0-10 C for 0-10 minutes. The solution was centrifuged at 1000
rpm at 4 C for 10
minutes and the supernatant was discarded. Approximately 4-10 mL of EasyMagg
Lysis Buffer
(bioMerieux) was added to the pellet and the pellet was re-suspended into
solution. The solution
was centrifuged at 2500-3500 rpm at 20-25 C for 10-15 minutes. During the
differential
centrifugation, the solution separated into three layers. The bottom layer
included solid cellular
debris, the middle layer was a hydrophilic layer enriched for human nucleic
acid and the top
layer was a hydrophobic lipid layer. The top two layers were transferred to a
new 15 mL conical
tube and the solution was again centrifuged at 2500 rpm at 20-25 C for 10
minutes. The result
from this centrifugation step was separation into three layers: the bottom
layer was solid cellular
debris, the middle layer was a hydrophilic layer enriched for human nucleic
acid and the top
layer was a hydrophobic lipid layer. To screen large debris from the solution,
a 20uL pipette tip
was placed onto a lmL pipette tip and 2mL of the hydrophilic layer was
pipetted from the 15mL
tube and transferred to an EasyMagg Disposable cartridge (bioMerieux).
Additionally, 60 uL of
EasyMagg Magnetic Silica (bioMerieux) was added to the cartridge. The beads
were mixed into
the solution for 0.5-1 minute using a pipette. The nucleic acids, which were
bound to the beads,
were eluted into a buffer solution using the Specific A Protocol according to
the manufacturer's
directions. The volume of the eluted nucleic acids was 70 uL. This nucleic
acid solution was
pipetted into a 1.5mL tube and placed on ice. The same EasyMagg Disposable
cartridges
(bioMerieux) that were used in the previous step were then reloaded with an
additional 2mL of
42
CA 03077798 2020-04-01
WO 2018/081580 PCT/US2017/058789
the hydrophilic layer from the same solution in the 15mL tube used previously
using the same
technique to screen out large debris. An additional 20 uL of EasyMagg Magnetic
Silica
(bioMerieux) was added to the cartridge. The beads were mixed into the
solution for 0.5-1
minute using a pipette. As described above, the nucleic acids, which were
bound to the beads,
were eluted into a buffer solution using the Specific A Protocol according to
the manufacturer's
directions. The volume of the eluted nucleic acids was 70 uL. This nucleic
acid solution was
pipetted into the original 1.5mL tube that already contained first 70 uL
eluate and the combined
solution was placed on ice.
[0130] DNAse Treatment: The 140 uL solution was treated with Baseline-
Zero- DNase
(Epicenter) at 35-40 C for 20-40 minutes. A 1-2 mL aliquot of EasyMagg Lysis
Buffer was
added to the DNAse treated solution and the sample was transferred to a new
EasyMagg
Disposable cartridge. The entire solution was added to the new cartridge along
with 60 uL of
EasyMagg Magnetic Silica. The nucleic acids, which were bound to the beads,
were eluted into
a buffer solution using the EasyMagg Generic Protocol according to the
manufacturer's
directions. The volume of the eluted nucleic acids was 25 uL. This nucleic
acid solution was
pipetted into a 1.5mL tube and stored at 0-6 C.
Example 7: Measurement of Nucleic Acid Levels in Animal Stool Samples
[0131] Extraction Results: Using the samples that were extracted above, 1
uL of each
was evaluated for total nucleic acid and RNA integrity using the Agilent 2100
Bioanalyzer. The
samples were analyzed qualitatively and quantitatively. The results of the
Bioanalyzer output
were analyzed by gel electrophoresis as shown in Figure 7. The panel in Figure
7 shows RNA
Bioanalyzer traces of 1 uL from 8 samples that were run using Agilent RNA 6000
Nano Kits.
The gel electrophoresis analysis provided information on the total nucleic
acid and the RNA
integrity and mass. The electrophoresis file was read by comparing the bands
for each sample to
the bands represented by the size markers in the RNA ladder (shown in the
first lane of the
electropherogram) and identifying the 18S and 28S eukaryotic ribosomal RNA
bands.
Qualitatively, adequate banding and darker band intensities indicated that
ample intact nucleic
acid was available for further analysis such as microarray sequencing,
polymerase chain reaction
(PCR), nucleic acid sequencing, molecular barcoding, or probe-capture. The
sample quality was
43
CA 03077798 2020-04-01
WO 2018/081580 PCT/US2017/058789
also analyzed qualitatively using the RNA Integrity Number. Figure 7B shows
the RNA integrity
value for each of the same 8 samples that were run using Agilent RNA 6000 Nano
Kits. The
sample mass was also analyzed quantitatively. Figure 7C shows the estimated
eukaryotic RNA
concentration (ug/uL) from the same 8 samples that were run using Agilent RNA
6000 Nano
Kits. The eukaryotic RNA concentration was estimated using the area under the
curve of the
BioAnalyzer traces. As shown in Figure 7B-C, the average RIN for all samples
was 4.2 and the
average eukaryotic mass for all samples was 61.4ng/ L. The quantitative and
qualitative
measurements indicated that all samples were eligible for biomarker expression
analysis (n=8).
Example 8: Analysis of RNA Transcripts in Animal Stool Samples
[0132] All canine samples that were eligible for biomarker expression
analysis (n=4)
were evaluated using RT-qPCR. For these four canine samples, 5 primers were
designed to
evaluate portions of the canine genome. Two primers were designed to act as a
positive control
by evaluating the heavy chain of IgM on canine T-cells. Three additional
primers were designed
to evaluate two separate rearrangements that can occur in canine lymphoid
precursors to detect
T-cell specific RNA. Each RT-PCR reaction contained 10 uL 2X Master Mix (New
England
Biolabs), 1 uL 20X Enzyme Mix (New England BioLabs), 0.8 uL of 10 uM forward
primer
(Eurofins Genomics), 0.8 uL of 10 uM reverse primer (Eurofins Genomics), luL
20X SYBR
Green I, 2uL RNA, and 4.4 uL molecular biology grade H20 (Thermo Scientific).
The nucleic
acids were amplified using an Applied Biosystems QuantStudio5 qPCR machine.
The
thermocycler protocol was as follows: 25 minutes at 55 C to reverse
transcribe the RNA into
DNA, reverse transcriptase inactivation at 95 C for 1 minute, 60 cycles of 10
seconds at 95 C
and 45 seconds at 60 C for amplification and signal collection, and then a
melt curve from 70 C-
95 C. Of the 4 canine samples that were subjected to total RNA extraction, 75%
of the samples
showed amplification of the positive control (C-mu IgM) (Figure 8A). Of the
individuals that
showed amplification of the positive control, 100% (n=3) showed amplification
of both T-cell
specific RNA transcripts. One of the T-cell specific transcripts amplified at
35 cycles and the
other T-cell specific transcript amplified at 50 cycles (Figure 8B).
[0133] All feline samples that were eligible for biomarker expression
analysis (n=5) were
evaluated using RT-qPCR. For these four feline samples, two primers were
designed to act as a
44
CA 03077798 2020-04-01
WO 2018/081580
PCT/US2017/058789
positive control. These probes evaluated feline Actin-B to determine if there
was feline RNA
present in the nucleic acid extract. Each reaction contained:10uL 2X Master
Mix (New England
BioLabs), luL 20X Enzyme Mix (New England BioLabs), 0.8uL of 10uM forward
primer
(Eurofins Genomics), 0.8uL of 10uM reverse primer (Eurofins Genomics), luL 20X
SYBR
Green I, 2uL RNA, and 4.4uL molecular biology grade H20 (Thermo Scientific).
The solution
was amplified using an Applied Biosystems QuantStudio5 qPCR machine. The
thermocycler
protocol was as follows: 25 minutes at 55 C to reverse transcribe the RNA into
DNA, reverse
transcriptase inactivation at 95 C for 1 minute, 60 cycles of 10 seconds at 95
C and then 45
seconds at 60 C for amplification and signal collection. Of the 4 feline
samples that were
subjected total RNA extraction, 75% of the samples (n=4) showed amplification
of the positive
control (feline Actin-B) (Figure 9).
Example 9: Analysis of Canine B-cell Transcripts
[0134] All
canine samples that were eligible for biomarker expression analysis (n=4)
were evaluated using RT-qPCR. For these 4 canine samples, 6 primer sets were
designed to
evaluate portions of the canine genome related to lymphocytes (Figure 15A). Of
the 6 primer sets
designed, one primer set was used to evaluate two separate rearrangements that
can occur in
canine lymphoid precursors to detect B-cell specific RNA. Each reaction
contained lOuL 2X
Master Mix (New England Biolabs), 1 uL 20X Enzyme Mix (New England BioLabs),
0.8uL of
10uM forward primer (Eurofins Genomics), 0.8uL of 10uM reverse primer
(Eurofins Genomics),
luL 20X SYBR Green I, 2uL RNA, and 4.4uL molecular biology grade H20 (Thermo
Scientific). The solution was amplified using an Applied Biosystems
QuantStudio5 qPCR
machine. The thermocycler protocol was as follows: 25 minutes at 55 C to
reverse transcribe the
RNA into DNA, reverse transcriptase inactivation at 95 C for 1 minute, 60
cycles of 10 seconds
at 95 C and 45 seconds at 60 C for amplification and signal collection, and
then a melt curve
from 70 C-95 C. Examples of these amplification reactions are shown in Figure
16A. There
were 2 B-cell specific RT-qPCR reactions for each sample (n=8) and of these
reactions, 87.5%
(7 of 8) showed amplification of B-cell related transcripts. B-cell specific
transcripts amplified
between cycles 30 and 35 (Figure 16A).
Example 10: Extraction of Feline Sample Replicates
CA 03077798 2020-04-01
WO 2018/081580 PCT/US2017/058789
[0135] Stool Collection: Samples were collected locally in St. Louis, MO
by cat owners.
Once cats defecated into a litter box, feline owners were asked to transfer
the sample into a 50
mL conical tube and store the tube at -20 C. Within one week of production,
samples were
collected and manually transferred to BioGenerator Labs (Saint Louis, MO)
where they were
stored in a -80 C freezer until extraction.
[0136] Sample Types: Stool samples were all obtained from healthy animals
of varying
ages, breeds and genders. 8 samples were collected from 4 different cats. For
some cats, up to
three biological replicates were collected. We refer to a biological replicate
as a stool sample
from the same cat collected from separate bowel movements. One cat had
recently been
diagnosed with ringworm, but all other animals were asymptomatic and had not
exhibited any
signs of gastrointestinal distress within the last 30 days.
[0137] Total Nucleic Acid Extraction: Each stool sample was placed into a
50 mL
conical tube. Approximately 1,000-25,000 mg of stool were added to each tube.
An additional
20-40 mL of solution were added to each tube. This solution contained a
mixture of Hanks
Balanced Salt Solution (HB SS) (Sigma-Aldrich) with 0.05% Tween-20 (Sigma-
Aldrich) and
0.0002% RNAse Inhibitor (Sigma-Aldrich). The stool was suspended into solution
and rotated at
approximately 0-10 C for 0-10 minutes. The solution was centrifuged at 1000
rpm at 4 C for 10
minutes and the supernatant was discarded. Approximately 4-10 mL of EasyMagg
Lysis Buffer
(bioMerieux) was added to the pellet and the pellet was re-suspended into
solution. The solution
was centrifuged at 2500-3500 rpm at 20-25 C for 10-15 minutes. During the
differential
centrifugation, the solution separated into three layers. The bottom layer
included solid cellular
debris, the middle layer was a hydrophilic layer enriched for human nucleic
acid and the top
layer was a hydrophobic lipid layer. The top two layers were transferred to a
new 15 mL conical
tube and the solution was again centrifuged at 2500 rpm at 20-25 C for 10
minutes. The result
from this centrifugation step was separation into three layers: the bottom
layer was solid cellular
debris, the middle layer was a hydrophilic layer enriched for human nucleic
acid and the top
layer was a hydrophobic lipid layer. To screen large debris from the solution,
a 20uL pipette tip
was placed onto a lmL pipette tip and 2mL of the hydrophilic layer was
pipetted from the 15mL
tube and transferred to an EasyMagg Disposable cartridge (bioMerieux).
Additionally, 60 uL of
EasyMagg Magnetic Silica (bioMerieux) was added to the cartridge. The beads
were mixed into
46
CA 03077798 2020-04-01
WO 2018/081580 PCT/US2017/058789
the solution for 0.5-1 minute using a pipette. The nucleic acids, which were
bound to the beads,
were eluted into a buffer solution using the Specific A Protocol according to
the manufacturer's
directions. The volume of the eluted nucleic acids was 70 uL. This nucleic
acid solution was
pipetted into a 1.5mL tube and placed on ice. The same EasyMagg Disposable
cartridges
(bioMerieux) that were used in the previous step were then reloaded with an
additional 2mL of
the hydrophilic layer from the same solution in the 15mL tube used previously
using the same
technique to screen out large debris. An additional 20 uL of EasyMagg Magnetic
Silica
(bioMerieux) was added to the cartridge. The beads were mixed into the
solution for 0.5-1
minute using a pipette. As described above, the nucleic acids, which were
bound to the beads,
were eluted into a buffer solution using the Specific A Protocol according to
the manufacturer's
directions. The volume of the eluted nucleic acids was 70 uL. This nucleic
acid solution was
pipetted into the original 1.5mL tube that already contained first 70 uL
eluate and the combined
solution was placed on ice.
[0138] DNAse Treatment: The 140 uL solution was treated with Baseline-
Zero- DNase
(Epicenter) at 35-40 C for 20-40 minutes. A 1-2 mL aliquot of EasyMagg Lysis
Buffer was
added to the DNAse treated solution and the sample was transferred to a new
EasyMagg
Disposable cartridge. The entire solution was added to the new cartridge along
with 60 uL of
EasyMagg Magnetic Silica. The nucleic acids, which were bound to the beads,
were eluted into
a buffer solution using the EasyMagg Generic Protocol according to the
manufacturer's
directions. The volume of the eluted nucleic acids was 25 uL. This nucleic
acid solution was
pipetted into a 1.5mL tube and stored at 0-6 C.
Example 11: Measurement of Nucleic Acid Levels in Feline Sample Replicates
[0139] Extraction Results: Using the samples that were extracted above, 1
uL of each
was evaluated for total nucleic acid and RNA integrity using the Agilent 2100
Bioanalyzer. The
samples were analyzed qualitatively and quantitatively. The results of the
Bioanalyzer output
were analyzed by gel electrophoresis as shown in Figure 14. Figure 14 shows
RNA Bioanalyzer
traces of 1 uL from 8 samples that were run using Agilent RNA 6000 Nano Kits.
This included 4
individual cats. The gel electrophoresis analysis provided information on the
total nucleic acid
and the RNA integrity and mass. The electrophoresis file was read by comparing
the bands for
47
CA 03077798 2020-04-01
WO 2018/081580 PCT/US2017/058789
each sample to the bands represented by the size markers in the RNA ladder
(shown in the first
lane of the electropherogram) and identifying the 18S and 28S eukaryotic
ribosomal RNA bands.
Qualitatively, adequate banding and darker band intensities indicated that
ample intact nucleic
acid was available for further analysis such as microarray sequencing,
polymerase chain reaction
(PCR), nucleic acid sequencing, molecular barcoding, or probe-capture. 100% of
the samples
were eligible for analysis based on RNA integrity number and amount of
eukaryotic mass. The
eukaryotic concentration was estimated based on the area under the 18S and 28S
eukaryotic
ribosomal RNA bands of the BioAnalyzer traces. Figure 14 shows biological
replicates for 4
individual cats. There was similar banding between biological replicates and
distinct banding for
individual cats (Figure 14).
Example 12: Analysis of RNA Transcripts in Feline Sample Replicates
[0140] All individual feline samples that were eligible for biomarker
expression analysis
(n=5) were evaluated using RT-qPCR. A total of 4 primer sets were designed to
evaluate
lymphocyte related transcripts and epithelial cell related controls (Figure
15B). One primer set
was designed to evaluate rearrangements that can occur in feline lymphoid
precursors to detect
T-cell specific RNA. Each reaction contained 10 uL 2X Master Mix (New England
BioLabs), 1
uL 20X Enzyme Mix (New England BioLabs), 0.8 uL of 10 uM forward primer
(Eurofins
Genomics), 0.8 uL of 10 uM reverse primer (Eurofins Genomics), luL 20X SYBR
Green I, 2uL
RNA, and 4.4 uL molecular biology grade H20 (Thermo Scientific). The solution
was amplified
using an Applied Biosystems QuantStudio5 qPCR machine. The thermocycler
protocol was as
follows: 25 minutes at 55 C to reverse transcribe the RNA into DNA, reverse
transcriptase
inactivation at 95 C for 1 minute, 60 cycles of 10 seconds at 95 C and then 45
seconds at 60 C
for amplification and signal collection. Examples of these amplification
events are shown in
Figure 16B. Of the five feline samples that were analyzed for select T-cell
rearrangements, in a
total of 12 reactions, 75% of the reactions showed amplification of the T-cell
related transcripts.
All T-cell rearrangements tested showed amplification in at least one cat
(Figure 16B).
Example 13: NanoString Analysis
[0141] To further analyze genes associated with human colorectal cancer
and
precancerous adenomas, an additional 70 human samples were subjected to the
RNA extraction
48
CA 03077798 2020-04-01
WO 2018/081580 PCT/US2017/058789
method described above. The extracted RNA was analyzed using the NanoString
nCounter
Analysis System, which utilizes a digital color-coded barcode technology that
is based on direct
multiplexed measurement of gene expression. Of the 70 samples, 48 were
analyzed using the
nCounter PanCancer Pathways Panel, which includes 770 genes from 13 cancer-
associated
canonical pathways including: MAPK, STAT, PI3K, RAS, Cell Cycle, Apoptosis,
Hedgehog,
Wnt, DNA Damage Control, Transcriptional Regulation, Chromatin Modification,
and TGF-I3.
The remaining 22 samples were analyzed using the nCounter PanCancer
Progression Panel,
which includes 770 genes from each step in the cancer progression process
including:
angiogenesis, extracellular matrix remodeling (ECM), epithelial-to-mesenchymal
transition
(EMT), and metastasis. These 22 samples were also evaluated for 10 "spike-in"
genes, including
ACTB, B2M, BMP3, CD274, CD8A, GAPDH, HPRT1, N-BLR, NDRG4 and RNU2-1.
[0142] In addition to the list of genes identified in Figure 6 (Panel A),
the top 200
differentially expressed genes, we also analyzed additional genes that were
associated with
colorectal cancer and precancerous adenomas. We also analyzed all genes that
were identified as
highly expressed or differentially expressed on the NanoString nCounter
Analysis System. This
analysis included using the nCounter PanCancer Pathways Panel, the nCounter
PanCancer
Progression Panel, and the "spike-in" genes. We used this information to
develop a 400 gene
RNA biomarker signature for colorectal cancer and precancerous adenomas
(Figure 13 (Panel
B)).
49