Note: Descriptions are shown in the official language in which they were submitted.
-
CA 02499201 2009-07-06
PREDICTIVE MAINTENANCE AND EQUIPMENT
MONITORING FOR A REFRIGERATION SYSTEM
FIELD OF THE INVENTION
[0002] The present invention relates to refrigeration systems and
more particularly to predictive maintenance and equipment monitoring of a
refrigeration system.
BACKGROUND OF THE INVENTION
[0003] Produced food travels from processing plants to retailers,
where the food product remains on display case shelves for extended periods
of time. In general, the display case shelves are part of a refrigeration
system
for storing the food product. In the interest of efficiency, retailers attempt
to
maximize the shelf-life of the stored food product while maintaining
awareness of food product quality and safety issues.
[0004] The refrigeration system plays a key role in controlling the
quality and safety of the food product. Thus, any breakdown in the
refrigeration system or variation in performance of the refrigeration system
can cause food quality and safety issues. Thus, it is important for the
retailer
to monitor and maintain the equipment of the refrigeration system to ensure
its operation at expected levels.
[0005] Refrigeration systems generally require a significant amount
of energy to operate. The energy requirements are thus a significant cost to
food product retailers, especially when compounding the energy uses across
multiple retail locations. As a result, it is in the best interest of food
retailers to
closely monitor the performance of the refrigeration systems to maximize their
efficiency, thereby reducing operational costs.
[0006] Monitoring refrigeration system performance, maintenance
and energy consumption are tedious and time-consuming operations and are
CA 02499201 2005-03-14
WO 2004/099683
PCT/US2004/013384
undesirable for retailers to perform independently. Generally speaking,
retailers lack the expertise to accurately analyze time and temperature data
and relate that data to food product quality and safety, as well as the
expertise
to monitor the refrigeration system for performance, maintenance and
efficiency. Further, a typical food retailer includes a plurality of retail
locations
spanning a large area. Monitoring each of the retail locations on an
individual
basis is inefficient and often results in redundancies.
SUMMARY OF THE INVENTION
[0007] Accordingly,
the present invention provides a system for
monitoring a remote refrigeration system. The system includes a plurality of
sensors that monitor parameters of components of the refrigeration system
and a communication network that transfers signals generated by each of the
plurality of sensors. A management center receives the signals from the
communication network and processes the signals to determine an operating
condition of at least one of the components. The management center
generates an alarm based on the operating condition.
[0008] In
one feature, the management center evaluates each of the
signals to determine whether each of the signals is within a useful range, to
determine whether each of the signals is dynamic and to determine whether
each of the signals is valid.
[0009] In
other features, the system further includes a temperature
sensor monitors a temperature of a refrigerant flowing through the
refrigeration system and generates a temperature signal. The management
center calculates a pressure, a density and an enthalpy of the refrigerant
based on the temperature and based on whether the refrigerant is in one of a
saturated liquid phase and a saturated vapor phase.
[0010] In
other features, the system further includes a pressure
sensor that monitors a pressure of a refrigerant flowing through the
refrigeration system and that generates a pressure signal. The management
center calculates a temperature, a density and an enthalpy of the refrigerant
based on said pressure and based on whether the refrigerant is in one of a
saturated liquid phase and a saturated vapor phase.
2
CA 02499201 2005-03-14
WO 2004/099683
PCT/US2004/013384
[0011] In
other features, the system further includes a temperature
sensor that monitors a temperature of a refrigerant at a suction side of a
compressor of the refrigeration system and generates a temperature signal.
A pressure sensor monitors a pressure of a refrigerant at the suction side of
the compressor and generates a pressure signal. The management center
determines an occurrence of a floodback event based on the temperature
signal and the pressure signal. The management center determines a
superheat temperature of the refrigerant based on the temperature signal and
the pressure signal and processes the superheat through a pattern analyzer
to determine whether the floodback event has occurred.
[0012] In
still other features, the system further includes a
temperature sensor that monitors a temperature of a refrigerant at a discharge
side of a compressor of the refrigeration system and that generates a
temperature signal. A pressure sensor monitors a pressure of a refrigerant at
the discharge side of the compressor and generates a pressure signal. The
management center determines an occurrence of a floodback event based on
the temperature signal and the pressure signal. The management center
determines a superheat temperature of the refrigerant based on the
temperature signal and the pressure signal and processes the superheat
through a pattern analyzer to determine whether the floodback event has
occurred.
[0013] In
yet other features, the system further includes a contactor
associated with one of the components. The contactor is cycled between an
open position and a closed position to selectively operate the component.
The management center monitors cycling of the contactor and generates an
alarm when one of a cycling rate is exceeded and a maximum number of
cycles is exceeded.
[0014] In
still another feature, the system further includes an
ambient condenser temperature sensor that generates an ambient
temperature signal, a condenser pressure sensor that generates a pressure
signal, a compressor current sensor that generates a compressor current
signal and a condenser current sensor that generates a condenser current
signal. The management center determines an operating condition of the
3
CA 02499201 2005-03-14
WO 2004/099683
PCT/US2004/013384
condenser based on the ambient temperature signal, the pressure signal, the
compressor current signal and the condenser current signal.
[0015] In
yet another feature, the system further includes a
discharge pressure sensor that monitors a pressure of a refrigerant at a
discharge side of the compressor and that generates a discharge pressure
signal. A suction pressure sensor monitors a pressure of a refrigerant at a
suction side of the compressor and generates a suction pressure signal. The
management center determines loss of refrigerant based on the discharge
pressure and the suction pressure.
BRIEF DESCRIPTION OF THE DRAWINGS
[0016] The
present invention will become more fully understood
from the detailed description and the accompanying drawings, wherein:
[0017] Figure 1 is a schematic illustration of an exemplary
refrigeration system;
[0018]
Figure 2 is a schematic overview of a system for remotely
monitoring and evaluating a remote location;
[0019]
Figure 3 is a simplified schematic illustration of circuit piping
of the refrigeration system of Figure 1 illustrating measurement sensors;
[0020] Figure 4 is a
simplified schematic illustration of loop piping of
the refrigeration system of Figure 1 illustrating measurement sensors;
[0021]
Figure 5 is a flowchart illustrating a signal conversion and
validation algorithm according to the present invention;
[0022]
Figure 6 is a block diagram illustrating configuration and
output parameters for the signal conversion and validation algorithm of Figure
5;
[0023]
Figure 7 is a flowchart illustrating a refrigerant properties
from temperature (RPFT) algorithm;
[0024]
Figure 8 is a block diagram illustrating configuration and
output parameters for the RPFT algorithm;
[0025]
Figure 9 is a flowchart illustrating a refrigerant properties
from pressure (RPFP) algorithm;
[0026]
Figure 10 is a block diagram illustrating configuration and
output parameters for the RPFP algorithm;
4
CA 02499201 2005-03-14
WO 2004/099683
PCT/US2004/013384
[0027]
Figure 11 is a block diagram illustrating configuration and
output parameters of a watchdog message algorithm;
[0028]
Figure 12 is a block diagram illustrating configuration and
output parameters of a recurring alarm algorithm;
[0029] Figure 13 is a
block diagram illustrating configuration and
output parameters of a superheat monitor algorithm;
[0030]
Figure 14 is a flowchart illustrating a suction flood back alert
algorithm;
[0031]
Figure 15 is a flowchart illustrating a discharge flood back
alert algorithm;
[0032]
Figure 16 is a block diagram illustrating configuration and
output parameters of a contactor cycle monitoring algorithm;
[0033]
Figure 17 is a flowchart illustrating the contactor cycle
monitoring algorithm;
[0034] Figure 18 is a
block diagram illustrating configuration and
output parameters of a compressor performance monitor;
[0035]
Figure 19 is a flowchart illustrating a compressor fault
detection algorithm;
[0036]
Figure 20 is a block diagram illustrating configuration and
output parameters of a condenser performance monitor;
[0037]
Figure 21 is a flowchart illustrating a condenser performance
algorithm;
[0038]
Figure 22 is a graph illustrating pattern bands of the pattern
recognition algorithm
[0039] Figure 23 is a
block diagram illustrating configuration and
output parameters of a pattern analyzer; and
[0040]
Figure 24 is a flowchart illustrating a pattern recognition
algorithm.
DETAILED DESCRIPTION OF THE PREFERRED EMBODIMENTS
[0041] The
following description of the preferred embodiments is
merely exemplary in nature and is in no way intended to limit the invention,
its
application, or uses.
5
CA 02499201 2005-03-14
WO 2004/099683
PCT/US2004/013384
[0042] With
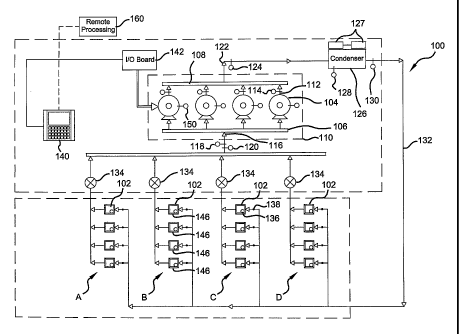
reference to Figure 1, an exemplary refrigeration
system 100 includes a plurality of refrigerated food storage cases 102. The
refrigeration system 100 includes a plurality of compressors 104 piped
together
with a common suction manifold 106 and a discharge header 108 all positioned
within a compressor rack 110. A discharge output 112 of each compressor 102
includes a respective temperature sensor 114. An input 116 to the suction
manifold 106 includes both a pressure sensor 118 and a temperature sensor
120. Further, a discharge outlet 122 of the discharge header 108 includes an
associated pressure sensor 124. As described in further detail hereinbelow,
the
various sensors are implemented for evaluating maintenance requirements.
[0043] The
compressor rack 110 compresses refrigerant vapor that is
delivered to a condenser 126 where the refrigerant vapor is liquefied at high
pressure. Condenser fans 127 are associated with the condenser 126 to enable
improved heat transfer from the condenser 126. The condenser 126 includes
an associated ambient temperature sensor 128 and an outlet pressure sensor
130. This high-pressure liquid refrigerant is delivered to the plurality of
refrigeration cases 102 by way of piping 132. Each refrigeration case 102 is
arranged in separate circuits consisting of a plurality of refrigeration cases
102
that operate within a certain temperature range. Figure 1 illustrates four (4)
circuits labeled circuit A, circuit B, circuit C and circuit D. Each circuit
is shown
consisting of four (4) refrigeration cases 102. However, those skilled in the
art
will recognize that any number of circuits, as well as any number of
refrigeration
cases 102 may be employed within a circuit. As indicated, each circuit will
generally operate within a certain temperature range. For example, circuit A
may be for frozen food, circuit B may be for dairy, circuit C may be for meat,
etc.
[0044]
Because the temperature requirement is different for each
circuit, each circuit includes a pressure regulator 134 that acts to control
the
evaporator pressure and, hence, the temperature of the refrigerated space in
the refrigeration cases 102. The pressure regulators 134 can be electronically
or mechanically controlled. Each refrigeration case 102 also includes its own
evaporator 136 and its own expansion valve 138 that may be either a
mechanical or an electronic valve for controlling the superheat of the
refrigerant.
In this regard, refrigerant is delivered by piping to the evaporator 136 in
each
refrigeration case 102.
6
CA 02499201 2005-03-14
WO 2004/099683
PCT/US2004/013384
[0045] The refrigerant
passes through the expansion valve 138 where
a pressure drop causes the high pressure liquid refrigerant to achieve a lower
pressure combination of liquid and vapor. As hot air from the refrigeration
case
102 moves across the evaporator 136, the low pressure liquid turns into gas.
This low pressure gas is delivered to the pressure regulator 134 associated
with
that particular circuit. At the pressure regulator 134, the pressure is
dropped as
the gas returns to the compressor rack 110. At the compressor rack 110, the
low pressure gas is again compressed to a high pressure gas, which is
delivered to the condenser 126, which creates a high pressure liquid to supply
to
the expansion valve 138 and start the refrigeration cycle again.
' [0046] A main refrigeration
controller 140 is used and configured or
programmed to control the operation of the refrigeration system 100. The
refrigeration controller 140 is preferably an Einstein Area Controller offered
by
CPC, Inc. of Atlanta, Georgia, or any other type of programmable controller
that
may be programmed, as discussed herein. The refrigeration controller 140
controls the bank of compressors 104 in the compressor rack 110, via an
input/output module 142. The input/output module 142 has relay switches to
turn the compressors 104 on an off to provide the desired suction pressure.
[0047] A separate case controller (not shown), such as a CC-100
case controller, also offered by CPC, Inc. of Atlanta, Georgia may be used to
control the superheat of the refrigerant to each refrigeration case 102, via
an
electronic expansion valve in each refrigeration case 102 by way of a
communication network or bus. Alternatively, a mechanical expansion valve
may be used in place of the separate case controller. Should separate case
controllers be utilized, the main refrigeration controller 140 may be used to
configure each separate case controller, also via the communication bus. The
communication bus may either be a RS-485 communication bus or a LonWorks
Echelon bus that enables the main refrigeration controller 140 and the
separate
case controllers to receive information from each refrigeration case 102.
[0048] Each refrigeration case 102 may have a temperature sensor
146 associated therewith, as shown for circuit B. The temperature sensor 146
can be electronically or wirelessly connected to the controller 140 or the
expansion valve for the refrigeration case 102. Each refrigeration case 102 in
the circuit B may have a separate temperature sensor 146 to take
7
CA 02499201 2005-03-14
WO 2004/099683
PCT/US2004/013384
average/min/max temperatures or a single temperature sensor 146 in one
refrigeration case 102 within circuit B may be used to control each
refrigeration
case 102 in circuit B because all of the refrigeration cases 102 in a given
circuit
operate at substantially the same temperature range. These temperature inputs
are preferably provided to the analog input board 142, which returns the
information to the main refrigeration controller 140 via the communication
bus.
[0049]
Additionally, further sensors are provided and correspond with
each component of the refrigeration system and are in communication with the
refrigeration controller 140. Energy sensors 150 are associated with the
compressors 104 and the condenser 126 of the refrigeration system 100. The
energy sensors 150 monitor energy consumption of their respective
components and relay that information to the controller 140.
[0050]
Referring now to Figure 2, the refrigeration controller 140 and
case controllers communicates with a remote network or processing center 160.
It is anticipated that the remote processing center 160 can be either in the
same
location (e.g. food product retailer) as the refrigeration system 100 or can
be a
centralized processing center that monitors the refrigeration systems of
several
remote locations. The refrigeration controller 140 and case controllers
initially
communicate with a site-based controller 161 via a serial connection or
Ethernet. The site-based controller 161 communicates with the processing
center 160 via a TCP/IP connection.
[0051] The processing center 160 collects data from the
refrigeration controller 140, the case controllers and the various sensors
associated with the refrigeration system 100. For example, the processing
center 160 collects information such as compressor, flow regulator and
expansion valve set points from the refrigeration controller 140. Data such as
pressure and temperature values at various points along the refrigeration
circuit are provided by the various sensors via the refrigeration controller
140.
More specifically, the software system is a multi-tiered system spanning all
three hardware levels. At the local level (i.e., refrigeration controller and
case
controllers) is the existing controller software and raw I/O data collection
and
conversion.
[0052] A
controller database and the ProAct CB algorithms reside
on the site-based controller 161. The algorithms manipulate the controller
8
CA 02499201 2005-03-14
WO 2004/099683 PCT/US2004/013384
data generating notices, service recommendations, and alarms based on
pattern recognition and fuzzy logic. Finally, this algorithm output (alarms,
notices, etc.) is served to a remote network workstation at the processing
center 160, where the actual service calls are dispatched and alarms
managed. The refined data is archived for future analysis and customer
access at a client-dedicated website.
[0053] Referring now to Figures 3 and 4, for each refrigeration
circuit and loop of the refrigeration system 100, several calculations are
required to calculate superheat, saturation properties and other values used
in
the hereindescribed algorithms. These measurements include: ambient
temperature (Ta), discharge pressure (Pd), condenser pressure (Ps), suction
temperature (Ts), suction pressure (Ps), refrigeration level (LREF),
compressor
discharge temperature (Td), rack current load (Imp), condenser current load
(icnd) and compressor run status. Other accessible controller parameters will
be used as necessary. Foe example, a power sensor can monitor the power
consumption of the compressor racks and the condenser. Besides the
sensors described above, suction temperature sensors 115 monitor Ts of the
individual compressors 104 in a rack and a rack current sensor 150 monitors
Imp of a rack. The pressure sensor 124 monitors Pd and a current sensor 127
monitors icnd. Multiple temperature sensors 129 monitor a return temperature
(Tc) for each circuit.
[0054] The present invention provides control and evaluation
algorithms in the form of software modules to predict maintenance
requirements for the various components in the refrigeration system 100.
These algorithms include signal conversion and validation, saturated
refrigerant properties, watchdog message, recurring notice or alarm message,
flood back alert, contactor cycling count, compressor performance, condenser
performance, defrost abnormality, case discharge versus product
temperature, data pattern recognition, condenser discharge temperature and
loss of refrigerant charge. Each is discussed in detail below. The algorithms
can be processed locally using the refrigeration controller 140 or remotely at
the remote processing center 160.
[0055] Referring now to Figures 5, a signal conversion and
validation (SCV) algorithm processes measurement signals from the various
9
CA 02499201 2005-03-14
WO 2004/099683 PCT/US2004/013384
sensors. The SCV algorithm determines the value of a particular signal and
up to three different qualities including whether the signal is within a
useful
range, whether the signal changes over time and/or whether the actual input
signal from the sensor is valid.
[0056] In step 500, the
input registers read the measurement signal
of a particular sensor. In step 502, it is determined whether the input signal
is
within a range that is particular to the type of measurement. If the input
signal
is within range, the SCV algorithm continues in step 504. If the input signal
is
not within the range an invalid data range flag is set in step 506 and the SCV
algorithm continues in step 508. In step 504, it is determined whether there
is
a change (A) in the signal within a threshold time-th res=
hl If
there is no change
,
in the signal it is deemed static. In this case, a static data value flag is
set in
step 510 and the SCV algorithm continues in step 508. If there is a change in
the signal a valid data value flag is set in step 512 and the SCV algorithm
continues in step 508.
[0057] In step 508, the
signal is converted to provide finished data.
More particularly, the signal is generally provided as a voltage. The voltage
corresponds to a particular value (e.g., temperature, pressure, current,
etc.).
Generally, the signal is converted by multiplying the voltage value by a
conversion constant (e.g., C/V, kPa/V, NV, etc.). In step 514, the output
registers pass the data value and validation flags and control ends.
[0058] Referring now to
Figure 6, a block diagram schematically
illustrates an SCV block 600. A measured variable 602 is shown as the input
signal. The
input signal is provided by the instruments or sensors.
Configuration parameters 604 are provided and include Lo and Hi range
values, a time A, a signal A and an input type. The configuration parameters
604 are specific to each signal and each application. Output parameters 606
are output by the SCV block 600 and include the data value, bad signal flag,
out of range flag and static value flag. In other words, the output parameters
606 are the finished data and data quality parameters associated with the
measured variable.
[0059] Referring now to
Figures 7 through 10, refrigeration property
algorithms will be described in detail. The refrigeration property algorithms
provide the saturation pressure (PsAT), density and enthalpy based on
CA 02499201 2005-03-14
WO 2004/099683 PCT/US2004/013384
temperature. The refrigeration property algorithms further provide saturation
temperature (Ism-) based on pressure. Each algorithm incorporates thermal
property curves for common refrigerant types including, but not limited to,
R22, R401a (MP39), R402a (HP80), R404a (HP62), R409a and R507c.
[0060] With particular
reference to Figure 7 a refrigerant properties
from temperature (RPFT) algorithm is shown. In step 700, the temperature
and refrigerant type are input. In step 702, it is determined whether the
refrigerant is saturated liquid based on the temperature. If the refrigerant
is in
the saturated liquid state, the RPFT algorithm continues in step 704. If the
refrigerant is not in the saturated liquid state, the RPFT algorithm continues
in
step 706. In step 704, the RPFT algorithm selects the saturated liquid curve
from the thermal property curves for the particular refrigerant type and
continues in step 708.
[0061] In step 706, it is
determined whether the refrigerant is in a
saturated vapor state. If the refrigerant is in the saturated vapor state, the
RPFT algorithm continues in step 710. If the refrigerant is not in the
saturated
vapor state, the RPFT algorithm continues in step 712. In step 712, the data
values are cleared, flags are set and the RPFT algorithm continues in step
714. In step 710, the RPFT algorithm selects the saturated vapor curve from
the thermal property curves for the particular refrigerant type and continues
in
step 708. In step 708, data values for the refrigerant are determined. The
data values include pressure, density and enthalpy. In step 714, the RPFT
algorithm outputs the data values and flags.
[0062] Referring now to
Figure 8, a block diagram schematically
illustrates an RPFT block 800. A measured variable 802 is shown as the
temperature. The temperature is provided by the instruments or sensors.
Configuration parameters 804 are provided and include the particular
refrigerant type. Output parameters 806 are output by the RPFT block 800
and include the pressure, enthalpy, density and data quality flag.
[0063] With particular
reference to Figure 9 a refrigerant properties
from pressure (RPFP) algorithm is shown. In step 900, the temperature and
refrigerant type are input. In step 902, it is determined whether the
refrigerant
is saturated liquid based on the pressure. If the refrigerant is in the
saturated
liquid state, the RPFP algorithm continues in step 904. If the refrigerant is
not
11
CA 02499201 2005-03-14
WO 2004/099683 PCT/US2004/013384
in the saturated liquid state, the RPFP algorithm continues in step 906. In
step 904, the RPFP algorithm selects the saturated liquid curve from the
thermal property curves for the particular refrigerant type and continues in
step 908.
[0064] In step 906, it is
determined whether the refrigerant is in a
saturated vapor state. If the refrigerant is in the saturated vapor state, the
RPFP algorithm continues in step 910. If the refrigerant is not in the
saturated
vapor state, the RPFP algorithm continues in step 912. In step 912, the data
values are cleared, flags are set and the RPFP algorithm continues in step
914. In step 910, the RPFP algorithm selects the saturated vapor curve from
the thermal property curves for the particular refrigerant type and continues
in
step 908. In step 908, the temperature of the refrigerant is determined. In
step 914, the RPFP algorithm outputs the temperature and flags.
, [0065]
Referring now to Figure 10, a block diagram schematically
illustrates an RPFP block 1000. A measured variable 1002 is shown as the
pressure. The
pressure is provided by the instruments or sensors.
Configuration parameters 1004 are provided and include the particular
refrigerant type. Output parameters 1006 are output by the RPFP block 1000
and include the temperature and data quality flag.
[0066] Referring now to
Figure 11, a block diagram schematically
illustrates the watchdog message algorithm, which includes a message
generator 1100, configuration parameters 1102 and output parameters 1104.
In accordance with the watchdog message algorithm, the site-based controller
161 periodically reports its health (i.e., operating condition) to the
remainder of
the network. The site-based controller generates a test message that is
periodically broadcast. The time and frequency of the message is configured
by setting the time of the first message and the number of times per day the
test message is to be broadcast. Other components of the network (e.g., the
refrigeration controller 140, the processing center 160 and the case
controllers) periodically receive the test message. If the test message is not
received by one or more of the other network components, a controller
communication fault is indicated.
[0067] Referring now to
Figure 12, a block diagram schematically
illustrates the recurring notice or alarm message algorithm. The recurring
12
CA 02499201 2005-03-14
WO 2004/099683 PCT/US2004/013384
notice or alarm message algorithm monitors the state of signals generated by
the various algorithms described herein. Some signals remain in the alarm
state for a protracted period of time until the corresponding issue is
resolved.
As a result, an alarm message that is initially generated as the initial alarm
occurs may be overlooked later. The recurring notice/alarm message
algorithm generates the alarm message at a configured frequency. The alarm
message is continuously regenerated until the alarm condition is resolved.
[0068] The recurring notice
or alarm message algorithm includes a
notice/alarm message generator 1200, configuration parameters 1202, input
parameters 1204 and output parameters 1206. The configuration parameters
1202 include message frequency. The input 1204 includes a notice/alarm
message and the output parameters 1206 include a regenerated notice/alarm
message. The notice/alarm generator 1200 regenerates the input alarm
message at the indicated frequency. Once the notice/alarm condition is
resolved, the input 1204 will indicate as such and regeneration of the
notice/alarm message terminates.
[0069] Referring now to
Figures 13 through 15, the flood back alert
algorithm is described in detail. Liquid refrigerant flood back occurs when
liquid refrigerant reverse migrates through the refrigeration system 100 from
the evaporator through to the compressor 102. The flood back alert algorithm
monitors the superheat conditions of the refrigeration circuits A, B, C, D and
both the compressor suction/discharge. The superheat is filtered through a
pattern analyzer and an alarm is generated if the filtered superheat falls
outside of a specified range. Superheat signals outside of the specified range
indicate a flood back event. In the case where multiple flood back events are
indicated, a severe flood back alarm is generated.
[0070] The saturated vapor temperature for the compressor suction
is calculated from the suction pressure. The superheat is calculated for each
refrigeration and compressor by subtracting the return temperature from the
saturated vapor temperature. Similarly, assuming a saturated liquid, the
superheat for each compressor discharge is calculated by subtracting the
compressor discharge temperature from the discharge saturated liquid
temperature.
13
CA 02499201 2005-03-14
WO 2004/099683 PCT/US2004/013384
[0071] Figure 13 provides a
schematic illustration of a superheat
monitor block 1300 that includes an RPFP module 1302 and a pattern
analyzer module 1304. Measured variables 1306 include temperature and
pressure and are input to the superheat monitor 1300. Configuration
parameters 1308 include refrigerant type and state, data pattern zones and a
data sample timer. The refrigerant type and state are input to the RPFP
module 1302. The data pattern zones and data sample timer are input to the
pattern analyzer 1304. The RPFP module 1302 determines the saturated
vapor temperature based on the refrigerant type and state and the pressure.
The superheat monitor 1300 determines the superheat, which is filtered
through the pattern analyzer 1304. Output parameters 1310 include an alarm
message that is generated by the superheat monitor 1300 based on the
filtered superheat signal.
[0072] Referring now to
Figure 14, the flood back alert algorithm for
the suction side will be described in more detail. In step 1400, Ps and Ts are
measured by the suction temperature and pressure sensors 120,118. In step
1402 it is determined whether any compressors for the current rack are
running. If no compressors are running, the next rack is checked in step
1404. If a compressor is running, the suction saturation temperature (TssAT)
is
determined based on P. The superheat is determined based on TssAT and Ts
in step 1408. The superheat is filtered by the pattern analyzer in step 1410.
If
appropriate, an alarm message is generated in step 1412 and the algorithm
ends. Steps 1402 through 1412 are repeated for each rack and steps 1408
through 1412 are repeated for each refrigeration circuit.
[0073] Referring now to
Figure 15, the flood back alert algorithm is
illustrated for the discharge side. In step 1500, Pd and Td are measured by
the discharge temperature and pressure sensors. In
step 1502 it is
determined whether any compressors for the current rack are running. If no
compressors are running, the next rack is checked in step 1504. If a
compressor is running, the discharge saturation temperature (TDsKr) is
determined based on Pd in step 1506. The superheat is determined based on
TDSAT and Td in step 1508. The superheat is filtered by the pattern analyzer
in
=
step 1510. If appropriate, an alarm message is generated in step 1512 and
14
CA 02499201 2005-03-14
WO 2004/099683
PCT/US2004/013384
the algorithm ends. Steps 1502 through 1512 are repeated for each rack and
steps 1508 through 1512 are repeated for each refrigeration circuit.
[0074]
Alternative embodiments of the flood back alert algorithm will
be described in detail. In a first alternative embodiment, the superheat is
compared to a threshold value. If the superheat is greater than or equal to
the
threshold value then a flood back condition exists. In the event of a flood
back condition an alert message is generated.
[0075] More
particularly, TsAT is determined by referencing a look-
up table using Ps and the refrigerant type. An alarm value (A) and time delay
(t) are also provided as presets and may be user selected. An exemplary
alarm value is 15 F. The suction superheat (SHsuc) is determined by the
difference between Ts and TsKr. An alarm will be signaled if SHsuc is greater
than the alarm value for a time period longer than the time delay. This is
governed by the following logic:
If SHsuc > A and time > t, then alarm
[0076] In
another alternative embodiment, the rate of change of Ts
is monitored. That is to say, the temperature signal from the temperature
sensor 118 is monitored over a period of time. The rate of change is
compared to a threshold rate of change. If the rate of change of Ts is greater
than or equal to the threshold rate of change, a flood back condition exists.
[0077] The
contactor cycling count algorithm monitors the cycling of
the various contacts in the refrigeration system 100. The
counting
mechanism can be one of an internal or an external nature. With respect to
internal counting, the refrigeration controller 140 can perform the counting
function based on its command signals to operate the various equipment.
The refrigeration controller 140 monitors the number of times the particular
contact has been cycled (NCYCLE) for a given load. Alternatively, with respect
to external counting, a separate current sensor or auxiliary contact can be
used to determine NCYCLE. If NCYCLE per hour for the given load is greater
than
a threshold number of cycles per hour (NTHRESH), an alarm is initiated. The
value of NTHRESH is based on the function of the particular contactor.
[0078] Additionally, NCYCLE can be used to predict when
maintenance of the associated equipment or contactor should be scheduled.
In one example, NTHRESH is associated with the number of cycles after which
CA 02499201 2005-03-14
WO 2004/099683
PCT/US2004/013384
maintenance is typically required. Therefore, the alarm indicates
maintenance is required on the particular piece of equipment the contact is
associated with. Alternatively, NCYCLE can be tracked over time to estimate a
point in time when it will achieve NTHRES1-1. A predicative alarm is provided
indicating a future point in time when maintenance will be required.
[0079] The
cycle count for multiple contactors can be monitored. A
group alarm can be provided to indicate predicted maintenance requirements
for a group of equipment. The groups include equipment whose NCYCLE count
will achieve their respective NTHRESH'S within approximately the same time
frame. In this manner, the number of maintenance calls is reduced by
performing multiple maintenance tasks during a single visit of maintenance
personnel.
[0080]
Referring now to Figures 16 and 17, the contactor cycling
count algorithm will be described with respect to the compressor motor. A
contactor cycle monitoring block 1600 includes a measured variable input
1602 and configuration parameter inputs 1604. The
contactor cycle
monitoring block 1600 processes the measured variable 1602 and the
configuration parameters 1604 and generates output parameters 1606. The
measured variable includes NCYCLE for the particular compressor and the
configuration parameters include a cycle rate limit (NcycRATEum) and a cycle
maximum (NCYCMAX). The output parameters include a rate exceeded alarm
and a maximum exceeded alarm. The rate exceeded alarm is generated
when the rate at which the contactor is cycled (NcycRATE) exceeds NCYCRATELIM.
Similarly, the maximum exceeded alarm is generated when NCYCLE exceeds
NCYCMAX.
[0081]
Figure 17 illustrates steps of the contactor cycling count
algorithm. In
step 1700 the contactor state (i.e., open or closed) is
determined. In step 1702, it is determined whether a state change has
occurred. If a state change has not occurred, the algorithm loops back to step
1700. If a state change has occurred, NCYCLE is incremented in step 1704.
NcycRATELIM is determined in step 1708 by dividing NCYCLE by the time over
which the closures occurred.
[0082] In
step 1710, the algorithm determines whether NCYCLE
exceeds NCYCMAX. If NCYCLE does not exceed NCYCLEMAX, the algorithm
16
CA 02499201 2005-03-14
WO 2004/099683
PCT/US2004/013384
continues in step 1712. If NCYCLE exceeds NCYCMAX, an alarm is generated in
step 1714 and the algorithm continues in step 1712. In step 1712, the
algorithm determines whether NCYCRATE exceeds NCYCRATELIM. If NCYCRATE
does not exceed NCYCRATELIM, the algorithm loops back to step 1700. If
NCYCRATE exceeds NCYCRATELIM, an alarm is generated in step 1716 and the
algorithm loops back to step 1700.
[0083] The compressor performance algorithm compares a
theoretical compressor energy requirement (ETHEO) to an actual measurement
of the compressor's energy consumption (EACT). ETHEO is determined based
on a model of the compressor. EpkoT is directly measured from the energy
sensors 150. A difference between ETHEO and EAcT is determined and
compared to a threshold value (ETHREsH). If the absolute value of the
difference is greater than ETHREsH an alarm is initiated indicating a fault in
compressor performance.
[0084] Referring now to Figures 18 and 19, compressor fault
detection algorithm will be described in detail. In general, the compressor
fault detection algorithm monitors Td and determines whether the compressor
Is operating properly based thereon. Td reflects the latent heat absorbed in
the evaporator, evaporator superheat, suction line heat gain, heat of
compression, and compressor motor-generated heat. All of this heat is
accumulated at the compressor discharge and must be removed. High
compressor Td's result in lubricant breakdown, worn rings, and acid formation,
all of which shorten the compressor lifespan. This condition can indicate a
variety of problems including, but not limited to damaged compressor valves,
partial motor winding shorts, excess compressor wear, piston failure and high
compression ratios. High compression ratios can be caused by either low Ps,
high head pressure, or a combination of the two. The higher the compression
ratio, the higher the Td will be at the compressor. This is due to heat of
compression generated when the gasses are compressed through a greater
pressure range.
[0085] For each compressor rack with at least one compressor
running the discharge saturation temperature (TDsKr) is calculated based on
Pd. For each compressor running in the rack SH is calculated by subtracting
TDsAT from Td. The SH data once each minute for 30 minutes using the
17
CA 02499201 2005-03-14
WO 2004/099683
PCT/US2004/013384
pattern analyzer. If the accumulated data indicates an abnormal condition an
alarm is generated. Alternatively, Ts and Ps can be monitored and compared
to compressor performance curves. For this, a block similar to RPFP and
RPFT can be created to perform the performance curve calculations for
comparison. Specific deviations from the performance curve would generate
maintenance notices.
[0086] With particular reference to Figure 18, a compressor
performance monitor block 1800 generates an output parameter 1802 based
on measured variables 1804 and configuration parameters 1806. The output
parameter 1802 includes an alarm and the measured variable includes Td and
Pd. The configuration parameters include refrigerant type and state and data
pattern zones and a data sample timer. The compressor performance
monitor block 1800 determines SH and processes SH through the data
pattern analyzer and generates the alarm if required.
[0087] Referring now
to Figure 19, the compressor fault detection
algorithm is illustrated. In step 1900, Pd and Td are measured by the
discharge temperature and pressure sensors. In step 1902, it is determined
whether the current rack is running. If the current rack is not running, the
algorithm moves to the next rack in step 1904. In step 1906 and 1908, it is
determined whether each compressor in the rack is running. In step 1910,
TDSAT is determined for the running compressor based on Pd. The superheat
is determined based on TpsAT and Td in step 1912. The superheat is filtered
by the pattern analyzer in step 1914. If appropriate, an alarm message is
generated in step 1916 and the algorithm loops back to step 1904. Steps
1902 through 1916 are repeated for each rack and steps 1906 through 1916
are repeated for each refrigeration circuit.
[0088] In
an alternative embodiment, the compressor fault detection
algorithm compares the actual Td to a calculated discharge temperature
(Tdcalc). Td is measured by the temperature sensors 114 associated with the
discharge of each compressor 102.
Measurements are taken at
approximately 10 second intervals while the compressors 102 are running.
Tdcatc is calculated as a function of the refrigerant type, Pd, suction
pressure
(Ps) and suction temperature (Ts), each of which are measured by the
associated sensors described above. An alarm value (A) and time delay (t)
18
CA 02499201 2005-03-14
WO 2004/099683
PCT/US2004/013384
are also provided as presets and may be user selected. An alarm is signaled
if the difference between the actual and calculated discharge temperature is
greater than the alarm value for a time period longer than the time delay.
This
is governed by the following logic:
If (Td ¨ Tdcaic) > A and time > t, then alarm
[0089] Dirt
and debris gradually builds up on the condenser coil and
condenser fans can fail, impairing condenser performance. As these events
occur, condenser performance degrades, inhibiting heat transfer to the
atmosphere. The condenser performance algorithm is provided to determine
whether the condenser 126 is dirty, which would result in a loss of energy
efficiency or more serious system problems. Trend data is analyzed over a
specified time period (e.g., several days). More specifically, the average
difference between the ambient temperature (Ta) and the condensing
temperature (TcoND) is determined over the time period. If the average
difference is greater than a threshold (TTHREsH) (e.g., 25 F) a dirty
condenser
situation is indicated and a maintenance alarm is initiated. Ta is directly
measured from the temperature sensor 128.
[0090] Referring specifically to Figures 20 and 21, another
alternative condenser performance algorithm will be described in detail. As
illustrated in Figure 20, a condenser performance monitor block 2000 includes
an RPFP module 2002 and a pattern analyzer module 2004. The condenser
performance monitor block 2000 receives measured variables 2006 and
configuration parameters 2008 and generates output parameters 2010 based
thereon. The measured variables include Ta, Pc, lcmp and a condenser load
(6d). The configuration parameters 2008 include refrigerant type and state,
data pattern zones and a data sampler timer. The output parameters 2010
include an alarm message.
[0091] With
particular reference to Figure 21, Ta, Pc, lcmd and icnd are
all measured by their respective sensors in step 2100. In step 2102, Td is
determined based on Pc using RPFP, as discussed in detail above. In step
2104, condenser capacity (U) is determined according to the following
equation:
CMP
U=K (IcND-Flo)(Tc¨Ta)
19
CA 02499201 2005-03-14
WO 2004/099683
PCT/US2004/013384
where K is a system constant and lo is a calibration value. For example, la
can be set equal to 10% of the current consumption when all condenser fans
are on. In step 2106, U is processed through the pattern analyzer and an
alarm maybe generated in step 2108 based on the results. As U varies from
ideal, condenser performance may be impaired and an alarm message will be
generated.
[0092] The
defrost abnormality algorithm learns the behavior of
defrost activity in the refrigeration circuits A, B, C, D. The learned or
average
defrost behavior is compared to current or past defrost conditions. More
specifically, the defrost time (tDEF), maximum defrost time (tDEFmAx) and
defrost
termination temperature (TTERM) are monitored. If tDEF achieves tDEFMAX for a
number of consecutive defrost cycles (I\IDEF) (e.g., 5 cycles) and the
particular
case or circuit is set to 'terminate defrost at TTERM, an abnormal defrost
situation is indicated. An alarm is initiated accordingly. The defrost
abnormality algorithm also monitors TTERM across cases within a circuit to
isolate cases having the highest TTERM.
[0093] The
case discharge versus product temperature algorithm
compares the air discharge temperature (TpiscHARGE) to the case's set point
temperature (TsErpoINT) and the product temperature (TpRoD) to TDISCHARGE.
The case temperature (TcAsE) is also monitored. If TDIsDHARGE is equal to
TsETPOINT, and TPROD is greater than TCASE plus a tolerance temperature (T-
roL)
a problem with the case is indicated. An alarm is initiated accordingly.
[0094]
Refrigerant level within the refrigeration system 100 is a
function of refrigeration load, ambient temperatures, defrost status, heat
reclaim status and refrigerant charge. A reservoir level indicator (not shown)
reads accurately when the system is running and stable and it varies with the
cooling load. When the system is turned off, refrigerant pools in the coldest
parts of the system and the level indicator may provide a false reading. The
refrigerant loss detection algorithm determines whether there is leakage in
the
refrigeration system 100. The liquid refrigerant level in an optional receiver
(not shown) is monitored. The receiver would be disposed between the
condenser 126 and the individual circuits A, B, C, D. If the liquid
refrigerant
level in the receiver drops below a threshold level, a loss of refrigerant is
indicated and an alarm is initiated.
CA 02499201 2005-03-14
WO 2004/099683
PCT/US2004/013384
[0100]
Referring now to Figures 22 through 24, the data pattern
recognition algorithm monitors inputs such as TCASE, TPROD, Ps and Pd. The
algorithm includes a data table (see Figure 22) having multiple bands whose
upper and lower limits are defined by configuration parameters. A particular
input is measured at a configured frequency (e.g., every minute, hour, day,
etc.). as the input value changes, the algorithm determines within which band
the value lies and increments a counter for that band. After the input has
been monitored for a specified time period (e.g., a day, a week, a month,
etc.)
alarms are generated based on the band populations. The bands are defined
by various boundaries including a high positive (PP) boundary, a positive (P)
boundary, a zero (Z) boundary, a minus (M) boundary and a high minus (MM)
boundary. The number of bands and the boundaries thereof are determined
based on the particular refrigeration system operating parameter to be
monitored. For each reading a corresponding band is populated. If the
population of a particular band exceeds an alarm limit, a corresponding alarm
is generated.
[0101]
Referring now to Figure 23, a pattern analyzer block 2500
receives measured variables 2502, configuration parameters 2504 and
generates output parameters 2506 based thereon. The measured variables
2502 include an input (e.g., TcAsE, TPROD, Ps and Pd) . The configuration
parameters 2504 include a data sample timer and data pattern zone
information. The data sample timer includes a duration, an interval and a
frequency. The data pattern zone information defines the bands and which
bands are to be enabled. For example, the data pattern zone information
provides the boundary values (e.g., PP) band enablement (e.g., PPen), band
value (e.g., PPband) and alarm limit (e.g., PPpct).
[0102]
Referring now to Figure 26, input registers are set for
measurement and start trigger in step 2600. In step 2602, the algorithm
determines whether the start trigger is present. If the start trigger is not
present, the algorithm loops back to step 2600. If the start trigger is
present,
the pattern table is defined in step 2604 based on the data pattern bands. In
step 2606, the pattern table is cleared. In step 2608, the measurement is
read and the measurement data is assigned to the pattern table in step 2610.
21
CA 02499201 2012-09-05
[0103] In step
2612, the algorithm determines whether the
duration has expired. If the duration has not yet expired, the algorithm waits
for the defined interval in step 2614 and loops back to step 2608. If the
duration has expired, the algorithm populates the output table in step 2616.
In
step 2618, the algorithm determines whether the results are normal. In other
words, the algorithm determines whether the population of a each band is
below the alarm limit for that band. If the results are normal, messages are
cleared in step 2620 and the algorithm ends. If the results are not normal,
the
algorithm determines whether to generate a notification or an alarm in step
2622. In step 2624, the alarm or notification message(s) is/are generated and
the algorithm ends.
[0104] The
description of the invention is merely exemplary in
nature and, thus, variations are intended to be included. The scope of the
claims should not be limited by the preferred embodiments set forth in the
examples, but should be given the broadest interpretation consistent with the
description as a whole.
22