Note: Descriptions are shown in the official language in which they were submitted.
i29g894
METHOD AND APPARATUS FOR INDIRECT BLOOD PRESSURE MEASUREMENT
Backqround of the Invention
The present invention relates to blood pressure
measurement, in particular to a method and apparatus for the
indirect measurement of blood pressure.
In most automatic indirect methods of blood pressure
measurement, a pressure cuff is attached to a patient's arm
adjacent a blood vessel, the cuff is pressurized with an applied
pressure which is high enough to occlude the blood vessel, and
the applied pressure is gradually reduced. As the pressure is
reduced to below systolic and then diastolic, blood begins to
flow through the blood vessel creating the well known Korotkoff
sounds and pulsatile pressures in the blood vessel. The sounds
can be detected by a microphone, and pulsatile pressures can be
detected by a pressure transducer. The sensor, whether a
microphone or pressure transducer, measures a quantity which is
representative of the patient's blood pressure.
A table is then formed of values of the quantity
measured at various applied pressures as the applied pressure is
gradually changed. Using the table the systolic and diastolic
blood pressures are determined.
In a well behaved reading of blood pressure, the values
generally increase from low values at applied pressures above the
systolic to a maximum value at applied pressures between systolic
and diastolic. Similarly, the values generally increase from low
values at applied pressures less than diastolic to the maximum
values. In some cases, however, spurious high or low values in
the table can occur due to patient movement, etc., which can and
,.
1299894
--2--
often do cause erroneous determinations of systolic and diastolic
blood pressures. It is desirable therefore to detect and
eliminate the spurious high and low values in the table when they
occur.
Summary of the Invention
The present invention provides for automatically
readjusting spurious low and high values in a table of values
formed from the indirect measurement of blood pressure. In the
preferred embodiment the oscillometric method of blood pressure
measurement is used but the invention is applicable to
auscultatory blood pressure measurement as well.
The present invention provides for selecting in
response to predetermined criteria those values which are
spurious high or low values. Then either one or two values in
the table on either side of the selected value are averaged and
this value is substituted for the selected value. In the case of
suspected low values the smaller of the immediately adjacent
values is chosen and compared with a predetermined threshold
value. If it is larger than the threshold then the candidate
value is compared with the smaller value and if less than 75% of
the smaller, it is reassigned the average value of the four most
adjacent values.
For larger values suspected to be too large, if the two
largest values in the table are not adjacent and if the larger
neighbor adjacent to a candidate value is less than fifty per
cent of the calculated value then the candidate value is
re-assigned with the average value of the two most immediate
neighbors.
1299894
--3--
srief Description of the Drawinqs
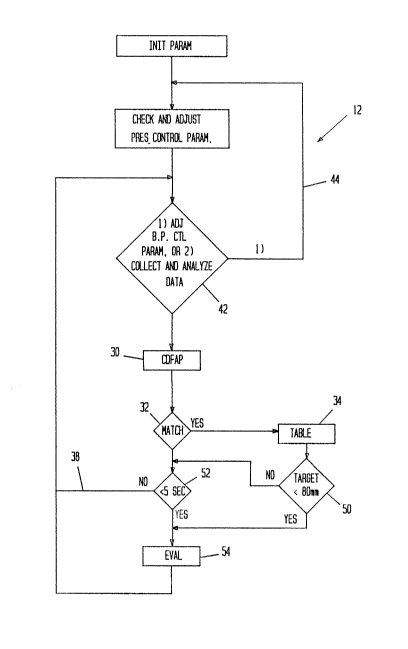
FIG. 1 is a block diagram of an apparatus for the
indirect measurement of blood pressure.
FIG. 2 is a block diagram flow chart of the overall
operation of the apparatus of FIG. 1.
FIG. 3 is a graphic representation of a table of well
behaved values formed during the operation of the blood pressure
measurement of FIG. 1.
FIG. 4 is a graphic representation of a table of values
formed during the operation of the apparatus of FIG. 1 containing
a number of spurious low ~alues.
FIG. 5 is a graphic representation of a table of values
formed during the operation of the apparatus of FIG. 1 containing
a number of spurious high values.
FIG. 6 is a more detailed block diagram flow chart of a
first portion of the block diagram of FIG. 2.
FIG. 7 is a more detailed block diagram flow chart of a
second portion of the block diagram of FIG. 2.
Detailed Description of the Draw nqs
Referring now to the figures, the system designated
generally 10 in FIG. 1 operates in basically two loops, a blood
pressure control loop 12 (bp loop) and a collect and analyze data
loop 14 (cd loop) in FIG. 2. Initially, a pump 16 under the
control of a controller 18 in the bp loop 12 pumps up the
pressure in a cuff 20 located on the patient's arm to a
determined level, e.g. 165 millimeters (mm) of mercury. A
pressure transducer 22 senses the applied pressure in the cuff
and any variations due to pressure pulses in the arm's artery due
~299894
--4--
to the beating of the heart. The electrical output signal from
the transducer is sampled and digitized in digitizer 24 and the
samples send to the controller 18 for processing. The gain and
dynamic range of the signals are checked and adjusted at this
time as well. The cd loop 14 is exercised by the controller 18
on the digital data collected so far, and when completed the bp
loop 12 again takes over and bleeds pressure from the cuff 20
through a valve 26 under the control of the controller 18. The
pressure each time is bled down in predetermined increments, e.g.
4 or 6 or 8 mm. At each applied pressure level, the collect and
analyze data loop 14 is exercised to Gbtain an oscillometric
amplitude value representative of pulsatile pressure in the blood
vessel occurring at that particular applied pressure step. FIG.
3 shows a typical bar graph showing the normalized values of the
peaks of the oscillometric variations at each of the applied cuff
pressure steps.
When in the collect and analyze data loop 14, the
system first collects data for a peak of the oscillometric
variations at a chosen applied pressure level 30. Samples of the
variations are provided every millisecond and their amplitudes
are checked until a peak amplitude is determined. This process
takes about 150 milliseconds before a peak is formed. The peak
is compared with the previous peak measured for the same applied
blood pressure level. If a match occurs 32, the value of the
peak is entered into an oscillometric value table 34. If no peak
is found, zero is entered. If two peaks don't match, the search
continues until a match occurs. This procedure helps to
eliminate artifacts due to noise, patient movement, etc.
129~#94
Typically, a match is found in about two seconds. The system
then returns to the blood pressure control loop via line 38, 40,
decision box 42 and line 44 where the applied pressure is bled
down one more step and the process to find and match a peak and
enter the value into the table is repeated.
Eventually either the applied pressure will fall below
a predetermined level 50 or the length of time for which the cuff
has been pressurized will approach a predetermined interval 52.
In either case this triggers the system to evaluate the table to
see if a determination of systolic and diastolic pressures can be
made from the table 54. In the preferred embodiment the
predetermined applied pressure is 80 mm and the predetermined
time duration of cuff pressurization is within 5 seconds of a 116
second time out criteria. If systolic and diastolic pressure
calculations are unobtainable by the end of 116 seconds, the
blood pressure control loop bleeds down the cuff pressure to
zero.
During the evaluation phase 54, the system checks to
see if there is at least three non-zero oscillometric values in
the table. If there are, the highest value in the table is
determined. Systolic and diastolic values are determined by
looking at applied cuff pressures in the table 34 associated with
oscillometric values bearing some relationship to the maximum
oscillometric value in the table e.g., systolic is the applied
pressure of the first step which has an oscillometric value just
below fifty percent of the maximum oscillometric value on the
high applied pressure side of the maximum value while diastolic
is the applied pressure of the first step just below
1299894
--6--
seventy-five percent of the maximum value on the low applied
pressure side of the maximum.
FIG. 3 is a graphic representation of an ideal table
generated as described above which has a clearly defined single
maximum value 302 and clearly defined systolic and diastolic
pressures 304 and 306, respectively. Sometimes, however, because
of sudden patient movement or patient shivering, etc., very high
oscillometric table values and very low oscillometric table
values can occur in the table where they are not wanted and which
can cause errors when calculating the systolic and diastolic
pressures as described above. See for example in FIG. 4 the
spurious low values, and in FIG. 5 the spurious high values.
Means are provided within EVAL 54 for fixing these lows and
highs.
Referring now to FIG. 6, a flow chart shows how the
system fixes spurious low oscillometric values in a table such as
that shown in FIG. 4. Each table has a number of applied
pressure step entries ranging from step 0 at the first step at
the high applied pressure end of the table to step OSCPTR, the
last entry at the low applied pressure end of the table. First a
TEMP value equal to 1/2 the average value of all the non-zero
oscillometric value entries in the table is calculated 60.
Ignoring the zero step and the OSCPTR step the system begins with
step No. 1 and determines which of its adjacent steps has the
smaller oscillometric value (e.g., step 0 or step 2) 62. (In the
case of FIG. 4 it is step 2.) If the adjacent step with the
smaller oscillometric value is less than the TEMP value then the
current step being evaluated is not to be fixed 64. This is
1Z99894
--7--
because most likely the low value occurs at a far end of the
graph where it is likely not to be important.
If the value of the smaller valued adjacent step is
larger than TEMP then the value of the current step is compared
with 3/4 of the value of the smaller valued step 66. If the
oscillometric value of the current step is smaller than this,
then a decision is made to fix the value. If the current step is
the second step[ or second to the last step then the
oscillometric values of one step on each side of the current step
are averaged together and the value assigned to the current step;
otherwise, the values of the two steps on each side of the
current step are averaged and the average value assigned to the
current step in the table. See 68 and 70. In this way spurious
lows are fixed. Using this method, the low values at step 9 and
11 would be fixed indicated by the circles 72 and 74, while the
values at steps 1, 3 and 4 would be left alone. When all the
steps in the table are checked for fixing the system goes on to
fix the high values 76.
To fix the spurious highs in the table, the end samples
0 and OSCPTR are ignored. The steps with the two largest
oscillometric values are determined and they are checked to see
how close together they are 80. For example, if they are
adjacent then neither is to be considered an artifact and both
will be fixed. Where applied pressure bleed steps are small,
e.g. 4mm, the criteria for determining whether an artifact exists
or not could be different, e.g., if the two largest valued steps
are adjacent or only separated by one step then they are not to
be considered artifacts.
1;~99894
--8--
If, the two steps with the largest values do not meet
the above criteria then the larger valued adjacent step to the
step with the largest oscillometric value is compared with one
half the value of the largest valued step 82. If the value of
the larger adjacent step is less than one half the largest value
then the values of the steps on either side of the step with the
largest value are averaged together and the average assigned to
the step with the largest value 84. Following this the step with
the largest peak is again found and the process is repeated.
Using the above FIX HI method, the steps 4, 8 and 12 in
FIG. 5 would be fixed while steps 0, 14 and 16 would be left
alone.
After the FIX LO and FIX HI routines are complete the
adjusted table values are used for the determination of systolic
and diastolic pressures within EVAL. If no systolic has been
determined, the blood pressure control loop pumps up the pressure
in the cuff (after a patient safety period has expired) to an
applied pressure larger than before since it is assumed that the
previous highest applied pressure wasn't high enough to measure
systolic as described earlier. If the pressure bleeds below 80
mm 50 or there is less than five seconds of measurement before
time out 52 then the collect data and analyze loop and EVAL
routine are repeated until a diastolic pressure is determined or
until the applied pressure drops 20 mm.
In the preferred embodiment the FIX LO routine is
performed before the FIX HI routine, otherwise normal values
might be treated as spurious high values if the normal values are
adjacent spurious low values. When spurious low values are fixed
1299894
g
first, the TEMP criteria 64 prevents the system from elevating
normal low values next to a spurious high value.
It should be appreciated that even though the above
method for fixing highs and lows in a sample table has been
described in the content of the oscillometric method of indirect
blood pressure measurement, the same method is applicable to the
auscultatory methods where a microphone produces the electrical
output signals instead of a pressure transducer.