Note: Descriptions are shown in the official language in which they were submitted.
1322587
A NETHOD FOR RECORDING MULTI-PHASE FLOWS THROUGH A TRANSPORT
SYSTEM.
5 The present invention relates to a method for determining the
composition and flow condition of a medium flowing through a
structural detail influencing the flow. Acoustic signals
generated from the medium flowing through said structural
detail are collected at the surface of the latter. By
structural detail is meant a device through which a medium is
flowing. It may be a valve, a duct, or a pipe, or a choke
mechanism which is shaped to provide strong
turbulence/cavitation in the medium or part of the medium.
In connection with monitoring multiphase production flow as
for example, in oil wells when it is desirable to control
production rate, i.e. the ratio of oil/gas, and in the
production of water, and when monitoring production in cases
with resulting sand production, continuous monit~ring of the
20 production parameters may be of great importance.
In installations comprising special structural details which
control the production process by direct mechanical influence
on the flow conditions, e.g. various kinds of choke devices
for pressure control, state monitoring of said devices will be
important, especially if they are difficult to access, e.g. in
connection with subsea installations and in case of unmanned
remote controlled plants. Due to the fact that changes of the
structural turbulence/cavitation causing details are
30 represented in the detected acoustic spectrum of signals, it
will be possible to record mechanical changes (e~g. wear,
changes of the choking ratio, any possible deposits).
There are various known methods and devices for monitoring
fluctuations of flow, mainly based on various kinds of methods
for detecting fluctuations of pressure in a pipe system with
turbulent flow. In this connection we refer to DE-AS Nos.
14 73 019 and 14 98 271, as well as to NO-PS No. 141 327. An
unfavourable aspect of said known systems is that physical
'~
~`
P
1322~87
intervention in the pipe system is required to gauge the
pressure.
5 US-PS No. 4 392 374 discloses a device for sensing in
homogeneities, e.g. gas bubbles, in liquid flow guided in a
pipeline. An electromechanical detector means is attached to
the outside of the pipe to provide acoustic connection. The
device is designed to constitute a band pass filter excluding
10 undesired vibration frequencies. It is, among others,
disadvantageous in said known concept that essential
information signals are lost due to filtration, and that the
detector is quite dependent on firm clamping on the pipe.
In NO-PS No. 140 838 a monitoring device for solids, e.g.
sand, in a fluid flow through a pipeline is disclosed. The
device is acoustically connected with the pipeline, via a
li~uid filled space, and is placed at a pipe bend. Due to
inertia relative to the fluid some of the grains of said may
20 move along the pipe wall which may result in acoustic signals.
Such slight impingements will be acoustically recorded by the
detector means. In case of a pure fluid or a fluid, e.g.
comprising air and water, there will be approximately zero
reaction from the detector. If the pipeline carries gas
25 containing a condensate precipitations may be caused to form
on the inside of the pipe and there is, thus, a hazard of a
considerably reduced detection efficiency when the fluid
contains grains of sand later on.
30 According to the invention know disadvantages and deficiencies
of the known devices are avoided due to the fact that
turbulence/cavitation is created in the medium passing
through, by the aid of the structural detail. Acoustic energy
signals are thus generated and propagate in the structure, and
35 the acoustic energy signals are transformed by the aid of
acoustic sensor means having an acoustic connection with the
structural detail, into transmittable signals which are
processed by the aid of relevant analytical methods in order
1322~87
to provide interpretable information on the composition and
flowing conditions of the passing medium.
5 More specifically, the invention provides a method for
determining the composition and flow conditions of a medium
~lowing through a transport system comprising,
a) causing acoustic energy signals to be generated and
propagated by the flowing medium by (i) forming a structural
10 detail through which the medium must flow, (ii) disposing the
structural detail in the transport system to change the cross-
sectional flow area of the medium in the transport system at
the structural detail, (iii) forming the structural detail to
create turbulence and/or cavitation in the medium when the
15 medium passes through the structural detail, thereby causing
acoustic energy signals to be generated and propagated in the
structural detail, (b) detecting broad band acoustic energy
signals generated and propagated in the structural detail,
including converting the detected acoustic signals into
20 corresponding electrical signals by using a broad band signal
converter as an acoustic sensor to sense and convert the
acoustic signals, ~c) locating the acoustic sensor outside the
transport system,(d) conditioning the electrical signals, and
(e) processing and analyzing the electrical signals through
signal spectrum analysis to provide interpretable information
on composition and flow condition parameters related to the
medium passing through the structural detail.
A method is, thus, provided by the invention which by the aid
30 of simple means permits scanning and recording of acoustic
signals generated by turbulence and cavitation, without the
sensor being exposed to the medium. In principle, this means
that any mechanical adaption of the structure is avoided, and
that the sensor may readily be provided on existing
installations. Replacement and calibration of the sensor is
also easy. The choice of the kind of sensor to be used is
mainly dependent on the amount and kind of information which
one desires to derive from the source of signals. Due to the
~322587
fact that the flow is influenced in greater or less degree by
the structure, the content of the information in the signal
spectrum will also vary. For instance, a sensor system which
is sensitive to acceleration (accelerometer) across a
sufficient bandwidth will be a suitable sensor system which is
able to pick up a wide range of signal details. In cases with
signal information in a frequency range from 50 kHz and up
into the range of NHz, the limit is reached of the range of
sensitivity and frequency of the accelerometer. Then,
obviously, a velocity sensing system of a known design may be
used, e.g. by the aid of a piezoelectric signal transformer
transforming acoustic waves on the surface of the structure
into electric signals.
Velocity sensors are commonly a more simple kind of sensors
which are able to transform sufficient signal information, in
lower frequency ranges as well. The choice of sensor is
greatly determined by the desired detailed information on flow
20 conditions, and by the composition of the measured medium.
There are great differences in signal composition. Signals
generated by a medium containing much gas, e.g. show a
completely different composition in the frequency spectrum
from the signal from the liquid flows.
Flow parameters in a transport system may, thus be determined,
since liquids, gases and particles are forced into a
turbulent/cavitating state due to the structural design, and
this will cause acoustic energy signals which are recordable
30 on the surface of the structural detail. With a suitable
design of the structure, i.e. occurrence of cavitation, the
acoustic energy will comprise sufficient information to permit
determination of the flow parameters of the passing medium as
regards liquids, gases, particles, the ratio of gases/liquids
and the mutual distribution of the latter, in certain cases
occurring as liquid/gas pockets, so-called slug formation.
The acoustic signal is generated in and closely to the
structural detail and is recorded by one or a number of
1322~87
acoustic sensor means which are suitably arranged on the
structure, and with good acoustic coupling with the structural
detail. Under certain conditions it may be suitable to use a
sensor system with associated signal transmission. An
acoustic sensor with both the sensor and the signal
transmission being based on fibre-optic principles will be
suitable in connection with installations in explosive areas,
and possibly, with subsea installations where systems that are
10 based on electric signals might be unsuitable. The acoustic
signal is transformed into a transmittable signal to a signal
processing unit utilizing signal analysis principles know per
se to provide interpretable information on the actual flow
situation in the structural detail.
A frequenc~ analysis of the actual signal may yield a spectral
division of the signal in the frequency level which comprises
detailed information for recording the flow parameters of the
passing medium, as well as changes of the structure due to
influence from the medium passing through, as well as due to
other influence.
By the present methocl flow velocity is, thus, recorded of
liquid/gasl as well as of any particles through a transport
system where the flow is forced into a highly turbulent state
with cavitation by the aid of a mechanical structural detail
having direct contact with the flowing medium. In this manner
a complex acoustic si.gnal is generated and propagates via the
structure. Such measuring is especially important to enable
30 recording of changes of the phases of the passing medium, i.e.
the ratio of different liquids, liquids and gases, so called
slug formation, particles, pressure and temperature states,
and changes of a constricted area through which the flowing
medium is passing. ~hanges of the ratio of constriction may
35 be a result of a mechanical adjustment and/or a gradual effect
that may be caused by erosion, cavitation, or other effects of
wear.
:~3
.~
. 1322~87
A special variant is obtained when changes of flow are caused
by precipitation on the inside of the pipeline system, and
when the conse~uently generated acoustic signal is used
5 torecord changed flow conditions. An example occurs in
connection with gas production. Due to temperature drop in
the transport system hydrate formations occur which, in turn,
affect flow conditions by precipitating on the inside of the
pipe. As a result, signals are generated which may be picked
10 up outside the transport system. Suitably arranged sensors
permit localization of the source of signals.
The signal is sensed by the aid of a suitable signal converter
being coupled (acoustically, via liquid, or the like) with the
surface of the structure, and which, thus, permits flow
parameters to be recorded without direct mechanical contact
with the measured medium, and without intrusion into the
structure. This results in a highly simplified service and,
possibly, replacement procedures. Direct contact with the
20 measured medium is most unfortunate due to various forms of
erosion, especially flows of particles which would soon affect
the sensor parameters and cause destruction. This is
completely avoided by the present invention.
25 According to the invention the acoustic sensor means i~
provided acousticall~ coupled to the structural detail which
is in direct contact with the flowing medium, and from which
the acoustic signal is derived directly or indirectly. Such a
structural detail may be a choke valve through which a multi-
30 phase medium flows. The medium is, thus, forced into strongturbulence/cavitation in the choking mechanism of the valve,
causing generation of strong and complex acoustic signals
which are a result of the actual flow condition.
35 The design of the choking mechanism will greatly influence the
relation between the information contained in the acoustic
signal and the actual flow condition as regards the
composition of the flowing medium, and whether the flow is
homogeneous, i.e. formation of liquid/gas pockets (slug
'
,
1322~
formation). In cases of occurring cavitation different liquid
fractions will show characteristic sound images due to the
fact that different vapour pressure of the liquid will produce
acoustic signals as a result of implosions occurring after a
pressure increase following a drop in the pressure in the area
of cavitation. If only a relatively weak turbulence or
increase of the same occurs by the aid of the structural
detail, the content of the signal will, obviously, be
10 correspondingly reduced.
By the aid of methods known per se for signal analysis, it
will be possible to find the relation between the acoustic
signal image and the actual flow situation as regards the
15 different variables which are included and which partly may be
read directly from the signal, and partly by the aid of
empirical methods. On that basis the flow condition can be
determined.
20 Utilization of the invention in connection with a subsea
production system may, e.g. permit control of important well
parameters, both for an optimalized production, and for
supervision of important process details, as flow like
conditions, composition of the flowing medium, sand
25 production, changes of pressure and temperature, any hydrate
formation, leaks, wear, and the position of flow valves.
The recorded signal is composed of a large number of
frequencies showing great differences of mutual strength. In
30 the signal pxocessing unit various forms of signal analysis
will take place, which mainly divide the signal into narrow
frequency bands (spectrum), e.g. by the aid of a FFT-analysis
or some other kind of filtration technique.
35 Dependent on the turbulence/cavitation producing design of the
structure the spectral distribution of various frequency
components of the signal will indicate flow conditions as
mentioned above. Certain phenomena will appear clearly from
one single frequency spectrum, whereas others result from
~'
1322~87
extensive methods of analysis and calculations. Certain
dominant phenomena may, for instance, be explained on the
basis of the signal level within a characteristic frequency
range. In other cases the signal is so complex that, in
addition to common frequency analysis, extensive analysis
techniques of methods know per se will be required, which also
comprise various forms of correlation analysis, and
mathematical statistical calculations, to arrive at the
10 desired parameters.
In recording, e.g. flow parameters in a structure designed as
a control valve in an oil well, the acoustic signals are
picked up on the surface of the valve by the aid of broadband
15 accelerometers. The primary function of said valYe is to
control the well by the aid of a choke mechanism which, in
turn, acts as an efficient turbuler.ce/cavitation causing
detail and a good source of signals with a detailed content of
the composition of the medium passing through.
The medium passing through said valve with a relatively high
pressure and temperature, may have quite different
compositions of oil, gas, water, and sand. Gas which is not
dissolved in liquid often occurs in the shape o gas pockets,
so called slugs. Said phenomena will cause a complex signal
image in both time and frequency aspects. Additionally, there
are variables in the shape of choke opening, geometry, and
long-time effects of erosion and cavitation. The information
is mainly distributed in a spectrum with low frequency
30 phenomena occurring in the low frequency signal range, e~g.
slug formation, as opposed to liberation of gas from various
liquids causing high frequency components.
Said example represents a complicated composition of many
35 variables and will, thus, require relatively complex signal
analysis, based on various utilizations of signal analysis
methods known per se. Certain parameters are so
characteristic that they may, e.g. be explained by the aid of
simple frequency analyses, whereas others are so complex
B
, ~ ,
. 1322~87
spectrally that various forms of sophisticated signal analysis
will be required.
5 As regards, e.g. the power spectrum of the signal over a
certain time interval, it may also be divided into the
frequency range in a larqe number of variables. The latter
are included in a multi-variable regression analysis with
known measurable quantities of the flowing medium which passed
10 through the valve during a known period of time. By carrying
out a number of subsequent tests under different conditions we
can construct a calibration model which will explain the
composition of the passing well flow, and the variables being
directly connected with mechanical conditions in the valve, on
15 the basis of the variation of content of the signal spectrum.
The method in connection with the above stated for determining
how the interrelationship between the acoustic signal and
actual flow conditions is related to individual variables, is
in many cases based on a combination of a signal analysis and
mathematical statistical data processing. Multi-variable
regression Partial Least Squares, may advantageously be used
to establish a quantitative model between the spectral
variables, designated X, and known variables, in this case
25 designated Y. Traditional regression terminology is used,
with the Y variable called the dependent variable, and X
variables called independent variables. The relation of the Y
variables with X variables forms the regression model. After
calculation of this model, new X data may be used to predict
associated Y-data.
Regression/prediction comprises two phases:
1. Calculation of the parameters of the regression model,
based on associated sets of X and Y data, a sort of
calibration or learning phase.
2. Determination of a new set of Y data from a set of new X
data by introducing them into the calibration model.
1322~7
Examples of systems utilized are signal analysis software from
Signal Technology Inc. U.S.A., and multivariable regression
software, Unscrambler from CANO, Norway.
Further characteri~ing features of the invention will appear
from the following claims, as well as from the following
disclosure with reference to the enclosed drawings.
10 For simplicity, the drawings show systems with only one sensor
means used. Obviously, a plurality of sensors which are
strategically placed on the structure will highly contribute
to a more many-sided acoustic information picture. This is
especially due to the fact that it will permit a higher degree
15 of signal processing with correlation analysis between various
sensor means.
Figure 1 illustrates a transport system with a turbulence/
cavitation-causing constriction means.
Figure 2 illustrates utilization of a choke valve as a
turbulence/cavitation causing means in connection
with a christmas tree for a production well.
25 Figure 3 illustrates a typical choke valve.
Figure 4 illustrates a section III-III through choking means
in a choke valve in three different states of
operation.
Figure 5 shows another kind of a choke valve.
Figure 6 illustrates the present invention in connection with
a subsea structure.
Figure 7 shows a three-dimensional frequency spectrum picked
up from a control valve of a typical oil producing
well.
132~87
11igure 8 shows a three-dimensional frequency spectrum picked
up from a control valve of a typical gas producing
well.
Figure 9 shows two different power spectra with and without
sand production.
Figure 1 shows a simple basic circuit diagram of a transport
system 1, e.g. a turbulence/cavitation causing device 2 such
as an orifice plate in a pipeline which will cause strong
turbulence/cavitation 3 in a flowing medium 4 that may consist
of liquids 5, gas pockets 6, and particles 7. In the pipeline
there may be precipitations in the form of, e.g. hydrate
formations 8. An acoustic sensor means 9 ~e.g. an
accelerometer) is coupled with device 2, and signals picked up
by sensor means 9 converting the acoustic signal to an
electrical signal and transmitted to a signal conditioner 10,
from the latter to a signal processor and analyzer unit 11,
and then to a display 12.
Figure 2 shows a typical utilization in connection with a
choke valve 20 which is connected after a wing valve 21, which
is, in turn, connected with a production well 22 by the aid of
25 a standard christmas tree 23. The acoustic sensor means 9 is
attached to choke valve 20.
Figure 3 shows a sectional view of an embodiment of a typical
choke valve 20. Choking means 30 is centrally arranged
30 between inlet 33 and outlet 34 and is adjustable by the aid of
a drive means 35. The choking means comprises two mutually
rotatably disks 31, 32, which are provided with holes 40, 41
and 42, 43, respectively.
35 Figures 4a-c show choking means 30 in three different states,
completely closed (Figure 4a), in an intermediate position
(Figure 4b), and fully open (Figure 4c). Upper disk 31 is in
the shown embodiment provided with two openings 40~ 41, and
the lower disk is correspondingly, provided with two openings
, ~ .
1322~7
12
42, 43. As shown in Figures 4a-c, the lower disk 32 may be
stationary, whereas the uppermost disk 31 is rotatable, e.g.
anticlockwise, as indicated by arrow 44.
Figure 5 shows that choke valve 20 could also have a different
constriction means 50 in the shape of a cone 51 which is
positioned in relation to a centrally provided valve seat 52,
and which forms an adjustable constri~tion between inlet 53
and outlet 54. Adjustment is effected by the aid of a driving
means 55 moving cone 51 axially relative to the seat valve.
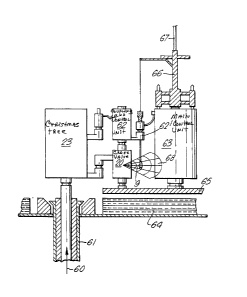
Figure 6 shows a typical subsea utilization of ~he invention
with well flow 60 being conducted from production well 61, via
a christmas tree 23, and a coupling and control unit 62 to
choke valve 20. Reference number 63 designates the main
control unit of the subsea structure, 64 designates a bottom
frame, 65 a manifold, 66 a connecting module, and 67 a cable
to the surface. Sensor means 9 is connected with connecting
20 module 66, and when the latter is lowered towards main control
unit 63, sensor means 9 may be guided downwaxds, e.g. through
projecting member 62' of unit 62 to be positioned in the zone
of acoustic signals 68 from choke valve 20.
25 Figure 7 shows an example of a three-dimensional diagram of
the acoustic signal spectrum ~FFT-analysis) recorded from a
control valve which is in connection with a well mainly
producing oil with a small portion of gas appearing in the
pulsating manner in the shape of small gas slugs. As shown in
30 Fig. 7, forty information samples were picked up from the
control valve. The X-axes of Fig. 7 denote frequency, the Y-
axe denotes signal magnitude, and the spacing between the 40
individual information spectra is indicative of time in~ervals
(Z-a~es) between individual information spectra. Thus the 40
sequential signal spectra are arranged in relation to each
other in such a manner that is possible to observe a trend
from one individual spectra to the next and thus obtain a
picture of what happens with time. Characteristically, the
signal spectrum of this
: .
~.
1322~7
13
kind of well has a narrower bandwidth than what is typical of
a gas producing well. The bandwidth is approximately 40 kHz.
Figure 8 shows essentially the same as Figure 7, but in this
case there is a typical gas well causing a much wider
bandwidth, approximately 50-70 kHz.
Figure 9 shows two different power spectra, with and without
sand production from a control valve controlling an oil well.
This illustration shows an example with characteristic
features of the spectrum in cases where sand is produced and
carried with the well flow through the control valve. In the
Figure 9 the horizontal axis represents resolution in the
frequency range i.e. 140 corresponds to 81.3 kHz. As will
appear from the diagram, the difference between a flow with
and without sand production is represented by the shaded area
between curves. In this example peaks 90 and 92 at 43.6 kHz,
and 5.8 kHz, respectively are characteristic for sand
20 production. The frequency at the signal level 91 is, e.g.,
not sensitive or characteristic of sand production.
In the low frequency region sand production is also
represented by a high peak 92. For the rest, the spectra are
25 relatively coincident. The spectra, furthermore, besides
information on sand, also comprises information on a series of
other flow parameters, as mentioned above. Details which are
not as characteristic as information on sand will require more
extensive use of different methods of analysis as well as
statistical mathematical models.
Bi