Note: Descriptions are shown in the official language in which they were submitted.
CA 020025~9 1998-07-30
IN VIVO FLUORESCENCE PHOTOMETER
Backqround of the Invention
Animal tissues contain traces of materials, such
as protoporphyrin, which fluoresce at a wavelength of 690
nm when excited by visible light. Such fluorescence is
described, for example, in the article by R. H. Pottier et
al., "Non-Invasive Technique for Obtaining Fluorescence
Excitation and Emission Spectra In Vivo, Photochemistry
~and Photobioloqy, Vol. 44 pp. 679-687 (1987). Tissue
fluorescence is also discussed in the article by Willia~
R. Potter and Thomas S. Mang, "Photofrin II Levels By In
Vivo Photometry,l~ Progress in Clinical and Biological
Research, Vol. 170 pp. 177-186 (1984).
The fluorescent tumor localizing photosensitizer
Photofrin II is retained by abnormal tissue such as tumors
at a higher level than most surrounding normal tissues,
and therefore it is diagnostically useful to supply
Photofrin II to the tissues, and then to illuminate the
tissue with light to detect by the fluorescent response
whether abnormal tissue is present.
In the therapeutic use of this material
(referred to as photodynamic therapy, or PDT), large doses
of 630 nm light are used both to activate the fluorescence
of the sensitizer ~such as Photofrin II) and to
selecti~ely destroy the tumor by a photochemical reaction.
However, the fluorescent response of tissues may be cre-
ated by excitation using incident light with wa~elengths
CA 02002~9 1999-03-29
in the 600 nm region, which is in the visible spectrum,
and thus there is a problem with stray light causing
fluorescence which may be interpreted as arising from ab-
normal tissue. Thus, there is a need for a system which
can accurately differentiate between fluorescence arising
from sensitizer in normal tissue and that arising from
sensitizer in abnormal tissue, especially in vivo. In
addition, there is a need for distinguishing between
fluorescence arising from low levels of fluorescent tumor
localizers (i.e.~ sensitizers such as Photofrin II) and
natural tissue background fluorescence.
There is especially a need for a fluorometer
which can detect abnormal cells which are within a mass of
tissue, such as within a group of lymph nodes, without the
need for slicing the tissue open and inspecting each
sliced segment in a superficial manner, as has been done
in the past. Thus, it is an object of this invention to
provide a method and apparatus of fluorometry with the
capability of effectively penetrating a mass of tissue for
purposes of detecting abnormal tissue.
One characteristic of presently used PDT methods
is the need to use therapeutic levels of the sensitizer
which result in highly photosensitive skin for long
periods of time, often on the order of four to six weeks.
This skin sensitivity requires the patient to remain
indoors during daylight hours after injection until the
photosensitivity has decreased.
Thus, long and high photosensitivity is a
significant disadvantage to the use of this drug for
detection or localization. The need to use high levels of
the drug is a result of the natural background
fluorescence of the tissue, which tends to vary in a
random fashion from point to point.
In one system, an imaging device uses 400 nm
absorption for superficial excitation of bladder tissue.
CA 02002~9 1999-03-29
H. Baumgartner et al., A Fluorescent Imaging Device for
Endoscopic Detection of Early Stage Cancer--Instrumental
and Experimental Studies, Photochemistry and
Photobioloqy, Vol. 46, No. 5, pp. 759-763 (1987). In this
system, tissue is first scanned using light in the violet
region of the spectrum, and a subsequent scan with green
or blue light from an argon laser is used to excite the
tissue background and subtract this contribution to the
image. There are certain disadvantages to this approach,
however, one of which is that the tissue excitation by the
two wavelengths is done in an alternating fashion, such
that real-time images of in vivo tissues are not achiev-
able, since registration of the image would have to be
maintained for the two excitation wavelengths. Further-
more, it would be impractical to use this type of imaging
with light in the 600 nm range because scattering of the
light by tissue would cause resolution to be very poor.
However, imaging with wavelengths of light in
the 600 nm range is highly desirable because of the deep
penetration of such wavelengths. There is therefore a
need for a system for in vivo fluorometry which produces
real-time images which may utilize longer wavelengths for
noninvasive examination of tissue to the maximum depth
possible, especially for use with handheld probes. There
is also a need for a system which utilizes relatively low
levels of sensitizing chemicals such as Photofrin II, so
as to greatly reduce or eliminate clinically significant
photosensitivity.
It is an object of this invention to provide a
method and apparatus for in vivo fluorometry which can be
implemented in a handheld nonimaging probe where
sequential tissue excitation is not feasible.
CA 02002~9 1999-03-29
Summary of the Invention
The present invention comprises a method and
apparatus, including an in vivo fluorometer, employing
simultaneous dual long-wavelength excitation to cancel
tissue background fluorescence by subtraction. The ap-
paratus of the invention includes two lasers for providing
two beams of incident light, one at 612 nm and one at
632.8 nm. The light beams are chopped, i.e. periodically
interrupted, by a tuning fork chopper, one at 90 Hz and
the other at 135 Hz, at two other chopping frequencies
chosen to exclude mutual harmonics. The two beams are
combined into one diagnostic beam be means of prisms and a
lens, and are directed through an optical fiber to a
diagnostic region of a patient or animal pretreated with
Photofrin II or some other local tumor photosensitizer.
Both normal and abnormal tissue will fluoresce
as a result of the incident beams, and a receive fiber is
coupled to the transmission fiber to pick up such
fluorescence. The transmission and receive fibers are
coupled together in a fixed geometrical relationship,
forming a probe.
The fluorescent signal is filtered by a 690
(~10) nm optical interference filter, and is converted to
an electronic signal with a signal strength related to the
intensity of the fluorescence. The electronic signal is
provided as input to each of two tuned amplifier circuits,
which are designed to filter out the contributions to the
fluorescent signal from the two incident beams. Thus, one
filter effectively extracts the contribution to the
fluorescence which results from the 612 nm beam, and the
other extracts the contribution resulting from the 632.8
nm beam. An A channel and a ~ channel are provided in the
circuitry for carrying the two electronic signals.
The apparatus is calibrated in advance to ensure
that, when no abnormal tissue is present, the A channel
CA 02002~9 1999-03-29
signal equals the B channel signal. If abnormal tissue is
present in the patient, the A channel signal will increase
significantly, due to the fluorescence of the sensitizer
in the abnormal tissue. A signal (A-B) is generated by
subtraction circuitry, and is converted to an audio signal
with an audio frequency related to the magnitude of the
difference, and the audio signal is provided as an output
to headphones for the operator of the apparatus. The
operator is thus notified of the presence of abnormal tis-
sue by an increase in the frequency of the audio signal.
Circuitry may also be provided to generate a
signal (A-B)/B, which is independent of the distance from
the probe to the diagnostic region, and is also independ-
ent of other factors which influence the fluorescent
signal such as attenuation due to a tùmor being situated
beneath a layer of other tissue. The operator may option-
ally select the (A-B)/B signal for input to the
headphones, and digital voltmeters are also provided for
visual display of the A, B, A-B and (A-B)/B signals.
An oscillator circuit is provided for driving
the choppers and for providing a phase-lock signal to each
of the A and B channels for accurate detection of the
respective contributions to fluorescence from the two
incident wavelengths. The phase-lock signal is
conditioned by removing harmonics and converting it to a
sine-wave signal.
Thus, the apparatus and method of the invention
accomplish the needs described above, including providing
real-time in vivo detection of abnormal tissue and avoid-
ing erroneously identifying normal tissue as abnormal.
Low levels of photosensitizers such as Photofrin II may be
used without loss of accuracy of the results, and natural
tissue background fluorescence is precisely subtracted out
of the fluorescent signal. Use of wavelengths in the 610
and 630 nm range both allows for deep penetration of the
CA 02002~9 1998-07-30
tissue and takes advantage of an intensity peak for Photofrin 11.
According to a first aspect of the invention, there is provided a
method for detecting abnormal tissue in a patient, including the steps of:
providing the patient with a photosensitizing drug;
illuminating a diagnostic region simultaneously with first and second
wavelengths of incident light;
detecting fluorescence arising from the incident light from the
diagnostic region;
differentiating between a contribution to the fluorescence due to the
10 first wavelength of light and a contribution to the fluorescence from the second
wavelength of light;
providing an output to a user of the method, the output reflecting the
differentiation for indicating presence of abnormal tissue at the diagnostic region.
The above-described method may include, before the illuminating
15 step and after the step of providing a drug to the patient, interrupting the first and
second wavelenghts of incident light at first and second frequencies, respectively,
wherein the differentiating step includes the step of determining the first and
second frequencies of the incident light.
The differentiating step may further include the steps of:
generating first and second signals relating to intensities of the first
and second wavelengths, respectively, of incident light; and
generating a signal intensity difference by subtracting the second
signal from the first signal; and
providing the signal intensity difference as the output to the user.
The first wavelength may be selected so as to minimize resulting
fluorescence from abnormal tissue, and the second wavelength may be selected
so as to maximize resulting fluorescence from abnormal tissue.
CA 02002~59 1998-07-30
The first and second wavelengths may be selected to maximize
penetration of tissue by the incident light.
The first and second wavelengths may be selected such that first
and second intensities of the fluorescence arising from normal tissue resulting
5 from the first wavelength and the second wavelength, respectively, are
substantially equal.
A third intensity of the fluorescence arising from abnormal tissue
resulting from the second wavelength may be substantially greater than the firstand second intensities.
Preferably, the drug induces fluorescence in the region of 630 nm
wavelength, te first wavelength is approximately 610 nm, and the second
wavelength is approximately 630 nm.
The drug may be Photofrin ll.
The drug may induce fluorescent response in normal tissue with
15 intensity which decreases with increasing wavelength but wherein the responseincludes a series of intensity peaks of decreasing magnitude; the first wavelength
is selected to be adjacent one such peak; and the second wavelength is selected
to be at a crest of the same peak.
The peak may be selected to maximize the first and second
20 wavelengths while maintaining sufficient difference in intensity between the
fluorescent responses of normal and abnormal tissues due to the first and secondwavelengths such that abnormal tissue may be differentiated from normal tissue.
The above-described method may be carried out in vivo.
The second frequency may be an odd half-multiple of the first
25 frequency.
The first frequency may be 90 Hz and the second frequency may be
1 35 Hz.
- 6a -
CA 02002~9 1998-07-30
The illuminating step may be carried out by the use of a first laser
emitting a 612 nm beam and a second laser emitting a 632.8 nm beam. The
above-described method may include the steps of interrupting the 612 nm beam
at a first frequency after emission from the first laser and before illumination of the
5 diagnostic region; interrupting the 632.8 nm beam at a second frequency after
emission from the second laser and before illumination of the diagnostic region;and after the illuminating step and before the differentiating step, generating first
and second electronic signals having first and second strengths relating to the
respective contributions of the first and second beams to the fluorescence from
10 the diagnostic region, wherein the differentiating step is carried out by determining
the phases of the contributions of the first and second wavelength beams to the
fluorescence.
The illuminating step may be carried out by at least one electrically
powered light source, and the differentiating step includes the step of
15 compensating for fluctuations in the power supplied to the light source.
The illuminating step may be carried out by an arc lamp having a
broad emission spectrum.
The first and second frequencies may be generated by passing the
emission spectrum through a diffraction grating having at least two exit slits. The
20 above-described method may include the steps of simultaneously with generating
the first and second frequencies, generating a third frequency by passing the
emission spectrum through the diffraction grating, wherein the diffraction grating
has at least three exit slits; and simultaneously with the differentiating step,differentiating a contribution to the fluorescence from the third frequency from the
25 contributions ti the fluorescence from the first and second frequencies.
The first and second frequencies may be generated by passing a
first portion of the emission spectrum through a first interference filter and passing
a second portion of the emission spectrum through a second interference filter.
- 6b -
CA 02002~9 1998-07-30
The above-described method may include the steps of
simultaneously with generating the first and second frequencies, generating a
third frequency by passing a third portion of the emission spectrum through a third
interference filter; and simultaneously with the differentiating step, differentiating a
5 contribution to the fluorescence from the third frequency from the contributions to
the fluorescence from the first and second frequencies.
The dirrerenliating step may include the steps of generating first and
second electronic signals relating, respectively, to the contributions to the
fluorescence from the first and second frequencies; generating a third electronic
10 signal representing a difference in signal strength between the first and second
electronic signals; and providing the third electronic signal as the output to the
user.
The above-described method may include, after generating the third
electronic signal but before the step of providing the third electronic signal as the
15 output, converting the third electronic signal to an audio tone having an audio
frequency which is dependent upon the difference in signal strength. Preferably,the audio frequency increases with increasing signal strength.
The detecting step may be accomplished by use of a probe
positioned near the diagnostic region, and further including, after the
20 differentiating step and before the step of providing the output, the step of compensating the output for varying distances between the probe and the
diagnostic region. Furthermore, the differentiating step may include the steps of
generating first and second electronic signals relating, respectively, to the
contributions to the fluorescence from the first and second frequencies, and
25 generating a third electronic signal representing a difference in signal strength
between the first and second electronic signals; the compensating step may
include the step of generating a fourth electronic signal representing a ratio of the
- 6c -
CA 02002~9 1998-07-30
third electronic signal to the second electronic signal, and the fourth electronic
signal may be provided as the output to the user.
According to a second aspect of the invention, there is provided an
apparatus for in vivo detection of abnormal tissue in a patient, comprising:
at least one light source for providing a first light beam having a first
wavelength and a second light beam having a second wavelength;
means for imparting characteristics to said first and second beams
for differentiating between them;
means for transmitting said first and second beams simultaneously
10 to a diagnostic region of the patient;
means for detecting a fluorescent signal from both the abnormal
tissue in the patient and from normal tissue in the vicinity of the abnormal tissue,
said fluorescent resulting from irradiation of the diagnostic region by said first and
second beams and having an intensity related to an amount of each of the normal
15 and abnormal tissue present at the diagnostic region;
means for converting said fluorescent signal to a first electronic
signal having a signal strength related to said intensity;
means for electronically differentiating a first portion of said first
electronic signal from a second portion of said first electronic signal, by means of
20 said characteristics, where said first portion results from said first incident beam
and said second portion results from said second incident beam;
means for generating a second electronic signal relating to a
difference in magnitude between said first and second portions of said first
electronic signal; and
means for providing said second electronic signal as an output for
indicating the presence of abnormal tissue.
- 6d -
CA 02002~9 1998-07-30
The imparting means may include a first chopper for interrupting
said first beam at a first frequency and a second chopper for interrupting said
second beam at a second frequency.
The differentiating means may include a first amplifier having a first
5filter for passing said first frequency, and a second amplifier having a second filter
for passing said second frequency.
Brief DescriPtion of the Drawinqs
Figure 1 is a block diagram showing a dual excitation wavelength
10fluorometer of the invention.
Figure 1A is a block diagram of an alternative embodiment of the
fluorometer of Figure 1.
Figure 1 B is a perspective view of a fluorometer of the invention.
Figure 1C is a schematic diagram of an amplifier for use with the
15embodiment of Figure 1A.
Figure 2 is a schematic diagram of the fluorescence detector and
tuned amplifiers of the fluorometer of Figure 1.
Figure 3 is a schematic diagram of phase-lock detection and low
pass circuitry of the fluorometer of Figure 1.
20Figure 4 is a schematic diagram of signal subtraction circuitry of the
fluorometer of Figure 1.
Figure 5 is a schematic diagram of signal division circuitry of the
fluorometer of Figure 1.
Figure 6 is a schematic diagram of a phase reference signal
25conditioner of the fluorometer of Figure 1.
Figure 7 is a block diagram of an apparatus for generating a linear
scan from a rotating detector for use in the invention.
-6e-
CA 02002~9 1998-07-30
Figure 8 is a cross-sectional view of a surface probe for use in the
invention.
Figure 9 is an end view taken along line 6-6 of Figure 5.
Figure 10 is a sectional view of a node probe of the invention.
- 6f-
CA 02002~9 1999-03-29
Figure 11 is a graph showing the variatiOn in
attenuation coefficient as a function of wavelength in hu-
man tissue.
Figure 12 is a graph showing the absorption
spectrum of Photofrin II at 690 nm as a function of
wavelength of incident excitation light.
Figure 13 is a graph showing the in vivo
fluorescence spectrum of an amelanomatic melanoma prior to
treatment.
Figure 14 is a graph showing an in vivo action
spectrum showing tumor and skin response to therapy.
Description of the Preferred Embodiments
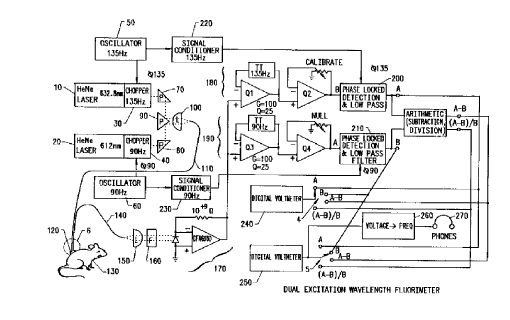
As shown in Figure 1, the apparatus of the
invention includes two lasers such as HeNe lasers 10 and
20, in front of which are placed choppers 30 and 40. The
choppers may be model L40 HHD tuning fork choppers with a
Type HEA-5A2 driver, produced by American Time Products
division of Frequency Control Products, Inc. of Woodside,
New York. The integrated circuits shown in Figure 1 are
available from Analog Devices of Norwood, Massachusetts.
Figure lB shows the fluorometer 1, which
includes digital voltmeter displays 2 and 3 and switches 4
and 5, as well as a probe 6, with functions to be
described below.
The choppers 30 and 40 shown in Figure 1 are
driven by oscillators 50 and 60, respectively. Oscillator
50 drives chopper 30 at 135 Hz, and the oscillator 60
drives the chopper 40 at 90 Hz. Each chopper blocks the
laser beam exiting from its associated laser at the rate
driven by the oscillator in question. Thus, the chopper
30 causes a 135 Hz, 632.8 nm laser beam to reach a prism
70, and likewise a 90 Hz, 612 nm laser beam reaches prism
80. The 612 nm HeNe laser is available from PMS
Electrooptics of Boulder, Colorado, and the 632.8 nm HeNe
CA 02002~9 1999-03-29
laser is available from Spectra Physics of Mountain view,
California.
The beams are combined by a prism 90 acting in
conjunction with a planoconvex lens 100. The convergent
laser beams are fed into an optical fiber 110, and the
laser light is conducted thereby to a treatment site, such
as treatment site 120 shown in Figure 1.
The subject or patient, such as rat 130, is
first given an injection or otherwise supplied with a
sensitizer such as Photofrin II. Such a sensitizer will
be preferentially concentrated in the treatment site 120.
The Photofrin II will fluoresce due to the excitation of
the laser light, in particular due to the laser light at
632.8 nm. As described below relative to Figure 12, there
is a fluorescent peak at an incident wavelength of ap-
proximately 630 nm.
As both the tissue background fluorescence
(excited by 612 nm and 630 nm) and the Photofrin II
fluorescence (excited by 632.8 nm) are detected simultane-
ously at 690 nm, a means must be provided for separating
the two contributions to the 690 nm fluorescence. This is
accomplished by the choppers 30 and 40, which cause
periodic interruptions in the incident beams and
consequently also in the resulting fluorescence at 690 nm
wavelength. The apparatus and method for differentiating
between the contributions to the fluorescent signal by the
612 and 632.8 nm incident wavelengths are discussed below
relative to fluorescence detection.
It is an important feature of the invention that
the user is enabled to simultaneously detect the normal
tissue background and the abnormal tissue, since this al-
lows the abnormal tissue to be ablated at the same time as
detection, with a high degree of accuracy, in an in vivo
setting. There are no image registration problems which
are inherent in sequential imaging techniques.
CA 02002~9 1999-03-29
The 90 Hz signal (resulting from the 612 nm
excitation) represents the tissue background or B chan-
nel at 690 nm together with the effects of any stray
exciting light which may leak through the 690 nm interfer-
ence filter 160 shown in Figure 1. The half-power band
pass of this filter is preferably about 10 nm. The 135 Hz
signal (resulting from the excitation at 632.8 nm)
represents the tissue background fluorescence plus the
Photofrin II fluorescence at 680 nm together with stray
exciting light.
Because the tissue background excitation ef-
ficiency is nearly identical for the 612 nm and 632.8 nm
excitation frequencies, the subtraction of the two signals
produces (A-B), which accurately represents the Photofrin
II signal only for all depths of the tissue, as discussed
below. That is, the two exciting wavelengths are close
enough together that they behave nearly identically in
tissue (have similar scattering and absorption properties)
and are nearly identical in their leakage through the 690
nm pass filter used to eliminate almost all of the excit-
ing light from the detector. Thus, it is possible to
adjust the amplification of the 690 nm fluorescence
produced by 612 nm excitation to cancel signal in normal
tissue not containing the Photofrin II (or containing a
low level of Photofrin II).
In practice, the magnitude of the background
signal is cancelled, i.e. reduced virtually to zero, by
adjusting the gain of the 'B" channel using normal tissue
without the sensitizer present, in the calibration
technique described above. More significantly, the random
point to point fluctuations can be reduced by a factor of
eight in normal tissue with or without a low level of
Photofrin II. (The factor of eight was determined by
measuring the fluctuations in both the A and B channels by
means of voltmeters attached to these channels; the B-
, . . .
CA 02002~9 1999-03-29
channel fluctuations turned out only one-eighth as large
as the A-channel fluctuations.)
~ luorescence is ~icked up through another opti-
c-al fiber 140, which is preferably held directly against
the treatment site 120. Light emanating from the fiber
140 is collimated by a planoconvex lens 150, and is
transmitted through an optical band pass filter 160, which
may be an interference filter centered on 690 nm, with a
filtration band of plus or minus 10 nm. The band pass
filtered diode may be a DFA 6900 produced by EG&G Electro-
optics and Electronics of Salem, Massachusetts, and the
optical fibers may be model number HCR-M400T-12 from
Ensign Bickford Optics Company of Avon, Connecticut.
Once the dual-wavelength optical signal is
filtered, it is processed by a fluorescence detector 170,
as shown in Figures 1 and 2. The fluorescence detector
170 produces a signal relating to the intensity of the
input signal, and this is then fed into each of two tuned
amplifiers 180 and 190, as shown in Figure 2. The ampli-
fiers ~marked as Ql and Q3 in Figure 2) are tuned in a
standard fashion by the "parallel T' or "twin T~ feedback
method The twin T network has the property of a high
impedance at the desired frequency and a low impedance
elsewhere. Thus, the amplifiers Q1 and Q3 have a voltage
gain of 100 at ~0 Hz (Q1) and 135 Hz (Q3), and their gain
falls rapidly at other frequencies. The one-half power
bandwidth is approximately 5 Hz, and thus the IIQII
(representing bandwidth/center frequency) i5 about 25,
which is fairly close to the highest "Q" for which an
amplifier can be made unconditionally stable. Circuits
with higher Q~ are prone to oscillation.
The gain of the Q1 circuit 180 (and hence the
Q value) is limited by the feedback provided by the 100K
and 4K voltage divider. The gain of the Q3 circuit 190 is
achieved in an equivalent manner by using the single 3.1
--10--
CA 02002~9 1999-03-29
megohm resistor shown in Figure 2. The Q3 circuit 190
requires fewer components. Depending upon the open loop
gain of Ql and Q3, the 4K and 3.1 megohm resistors may
require some adjustment up or down to achieve a gain of
100. The value of R/2 (shown as a variable resistor at
the bottom of circuit 180) is adjusted to approximately
33K, and the value of R'/2 (shown as a variable resistor
at the bottom of circuit 190) is adjusted to approximately
22K, and these adjustments are fine-tuned to bring the pin
6 and pin 3 signals of Ql and Q3 into phase.
The buffer stages Q2 and Q4 are used to prevent
loading t~e amplifiers Ql and Q3, and to allow the fine-
tuning of the gain of each channel.
Channel A is calibrated to give a consistent
signal using a standard made by dissolving Kiton Red dye
in ethylene glycol. The fluorescence of Kiton Red is
extremely stable, and therefore this dyé is particularly
suitable for laser use. Channel B is adjusted to null the
value of A-B when normal tissue or unsensitized tissue is
fluoresced. The gain of these stages is typically 3 to
10 .
The calibration technique for nulling the signal
in channel B due to background fluorescence is as follows.
The "A" channel gain is adjusted using the calibration
control. A Kiton Red dye fluorescence standard is used
for calibration. The ~iton Red (produced by Exciton Inc.
of Dayton, Ohio) is dissolved in ethylene glycol (0.0615
g/l). The probe 6 is cleaned using distilled water and
lens tissue and held perpendicular to the side of a 1 cm
square cuvette containing the fluorescence standard. Care
must be taken to avoid letting fingers get in the way,
since finger tips are fluorescent. The calibration
control is adjusted to give 0.100 volts on the A channel
digital voltmeter 240.
--11--
.. ___ ,.............. .. .
CA 02002~9 1999-03-29
The null control is then adjusted (A-B) to read
-4.200 volts. This will give an approximately zero (A-B)
reading on normal human skin without Photofrin II, that
is, it has been empirically determined that a reading of
-4.200 volts should be used for calibration when the
fluorescence standard is Kiton Red, but of course other
fluorescence standards might be used for calibration.
Moreover, it may be desirable to use another setting for
calibration if a very different tissue is used in a
particular study or if it is necessary to compensate for a
high background level of the sensitizer; although in the
latter case, one should probably consider the use of lower
doses of sensitizer. The calibration is, of course, car-
ried out before the diagnosis begins.
In order to differentiate between the A and B
signals, accomplish this, the signal from the silicon
photodiode (produced by the light passing through the
filter 160) is fed into two tuned amplifiers and then into
two detectors, each of which is phase locked to the ap-
propriate chopper drive signal, as discussed in greater
detail below. This technique rejects everything but the
fundamental signals of 90 Hz in one channel and 135 Hz in
the other channel. Because the two frequencies are at odd
half multiples of one another, the phase-locked detection
completely rejects any cross interference between channels
at the fundamental and at all the harmonics as well.
Other frequencies may be used, preferably chosen to
exclude common harmonics.
The A and B signals, once processed by the
circuitry 180 and 190, are fed into the lock-in amplifier
circuits 200 and 210, which are identical in structure and
are represented jointly in Figure 3. As shown in Figures
1 and 3, a phase reference signal is provided to each of
the circuits 200 and 210. Thus, the oscillator 50 has an
output which is fed through a signal conditioner 220 and
-12-
.
CA 02002~9 1999-03-29
ultimately as a phase reference signal to the amplifier
circuit 200. Similarly, the oscillator 60 has an output
signal which is fed through the signal conditioner 230,
and ultimately as a phase reference signal into the ampli-
fier circuit 210.
In the signal conditioners 220 and 230, the
input phase I reference signals from the oscillators 50
and 60, respectively, are square waves. To remove the
harmonic content, each square wave is attenuated and then
amplified by a stage identical to the tuned stage Ql or
Q3. The conditioned signal should be as close to a pure
sign wave as possible for satisfactory phase shifting. In
particular, since the degree of phase shift is frequency
dependent, it is undesirable to have harmonics in the
phase reference signal.
The amplifier circuitry 200 and 210 is similar
to that found at Volume I, Section 6, page 65 of Analoq
Devices lg34 Databook. This circuit produces a full-wave
detection or rectification and filtration of the signal
provided at pin 16 shown in Figure 3. The detection is in
phase with the reference signal applied to pin 9 shown in
Figure 3.
The pin 9 signal selects either an inverting or
a non-inverting amplification (with a gain of 1) of the
pin 16 signal. When the signal on pin 9 changes polarity,
the selected amplifier changes. The phase adjustment is
used to compenqate for phase shift between the mechanical
motion of the chopper and the referenced driving voltage.
The AD515 stage shown in Figure 3 is used to
filter the output of the lock-in amplifier. There is a
trade-off between noise and band pass, and for noise in
the range of 3-5 mv, the 0.1 second time constant produced
by the 10 R/10 ~fd combination is adequate.
Figure 4 shows a subtraction circuit utilizing a
differential amplifier AD521KD to subtract the filtered
. ~. . .. .
CA 02002~9 1999-03-29
output of the two lock-in amplifiers. The signal which
results (A-B) is the 690 nm fluorescence produced by the
632.8 nm excitation, minus the 690 nm fluorescence
produced by the 612 nm excitation.
Figure 5 shows a division circuit which ratios
the difference signal (A-B) to the tissue signal (B),
which produces a signal (A-B)/B which is independent of
the distance the probe 6 may be from the treatment site
120. If the user sets switch 5 (in Figure 1) such that
the (A-B)/B option is chosen, the audio tone will still
increase with increase in A (and hence with the presence
of abnormal tissue), but the signal will be compensated
for accidental variations in the distance from the probe
to the diagnostic region, such as tissue 120, by the
dividing process. Dividing the difference signal by the
background also makes the result independent of the
strength of the tissue excitation and of the efficiency of
the collection of the fluorescence of the tissue. This
quantity, (A-B)/B, is most influenced by changes in the
amount of Photofrin II present. It also tends to be in-
dependent of spurious changes in the fluorescence signal
caused by changes in the optical attenuation properties of
the tissue. This is true because the 612 and 632.8 nm
wavelengths are close together in a region where the opti-
cal properties of tissue do not change radically from
point to point in a different fashion for each of these
two wavelengths.
Changes in the optical properties or the ef-
ficiency of the tissue fluorescence at 690 nm as the probe
is moved about would also be perfectly compensated for by
(A-B)/B, because such changes would appear as a constant
multiplier of both the numerator and denominator of this
expression and thus cancel. For instance, if a tumor is
buried beneath one to several millimeters of normal tis-
sue, the 690 fluorescence due to the 632.8 nm beam will be
-14-
CA 02002~9 1999-03-29
attenuated; however, the 690 fluorescence due to the 612
nm incident beam will be attenuated by an identical fac-
tor, and thus the attenuation factor will cause the values
of~ A and B to decrease. Since this attenuation factor
appears as a multiplier of both A and B, it cancels out in
the expression (A-B)/B.
Shown in the lower portion of Figure 1 are two
digital voltmeters 240 and 250, with connections to each
of the outputs A, A-B, (A-B)/B and ~ shown at the upper
right of Figure 1. Each of the commonly-named connector
points are connected to one another as shown in Figure l.
Thus, for example, when voltmeter 250 has its switch 5
connected to connector point B, as shown in Figure 1, it
receives the output B from the amplifier circuit 210.
A voltage-to-frequency converter 260 is con-
nected to the output of the voltmeter 250, and headphones
270 are attached to the converter 260. If the switch 5 of
the voltmeter 250 is connected to the (A-B) or (A-B)/B
connector points, then as the value of A increase, the
frequency supplied to the headphones 260 will also
increase. Typically, a clicking noise will be heard in
the headphones 270, and a faster clicking, ultimately be-
coming an apparently continuous and rising pitch, will be
heard as the value of A increases. Since the value of A
depends upon the 135 Hz signal, an increase in A and hence
an increase in the frequency of the signal in the
headphones 270, indicates the presence of a greater amount
of the sensitizer (such as Photofrin II), which in turn
indicates the presence of a tumor. Thus, the operator the
device may utilize the fiber optics to scan a treatment
site, and can detect the presence of abnormal tissue
simply by listening to the headphones 270.
The voltmeter 240 provides a visual readout
analogous to the audio signal of the voltmeter 250, and
thus provides a precisely quantified visual signal through
CA 02002~59 1999-03-29
the operator. Likewise, the voltmeter 250 may be provided
with a visual readout or dial, and thus two visual
readouts (which is one for A and one for B) may be
provided at the same time as the audio signal over the
headphones 270.
The signal conditioners 220 and 230 may be of
the design shown in Figure 6, and will be identical except
for the value of R, which is chosen to produce the 135 Hz
and gO Hz phase reference sign waves respectively.
Figure 7 shows a design for the probe 6 for use
in connection with the in vivo fluorometer of the present
invention, which will accomplish linear scanning from
purely rotary motion. This can be done with an array of
fibers. The fibers would be arranged in a straight line
at the tissue end of the probe 6 and in a circle at the
instrument end of the probe cable. The order of the
fibers would need to be preserved (that is, no fibers can
be allowed to cross others before the fibers are fastened
together side by side at each end). Scanning of the
circular end with a laser beam focused to a point is read-
ily done by a round window with a 10~ wedge angle (that
is, with nonparallel faces). This wedge would deflect the
beam as it passed through it and could be rotated about an
axis through its center and perpendicular to one of the
planes of the wedge. The center of the fiber circle would
also pass through the extension of this axis of rotation
and the plane of the fiber circle would also be
perpendicular to the rotation axis. If the wedge angle,
the fiber circle diameter and the lens focal length are
appropriately chosen, then the focused spot will sweep
around the circle formed by the flat polished ends of the
fibers. As this circle of fiber ends is a linear array at
the tissue end of the fibers, the effect is to translate
to pure rotary motion into a linear scan with essentially
-16-
._ . ~ ..... .. ~.. ..
CA 02002~9 1999-03-29
no time lag between the end of one scan and the beginning
of the next.
This principle could also be used to scan the
lmage of an aperture in front of a filtered detector diode
across a second circle of receiver fibers. If the
aperture were of the correct size, then all the light from
each fiber in turn could be scanned across the detector.
Thus, two rows of parallel fibers could be arranged in
transmitter and receiver pairs and be sequentially
activated to scan a line across the tissue.
Figures 8 and 9 show a probe design utilizing a
zirconium oxide sphere as a focusing lens for the
transmissiOn fiber 110. The receive fiber 140 may by
provided in multiple, such that six receive fibers 140 are
actually utilized. The utilization of the spherical lens
280 allows for uniform illumination over a circular area,
and the equal spacing of the fibers 140 picks up
fluorescence from tissue around the periphery of the il-
luminated circular area.
The surface probe of Figures 8 and 9 is
especially useful for the examination of large areas
(e.g., breast cancer metastatic to the chest wall after
mastectomy). Although it is referred to as a "surface"
probe, this probe will actually produce an exciting light
field with a larger illuminated area wherein the light is
more slowly attenuated with depth.
The exciting light is conveyed to the probe by
the transmitting fiber. The surface of the end of this
fiber is imaged by the 1 mm diameter zirconium oxide
sphere onto the surface of the tissue. The advantages of
using such a sphere as a lens are several, including that
sealing and handling problems during construction are
greatly reduced. The sphere is held by a 0.001 inch
undersize press fit into the brass body of the probe.
This is only possible because of the great mechanical
CA 02002~9 1999-03-29
strength of the zirconium oxide sphere, which is available
from Precomp Inc. of Great Neck, New York. Another
advantage is that it provides a highly uniform illumina-
tion of the surface.
The six receive fibers which contact the tissue
provide a system which compensates for the lower power
density of the exciting light, is highly symmetrical (and
thus insensitive to probe rotation) and most sensitive to
fluorescent targets located beneath the center of the
field. The probe is thus capable of accurate localization
of deep tumors while at the same time covering an area
which is big enough to allow a rapid examination of large
surfaces.
Figure 10 shows another configuration of the
probe 6 for use in connection with the present invention,
including a receive fiber and a transmission fiber,
wherein the receive fiber 140 is 1 cm longer than the
transmission fiber 110. In use, the fiber 140 is placed
directly against the area to be illuminated, as shown
(although not in scale) in Figure 1 relative to the rat
130, and the transmission fiber 110 illuminates the area
adjacent to the point of contact between the fiber 140 and
the treatment site. Since fluorescence takes place in a
region all around the area illuminated by the fiber 110,
such fluorescence will take place immediately beneath the
point of contact between the fiber 140 and the treatment
site 120.
The transmission fiber 110 is preferably at-
tached to the receive fiber 140 at a distance of ap-
proximately 1 cm from the tissue. The fibers are fixed
together in parallel fashion by a 1 cm length of heat
shrink tubing. The transmission fiber conducts the
chopped 612 and 632.8 nm light to the tissue. This
results is an illuminated circular field approximately 3
mm in diameter, with a minimally-sized probe. This probe
_. .. . .. . ...
CA 02002~9 1999-03-29
is especially useful for examining lymph nodes of 1-10 mm
and for use through the biopsy channels of fiber optic
endoscopes.
~ The method and apparatus of the present inven-
tion utilize a relatively long wavelength (632.8 nm)
incident light for excitation of the 690 nm fluorescence
of the Photofrin II. This is done to allow the maximum
depth of noninvasive examination of the tissue. Tissue is
more transparent to light in the red region of the
spectrum, as reflected in Figure 11, which shows the at-
tenuation coefficient--that is, the rate at which incident
light intensity falls off with increasing distance into
the tissue--as a function of wavelength of the incident
light. Although the sensitizer absorbs more light in the
400 nm region (see Figure 12), the tissue absorption makes
the 630 nm excitation more efficient for depths greater
than about one millimeter.
Figure 12 shows the intensity of fluorescence of
Photofrin II as a function of the wavelength of the
incident light, i.e. the li.ght that excites the
fluorescence. (The wavelength of the detected fluorescent
light is on the order of 690 nm.) A very high peak ap-
pears at about 400 nm, indicating a high fluorescent
response to incident light of this wavelength. The graph
of Figure 12 shows fluorescence peak intensities of
decreasing size as the frequency of the incident light
goes up, including a peak at about 630 nm. For purposes
of penetrating tissue, longer wavelengths are, as
described above relative to Figure 11, more effective.
There is thus a trade-off between the intensity of the
fluorescent response and the penetrating characteristics
of the incident light.
It has been found that the fluorescent response
of normal tissue to approximately 630 nm incident light is
very nearly the same as the fluorescent response of normal
--19--
CA 02002~9 1999-03-29
tissue to approximately 612 run incident light. The
present invention utilizes this characteristic by provid-
ing incident light of both 612 and 630 nm, in a manner to
be described below.
The present method is based upon the in vivo
absorption band shape of Photofrin II in the 630 nm regio
and is greatly facilitated by the availability of HeNe
lasers to produce the required exciting wavelengths. In
Figure 13, the in vivo biological action spectrum (which
corresponds to the in vivo absorption spectrum) is shown
for a human patient. In Figure 14, the in vivo
fluorescence excitation spectrum is shown for an
amelanotic melanoma in a rat tumor system. Both of these
figures demonstrate that the fluorescence intensity peak
produced by the approximately 630 nm incident light for
Photofrin II in tissue. It will be noted that there is an
approximately 5 nm shift between the fluorescence peak in
Figure 12 (which appears at about 625 nm incident
wavelength) and those of Figures 13 and 14, which appear
closer to 630 nm wavelength. This is a result of conduct-
ing the tests of Figures 13 and 14 in vivo, and the shift
in the peak may be a result of binding of the sensitizer
to proteins or other substances.
Figure 13 was produced using an argon ion pumped
dye laser as a tunable excitation source for the 690 nm
fluorescence of the tissue. The spectrum was collected in
a noninvasive fashion using fiber optic probes touching
the surface of the patient's skin during PDT treatment.
The effects of the tissue background are evident in the
failure of the fluorescence to return to baseline away
from 630 nm (e.g. at 612 nm). Also apparent is the rise
in the baseline as the exciting wavelength increases.
This is due to the leakage of the exciting light through
the 690 nm pass filter over the detector (a silicon
photodiode). The use of the 612 nm light as background
--20--
CA 02002~9 1999-03-29
cancellation is advantageous because it is as close to the
630 nm peak as possible. That is, the 612 nm wavelength
is chosen to be as close as possible to the beginning of
the rise of the 630 nm peak on the left side thereof as
shown in the graphs of Figures 12 and 13, without actually
being on the portion with the increasing slope. It has
been found that the response of normal tissue to 612 nm
excitation is very similar to the response to 630 nm
excitation, whereas abnormal tissue treated with Photofrin
II responds quite differently to these two wavelengths, as
is evident from the 630 nm peak of Figure 13.
Choice of the 612 nm excitation wavelength for
use in conjunction with the 630 nm wavelength therefore
results in the best selectivity for the Photofrin II
absorption and in the most nearly identical scattering and
absorption behavior with depth in the tissue. The two
exciting wavelengths will behave in a similar fashion as
they penetrate tissue so that the cancellation of
background will be accurate at all depths.
In an alternative embodiment, a third
wavelength--at, for example, 638 nm, which is adjacent the
630 nm peak on the right side of Figure 13--could be used
to produce an average baseline for background correction.
For this purpose a broad spectrum light source such as an
arc lamp could be used in conjunction with a diffraction
grating three exit slits to provide three different
wavelengths for excitation. As an alternative to the dif-
fraction grating, portions of the emission from the arc
lamp can be directed through three interference filters to
provide three different excitation wavelengths. Other
photosensitizers absorbing at even longer wavelengths
might also be utilized.
In general, lasers may be preferred as light
sources because the beams are spectrally clean and stable
with respect to wavelength, and tend to be more reliable
.. ~ . , . ,., .~. .
CA 02002~9 1999-03-29
and ru~ged than arc lamp sources. Also, lasers generally
provide higher power than arc lamps, which makes it easier
to detect the fluorescence signals, and masks noise in the
detectors. However, when three or more light sources are
used, a single arc lamp may become more practical than
several lasers.
Typically, there will be random independent
fluctuations in the output of the two HeNe lasers, on the
order of approximately 1-2% of total power. Although
these power output shifts are small, they can become
significant in a subtracted application. In one
embodiment, compensation for fluctuation in the HeNe power
is accomplished by a voltage-controlled amplifier stage.
The output of the HeNe would be sampled using a glass
plate at 45~ to the beam axis, thus directing a few
percent of the power to a photodiode with tuned amplifiers
and lock-in detection identical to the fluorescence detec-
tion. The signals from these two lock-ins would be used
to control the gain of an additional stage of amplifica-
tion in each of the fluorescence detector channels. Thus,
variations in the excitation which are linearly reflected
in the fluorescence signal would be canceled by cor-
responding opposite variations in the amplification of the
fluorescence signal and the noise of the system would be
reduced and its sensitivity increased.
An apparatus for this purpose is shown in Figure
lA, which is an alternative configuration to the apparatus
of Figure 1. The circuitry of Figure lA includes a tuned
amplifier 290 which may be essentially identical to the
amplifier 170, except that the resictor in the former is
variable and has a range to approximately 10 Ohms. This
acts in conjunction with the two conventional voltage-
controlled amplifiers 300 and 310 to regulate the
amplification of the A and ~ channel signals,
respectively, in response to variations in the output
. .
CA 02002~9 1999-03-29
power of the lasers which result, for example, from varia-
tions in the line voltage supplied to the lasers.
The amplifiers 300 and 310 may include the
LM13600N ampli~ier produced by National Semiconductor,
which is a dual operational transconductance amplifier.
One design for the amplifier if Figures 300 and 310 is
shown in Figure lC.
The amplifier 290 includes a photodiode 320
which detects a sample of the beam incident upon a
partially reflecting mirror 330. The signals from the
amplifier 290 ultimately reach the amplifiers 300 and 310,
which compensate for laser output power fluctuations.
Step-by-steP procedure for use of the fluorometer.
1. Power up the apparatus--plug in machine and
turn it on.
2. Allow a ten-minute warm up.
3. Clean the probe 6 with lens tissue (soft)
and distilled water.
4. Calibrate according to the above.
5. Sterilize the probe 6 by soaking it for ten
minutes in Cidex (1~ gluteraldehyde solution). Then rinse
the probe in sterile water.
6. Touch the probe 6 to the tissue of the
diagnostic region. Keep finger tips away from the excit-
ing light, since finger tips are fluorescent, even through
latex gloves.
7. Notice the reading of (A-B)--or (A-B)/B--and
use the rising pitch of the headphone sound as a quick
guide to interesting areas of higher fluorescence as the
probe is moved over the tissue.
8. Use the large area probe (such as in Figure
8) to examine large areas of skin or other large surfaces.
9. Examining small (1-10 nm) nodes during
surgery is done with the "node probe" (see Figure 10).
-23-
.....
CA 02002~59 1999-03-29
This probe is small enough to use through a fiber optic
endoscope by passing through the biopsy channel. In this
application it may not always be possible to hold the
probe perpendicular to the surface and the distance
between the tissue and transmitting fiber may be ef-
fectively varied. It is for this situation that the (A-
B)/B option discussed above was included to compensate for
the decreased efficiency that such geometric problems
produce in both transmission into the tissue and reception
back from the tissue.
10. Areas of high fluorescence may be removed
and examined histologically to define the pathology of the
tissue. It is helpful to use the fluorometer to guide the
excision as the device responds to microscopic amounts of
tumor. Similarly, the pathological examination should be
exhaustive to avoid missing one or two microscopic nests
of tumor cells which can be detected by the fluorometer.
Variations on the foregoing may be made and
still utilize the teachings of this invention. For
instance, other methods may be utilized for imparting
characteristics to the incident light beams so that they
may later be differentiated in place of chopping the beams
into different frequencies. Other embodiments may be
arrived at without departing from the spirit and scope of
the invention.
-24-
. ~ . .