Note: Descriptions are shown in the official language in which they were submitted.
NCC-$8002AUS1-RT
TITLE OF ~'F~F INV TTON
TRANSITION METALS AS TREATMENT CHEMICAL TRACERS
Field of the Invention
The present invention pertains to the utilization
of transition metals as tracers' to quantify the change
in the level of treatment chemicals under static and
changing operating conditions of liquid systems and to
control feed rates of treatment chemicals into liquid
systems. Further, transition metal concentration can be
used to quantify important characteristics of the system
such as total volume and amount of a liquid entering
and/or leaving the liquid system.
Backcrround of the Invention
In a system invorving a body of liquid to which a
treating agent is added, maintaining the proper feed
level far the agent is essential for optimal
performance. An improper feed rate of treating agent
can lead to serious problems. For example, severe
corrosion and deposit formation can rapidly occur on
heat-exchanger surfaces in cooling water systems when
incorrect levels of treating agent are used. One common
method of estimating the concentration of a treating
agent focuses on measuring the level of an active
component in the treatment formulation (e. g., polymeric
scale inhibitor, phosphate, or organophosphate). That
technique is often unsatisfactory due to one or more of
the following problems;
- background interferences from the system liquid or
materials contained in the liquid:
° analytical methods require bulky and costly
equipment;
time-consuming, labor-intensive analyses are not
compatible with continuous monitoring and
-2-
- inaccurate readings result from degradation or
deposition of active component within the system,
An alternative method of determining treatment feed
rates is to add tracer compounds to the formulation or
system. This method helps circumvent the degradation,
deposition, and background interference problems that
commonly occur when measuring the level of an active
component in a treatment formulation. However,
quantitation of low tracer levels commonly magnifies
problems associated with expensive equipment and time-
consuming test methods. Additional factors which must
be considered are cost and environmental acceptability
of the tracer. For example, radioactive tracers are
detectable at very low levels, but are generally
expensive and unacceptable due to environmental and
health concerns.
Ultimately, compounds selected as tags or tracers
serve as indices to other chemicals present in an
aqueous system. These tags or tracers are selected to
fulfill certain criteria. For example, certain tracers
are detectable by electronic devices on a continuous or
semi-continuous basis. Tn addition, certain tracers
provide measurements of concentration that are accurate,
repeatable and/or capable of being performed on many
different waters (i.e., clean, turbid, hard, soft, etc.)
and variations of these waters. To achieve,these goals,
the tracer selected is preferably not present in
significant quantities within the waters tested. In
addition, the tracers selected must be quantifiable by
tests that are not interfered with or biased by other
chemical compounds normally present in the T.aater to be
tested. The tracers selected are preferably inert and
stable in the treatment water and do not reduce the
activity of the treatment chemicals themselves.
The tracers must be soluble in the waters to be
tested and must be compatible with the treatment
CA 02003681 1999-08-03
- 3 -
chemicals with respect to formation, storage, freeze-thaw
recovery, etc. Most importantly, the tracers must show a
minimal incorporation into the equipment scale as compared to
the treatment chemicals. Incorporation is the transfer of
tracer from the treated aqueous system to the surfaces of the
system equipment. Last, the tracers should not present any sort
of environmental problems in the event of discharge. To avoid
costly disposal methods, it is preferable for the tracer to be
functional at levels sufficiently low so that discharge does not
pose a health concern. The tracer is preferably non-toxic at
high concentrations. The tracer must be sufficiently safe so
that its use at the concentrations desired conforms to all
governmental regulations.
Chromium VI (e.g. bichromate, CR20~'2) has been used as a
tracer in cooling waters in industrial cooling water systems.
However, the Environmental Protection Agency and Occupational
Safety Hazard Administration have restricted the use of chromium
(VI) in industry. Also chromium (VI) is a reactive, oxidizing
agent and alternative tracer compounds are needed.
The present invention is based on the discovery of a new
class of tracer compounds that meet the above specified
criteria.
According to one aspect of the present invention there is
provided a method of monitoring the amount of treatment agent in
an industrial aqueous liquid system which comprises adding to
said liquid system as a tracer with its treatment agent a known
quantity of a non-radioactive transition metal compound, with
said transition metal compound being different from the
treatment agent traced, quantifying the amount of said
transition metal compound within samples of said liquid system
and correlating the quantity of said transition metal compound
within the samples with the amount of treatment agent in said
liquid system, wherein the treatment agent is susceptible to
deposition on equipment scale or degradation and the transition
CA 02003681 1999-08-03
- 4 -
metal compound is one which in the form of ions, cations,
oxyanions or complexes thereof is soluble in said liquid system,
wherein said transition metal compound does not contain chromium
VI, mercury, lead, zinc, cadmium, zirconium or silver and does
contain yttrium, vanadium, manganese, nickel, cobalt, molybdenum
or chromium III, and wherein said transition metal is compatible
with the treatment agent and exhibits a lower deposit enrichment
ratio (DER) than that of said treatment agent, DER being given
by the formula:
Wt.~ species in scale deposit
DER -__ _________________________________________________________
(ppm Concentration species in circulating liquid) x 106 .
According to a further aspect of the present invention
there is provided a water treatment chemical composition
comprising an aqueous industrial liquid treatment agent which is
a scale inhibitor, phosphate, organo-phosphate or corrosion
inhibitor, and one or more vanadium compounds which in the form
of ions, cations, oxyanions or complexes thereof is or are
soluble in an aqueous system, wherein said vanadium compounds
are present in said composition at a level of no more than 1.5
weight percent.
According to another aspect of the present invention there
is provided a water treatment chemical composition comprising an
aqueous industrial liquid treatment agent which is a scale
inhibitor, phosphate, organo-phosphate or corrosion inhibitor,
and one or more cobalt compounds which in the form of ions,
cations, oxyanions or complexes thereof is or are soluble in an
aqueous system, wherein said cobalt compounds are present in
said composition at a level of no more than 0.63 weight percent.
According to a still further aspect of the present
invention there is provided a water treatment chemical
composition comprising an aqueous industrial liquid treatment
agent which is a scale inhibitor, phosphate, organo-phosphate or
CA 02003681 1999-08-03
- 4a -
corrosion inhibitor, and one or more chromium III compounds
which in the form of ions, cations, oxyanions or complexes
thereof is or are soluble in an aqueous system, wherein said
chromium III compounds are present in said composition at a
level of no more than 1.14 weight percent.
- CA 02003681 1999-08-03
- 4b -
Summary of the Invention
It has been discovered that transition metals, as
a class, will satisfy the criteria for use as tracers if they
are soluble in the liquid medium to be tested. The transition
metals have been found to exhibit minimal incorporation into
equipment scale and typically exhibit much lower incorporation
than the treatment chemicals used in the liquid systems.
Measuring the concentration of the transition metals provides
more accurate information as to the volume of liquid and the
amount of treatment agent added to the liquid system. As a con-
sequence, this invention provides methods for using transition
metals as tracers and compositions containing transition metal
tracers therein.
The transition metals have been found to perform
better as tracers than some non-transition metals because their
rate of incorporation into deposits in the system is much lower.
The most preferred embodiments of this invention employ transi-
tion metals which show lower incorporation into deposits in the
system than chromium 1~1I), such as vanadium.
Natural sources of makeup waters have been found
to have very low concentrations of transition metals as compared
to non-transition metals. For example, aluminum and sodium are
non-transition metals which have been found to be present at
high background levels in many makeup waters. Preferred embodi-
ments of this invention are directed to those transition metals
identified as having low background levels in the makeup waters
CA 02003681 1999-08-03
- 4c -
of most industrial cooling water systems, permitting lower
concentrations to be used.
The transition metals chromium(VI)and lead are ex-
cluded from those used in the presentinvPntion because their
use is limited by governmental agencies.
Brief Description of the Drawing
Fig. 1 - Is a schematic representation of a cooling
water system, more specifically, a pilot cooling tower.
Figs. 2A to 2C - Are representations of the effective
concentration of recirculating water over time.
Fig. 3 - Is a representation of the effect of adding
tracers to large volumes of liquid wherein the effective volume
is much smaller than the true volume.
-5-
Fig. 4 - Is a graph of the chemical treatment
concentration determinations on vanadate tracer and
bichromate (Crzo,-2, where chromium is formally +6
oxidation state) tracer in a pilot cooling tower.
Detailed Description of the Invs~ntion
It is an object of the present invention to avoid
all of the aforementioned problems by incorporating a
transition metal compound as a tracer into a treatment
formulation for industrial process waters to provide
quantitative measurement and control of treatment
chemical feed rate and performance.
The phrase '°transition metal compound" as used
herein is intended to include transition metal ions,
oxyanions, cations and associated complexes which are
soluble in water. This phrase is also intended to
include those compounds which form these ions, cations,
oxyanions and complexes in water. The water soluble
species are especially suitable for quantitative
measure. This measurement allows for the calculated
control of the feed rate of water and water treatment
chemicals in fluid systems such as industrial process
waters.
Most industrial operations utilize some aqueous
systems which must be treated before being transferred
to the environment; recycled to the system or process;
or fed to the system or process. Preferably, aqueous
systems are contemplated by this invention which
include, but are not limited to, domestic wastewater,
process wastewater, cooling water systems, boiler water
or any other aqueous system that is treated physically
or chemically before use in a process, during use in a
process or before discharge to the environment where it
is necessary to quantify the effects of the physical or
the chemical treatment. This invention can also be
utilized in a broad range of aqueous, mixed aqueous/non-
°
6-
aqueous, or non-aqueous liquid systems where the level
of physical or chemical treatment affects performance of
the system.
The most preferred aqueous system contemplated by
this invention involves the treatment of cooling waters
used in cooling systems. Cooling systems used in
industrial processes typically include multiple water
flocs pathways through heat-exchangers, multiple sources
of "makeup" and "blowdown" water, and control means for
maintaining desired process conditions. Desired process
conditions may include proper chemical treatment
concentrations, temperature, water flow rate, water
guality, and pH. A simplified version of an industrial
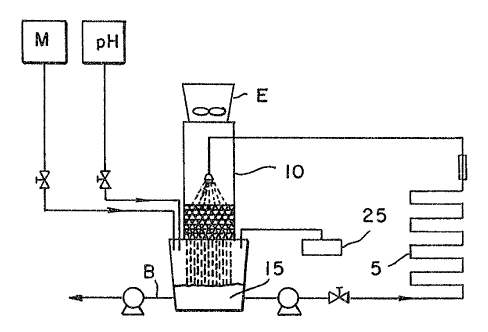
cooling water system is a pilot cooling tower (PCT)
shown in Figure 1.
In pilot cooling towers, energy is extracted by the
recirculating cooling water from the process-side of the
system which is at a higher temperature by a heat
exchanger (5). To maintain the efficiency of that heat
transfer, energy is removed by evaporative cooling of
the recirculating water in the cooling tower (10).
Evaporation (E) of the cooling water leads to
concentration of the suspended and dissolved solids in
the cooled water (15). The concentration ratio (CR) is
a measure of the increased level of dissolved and
suspended matter in a system (eq 1), where CR >_ 1Ø
concentration of salts in cooling water
cR ~ -______________________________________ (eq 1)
concentration of salts in makeup water
The heat-exchanger surfaces need to remain clean to
maintain efficiency. Deposition of solids and corrosion
of heat-eacchanger surfaces are problems most generally
encountered. Cooling water systems commonly contain
highly supersaturated levels of scaling salts.
Deposition of solids throughout the system (particularly
at metal heat-exchangers) will occur unless one or more
chemical treatments (CT) such as scale inhibitors are
added from source (25). To prevent corrosion of metal
heat-exchangers and water transfer lines, chemical
treatments commonly contain corrosion inhibitors. If
the feed rate of the chemical treatment is too high or
too low, severe scaling and corrosion can occur on the
heat-exchangers and throughout the system.
l0 It is vital that the level of dissolved and
suspended solids, total volume of system's liquid and
concentration of chemical treatment be maintained
between certain values in order to provide economical
usage of water, efficient heat transfer, minimal fouling
of entire cooling system, and low operating costs. To
maintain the concentration ratio (CR) within an
acceptable range, water containing a '°high"
concentration of impurities must be removed from the
system, collectively defined as "blowdown" (B), and
replaced by water containing a "low" concentra'cion of
impurities, collectively defined as "makeup" (M). The
value for concentration ratio, evaporation, blowdown and
makeup water are variable due to changes in the weather,
operating conditions of the industrial plant, and
quality of the makeup water. Those factors are all
interrelated and a change in any one of those factors
must be counterbalanced by corresponding changes in
other operating parameters.
In addition to the dynamic operating conditions of
a cooling water system, other significant variables and
unknown factors are commonly encountered. For example,
blowdown water (B) can be removed from the cooling
system through a variety of ways, some of which tend to
be ill-defined in nature. The rate at which water is
specifically pumped from the cooling water system is
defined as "Controlled water blowdown". Controlled
~~~'~~~~m~:~.,
°8°
water blowdown is not always accurately known due to
practical difficulties in measuring large volumes of
water, zn addition, ill°defined amounts of
recirculating water (un°accounted system losses) are
commonly removed from the cooling water system to be
used in other areas of the industrial plant, defined as
"uncontrolled plant blowdown'~. Leakage of recirculating
water and drift of liquid droplets from cooling tower
also add to unaccounted system losses. A similar
situation can occur with the makeup water, where the
total makeup water rate (M) is the combined rate at
which makeup water is specifically pumped into the
recirculating system and liquid originating from other
sources. The feed rate of chemical treatment into the
cooling water system is commonly based an estimated
values for recirculating water blowdown and makeup water
pumped into the recirculating system which means there
can be considerable uncertainty regarding the
concentration of the chemical treatment. When operating
conditions of the cooling water system change, the feed
rate of the chemical treatment should be adjusted.
Those adjustments may or may not be made, depending on
how carefully the cooling water system is monitored and
controlled. Even when feed rates are adjusted, the
concentration of chemical treatment within a cooling
water system generally may respond slowly to the change.
For example, where a system containing one million
gallons has a total blowdown rate of 300 gal/min and the
treatment feed rate is increased from 50 to 100 ppm,
about 38.5 hours are required for only half of that
change (25 ppm increase in treatment concentration) to
be attained, assuming that no other fluctuations or
changes have occurred within the system. For very large
volumes and small values of blowdawn, response time may
be measured in days or weeks. Tn oth~r cases, changes
carp occur rapidly, such as purposeful (or inadvertent)
~~~a~;~~~~.
-
flushing of the system. Therefore, it is important that
good control and accurate monitoring of the system be
maintained.
Another significant operating parameter which
should be quantified is holding time index (HTI), a
measurement of the half-life ~of a chemical species
within the system.
Under severe operating conditions, it i.s important
to optimize HTr in order to reduce possible degradation
of components in the chemical treatment without greatly
increasing operating costs.
Due to all the operating limitations and
uncertainties in cooling water systems, the need to
rapidly determine and continuously monitor the
concentration of chemical treatments is clearcut. The
addition of a tracer to the chemical treatment permits
accurate determination of all the known, imprecisely
known, and variable operating conditions or "parameters"
which vary with the composition of the liquid system,
such as the present volume of a liquid system, the
changes in volume of such a system, the quantity of
treatment agent added to the system, the changes in the
concentration of the treating agent and the lifetime of
the treating agent within the system.
Transition metal compounds have been found which
are soluble in aqueous systems as ions, oxyions, cations
or associated complexes. Transition metal compounds
have been found to be low in background presence within
the makeup waters for substantially all industrial
cooling towers, making their use as tracers very
economical and efficient.
A survey of the system waters used in recirculating
industrial cooling water systems suggests that the
background presence of transition metal compounds within
these waters is generally less than 1 ppm. The
background levels of most transition metal compounds
'~~;c~~:~~a~~..
-10-
within at least 80% of the system waters tested was
found to be below 0.1 ppm. There have been some
exceptions, such as zinc and iron; however, as a class,
transition metals have been found to have a lower
background presence in these waters than other metals
such as aluminum, lithium, boron and strontium.
The preferred class of transition metal compounds
include those which are soluble in aqueous liquid
systems and show background levels of less than 0.01 ppm
within 80~ of the waters tested. These preferred
transition metal compounds include those of cobalt,
vanadium, titanium and yttrium.
Other members of the preferred class include those
which show background levels of less than 0.1 ppm in 95~
of the waters tested. These include those transition
metal ions mentioned above, plus nickel, molybdenum
(molybdate), and tungsten (tungstates). It is important
that the tracer have low background presence within the
makeup waters so as to limit the amount necessary to be
added to function effectively as a tracer. It is
preferable that the background level of a tracer provide
no more than 10~ of the signal which quantifies the
level of transition metal in a sample.
Other transition metal compounds evaluated for use
as tracers by this invention include those of copper,
Chromium III and manganese. Ions of these transition
metals are present as background in cooling water
systems typically at relatively higher levels than the
above mentioned transition metals, requiring higher
levels to be added to the aqueous system and making them
less cost effective.
Certain transition metals are well recognized as
toxic at low levels and some have raised questions as to
whether they pose health hazards to humans, i.e.,
carcinogens, mutagens, etc. For example, lead has long
been recognized as toxic at very low levels and its use
~~~~ a~b~~..
-11-
in gasoline has been restricted. Other species which
raise health questions include cadmium and mercury.
Each transition metal chosen (and the amount us~:d) must
conform to governmental guidelines. The use of Chromium
VI has recently been regulated by the EPA and other
governmental agencies. Consequently, lead, cadmium,
mercury and Chromium VI are not considered suitable for
use in this invention.
Other transitian metal compounds are contemplated
for use in the present inventions however, they are not
preferred in that they are either present at high
background levels in the makeup water for cooling water
systems, or show poor solubility in aqueous liquid
systems. Examples of transition metal compounds which
are excluded because they are insoluble in acgueous
systems, or show very low solubility include these of
zirconium and silver.
The transition metal compound chosen for any
particular system must be soluble in the system, i.e. it
must be ionized or dissociate to soluble ions, rations,
etc. Additianally, the transition metal compound tracer
should be chosen within those permitted by governmental
guidelines. For example, OSHA and the EPA have
restricted the use of Chromium VI in industry to the
extent that its use as a tracer cannot be tolerated in
all instances. In selecting a transition metal compound
for use in a reducing environment, it may be desirable
to choose metal ions which are in their lowest oxidation
state or are weak oxidizing agents or are kinetically-
stabilized towards reduction so that the metal tracer
ions will not be reduced in their application. This
conversion may interfere with the detection of such
transition metals. For example, Cr+6 can readily be
reduced to Cr'', and may go undetected as Cr"' in
subsequent quantification tests. On the other hand,
Vanadium (V''5) , also referred to herein as Vanadium V, is
d12_
a weak oxidizing agent in cooling water applications and
tends to resist reduction to lower oxidation states
which would not be detected by the analysis method, In
addition, higher oxidation states beyond Vanadium V are
not known so there is no concern with V's tracers being
converted to higher oxidation states which would not be
detected by the analysis method. Since Vanadium V is
already in its highest oxidation state there is no
concern that it will be oxidized.
Soluble transition metals compounds are effectively
used as cooling water treatment chemical tracers to
allow the easy and accurate determination of chemical
feed rates. These transition metal tracers may be added
to the aqueous system directly but are preferably added
to a treatment formulation such as a scale inhibitor or
corrosion inhibitor. The addition of tracer compounds
to liquid systems is very useful as a diagnostic tool
for quantifying system characteristics and identifying
and quantifying problems within the system. Also, the
addition of a tracer to treatment formulations is very
useful for measuring treatment cancentration and
efficacy.
Transition metal compounds offer a number of
advantages as tracers. Nearly all transition metal
compounds have negligible background levels in makeup
waters so that interference is minimal. Many are not
health hazards due to their low toxicity at the very 1oW
levels needed to function as tracers in most cooling
systems. Additionally, most transition metal compounds
when in the form of ions, cations, associated complexes,
etc. are sufficiently inert, stable and soluble in a
cooling water environment. The transition metal
compounds are typically more stable than the treating
agents which they "trace".
By means of a sensitive analytical m~sthod,
preferably colorimetric, the transition metal compound
-13-
concentration measured is used to determine the level of
treating agents. Other possible methods of detecting
transition metal concentration include ion selective
electrodes, fluorometric analysis and voltametric
analysis, as well as other conventional techniques for
detecting ions. ,
As noted above, the preferred method of detecting
transition metals is a colorimetric method. Colorirnetry
refers to the determination of a substance from its
ability to absorb visible light. Visual colorimetric
methods are based on a comparison of a blank or known
solution with known concentration with that of a sample
of unknown concentration. In spectrophotometric
methods, the ratio of the intensities of the incident
and the transmitted beams of light are measured at a
specified wavelength by means of a detector such as a
photocell or photomultiplier tube.
lHolecular absorption in the ultraviolet and visible
region depends on the electronic structure of the
molecule. The energy absorbed elevates electrons from
orbitals in a lower-energy state to orbitals in a
higher-energy state. Since only certain states are
possible in any molecule and the energy difference
between any ground and excited state must be equal to
the energy added, only certain frequencies can be
absorbed. When a frequency that is absorbed by the
molecule is found, the intensity of the incident energy
is greater than the intensity of the emergent energy.
Radiant power is defined as the radiant energy impinging
on unit area in unit time. Transmittance is defined as
the radiant power after the energy has passed through
the absorbing solution and cell wall divided by the
radiant power of the incident beam, [refer to ~auer,
Christian and O'~teilly~ "instrument Analysis" (1978)].
Typically, in measuring the transmittance of a
sample, a blank is made that contains all the reagents
~~: ~~~~a~"
°1~--
in solution except the compound of interest. Then, the
measuring device is set at 100% for the blank.
Thereafter, any reading of an actual sample will be the
true absorbance minus any effects due to the holding
cell or the reagent solution. The intensity of
radiation absorbed in a thin layer of material depends
on the absorbing substance and on the frequency of the
incident radiation, and is proportional to the thickness
of the layer. At a given concentration of the absorbing
substance, summation over a series of thin layers, or
integration over a finite thickness, lead to an
exponential relationship between transmitted intensity
and thickness. According to Beer°s law, the amount of
radiation absorbed or transmitted by a solution or
medium is an exponential function of the concentration
of absorbing substance present and of the length of the
path of the radiation through the sample. Therefore, a
plot of the absorbance, which is equal log(%T/100),
versus concentration should give a straight line passing
through the origin. When known concentrations of a
compound are measured, a calibration curve, or in this
case, a straight line, of the known concentration versus
absorbance may be plotted. Finally, the samples with
unknown concentration may be compared to the calibration
curve to determine its concentration.
In the visible and ultraviolet regions,
spectrophotometric methods may be used for the
quantitative determination of many trace substances,
especially inorganic elements. The basic principle of
quantitative absorption spectroscopy lies in comparing
the extent of absorption of a sample solution with that
of a set of standards under radiation at a selected
wavelength.
In many instances, the sample compound does not
absorb radiation appreciably in the wavelength regions
provided or the absorption is so low that it is
ec:~~~~~1"
-15--
desirable to form a light-absorbing tracer or at least
better light-absorbing substance by reacting the
compound in question with other reagents. The reagents
should be selective in their reactions and should not
form interfering absorbing species with foreign
substances likely to be present.
Some of the factors that should be considered when
forming light-absorbing compounds from tracer ions
include: pH, reagent concentration, time, temperature,
order of mixing reagents, stability, available masking
agents, organic solvent, and salt concentration.
The pH plays a very important role in complex
formation. Adjustment of pH or the use of a buffer
often eliminates certain interfering reactions.
Additionally, some transition metals are insoluble at
high pH levels. One such metal is cobalt but it can be
resolubilized by lowering the pH.
The amount of reagent required is dictated by the
composition of the absorbing complex formed. An optimum
concentration of reagents should be determined, since
either not enough reagent or too much reagent can cause
deviation from Beer's Law. Formation of the absorbing
complex may be slow or fast with color development times
ranging from several seconds to several hours.
Therefore, in processes where time is of the essence, a
complexing reagent that reacts quickly is important.
Additionally, reaction rates are often affected by
temperature. Certain reactions require elevated
temperature to decrease the time necessary for complete
color development.
Frequently, it is important to add the reagents in
a specified sequence, otherwise full color development
wall not be possible or interfering reactions may occur.
For instance, the highly selective color reaction of
cobaltic nitrilotriacetate in the presence of hydrogen
peroxide must be preceded by the formation of the
-16 ~-
cobaltous nitrilotriacetate complex. If the absorbing
complex formed is not very stable, the absorbance
measurement shauld be made as soon as possible. If the
absorbing complex is photosensitive, precautions should
be taken in order to avoid its photodecomposition.
The presence of masking agents are often necessary
to prevent complexing of other reagents. For example,
in the presence of excess EDTA, ferric ion doss not form
the colored FeSGNz* complex with a thiocyanate ion. Many
organic reagents or complexes are only slightly soluble
in water. In such cases, it is necessary to add
immiscible organic solvent to avoid precipitatian or to
aid color development. Finally, it should be recognized
that high concentrations of electrolyte often influence
the absorption spectrum of a compound.
Transition metal compound concentrations when added
to an aqueous system as tracers, can vary from parts per
trillion (ppt) to parts per million (ppm). Detection of
these compounds can be routinely accomplished on an
instant or continuous basis with inexpensive portable
equipment. In addition, multiple tracers may be used
concurrently by choice of transition metal compounds
with proper spectral characteristics or other tracers.
As such, various combinations of transition metals and
treatment feeds can be quantified within a liquid
system. For example, several individual treatments
containing different transition metal compounds can be
employed within a liquid system. In that case, each
transition metal compound and the corresponding
individual concentration of each of the treatments can
each be quantified. In addition to being able to
quantify complex combinations of the treatment feeds,
transition metal compounds are available which are
environmentally acceptable, are not degraded by or
deposited within the liquid systems, and are low in
cost.
o~e~~~~a~~.,
-17-
The invention can generally be applied in the
following wayss
(a) direct addition of from one or more transition
metal compounds with ox without other
conventional tracers to a liquid system;
(b) incorporation of 1 to 6 (or even more)
transition metal compounds into chemical
treatment compositions containing other
components wherein said treatment is applied
ZO to liquid system in order to maintain proper
operation of that system;
(c) addition of 1 to 6 chemical treatment agents
(or even more) containing transition metal
compounds directly into liquid system or into
liquid feed leading into system; and
(d) addition of transition metal compounds without
treatment agents so that within the liquid
system individual tracer concentrations
ranging from 1 part per trillion (pet) to 100
parts per million (ppm), preferably from 1
part per billion (ppb) to to ppm, and most
preferably from 10 ppb to 2 ppm are realized.
Figures 2A-C demonstrate the operation of the water
treatment program at the molecular level as a function
of time. In Figure 2A, the concentration of chemical
treatment (CT) contains phosphorus (P'), polymer (P) and
tracer (T). This chemical treatment is slowly fed via
feed.line into the recirculating cooling water where the
treatment is rapidly diluted and distributed throughout
the system. If operating aondi.tion~a of the cooling
water system remained constant, the addition and removal
of treatment due to recirculating water blowdown (a)
~(:~.~a.~~~3~,.
-18-
would equilibrate. The concentration of the chemical
treatment and its components ideally should remain
unchanged. However, that situation never occurs. As
time progresses (Figures 2B-C), additional amounts of
polymer, and phosphorus-containing compounds can be lost
from the recirculating water ~due to deposition and
protective-film formation on metal surfaces arid
chemical/biological degradation processes. Also,
changes in operating conditions (blowdown rate,
concentration ratio, and product feed rate, and others)
affects the concentration of the treatment components.
Without a tracer, analysis of the recirculating water
may measure current concentrations of some of the
treatment components (assuming an analysis method
exists), but cannot directly indicate the original feed
rate of the treatment program. Use of a tracer to
quantify and control the treatment feed rate is a
valuable addition to current water treatment programs.
Figures 2A-C also indicate how addition of an inert
tracer can provide accurate determination of treatment
feed rate and treatment efficacy, in spite of deposition
of other components in the chemical treatment. For
example, assume the formulation feed rate was 100 ppm.
If deposition occurred on the heat-exchangers, 40~ of
the phosphorus-containing species could be lost from the
recirculating water, but little or none of the
transition metal tracer will be lost. The total
phosphorus concentration would suggest only 60 ppm of
the product was present. However, the transition metal
ion tracer would more closely indicate the formulation
feed rate of 100 ppm and a loss of phosphorus-containing
components equivalent to that supplied by 40 ppm feed of
formulation was being deposited. beterminatian ag loss
rates of active components) of the treatment is a
direct measurement of treatment efficacy.
~~~~L;~~b'~..
_m _
One method of evaluating transition metal compounds
as tracer compositions is to compare their measured
deposit enrichment ratio (DER) (eq 2) against the DER
values for the active components.
wt.~ species in scale deposit
DER = _______________________________ (eq 2)
(ppm concentration species in
circulating liquid) X106
Preferably, the DER value of the tracer is lower than
that of active and readily analyzed components of the
treatment formulation. The lower the DER values under
scale forming conditions the better. While low DER
values are desired, the tracer compound should also
exhibit good stability and not decompose when in use.
For example, it is known that vanadium responds to pFi
changes more favorably than Chromium VI as shown in
Figure 4.
Important system characteristics of many industrial
systems (total volume, blowdown, and makeup rates,
holding time index, treatment feed rates and others) are
imprecisely known, variable and soxnetimes unpredictable
in nature. Lack of knowledge regarding those factors
can lead to serious deposit and corrosion problems
throughout the entire cooling water system. In
particular, over/underfeeding of treatment program or
improper operation of cooling water system can result in
significant loss of treatment components) and adversely
affect heat transfer within a cooling water system. In
addition, water treatment programs commonly contain
regulated or toxic materials (e.g. phosphate or
chromate). Overfeeding of treatments can be hazardous
and makes it mare difficult fox industrial sites to meet
governmental restrictions on effluent discharges. t~se
of the transition metal tracers identified herein is a
highly desirable means of accurately determining,
~zo-
continuously monitoring, and controlling cooling water
system characteristics and treatment feed rates within
desirable ranges.
Preferably, transition metals are used as chemical
feed tracers in industrial cooling water systems.
fiowever, there are numerous examples of industrial
systems whereby a chemical treatment is added to a
moving liquid in a containment structures) and
associated transfer lines in order to maintain proper
operation of the system. In many cases, the
concentration, feed rate arid efficacy of the chemical
treatment are imprecisely known and system
characteristics (total volume, makeup and blowdown
rates, holding time index, etc.) are estimated, variable
~.5 or unknown. The systems can generally be divided into
three major classes: closed, open, and once-through.
In each case, transition metal can be effectively used
to determine and continuously monitor the concentration
and efficacy of chemical treatment and a system's
operating conditions and unknown characteristics.
In a "closed" system, the liquid and chemical
treatment generally remain within the system and minimal
amounts of liquid are added or discharged. Common
examples of closed systems are continuous casting
processes in the metallurgical industry, refrigerating
and air-conditioning units, radiator units, and
recirculating cooling water systems in areas where water
use or chemical discharges are severely limited. In
those systems, the treatment can be lost through
chemical/microbial degradation, deposition/corrosion
processes, system leaks and low level discharges.
The common characteristics of '°open'° systems are
that variable and significant amounts of liquid (makeup)
and chemical treatment are added and discharged
(blowdown) from the working fluid. The system may or
may not be pressurized and subject to evaporative losses
~~ ~:9;.~~b~~.~..
-2z_
of fluid. Common examples of open systems are boilers,
gas scrubbers and air washers, municipal sewage
treatment, metal working and fabrication processes,
paint spray booths, wood pulping and paperznaking, and
others. Chemical treatment can be lost through system
discharges and leaks, deposition/corrosion processes,
adsorption onto particulate matter, chemical/microbial
degradation, etc.
°'Once-through" systems generally involve a fluid
and chemical treatment which are added to a system, pass
through the system a single time, and then are
discharged as effluent or transferred into another
system. Much larger amounts of water are required in
those systems than in comparable "closed" or "opeWv
recirculating systems. Common examples of once-through
systems are clarification and filtration units, mineral
washing and benefaction, boilers, and cooling for
utilities and industrial process streams.
In each of the above situations, the chemical
treatment containing a known quantity of transition
metal is added to and distributed within the liquid
system. The liquid can be sampled or continuously
monitored at any point of addition, from within the
system or its discharge. By comparing absorbance of the
system liquid with a standard solution containing a
known concentration of chemical treatment and transition
metal, the concentration of the chemical treatment
within the liquid system may be determined. In
addition, by determining the transition metal
concentration at different points in the system, the
unifo~nity of chemical treatment distribution and
presence of low fluid flow and stagnant regions within
the system can be quantified.
Stagnant or low fluid flow regions are inherent in
some systems, in spite of continued addition and
discharge of liquid(s). For example, oil field
~'~:~9;~~~f~y
-22-
applications (drilling, secondary and tertiary recovery
methods, etc.) involve addition of chemical treatments)
t~ a liquid which will permeate slowly into some
portions of a larger system. Figure 3 shows that
although the true total volume (Z) of that system cannot
be accurately determined, the effective working volume
(S) and average concentration of the chemical treatment
can be quantified by comparing the tracer concentration
in the liquid entering (I+T) and leaving the system
ZO (D+T). By comparing the individual concentrations of
treatment components and transition metal tracer, the
efficiency and degradation of the treatment and its
components can be determined.
Based on the techniques described above, one may
accurately determine many operating parameters (total
volume, holding time index, blowdown rate, unaccounted
for system losses, chemical treatment efficacy, etc.)
within the wide variety of systems.
The successful use of transition metal ion tracers
described above have been accomplished in several
systems. The following examples are illustrative of
particular embodiments of the invention. It is
emphasized that not all embodiments of this invention
are illustrated with the particularity given below. A
typical calibration procedure is given below. To
calibrate a spectrophotomer for measurement of Co II
concentration, a series of solutions with known
quantities of Co II were prepared.
Spectrometer Calibration Procedure for Co II
The samples of cobalt solutions in Table 1 were
obtained from a 100 ppm stock solution of Co(N03)6H20
and diluted with water to the concentrations shown in
Table 1. Fifteen ml samples of the stack solution ware
mixed with a mask mix and a color reagent. The mask mix
consisted of an aqueous sodium citrate and sodium
-23-
sulfite solution. The color reagent (PAR) solution
consisted of 1-3 drops 0.1 N sodium hydroxide in
approximately 50 mls of 0.2% pure pyridyl azo resorcinol
in water. To the first sample only, 10 drops of
ethylene diamine tetra acetic acid (EDTA) solution was
added to simulate 100% dilution at 530 nm. The EDTA
solution consisted of 5 gm Ha2EDTA in 100 mls water with
a phi adjustment to 9 with NaOH.
TABLE 1
Calibration Data for Cobalt II
Percent Absorbance
f Co+Z'L~p,~m Transmittance l AZ
0** 100 0
.O1 98 .008
.05 90 .045
1 81 .092
.2 67 .174
.3 57 .244
.4 49 .310
.5 45 .347
41 .387
.7 38 .420
1.5 31 .509
* (A) _ -log(%T/100).
** EDTA solution added to simulate 100% dilution.
Transmittance was measured with a Bausch and Lomb
Spectrometer 2000 at a wavelength of 530 nm. The data
from Table 1 was used to generate a calibration curve.
The tracer concentration of samples with unknown tracer
concentration was determined by comparison with the
curve generated from the data above.
r~~~~x,~~~~,.
-za-
Use of Cobalt C~mpound (Co'2) as
Product Feed Trace ~,n Rec~culati,nq Water Svstem
Tests were conducted in an integrated scaling unit
(ISU) designed to simulate an industrial cooling water
system, such as the pilot cooling tower shown
schematically in Figure 1. The ISU contains a seven
liter system adapted to receive continuous streams of
water, chemical treatment and various tracers. This
minimizes variations in concentrations of components
during a test run. The streams are fed through syringe
pumps that pump concentrated feed from a stock solution
prepared in sufficient quantity to last an entire test
period. The ISU is a recirculating water system which
contains a metal heat-exchange tube and is used to model
cooling water systems.
Continuous blowdown is accounted for by continuous
makeup and chemical treatment addition. These tests
were conducted to provide data that allows comparison of
a cobalt tracer under various simulated treatment
conditions against tracers with known performance. Mere
mainly, a cobalt tracer is evaluated by comparison of
its performance with other available methods of
detecting chemical treatment.
The % of expected feed is obtained by dividing the
observed amount of tracer by the expected amount of
tracer in the system multiplied by 100%. The expected
amount of tracer is calculated by a mass balance of
concentrated chemical feed added, makeup water added and
blowdown water lost.
Comparison of Cobalt Tracer (Co'Z)
with Aryl Sulfonic Acid Fluorescent
Tr ce Active p os
This example serves to compare Co'~ as a tracer
against fluorescent tracers and direcC measurement of
the active phosphate treating agent.
-25-
The ISU was started wherein two syringe pumps were
activated. The first pump injected a mixture comprising
57.3 weight percent deionized water, 1.1 weight percent
aryl sulfonic acid fluorescent tracer, 36.6 weight
percent acrylic acid base terpolymer and 1.0 weight
percent Co+2 as Co (N0, ) Z ' 6H20 ( 5 weight percent) . The
second pump injected an overlay of a mixture including
deionized water, potassium hydroxide, phosphate
compounds, tetrapotassium pyrophosphate and phosphoric
acid. The mixture injected from the first pump was
diluted in the system water to 126. ppm. The mixture
injected from the second pump was diluted in the system
water to 170.3 ppm. Grab samples were analyzed for
total phosphorous, fluorescent tracer and Co+~. Table 2
shows the results. Transmittance was determined
spectrophotometrically with a Bausch and Lomb
Spectrometer 2000. The sample blank contained deionized
water, EDTA, a mask mix and indicator. Samples include
mask mix and indicator. The mask mix was a sodium
citrate and sodium sulfite aqueous solution. The color
reagent was a PAR solution as described above.
~~: ~~x.~~.i:~.,
-26-
TABLE 2
Calculated Concentration of
Chemical Feed Based an Trace
of Expected Chemical Feed*
Based on
Time ~ Fluores- Based
on
Elapsed ppm Based on cent Active
(Fir Co'Z Co''z Trader Ph hate
_. ~? -.-
0 .32 87.4 96.8 102.9%
19** .094 24.4 53.5 20.0
45** .091 24.4 39.4 11.8
50.75** .098 27.6 34.6 20.0
63.75** .121 36.2 28.7 13,5
66.25 .254 76.4 94.5 81.8
8775 .206 63.8 104.7 63.5
95.25*** .175 55.9 111,8 58.8
113.75*** .119 36.2 116.5 38.8
117 .337 103.9 110.2 102.4
120 .278 85.0 112.6 83.5
136.5 .349 107.0 114.2 92.4
144 .355 109.4 115.0 89.4
159.75 .318 97.6 115.0 95.9
164.25 .339 103.9 128.3 95.3
166.5 .324 97.6 118.1 95.9
188.75 .402 122.0 126.8 95.9
210.25 .403 122.0 126.8 92.8
231.75 .384 115.7 126.8 96.5
239.5 .404 122.0 126.8 107.1
261.25 .426 131.5 133.1 104.7
279.75 .410 125.2 125.0 100.0
303.75 .429 131.5 128.3 102.4
311.25 .430 131.5 128.3 97.6
334.75 .474 143.3 126.8 104.7
* Values >110~ of expected chemical feed will result
from increase in concentration cycles of
recirculating water due to slow evaporation of
water from system.
** Test of tracer response based on loss of product
feed.
*** Out-of-specification operation to test effects of
high pH excursion.
The purpose of the following analysis is to measure
the difference between Co+1 readings and fluorescent
~~y:~x~~;~f~~,.
-27-
tracer readings and ather active components) of the
treatment.
Chemical Feed Determination Analysis
When 63.75 hours elapsed, the syringe pumps were
started. After that point ~.n time, there was an
immediate rise in measured Co+Z ion concentration as well
as fluorescent tracer concentration and active
phosphate. Text, the effect of a high pH upset was
evaluated as the pH of the system was increased to 8.3.
The measured Co''Z ian concentxation dropped to 0.119 ppm
Co+2 corresponding to 36.2% of the expected feed. At the
same point in time, the fluorescent tracer concentration
remained relatively high corresponding to 116.5 ppm
concentration of treatment. When the pH was lowered to
a normal operating value (pH 7.2) at an elapsed time of
117 hours, the measured Co''Z ion concentration increased
to a corresponding 103.9% of the expected chemical feed.
The drop in pH below 8 increased dramatically the
solubility of the Co+Z ion in the system. Very good
results were obtained with Co''Z, once the pH was
controlled at a level below 8.0 during an elapsed time
of approximately 136.5 hours to an elapsed time of
approximately 279 hours. Also during that time, a
12,400 ~tu/ft2/hr heater was turned on to increase the
basin temperature to 100°F and provide a heat transfer
surface whereby deposit growth could occur. At ~n
elapsed time of approximately 279 hours until the end of
the test, a 25, 000 Btu/ft2/hr heater was turned on to
increase the basin temperature to 120°F and vary good
results were still obtained with the Co+a tracer. The
concentration of chemical treatment slowly increases
with time due to constant evaporation of the process
water throughout the test.
The concentration of Ca'°2 ion was determined by the
colorimetric technique described above. The fluorescent
-2~-
tracex concentration was determined by comparison of the
samples with a calibration curve of tracer concentration
versus emission, [refer to J.R. Lakowicz; "Principles of
Fluorescence Spectroscopy" (1983)]. The total
phosphorus content was determined by persulfate
oxidation of organophosphorus species to orthophosphate
and subsequent formation of blue phosphomolybdate
complex which was quantified spectrophotometrically,
[refer to PR.C. Rand; "Standard Methods for the
Examination of Water and Wastewater", 14th Ed. (1975)].
A11 concentrations of tracers and phosphorus containing
species are expressed as % of expected chemical feed
concentration.
This analysis shows that a Cobalt compound can
function as a tracer and accurately determine the
chemical treatment feed rate at pH <_8. The analysis
proves that Cobalt compounds can follow the graven
fluorescent tracers arid are superior in determining
treatment feed rates than by direct measurement of the
treatment agent (e. g. total phosphorus concentration).
This analysis shows that the Co~2 may be accurately
quantified in the presence of active chemical treatment
agents, other tracers and other compounds and complexes
commonly found in industrial water.
Deposit Analysis
The site of heaviest scaling was removed from a
stainless steel heat exchanger within the ISU. The
white deposit was readily dissolved in HC1. Table 3
shows the deposit enrichment ratio (DER) of the various
components within the scale.
~~(~ ~~x~~~~~,
-29-
TAHLE 3
DER of Scale Formation
Within ISU for Various Compounds
CAmponent DER
Fluorescent Tracer ~ .01
Co42 Ton .92
Ortho Phosphate 1.04
Total Phosphorus 1.85
Pyro Phosphate 2~5~
Hydroxyethanediphosphonicacid (HEDP) 4.25
The enrichment ratio data shows that the Co''2 ion
has less of a tendency to deposit in the above described
system than active treatment formulation components and
by-products such as ortho phosphate, gyro phosphate,
total phosphorus and HEDP. Therefore, chemical feed
determination using a Co~2 ion is acceptable within the
presence of the above-identified active treatment
formulation. Note, also, that the Co'2 ion enrichment
ratio is deceptively high in this analysis because the
system pH was brought above pH 8 allowing some
precipitation of Co''2 ion to occur.
EXAMPLE 2
A test was conducted in an integrated scaling unit
(ISU) designed to simulate an industrial cooling water
system with chemical treatment in the feed as described
in Example 1.
Comparison of Cobalt Ion Tracer (COr2)
with Aryl Sulfonic Acid Fluorescent Tracer,
L' 'um Ion cer and c ive a 's
The ISU was started wherein two syringe pumps were
activated. The first pump injected an aqueous solution
comprising T1.50 weight percent deionixed water, 0.37
weight percent aqueous sodium hydroxide (5o weight
~C;~~~~~~~3~..
-3 0-
Percent aqueous), 14.44 weight percent aqueous potassium
hydroxide (45 weight percent aqueous), 5.41 weight
percent aqueous tetra potassium pyrophosphate (40 weight
percent aqueous), 4.86 weight percent phosphoric acid
(25 weight percent aqueous), 2.12 weight percent aqueous
sodium tolyl triazole (50 weight. percent aqueous), 1.21
weight percent aqueous HEDP (40 weight percent aqueous)
and 0.10 weight percent aryl sulfonic acid fluorescent
tracer. The second pump injected a mixture comprising
94.35 weight percent deionized water; 4.57 weight
percent of a terpolymer consisting of an acrylic acid
base, acrylamide and acrylamidomethane-sulfonic acid;
0.63 weight percent Co(1V03)z~6Hzp (1.0 weight percent
Co+z) and 0.45 weight percent LiCI (0.6 weight percent
Li+). The mixture injected from the first pump was
diluted in the system with water to 132.3 ppm. The
mixture injected from the second pump was diluted in the
same system with the same water to 171.3 ppm. Grab
samples were analyzed for total phosphorus, fluorescent
tracer, lithium tracer and Co+z tracer. Table 4 shows
the results. Transmittance was determined with a Bausch
and Lomb Spectrometer 2000.
-31-
TABLE 4
Calculated Concentration of
Chemical Feed Based on ~acars
% of Expected Chemical Feed
Based'on
Time Based on Fluores- Based Based
on on
Elapsed Co~2 cent Lithium Active
lHx) Ion Tracer Ion Phosphate
0 47 70 72 59
7.7.58 71 75 85 50
41.58 75 92 100 64
71.58 104 97 115 76
104.33 113 105 118 83
129.08 115 106 125 86
137.58 102 106 125 79
185.58* 22 127 125 37
262.16* 36 117 120 28
* Out--af-specification operation to test effects of
high pH excursion.
The purpose of the Following analysis is to compare
Co+2 tracer readings and fluorescent tracer readings and
lithium ion tracer readings and other active components
of the treatment.
Chemical Feed Determination Analysis
For the first approximately 185 hours during pump
operation the pH was maintained at 7.0~0.3. Scaling and
corrosion were observed on the heat exchanger tube.
Lithium ion tracer, fluorescent tracer and Co+2 tracked
closely while the active phosphate lagged behind. Under
~h~se conditions, the tracers were not significantly
being incorporated into the scale deposits. Total Fe in
the cooling water ranged from o.5-0.6 ppm. At an
elapsed time of 185.58 hours, the pH had increased to
-32~
8.0 where it was noted previously that Co*z undergaes
precipitation. As expected, Co*z levels dropped off.
Only lithium and aryl sulfonic acid tracked near 100
expected feed.
The concentration of each component was determined
as described in Example 1. The concentration of lithium
ion was determined by conventional atomic absorption
spectroscopy. All concentrations of tracers and
phosphorus containing species are expressed as ~ of
~.0 expected chemical feed,
This analysis shows that a Co*z ion can be used to
accurately deteranine the chemical treatment feed rate.
The analysis proves that Co*z ions follow the proven
fluorescent tracers and perform very effectively as
compared to other currently used methods for determining
treatment feed rates. This analysis shows that the Co*z
ions may be accurately cxuantified in the presence of
active chemical treatment agents, other tracers and
other compounds and complexes commonly found in
industrial water.
Examples 1~2 ' Conclusion
Since Co*z ion increases in solubility below pH=8,
it may be desirable to use Cobalt tracers in water
treatment systems with pH levels below 8. Ions,
elements, and compounds commonly encountered in
industrial cool ing water systems ( i . e. Ca*z, Mg*z, HC03-
~CO3z-, P0~~3, PZO,-z, polymer and hydroxy ethane
diphosphonic acid) do not affect performance of Co*z ions
as total product feed tracer. Nevertheless, ions that
respond to the color reagent (i.e. copper ions and iron
ions) must be masked to prevent erroneous readings.
CA 02003681 2002-03-27
66530-472
-33-
Examgle 3
Use of V03~ as Product Feed
Tracer in Pilot Cooling Tower ACT)
A test was conducted on a pilot cooling tower (PCT)
designed to simulate an industrial cooling water system.
The PCT contains a 50 liter capacity adapted to simulate
recirculating water, chemical treatment feed, deposit
formation and corrosion on heat exchangers, blowdown and
makeup, and evaporative cooling from a tower fill. The
test was conducted to provide data that allows
comparison of a vanadate ion (V03-) as a tracer under
various simulated treatment conditions against a
conventional chemical feed determination method.
Alternative Sample Analysis
As described in the calibration procedure,
pyridylazo resorcinol (PAR) color reagent may be used
successfully as an indicator with cobalt II ions when
background ions are masked with a sodium citrate and
sodium sulfite solution. When sampling V03-, the sample
is buffered at pH 5.5. The buffer converts VO3- to VOZ+,
which reacts completely with the PAR solution. However,
VOZ+ also reacts with conventional masking agents.
Therefore, VOZ+ is hidden from detection. when masking
agents are present.
To eliminate the need for masking agents, H202 may
be added to a sample solution before the PAR color
reagent to form 2 : 1 diperoxyvanadate, VO (02) 2-, which does
not react with the PAR solution. To another sample, the
VOZ+ ions are allowed to completely react with the PAR
solution. The difference in the transmittance between
the two samples provides an indication of the
concentration of vanadium ions present within the
sample.
--34-
Comparison of Vanadate Ian Tracers
V03-~ with Active Phosphate Analysis
A single water treatment formulation containing
54.55 weight percent deionized water, 15.1 weight
percent aqueous sodium hydroxide (50 weight percent
aqueous), 7.0 weight percent, amino-Iris (methylene
phosphoric acid) (bequest 2000 manufactured by
Monsanto), 12.0 weight percent organo phosphono-
carboxylic acid (50 weight percent aqueous), 4.7 weight
percent sodium tolyltriazole (50 weight percent
aqueous), 2.5 weight percent fatty dicarboxylic acid
(Diacid 1550 distributed by D7estVaco), 2.0 weight
percent surfactant and 1.15 weight percent ammonium
metavanadate with the V03- tracer level controlled at .5
ppm V at a 100 ppm product level. PCT test results are
summarized in Table 5.
~~~~~~~~~~~.
-~35-
T B E 5
Chemical Fe ed Determination Based on
vo,- Concentration,
Active
Phosphate
Concentration
and Blorrdown
Measurement
Calculated Concentration
of Chemical Feed (ppm)
Based on
Based on Blowdown/
Time Based on Active ,yringe
to Elapsed vo3- Phosphate Measurement*
200 ppm of 197 200
product
0 (startup) 190 _
201
2.75 195 ?.04 --
15.67 187 187
32.60 172 138
43.50 164 109
63.67 132 77
68.00 132 81 _
71.00 131 g4
97.50 125 g6
104.30 123 g2
126.50** 118 _
88
153.33 113 85 113
178.20 111 86 114
204.50 108 80 114
227.67 104 76 106
254.40 106 81 111
298.25 107 83 111
324.67 108 85 115
* (Product density) x (o syringe volume) x 10g
mass of blowdown
** Typically, product is initially added (200 ppm) at
twice the specified maintenance product feed rate
(100 ppm). The concentration of treatment in the
system will coincide with treatment feed rate
(based on blowdown/syringe measurements) after
about 150 hours.
~~~;.~~~~3~..
_36_
The V03- ions were quantified by comparison of
transmitted light with samples of known concentration as
described above in the alternative sample analysis.
Additionally, product feed rate was calculated from
syringe pump and blowdown measurements. The active
phosphate content was determined by persulfate oxidation
of organophosphorus species to orthophosphate and
subsequent formation of blue phosphomolybdate complex
which was quantified photometrically; [refer to M.C.
Rand; "Standard Methods for the Examination of Water and
Wastewater", 14th Ed. (1975)].
Comparison of the treatment feed rate in the system
predicted by the V03' ions versus the measurement of
active phosphate demonstrates the superior accuracy of
the measurement of V03- ions over the phosphate method.
At an elapsed time of 324.57 hours, the active phosphate
method indicated 30 ppm less than the accurate syringe
pump and blowdown calculation. The difference in the
levels arise from deposition of the organophosphorus
components of the treatment onto the heat-exchanger
tubes. At the same time, quantitative measurement of
the V03' ions indicated only 7 ppm less than the
calculated product level based on blowdown/syringe feed
measurements. The differences between the V03- ion
levels) and the total phasphorus level is a good
indication of treatment effectiveness, since it
quantifies how much of the active phosphorus-containing
components are being lost within the system from
deposition and corrosion processes. In an "ideal"
operating system, the total phosphorus and V03' ion
levels would all indicate an identical treatment
concentration.
e~"~'~0..~~)~i'~.,
-37-
Comparison of Vanadate Ion Tracers
V03-) with Chromate Ion Tracers (~r2_O~-~,
A single water treatment formulation containing
53.15 weight percent deianized water, 1s.1 weight
percent sodium hydroxide (50 weight percent aqueous),
7.0 weight percent amino-Iris, (methylene phosphoric
acid) (bequest 2000 manufactured by Monsanto), 12.0
weight percent organo phosphonocarboxylic acid (50
weight percent aqueous), ~.7 weight percent sodium
tolyltriazole (50 weight percent aqueous), 2.5 weight
percent fatty dicarboxylic acid (Diacid 1550 distributed
by Westvaco), ~.0 weight percent surfactant, 1.4 weight
percent sodium dichromate dihydrate and 1.15 weight
percent ammonium metavanadate with the V03~ tracer level
controlled at .5 ppm V at a 100 ppm product level. PCT
test results are summarized in Table 6.
~(:.~.~r~~~~i~,.
-38-
TABLE 6
Chemical Feed Concentration Determination
Based on V03' Concentration and CrzO~'2 Concentration
Calcrlated Concentration
of Chemical Feed (ppm)*
Time
Elapsed Based on Based on
(Hr) ~H V03' ~r20~'Z
0 7.4 196 192
8.48 - 193 175
23.77 8.44 171 155
33.15 8.47 160 3.47
41.42 - 160 150
49.72 8.73 152 146
58.92 8.73 143 136
80.00 8.50 130 126
110 . 50 8 . 51 116 11.2
141.83 8.67 111 105
172.83 9.20 110 102
202.67 8.43 108 103
210.92 9.00 108 107
21,2.17 4.90** 131 24
213.17 4.90** 119 2
214.17 4.90** 115 2
215.17 5.40** 112 2
216.17 7.7** - 10
216.87 7.86** - 11
217.17 7.9** 112 11
218.17 8.1** 99 11
222.27 8.37 76 11
234.75 8.3 56 16
270.60 8.45 46 16
321.83 8.50 72 50
383.72 - 77 60
* Typically, product is initially added (200 ppm) at
twice the specified maintenance product feed rate
(100 ppm). The concentration of treatment in the
system will coincide with treatment feed rate
(based on blowdown/syringe measurements) after
about 150 hours.
** Out-of-specification operation to test effects of
low pH excusion.
The unknown quantities of VO~- ions and Cr20,'2 ions
were quantified by comparison of transmitted light with
samples of known concentration. Transmittance was
determined with a Bausch and Lomb Spectrometer 2000.
-39-
Comparison of the treatment feed rate in the system
predicted by the V03- ions versus the measurement of
CraO,-Z tracer demonstrates the superior accuracy of the
measurement V03- ions over that of Cr20,-Z ions when pH
excursions occur. The data as shown in Table 5 reflects
an acid upset initiated at an. elapsed time of 220.92
hours. The low pH causes a sharp rise in mild steel
corrosion rate of the heat exchanger which is known to
cause losses of the bichromate tracer. The vanadate is
noticeably mare resistant to that loss than bichromate
as shown in Figure 4. Also shown in Figure 4, the
vanadate tracer recovers more quickly than the
bichromate.
Example 3 -Conclusion
The benefits of using vanadium compounds are as
follows:
Vanadium oxyanions (V0,-) does not tend to
precipitate with other solids which are formed between
pH 7-9.
Vanadium oxyanians (VC~~-) are resistant to
precipitation in the presence of corroding mild steel
heat exchange tubes.
Example 4
Several transition metal ions were evaluated in
aqueous systems at pH 9.3 and pH 7Ø The performance
of each ion and oxyion was determined by the following
equation:
% Recovery = (FS / US) x 100%;
wherein:
FS - Concentration of metal ion (ppm) in
filtered sample after passing
through 0.45 ~m filter
Us = Tnitial concentration oP transition
metal ion (ppm) in unfiltered sample
CA 02003681 2002-03-27
66530-472
-40-
A maximum value of ~ Recovery = 100 ~ shows that the
transition ion was completely soluble in the system at the
given pH. Results are shown in Table 7 and Table 8 below.
TABLE 7
Performance Comparisons of
Transition Metal Tracers (at pH 71
Transition Element
Element Group Number
Meta Ion Form Used Periodic~T ,ble % ecovery
R
Silver Age IB 22%
Zinc Zn'2 IIB 97%
Yttrium Y+' IIIB 91%
Zirconium Zr+' IVB 8%
Vanadium V~s* VB 100%
Chromium Cr''** VIB 99%
Manganese Mn+2 VIIB 98%
Nickel Ni+Z VIIIB 100%
(col. 3)
Cobalt Co+2 VIIIB 95%
(col. 2)
Aluminum A1+' IIIB 70%
* as Vanadate (V03-) .
** Note distinction from chromate (Cr20,-2) , where Cr+6
is formal oxidation state of metal center.
i~~°~.,~.~~o~.,
-41-
TABhE 8
Performance Comparisons of
Transition Metal as Tracers (at pH 9 3Z
Transition Element
Element Group Number
Metal Ion Form Used Periodic Table Recover
%
Silver Ag+ IB 28%
Zinc Zn+Z IIB 36%
Yttrium Y+' I I Z B 53 %
Zirconium Zr+' IVB 6%
Vanadium v+5* VB 100%
Chromium Cr+'** VIB 94%
Manganese Mn+a VIIB 73%
Nickel Ni+z VIIIB 67%
(col. 3)
Cobalt Co+2 VIIIB 50%
(col. 2)
Aluminum A1+' IIIB 60%
* as Vanadate (V03-) .
** Note distinction from chromate (Cr20,-2) , where Cr+e
is formal oxidation state of metal center.
As shown in Table 7 and Table 8, Vanadium (V03-) and
Chromium (Cr+') exhibit excellent solubility in both
systems, whereas other transition metals such as zinc
(Zn''Z) , yttrium (Y+') , nickel (Ni+2) and cobalt (Co+2) are
better suited in systems with a pH 7.0 than pH 9.3.
Solubility at lower pH for these transition metals show
an advantage over non-transition metals such as aluminum
(A1+'3) which are not as soluble at pH 7 as shown in Table
7. Furthermore, Table 7 and Table 8 show that silver
(Ag'') and zirconium (Zr+') are not suitable at either pH
7 or pH 9.3.
ic~~; ~~~~.i~.
--42-~
Conc7.usior~
While the invention has been described in
connection with specific embodiments thereof, it will be
understood that it is capable of further modifications.
This application is intended to cover any variations,
uses or adoptions of the invention following, in
general, the principles of this invention, and including
such departures from the present disclosure as come
within 7cnown and customary practice within the art to
which the invention pertains.