Note: Descriptions are shown in the official language in which they were submitted.
2Q2~7~9
.~
Title: Nethod of detecting a bar code
A. BackarQtln~l of the i nvention
1. Field of the invention
The invention relates to the reading of bar code
patterns applied to carriers for the carriers to be
automatically recognized. It cullCe~llS a method of
detecting a bar code from a bar code signal which
essentially forms a cross-section of a bar code
pattern which, through irradiation, lllmi nP~cPC from
the background of a carrier. The invention also
comprises an apparatus for reading such a bar code
pattern .
2. DescriPtion of the Prior ~rt
In automatic postal processing systems, as is well
known, bar coding is used for sorting according to
destination, for inGtance. To that end, at the input
of such a system, for instance by means of video
coding, each letter to be processed in such a system
is provided with a processing code in bar code form.
The processing code may be a destination code, as a
postcode, derived from the destination address
provided on the letter. At one or more decision
points in the process the bar code is read. Reading
the code basically comprises the following steps:
a. picking up an image signal of the physical bar
pattern on the carrier by passing it along
optical scAnn i ng means;
b. detecting the bar pattern from the image signal
and indicating, for instance in digital form,
"bar/no bar" and, if applicable, the type of bar
` ` 2~20~3~
(e.g. thick/thin), for each position in the bar
pattern;
c. rleco~l i n~ the detected bar pattern .
On the one hand, a bar pattern provided on the
5 carrier should be as inconspicuous as possible, but
on the other it should be readily distinguishable
from any other printing when read automatically.
Accordingly, such bars are typically applied to a
carrier in an ink that emits light under luminescent,
10 particularly fluorescent, effect. A bar code signal
of a lllm;n~cc~nt bar code pattern can be read using
transducing means such as known, for instance from
Dutch patent specification NL 164g80. For the bar
pattern on the carrier to luminesce, it is to be
15 subjected to focussed irradiation using W light, for
instance. Here, a specific problem arises, namely
that of bauk~Lull..d influence due to such irradiation.
This means that irradiation will not only cause the
bars written in fluorescent ink to ll~m;n~cce, but
20 also their ba~ kyLuulld, wholly or locally, which is a
fact to be taken account of. This is the case when
envelopes used f or letters are made of paper
containing so-called "whiteners", which have
rluorescent properties. The same problem presents
25 itself when other writing or printing in f luorescent
ink extends into the zone of the letter where the bar
pattern is applied. Moreover, it has turned out that
a lllm;n~cc~nt background may act as an amplifier of
the lllmin~c~ nt effect of the bars themselves. Najor
30 variances may then arise in the signal amplitude of
the image signal read, not only in bar code signals
of successive letters, but even within one and the
same bar code signal. This may weaken the reliability
of the signal information used to make "bar/no bar"
35 decisions.
` -- 2~2~7~
When the bar code used is of the ' mark space '
type, the background influence also makes it more
dif f icult to detect spaces in a bar pattern . In
short, the problem is basically one of finding a
5 reliable signal threshold or another criterion for
each "bar/no bar" decision to be taken.
B. ' ry of the invention
The invention offers a solution to the problem stated
hereinabove. It is based on the experimental
10 experience that, first, a reliable background
approximation from the bar code signal values is
always possible in virtue of the fact that the
ba~,}.yl UUllli of the carrier is invariably ~re6ent
between the respective bars,
15 and, second, there is a certain correlation between a
ba. kyL uu.ld and the additive ~ uullse of the bars
lllm;nPsrin~ from the bauk~uu-ld under irradiation.
Using this experience, the method according to the
invention is characterised in that
20 the bar code signal within each signal area in which
the bar code signal may be expected to have a bar
signal value cu~ L,ul ~l;n~ to a bar, is tested
against a bar criterion obtained through prediction
from a local approximated background signal value
25 derived from the bar code signal in that signal area.
This means it is possible to make a reliable
prediction for each ~ar area to be PYAmi nPd about
what criterion the signal values within that area
should meet f or a bar to be detected or not within
30 that area, on the basis of a priorly established
correlation between the local baul~u,Luu-ld signal value
and the additive L~ uullse of a l~lminP~cPnt bar
pattern. Sinoe such a correlation is also a
reflection of the properties of the ink used and the
o~9
properties of the pickup used, the operation
according to the invention is further characterized
in that the prediction is carried out with the aid of
a priorly compiled prediction table.
Further preferred features and r-' o~ 5 of the
invention are summarized in the other 6ubclaims and
described in detail with reference to the drawings.
C. References
( 1) Dutch patent specif ication NL 164980
Title: Optical reading head
(2) Dutch patent specification NL 183790
Title: Method for character segmentation
D. Brief description of the ~lrawings
The invention will be further explained with
reference to the drawing6, in which:
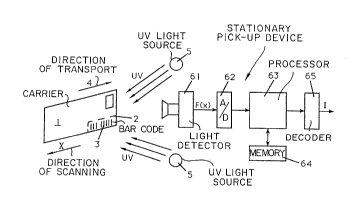
Fig. 1 shows an apparatus for obtaining an index
signal F(x) and for detecting an index from
this index signal and ~l~co~l;n~ an index;
Fig. 2 shows an ideal index signal F* (x);
20 Fig. 3 shows the transfer function (PSF) H(x) of
the pickup used;
Fig. 4 shows the convolution F(x) of F*(x) with
H(x), in theory;
Fig. 5 shows ditto, in practice;
25 Fig. 6 schematically shows the spectral
distribution of the light emission of
carriers containing f luorescent pigments;
Fig. 7 shows a part of the index zone of a carrier
with the outermost positions of the f irst
bar;
Fig. 8 shows an index signal of the part shown in
Fig. 7, viewed in the time according to a
convolution as shown in Fig. 4;
~2~3
Fig. 9 6hows the signal of an index bar.
E. Desription
E . 1 Tn~rQduction
For the purpose of automatic postal processing, a
destination code on a letter, for example in the form
Or a postcode, is translated into a bar code, called
index,and applied to the letter in a fluorescent ink
(printed, written, or sprayed). For the Netherlands,
the postcode consists of four numerical and two alpha
signs separated by a space. In a video coding
operation, for instance, this information is encoded
into a bar pattern consisting of 36 successive
segments, 6 units of 6 segments per sign, with a
nominal pitch of 1. 66 mm. In each of these segments a
vertical bar may be flicpos~d with nominal ~ ionc
of 0 . 5 mm width and 5 mm height. The encoding is such
that each unit starts with a bar and, in addition,
can be represented by a bit pattern of zeros (no bar)
and ones (bar). The reading of the index is based on
2 o the f luorescent properties of the bar ink .
Fig. l schematically shows how a letter 1 with an
index pattern 3, also called 'index' for short,
provided in an index sone 2 specif ically intended for
the purpose, is passed along a W light source 5
emitting W light of 365 nm, and a pickup 61 at a
LL~nS~OL ~ rate of about 3 m/sec and a frequency of 8
letters/sec in a transport direction 4 for the index
3 to be read. Irradiated by the W light, the
fluorescent bars of the index 3 light up from a
ba~:kyL~u~-d formed by the material of the letter. Due
to this ll~m;n~cc~n~e~ an optical signal is generated
which is suhceqll~ntly picked up by the pickup 61 and
converted into an electric index signal F(x). Then,
in known manner, this signal is sampled, converted
20207~
into a digital signal by means of A/D converting
means 62, and under control of a proces60r 63
temporarily stored in a memory 64 accessible for
further processing. The further processing comprises
5 the detection proper of the index pattern from the
stored digital signal values, and is carried out by
the abu~ ioned ~JLOCeSSUL 63 using ,uro~L -
~based on the new metllod of detection according to the
invention to be described hereinaf ter . The detected
10 index pattern, the bar code, is then decoded into
index I, the destination code proper, with the aid of
oll;n~ means 65, and used for further proc~cs;n~ of
the carrier of the imdex pattern cuLL~ ; n~ to
this index.
15 E . 2 AnalYsis o E the index siqnal F ~x)
The electric index signal F(x) in fact repre6ents
a cross-section of the index 3 on the letter 1
scanned in a direction x, opposite to the direction
of transport 4. The pickup 61 i8 required to have a
20 distinctive power in the direction x. If its power
were infinitely great, in such an ideal case F would
look like the fictive signal F*(x). A part of the
form of such a signal is shown in Fig. 2 as a
function of x covering five segments, the signal in
25 each segment - the segment separation is designated
by 7 - indicating either a space 8 or a bar 9. In
practice, however, the pickup has a finite resolving
power, on account of the fact that the index pattern
3 is picked up with a pickup provided with a vertical
30 slit (i.e. vertical to the direction of transport x)
having a finite width, preferably chosen to be equal
to the nominal width of an index bar, which is 0 . 5 mm
in the present case. The pickup accordingly has a
transfer function (Point Spread Function [PSF] )
35 designated by H(x) in Fig. 3, which is uniform across
~` 2~207~9
the slit width 10 and zero outside of it. Ftx) can
thus be repre6ented by the convolution of F* (x) with
H (x):
F(x) = F*(x) x ~ H(x) (1)
The theoretical form of F(x) i5 shown in Fig. 4
and a corr~cp~An~li nj signal in practice in Fig. 5,
where 7 again indicates the segment separation, 8 a
space and 9 an index bar.
The signal F(x) is built up from three signal
Ants, the ~ t coming from the paper
ba~:}.u,Luulldl the emission of the fluorescence pigments
of the ink used for the index bars, and the noise in
the pickup system.
F(x) = A(x) + I(x) + R(x) (2)
15 wherein
A(x): Bauk~Luul.d ~ ,vl~ent
I (x) : Index ~ Ant
R(x): Noise ~ Ant
The f irst two ~ -nts themselves are each
20 composite and will be subjected to further
consideration. A substantial part of the noise
- An~nt consists of paper noise, but also the
pickup used for obtaining an electric index signal
F (x) contributes to the noise . It will be shown that
25 by using the invention, the influence of the noise
1 on the detection result is implicitly taken
into account, or rather, eliminated, and thus taking
special measures is not re~iuired.
E.2.1. Ba~ uu-~d ~ Ant A(x~
30 Experiments have shown that the ba~;kyLuu--d ^ -t
is mainly determined by the optical properties of the
paper . In the f irst instance they are assumed to be
?ollcly present throughout the index zone 2.
The ba( ku,Luu-.d - l. in llu-.cu.. l.d-"inated" index
zones can be def ined as:
A(x) = AP (3
AP: Ba.:k~L~,ul.d primary
When the paper merely reflects (and does not
5 fluoresce), AP will only consist of the reflected W
light . This is f iltered out in the optical system by
an optical low-pass filter (for wavelengths from
about 580 nm). Therefore, reflected radiation with a
wavelength of 365 nm does not contribute to A(x).
However, most types of paper used for envelopes
contain so-called "whiteners". These are substances
with a variety of fluorescent pigments which,
together, have a whitening effect. When such paper is
irradiated with W light, an emission occurs with a
15 spectral distribution as schematically shown in Fig.
6. Flg. 6 shows, on the one hand, the radiation
energy SE (random scale) of the W source emission
11, the "whitener" emission 12, and the index
emission 13, respectively, as a function of the
20 wavelength in nm, and, on the other, the passed
quantity D in percentages of this radiation energy
SE, limited by the sensitivity 14 of the photo
multiplying tube used in the pickup 61 and the
low-pass filter function 15 referred to hereinabove.
25 This spectral distribution has a non-negligible
extension beyond 580 nm to be accordingly observed as
a contribution to A(x) (schematically represented by
the hatched area 16 of Fig. 6). However, when the
index zone is "contaminated" by (non-fluorescent)
30 printing, variance will occur in the background
contribution. Such printing brings with it a damping
of the ba.:l.yL.,ul.d signal, which can accordingly be
def ined as:
A(x) = al(x).AP (4)
3s wherein al(x): damping factor at the location of
-- 202~73~ ~
the printing.
The following applies to the damping factor:
0 ~ al(x) ~ l,
al (x) = 1 for x without printing
al (x) < 1 for x with printing.
In practice the values of al (x) are between 10% and
100% .
- In practice there have also been instances of
printing in "narrow-band" fluorescent ink, applied
with a so-called "marker" pen, for example. They
exhibit the same behaviour as the index bars, but
have different dimensions.
A non-f luorescent printing can only dampen the
reflected or the emitted radiation o~ the background
and accordingly appears as a damping factor in the
f ormula .
A fluorescent printing itself emits light (as does
the index) and thus makes a contribution of its own
to the ba.kyLuu..d signal. This leads to an additive
~ 1 AF(x).
A(x) = AP + AF(x) (5)
wherein
AF : background f 1U~L ~8.. ~ ^nt
Therefore, the background . -nt can be generally
25 defined as:
A(x) = al(x).AP + AF(x) (6)
E. 2 . 2 . Index ~ ?nt I (x~
Practice has shown that the conception of an index
bar as lighting up from its ba~yL~ u..d under the
30 influence of W light is too simple. One of the most
marked rh^n. - in f luorescent indexes is the great
influence of the ba~:k~L~u-.d on the signal amplitude
of the index bars. When the index signals of a dark
letter and a white letter are compared, the index
`-- 2~7~9
bars on the letters themselves do not turn out to
differ Yery strongly, but they do in the signals: the
index bar amplitude of the dark letter is approx. 400
mV, whereas that of the white letter >15 V!
When it is assumed that the bauhyluulld of the dark
letter hardly contributes to the index bar amplitude,
this amplitude is exclusively det~rm; necl by the W
radiation striking the bars directly. Accordingly, in
this case the index c -nt is def ined a6:
I(x) = IP(x) (7)
wherein
IP (x) : index primary ~n~t
This primary L then has an amplitude
contribution of approx. 400 mV. However, when the
signal comprises a clear ba~_h~Luulld contribution, the
index bar amplitude is many times larger. Upon
further examination, it turns out there is a fairly
constant correlation between the index bar amplitude
and the bachyLuull~ value.
Expressed in fuL l l~c form:
I(x) = IP(x) + IS(x) (8)
= IP(x) + a2(x). A(x)
IS(x) = a2(x). A(x)
wherein
IS (x) : index s~cnn~ry - -nt
a2 (x) : correlation factor
In practice it turns out that a2 (x) is roughly
between 5 and 8. The bL~h~L~ul-d, therefore, seems to
act on the index emission as an amplif ier. In other
words, the index bar signal I (x) is determined as to
a much greater part by 5ecl n~Ary excitation by the
ba.hyL~,ul.d than by direct irradiation with W! This
is an important conclusion, especially when
contamination of the index zone is considered.
When non-fluorescent background with damp factor
~a~739
11
al(x) is involved, A(x) can be defined as [see (4) ]:
A(x) = al(x).AP
Formula ( 8 ), in turn, def ines:
I(x) = IP(x) + a2(x).A(x) (~)
5 theref ore:
I(x) = IP(x) + al(x).a2(x).AP (10)
The contribution of IP (x) is small in comparison with
a2 (x) . A(x), so that the index amplitude is virtually
exclusively det~rm; ned by the latter component. In
10 the case of ba~;hyruulld printing, however, this term
is weakened by a factor al(x), which may decrease to
10% or further! This means that such printing
interfering with the index bars causes a very large
variance in the index bar amplitude.
15 E . 3 . Statement of the~ T~roblem
In summary it may be said that the relevant
information in the index signal F(x) is represented
by the ~ 1. I (x) . It comprises a primary
component IP(x) making a fairly small amplitude
20 contribution of little variation, and a ser-~n~lAry
c, _ --t IS(x), which may give ri6e to very large
variations in the peaks of F (x) . Although the
background amplitude may also vary strongly
( f luorescent contamination of the index zone 2 [ Fig .
25 1] ), it is invariably (amply) ~Yreed~d by a bar
contribution in the amplitude signal (amplifier
ef ~ect) . But precisely such possibly large variations
in the index signal F(x) both of the ba.}.~Luul.d
~- ,r--t A(x) and of the additive index component
30 I(x) proper make it difficult to reliably establish
the presence of a bar or a space in a part of the
index signal under examination. A peak approximation
using conventional peak follow methods is inadequate
here, since such an approximation is sensitive to
12 2~Q~
successive spaces.
E. 4 . The detection alqorithm
Starting from the fact that it has been
experimentally est~hl 1 Rh-~d that
5 a) a reliable background approximation is always
po66ible(''bauk~Luu..d'' is present between all the
bars ), and
h) there i6 a correlation between a given background
and the additive re6pon6e of f luore6cent bars
applied to it,
an index detection algorithm has been developed in
which the most critical a6pect of the method, namely
the peak approximation, is replaced by a prediction
of the index bar response. This prediction is made
15 with the aid of a prediction table (see Table 1) on
the basis of a locally det~rmi n~d background signal
amplitude. This table takes account of the properties
of the W light source/signal pickup combination (5,
61) used and the ink used. Such a table is compiled
20 beforehand using the correctly detected index signals
from a test set of letters. See under E. 4 . 4 . below.
The detection algorithm proper comprises two
subalgorithms
(i) the detection of a possible first bar,
2 5 and
(ii) a segmentation and classification
algorithm of the f irst bar and each
successive bar.
Both the detection of the position of a possible
30 ~irst bar and the actual determination of the
presence and the be6t po6ition of the f irst bar and
each 6ucce6sive bar are carried out on the basis of
the aLu.,O l.ioned prediction with the aid of the
prediction table.
202073~
13
With a view to a more detailed discussion of the
subalgorithms mentioned, a further signal description
will be given first.
E. 4 .1. Si~nal descri~tiQn in view of the alqorith~
Fig. 7 shows a part of the index zone 2 of a
letter 1 moving in a direction 4 along the pickup 61
(Fig. 1), with the index pattern in the direction x
being scanned from the letter edge 16. Of the index
pattern the f irst bar is shown in two positions 17
and 18 at a minimum possible distance from the edge
16 and at a maximum possible distance from the edge
16, respectively, and a possible second bar 19 at
pitch distance from position 18 of the f irst bar. A
broken line 20 desig~ates the position of the letter
1 relative to the centre line of the pickup 61 at the
moment when edge det~ction occurs. Edge detection is
carried out using for instance a photo cell arranged
along the letter transport line.
Further references in Fig. 7 have the following
2 0 meaning:
LFC: position of the letter upon edge detection
LPl: minimum position 17 of the f irst bar
LAl: maximum deviation of the f irst bar relative
to the minimum position referred to
LIS: pitch
LSD: bar width
Fig. 8 shows a corrP~p~n~lin~ index signal F(t)
viewed in time, picked up by a pickup provided with a
vertical slit with a width OSB eslual to the nominal
3 o width of the index bar used in the index pattern .
COLLC: ~ollding first and second bar positions are
indicated by 17 ', 18 ', 19 ', respectively. Further
references in Fig. 8, now viewed in time, have the
following meaning:
202073~
14
TFC: moment of letter edge detection (t=0
TP1: minimum 'position' of the first bar
TA1: maximum deviation of the f irst bar
TIS: pitch
5TNSD: ' bar width '
TDSA: target area
AGR: (approximated) ba.}.~L~ul.d amplitude
THR: thre6hold value
TOP: bar amplitude peak value
The signal F (t) i8 stored chronologically - from
the moment t=0 when the pickup i5 switched on after
edge detection up to a moment T which, using a safety
margin, i8 well beyond the moment when the last index
bar has passed the pickup 61 - and digitally in an
addressable memory, for instance at a sampling
interval of 23 ~ sec and a sampling step of 15 mV.
Thus, the time differences in fact become address
diferences and signal level differences become
differences in address content. Hereinafter the
digitized signal values for 0 ~ t S T will also be
designated by F (t) since the chances of
misunders~n~l;n~c arising are small and the
ro~ hi~ity is thus ~romoted.
E. 4 . 2 . Detection of the f ~ rst bar
Referring to Fig. 8 the subalgorithm in respect of
the detection of the fir6t bar (Fig. 7: 17, 18) will
be explained.
The f irst bar is located in a search area ZG1,
where
TP1 S t < TP1 + TA1 + TNSD (11)
i . e. between the outermost positions of the f irst bar
indicated by 17 ' and 18 ' . The detection of the ~irst
bar comprises a first broad detection and a second,
f iner detection . First the search area ZG1 is broadly
~ 2~2~73~
stepped through at a ~itep which is selected to be
equal to the width of a target area
TDSA = (l-ALPHA)*TNSD/2, (12)
namely, half the width of that part of a theoretical
5 bar amplitude which exceeds a threshold value T~R.
THR is def ined as
TiIR = AGR + VARAGR + ALPHA * CONTRAST ( 13 )
wherein
AGR: approximated background amplitude
VA~AGR: ba~ Luuild variation (in AGR from
Table 1)
ALPE~A: detection parameter (between O and 1),
experimentally determined
CONTRAST: difference between the expected minimum
response and the maximum ba~ }~yLOulld
variation VARAGR (also from Table 1)
The approximated ba~_k~L~,u-ld amplitude AGR at the
moment t, with each step TDSA carried out, is
det~rm;n~ as the greatest value o~ LMIN and R~IN,
20 LMIN and RNIN ~. i.L~s~,ll ing the smallest siqnal
amplitudes round in the time intervals t-TIS to t and
t to t~TIS, respectively, i.e. in areas to the left
and to the right of t with a size of the pitch.
When at a certain time t=tO F(tO) is greater than
25 the instantaneous threshold TE~R, then the second,
f iner detection method is carried out which is in
fact (selected to be) equal to the method for the
detection of each successive bar. See the
se tion and classif ication function under E. 4 . 3 .
30 to be described in greater detail hereinafter. This
finer detection scans the area between tO-TIS/2 and
tO with small steps, namely per sample (i.e. sampling
interval), selects the best position of a segment
possibly containing a bar (segmentation), and checks
35 wh--ther this segment actually contains a 'bar'
16 2~12a7~
(classif ication) . If this is not the case, the
process continues with the f irst broader detection
with tO as the new start position.
The detection of the first bar is terminated when:
5 a. the detected first segment is actually classified
as a bar segment,
b. no bar segment is found in the searching area ZGl.
After b. the detection is discontinued and a 'reject'
code is generated. After a. the det~nm;nPcl position
10 of the first segment i8 used for segmenting and
classifying the next segment.
E. 4 . 3 . Seqmentation and classif ication
When the position of the f irst segment is
det~rminP~ it seems easy to sequentially segment the
15 further signal F(t) at a fixed pitch TIS. However,
this would only be the case if in practice, too, the
bars could be applied at a constant pitch. In
practice, however, a certain specified pitch
tolerance should be taken into account. Moreover, the
20 time~ r~n~ont signal F(t) is also influenced by
variations in the transport rate of the letter. For
that reason, the best positions of the successive
segments are perio~lic~lly determined by repeating in
each segment the search for the best position within
25 a ,yl-- l.L~...isation area, which is defined by the pitch
tolerance. The pitch TIS, however, is ~ Lessed in
the number of samples and has a tolerance of 1 sample
in the present ~ t. Such a method of
segmentation, in which a pitch tolerance is taken
3 0 into account, is known per se as a special case
(since only one value for the pitch size is used)
from Dutch patent specification 183790.
Fig. 9 once again shows the theoretical signal of
a segment with a bar. Such a segment generally has
` ~` 202~7~9
17
the following properties:
(i) the signal value of the index signal F in
the middle area is greater than the signal
values F (tL) or F (tR) at the left-hand edge
tL or the right-hand edge tR of the segment.
(ii) the signal values F(tL) and F(tR) of
left-hand edge tL and right-hand edge tR are
not very different.
Starting from this, the signal value in the middle
10 area of a segment is defined as integrated value IMID
during a time interval TTOP
TTOP = GANMA * TNSD (14)
wherein
GAMMA: a detection parameter between 0 and 1,
15 TNSD: the bar width.
The extent to which ~LUIJ~L LY (i) is present is
expressed in a first structural feature
SMATCH = IMID -- ILEFT - IRIGHT (15)
wherein
2 O IMID: the integrated value during TTOP,
ILEFT: the signal value F(tL) on the left-hand edge
of the segment,
IRIGHT: the signal value F(tR) on the right-hand
edge of the segment.
The extent to which both properties (i) and (ii)
are
present is summarized in a second structural feature
SCORE = SMATCH -- [ILEFT -- IRIGHT] (16)
The second structural feature SCORE is a measure of
the balance between left and right. Within the
~,y~ r~ ization area that segment position is looked
for in which the second _L u~;LuL~-l feature SCORE is
largest .
The first structural feature SMATCH is used for
classifying the segment as a bar or space segment. To
` ~ 2~2~739
18
that end it is tested against a threshold MTHR which
i6 det~rmi n~d depending on an approximated background
signal value AGR found in the segment in that
position where SCORE is largest.
5 MTHR is def ined as:
MHTR = (TTOP--2) * AGR + TTOP * VARAGR + BETA * TTOP *
* CONTRAST ( 17 )
wherein:
AGR: approximated background signal value as the
average of ILEFT and IRIGHT,
TTOP: as (14),
BETA: detection parameter for adjusting the extent
of (lF-pPn~lr~nry on the bar response between 0
and 1,
VARAGR: ba-_ky,~u-.d variation (at AGR from Table 1),
CONTRAST: difference between the expected minimum
response RESP and the maximum ba-_kyLvul,d
variation VARAGR (also from Table 1).
This threshold is chosen such that the part that is
in~r~n~r~nt of the bar response equals the maximum of
the structural feature SMATCH for a space. SMATCH for
a space is at a maximum when:
ILEFT = IRIGHT = AGR ( 18 )
IMID = TTOP * (AGR + VARAGR) ( 19 )
This means that for the same background signal value
AGR, the SMATCH value of a bar should be greater than
that of a space; ancl the extent by which it should be
at least greater is det~rm-nPfl by the fraction BETA
of the bar response in the middle area predicted with
the prediction table (Table 1) for the approximated
background signal value found. A threshold MTHR thus
chosen offers the following advantages:
a) the chance of a space being misclassif ied as a bar
is small, because the minimum MTHR (when BETA = 0)
equals the maximum of SMATCH of a space.
202073~
19
b) According as BETA ls chosen to be smaller, more
forms of bars where the response exceeds the
background variations can be classif ied as bars,
which renders the present method more generally
applicable.
Accordingly, the classification proper is as follows:
the segment is a ' bar ' segment when SMATCH > MTHR and
it is a space segment when SMATCH S MTHR.
When a segment is classified as a 'bar' segment, the
position of this segment where SCORE is greatest is
used as a start position (by..~ u--isation) for a next
segment to be ~Y~m;n~d.When a segment is classified
as a ' space ' segment the startposition for the next
segment is the position of the preceding segment plus
the nominal pitch TIS. In both cases the start
position of the next segment to be ~Y;~lnin~d i6
det~rminPd by the observed position of the present
segment plus the nominal pitch TIS.
E. 4 . 4 . The };)rediction table
2 o For each pickup a separate prediction table is to
be compiled, Table 1 ls an example. For the
compilation of such a table a random known index
detection method may be started from, or the index
detection method according to the invention with a
table for another pickup. A test set is selected of
index signals properly detectable by such a method,
of index patterns written in the same ink on random
letters. 8y the same method, or possibly by hand,
these signals are (again) segmented and classified as
3 O space or bar segments . Of each classif ied segment a
background signal value, for instance the minimum
signal value, and the maximum signal value are
det~nmin~d. Of each index signal - both of the space
segments and of the bar segments - a histogram of the
20207~9
background 6ignal values and a histogram of the
maximum signal values are drawn up. On the basis of
these histograms, for each background signal value
found, maximum ba~;l~r~ul~d variation and the minimum
5 re6ponse of a bar are ~pt~rm; n-~d. The values thus
found form three series, one of ba~ oul.d signal
values, one of maximum ba- hyL~,ul-d variations and one
of minimum bar responses. These series generally
exhibit gaps in their sequence and therefore are
10 supplemented with values CULL-~L,~, i;ng with
intermediate missing baci~L~.u~ld signal values, for
instance up to the sampling step of the digitized
signal, and adjusted so that the whole shows a fluent
course .
Table 1 shows the results for a test set of 80
letters. For each signal step of 40 mV for the
background signal AGR (column 1) up to a certain
maximum, the maximum ba~ k~L~,ul-d variations VARAGR
(column 2) and the minimum additive response RESP
20 (column 3) of an index bar are specified. Column 4,
- furth lc:, lists the cULr~ ;ng contrast
CONTRAST, which is the difference in value between
the minimum additive response RESP and the maximum
bac3~r ~UIId variation VARAGR for the same background
25 signal value AGR. All values are .:x~Lessed in mV.
In a table compiled in this way, the maximum
possible contribution in a positive sense of the
aL~ ioned noise _ ~ [R(n) in formula (2) ]
is also taken into account in the values for the
30 maximum ba~ky- ~JUI-d variation (column 2); and that
same contribution in a negative sense is taken into
account in the values of the minimum additive
response of the bars (column 3 ), so that each of the
CONTRAST values in column 4 in fact represents the
35 minimum noise-;n~l~r~n~9~nt part of a bar response,
2020739
21
which may occur with the background signal value in
column 1 cULL ~y~n~lin~ with that CONTRAST value. It
i6 precisely this measure CONTRAST which is used in
the two bar criteria de6cribed hereinabove, namely
5 the thresholds THR t~ormula (13) ] and MTHR [formula
(17) ] for the provisional and definitive decision,
respectively, on the presence of a bar or a space.
Any inf luence of the noise - t on this decision
is theref ore no longer present .
For the "on line" operation of the detection
algorithm, this table is converted into a new table
in the compilation/a6sembly phase of the detection
~)L~:IyL ~-, at given values for the detection
parameters ALPHA, BETA and GAMMA, by carrying out the
operations according to the formulae (13), (14), and
( 17 ), in which new table during the on line
operation, for an observed ba~}.gLuul.d signal value
AGR, the values for THR and MTHR are directly found.
E. 4 . 5 . Parameter adiustment
The results of the new detection algorithm are
only influenced by the parameter choice of ALPHA,
BETA and GAMMA.
The parameter ALPHA mainly inf luences the
processing time. Its influence on the detection
results, however, is limited, since the detection of
the first bar in~oLyuLates the possibility of
synchronising again when a false synchronisation is
registered .
BETA indicates the reguired guality of the
3 0 segments of the indeY bars . Too high a BETA may cause
an in~ULLe:~;l classification, for a bar may be
classified as a space. The reverse applies when BETA
is too low. However, in virtue of the choice of the
threshold value MTHR, the chance of a space being
` ~i 2~2~73~
22
classif led as a bar is small .
GAr~lA influences the processing time of the
segmentation and the classif ication . Together GA2~A
and BETA influence the final results. The smaller
5 ALPEIA and BETA are, the less sensitive the algorithm
will be to variations of the bars. Experimentally,
ALPEIA = BETA = GANMA = 0.1 is a good choice with the
limit set for the prscP~inq time (< 50 msec), a
quantizing resolution of 15 mV and a sampling
10 frequency of 43 kHz.
. ~ 2Q2~7~
` ~ _
AGR VARAGR RESP CONTRAST
0 mV 80 mV 150 mV 70 mV
40 mV 100 mV 200 mV 100 mV
80 mV 120 mV 270 mV 150 mV
120 mV 140 mV 315 mV 175 mV
160 mV 160 mV 350 mV 190 mV
200 mV 180 mV 380 mV 200 mV
240 mV 190 mV 400 mV 210 mV
280 mV 200 mV 420 mV 220 mV
320 mV 210 mV 440 mV 230 mV
360 mV 225 mV 465 mV 240 mV
400 mV 250 mV 500 mV 250 mV
440 mV 275 mV 550 mV 275 mV
480 mV 300 mV 600 mV 300 mV
520 mV 325 mV 650 mV 325 mV
560 mV 350 mV 700 mV 350 mV
600 mV 375 mV 750 mV 375 mV
640 mV 400 mV 800 mV 400 mV
680 mV 425 mV 850 mV 425 mV
720 mV 450 mV 900 mV 450 mV
760 mV 475 mV 950 mV 475 mV
800 mV 500 mV 1000 mV 500 mV
840 mV 525 mV 1200 mV 675 mV
880 mV 550 mV 1400 mV 850 mV
920 mV 575 mV 1600 mV 1025 mV
960 mV 600 mV 1800 mV 1200 mV
1000 mV 625 mV 2000 mV 1375 mV
1040 mV 650 mV 2200 mV 1550 mV
1080 mV 675 mV 2400 mV 1725 mV
1120 mV 700 mV 2600 mV lg00 mV
1160 mV 725 mV 2800 mV 2075 mV
1200 mV 750 mV 3000 mV 2250 mV
1240 mV 775 mV 3050 mV 2275 mV
1280 mV 800 mV 3100 mV 2300 mV
1320 mV 825 mV 3150 mV 2325 mV
1360 mV 850 mV 3200 mV 2350 mV
1400 mV 875 mV 3250 mV 2375 mV
1440 mV 900 mV 3300 mV 2400 mV
1480 mV 925 mV 3350 mV 2425 mV
1520 mV 950 mV 3400 mV 2450 mV
1560 mV 975 mV 3450 mV 2475 mV
1600 mV 1000 mV 3500 mV 2500 mV
1640 mV 1025 mV 3550 mV 2525 mV
1680 mV 1050 mV 3600 mV 2550 mV
1720 mV 1075 mV 3650 mV 2575 mV
1760 mV 1100 mV 3700 mV 2600 mV
1800 mV 1125 mV 3750 mV 2625 mV
1840 mV 1150 mV 3800 mV 2650 mV
1880 mV 1175 mV 3850 mV 2675 mV
1920 mV 1200 mV 3900 mV 2700 mV
1960 mV 1225 mV 3950 mV 2725 mV
>2000 mV 1250 mV 4000 mV 2750 mV
TABLE I
_~3- .