Note: Descriptions are shown in the official language in which they were submitted.
2'~ ~ ~3
T 8331
METHOD OF PRODUCING A TAR SAND DEPOSIT
CONTAINING A CONDUCTIVE LAYER
This invention relates to the production of hydrocarbons from
a hydrocarbon-bearing deposit, and more particularly, from a
hydrocarbon-bearing deposit where the oil viscosity and saturation
are so high that insufficient steam injectivity can be obtained by
current steam injection methods.
A very large resource of viscous, heavy oil and of tar sands
exists in the world. Examples are those in Alberta, Canada; Utah
and California in the United States; the Orinoco Belt of Venezuela;
and the USSR. The total world reserve of tar sand deposits is
estimated to be 2,100 billion barrels of oil, of which about 980
billion are located in Alberta, Canada, and of which 18 billion
barrels of oil are present in shallow deposits in the United
States.
In the present art, heavy oil deposits are produced by steam
injection to swell and lower the viscosity of the oil to the point
where it can be pushed toward the production wells. If steam
injectivity is high enough, this is a very efficient means of
heating and producing the formation. However, a large number of
reservoirs contain tar of sufficiently high viscosity and
saturation that initial steam injectivity is severely limited, so
that even with a number of "huff-and-puff"pressure cycles, very
little steam can be injected into the deposit without exceeding the
formation fracturing pressure. Most of these tar sand deposits
have previously not been capable of economic production.
The most difficult problem in steamflooding deposits with low
injectivity is establishing and maintaining a flow channel between
injection and production wells. Sevexal proposals have been made
to provide horizontal wells or conduits within a tar sand deposit
to deliver hot fluids such a5 steam into the deposit; thereby
heating and reducing the viscosity of the bitumen in tar sands
~~~~.r ~%'~~
_ 2 _
adjacent to the horizontal well or conduit. U.S. Patent No. ,
3,986,557 discloses use of such a conduit with a perforated section
to allow entry of steam into, and drainage of mobilized tar out of,
the tar sand deposit. U.S. Patent Nos. 3,994,340 and 4,037,658
disclose use of such conduits or wells simply to heat an adjacent
portion of deposit, thereby allowing injection of steam into the
mobilized portions of the tar sand deposit.
In an attempt to overcome the steam injectivity problem,
several proposals have been made for various means of electrical or
electromagnetic heating of tar sands. One category of such
proposals has involved the placement of electrodes in conventional
injection and production wells between which an electric current is
passed to heat the formation and mobilize the tar. This concept is
disclosed in U.S. Patent Nos. 3,848,671 and 3,958,636. A similar
concept has been presented by Towson at the Second International
Conference on Heavy Crude and Tar Sand (UNITAR/UNDP Information
Center, Caracas, Venezuela, September, 1982). A novel variation,
employing aquifers above and below a viscous hydrocarbon-bearing
formation, is disclosed in U.S. Patent No. 4,612,988. In U.S.
Reissue Patent No. 30738, Bridges and Taflove disclose a system and
method for in-situ heat processing of hydrocarbonaceous earth
formations utilizing a plurality of elongated electrodes inserted
in the formation and bounding a particular volume of a formation.
A radio frequency electrical field is used to dielectrically heat
the deposit. The electrode array is designed to generate uniform
controlled heating throughout the bounded volume.
In U,S. Patent No. 4,545,435, Bridges and Taflove again
disclose a waveguide structure bounding a particular volume of
deposit. The waveguide is formed of rows of elongated electrodes
in a "dense array" defined such that the spacing between rows is
greater than the distance between electrodes in a row. in order to
prevent vaporization of water at the electrodes, at least two
adjacent rows of electrodes are kept at the same potential. The
block of the deposit between these equipotential rows is not heated
electrically and acts as a heat sink for the electrodes.
- 3 -
Electrical power is supplied at a relatively low frequency (60 Hz
or below) and heating is by electric conduction rather than
dielectric displacement currents. The temperature at the
electrodes is controlled below the vaporization point of water to
maintain an electrically conducting path between the electrodes and
the deposit adjacent to the electrodes. Again, the "dense array"
of electrodes is designed to generate relatively uniform heating
throughout the bounded volume of the deposit.
Hiebert et al ("Numerical Simulation Results for the
Electrical Heating of Athabasca Oil Sand Formations," Resexvoir
Engineering Journal, Society of Petroleum Engineers, January, 1986)
focus on the effect of electrode placement on the electric heating
process. They depict the oil or tar sand as a highly resistive
material interspersed with conductive water sands and shale layers.
Hiebert et al propose to use the adjacent cap and base rocks
(relatively thick, conductive water sands and shales) as an
extended electrode sandwich to uniformly heat the oil sand deposit
from above and below.
As can be seen from these examples, previous proposals have
concentrated on achieving substantially uniform heating in a block
of a deposit so as to avoid overheating selected intervals. The
common conception is that it is wasteful and uneconomic to generate
nonuniform electric heating in the deposit. The electrode array
utilized by prior inventors therefore bounds a particular volume of
earth formation in order to achieve this uniform heating. However,
the process of uniformly heating a block of tar sands by electrical
means is extremely uneconomic. Since conversion of fossil fuel
energy to electrical power is only about 38 percent efficient, a
significant energy loss occurs in heating an entire tar sand
deposit with electrical energy.
It is an object of this invention to provide an efficient and
economic method of in-situ heat processing of tar sand and other
heavy oil deposits wherein electrical current is used to heat thin,
highly conductive layers within such deposits, utilizing a minimum
of electrical energy to prepare the tar sands for steam injection;
~~~r~~~~9a
- 4 -
and then to efficiently utilize steam injection to mobilize and
recover a substantial portion of the heavy oil and tar contained in
the deposit.
To this end the method of recovering hydrocarbons from a
hydrocarbon-bearing deposit according to the invention comprises:
- selecting a hydrocarbon-bearing deposit which contains a thin
conductive layer within the deposit;
- installing electrodes spanning the thin conductive layer;
- electrically heating the thin conductive layer to form a thin
preheated zone immediately adjacent to the thin conductive
layer;
- providing wells fox hot fluid injection into the deposit and
hydrocarbon production from the deposit;
- injecting a hot fluid into the deposit adjacent to the thin
conductive layer and within the thin preheated zone to
displace the hydrocarbons to the production wells; and
- recovering hydrocarbons from the production wells.
The method of the invention is particularly applicable to
deposits of heavy oil, such as tar sands, which contain thin
conductive layers. These thin conductive layers will typically be
shale layers interspersed within the tar sand deposit, but may also
be water sands (with or without salinity differentials), or layers
which also contain hydrocarbons but have significantly greater
porosity, For geological reasons; shale layers are almost always
found within a tar sand deposit because the tax sands were
deposited as alluvial fill within the shale. The shales have
conductivities of from about 0.2 to about 0.5 1/ahm/m; while the
tar sands have conductivities of about 0.02 to 0.05 1/ohm/m.
Consequently, conductivity xatios between the shales and the tar
sands range from about 10:1 to about 100:1, and a typical
conductivity ratio is about 20:1. The conductive layers chosen for
electrical heating are preferably near the bottom of the deposit,
so that the steam injected can rise through the deposit and heated
oil can drain downwards into the steam channel: The thin
conductive layers to be heated are additionally selected to provide
c c ,~ r. ~
~~~ ~ ~.t~,~
-s-
lateral continuity of conductivity within the shale layer, and to
provide a substantially higher conductivity, for a given thickness,
than the surrounding tar sands. Thin conductive layers selected on
this basis will substantially confine the heat generation within
and around the conductive layers and allow much greater spacing
between rows of electrodes.
Low-frequency electrical power (preferably at 60 Hz or below)
is used to heat the thin conductive layers in a heavy oil or tar
sand deposit. Electrodes axe installed in wells spaced in parallel
rows, and electrodes within a row may be energized from a common
voltage source. The electrodes within a row form a plane of
electrodes in the deposit. The spacing between electrodes in the
row, spacing between the rows, and diameter of the electrode are
selected to prevent overheating (vaporization of water) at the
electrodes.
The active length of the electrode electrically spanning the
thin conductive layer varies from about equal to the thickness of
the thin conductive layer to be heated, to as much as about three
times the thickness of the conductive layer. Thus the electrodes
do not make electrical contact with the formation over the major
thickness of the tar sand deposit, which improves the vertical
confinement of the electrical current flow.
As the thin conductive layers axe electrically heated, the
conductivity of the layers will increase. This concentrates
heating in those layers. In fact, for shallow deposits the
conductivity may increase by as much as a factor of three when the
temperature of the deposit increases from 20°C to 100°C. For
deeper deposits, where the water vaporization temperature is higher
due to increased fluid pressure, the increase in conductivity can
be even greater. As a result, the thin conductive layers heat
rapidly, with relatively little electric heating of the majority of
the tar sand deposit. The tar sands adjacent to the thin
conductive layers are then heated by thermal conduction from the
electrically heated shale layers in a period of a few years,
forming a thin preheated zone immediately adjacent to each thin
b ~ ~i t~
- 6 -
conductive layer. As a result of preheating, the viscosity of the
tar in the preheated zone is reduced, and therefore the preheated
zone has increased injectivity. The total preheating phase is
completed in a relatively short period of time, preferably no more
than about two years, and is then followed by injection of steam
and/or other fluids.
A pattern of steam injection and production wells is installed
in the tar sand deposit. The production wells are preferably
located within the electrode planes, where oil mobility after the
preheating phase will be highest. Additionally, within the
electrode planes, the production wells are drilled as close as
possible to the electrode wells to minimize potential differences
which could lead to ground currents. Preferably, some of the
electrode wells themselves are used as the production wells, once
the electrical stimulation is terminated. The steam injection
wells are located midway between the electrode rows because this is
the coldest location in the patterns after electrical stimulation.
The subsequent steam injection phase begins with continuous
steam injection within the thin preheated zone and adjacent to the
conductive shale layer where the tar viscosity is lowest. Steam is
initially injected adjacent to a shale layer and within the
preheated zone. The heated oil progressively drains downwards
within the deposit, allowing the steam to rise within the deposit.
The steam flowing into the tar sand deposit effectively displaces
oil toward the production wells. The steam injection and recovery
phase of the process may take a number of years to complete.
The invention will now be described by way of example in more
detail with reference to the drawings wherein:
Figure 1 is a plan view of a well pattern for electrode wells
for heating a tar sand deposit, and steam injection and production
wells for recovering hydrocarbons from the deposit;
Figure 2 is a cross-sectional view through the deposit in a
plane coincident with an electrode row;
Figure 3 is a cross-sectional view of an electrode well;
Figure 4 shows a direct line drive electrode array;
_ 7 _
Figure S shows a sawtooth line drive electrode array;
Figure 6 shows a pair offset line drive electrode array;
Figure 7 shows a numerical simulation of the temperature
distribution after electrically preheating a thick tar sand deposit
with no shale layer;
Figure 8 shows a numerical simulation of the temperature
distribution after electrically preheating a shale layer located
within a thick tar sand deposit; and
Figure 9 shows a numerical simulation of steam injection and
oil recovery rates following the electric preheating simulation
shown in Figure 8,
Referring now to Figure 1 showing a well pattern for producing
heavy oil and tar sand deposits utilizing an array of vertical
electrodes 10, steam injection wells 11, and production wells 12.
For the sake of clarity not all vertical electrodes have been
referred with a reference numeral.
The electrodes 10 are located in parallel rows 13, 13', 14 and
14', with a spacing s between electrodes in a row. Rows are
designated either as ground rows 13 and 13' or excited rows 14 and
14', depending on whether they are at ground potential or high
voltage, respectively. The ground rows 13 and 13' and the excited
rows 14 and 14' repeat throughout the field in the pattern shown.
This type of electrode pattern allows economic heat injection rates
while preventing vaporization of water at the electrodes. A ground
row 13 adjacent to an excited row 14 is separated by a distance dl.
A ground row 13 adjacent to a ground raw 13', and an excited row 14
adjacent to an excited row 14', are separated by a distance d2. In
the alternative, the pattern could consist of pairs of rows of
positively excited and negatively excited electrodes (out of phase)
rather than pairs of rows of ground and energized electrodes. The
electrodes in adjacent rows are not necessarily on line with each
other, as described below.
In a typical embodiment, each electrode 10 may have a radius r
of one .foot, the spacing between electrodes 10 in a row s may be 14
m (metre), and the inter-row distance between a ground row 13 and
-8_
an excited row 14, dl, may be 100 m, and the distance between rows
at the same potential, d2, may be 35 to 200 m. There are
sufficient electrodes 10 within each row that the row length L
between production wells is many times the inter-row distance dl or
d2. For example, there may be 100 electrodes along the row, such
that the row length is 1400 m, which is much greater than the
inter-row spacing of 35-100 m.
Also shown in Figure 1 is the pattern of the steam injection
wells 11 and production wells 12. Production wells may be drilled
in the electrode row planes prior to energizing the electrodes to
prevent contact with stray electrical currents. In the excited row
planes, the production well casing should be electrically insulated
from the surrounding formation. As an alternative, the production
wells may be drilled after the electric preheating phase, in which
case electrical insulation would not be required. The steam
injection wells are located midway between the rows of electrodes,
because this will be the coldest location in the pattern and will
therefore benefit most from the steam injection, arid also midway
between the production wells in an inverted five spot pattern 15.
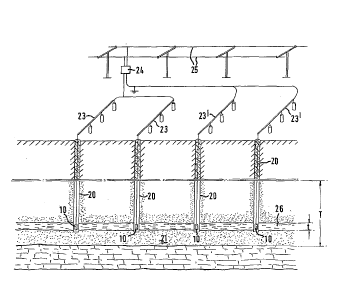
Referring now to Figure 2, the electrodes 10 are placed in
bore holes 20 drilled from the surface into a tar sand deposit 21.
The electrodes 10 are energized from a low-frequency source at
about 60 Hz or below by means of a common electrical bus lines 23
and 23' which are connected to a transformer 24 or a power
conditioner (not shown) or directly to a power line 25. Surface
facilities (not shown) are also provided for monitoring current,
voltage, and power to each electrode well. The electrodes 10 are
placed within the deposit such that they span a thin, conductive
zone 26, and have an active area in contact with the deposit
substantially only over the thickness t of the thin conductive zone
26 to be heated. The thin zone can be, for example, a shale zone
of t = 3 m in a total tar sand deposit thickness T of, for example,
T ~ 45 m. The active length of an electrode 10 in this example
would be from about the same length as the thickness t of the thin
layer 26 to two or three times that length. The tar sand deposit
may contain several thin conductive layers, interspersed between
- 9 -
the tar sand layers. It may be preferable for electrodes to contact
as many highly conductive thin layers as are necessary to heat tar
sand layers into which steam will subsequently be injected. Thus,
any electrode may contain more than one active length.
Referring now to Figure 3, the electrode 10 is constructed
from a material which is a good conductor, such as aluminum or
copper, and may be clad with stainless steel 32 for strength and
corrosion resistance where contact is made with the formation. A
conducting cable 33 connects the electrode 31 with the power source
3t~ at the surface. The cable 33 may or may not be insulated, but
should be constructed of a non-ferromagnetic conductor such as
copper or aluminum to reduce magnetic hysteresis losses in the
cable. The electrode 31 well may require surface casing 35 which
is cemented to below the conductive layer 26. A non-conducting
cement 36 seals a majority of the length of the drill hole 20. The
drill hole 20is enlarged at the bottom section. adjacent to the thin
layer 26 by underreaming the hole. In this underreamed section,
the electrode makes electrical contact with the tar sand deposit 26
through an electrically conductive material 37, for example,
electrically conductive Portland cement with high salt content or
graphite filler, aluminum-filled electrically conductive epoxy, or
saturated brine electrolyte, which serves to physically enlarge the
effective diameter of the electrode and reduce overheating. As
another alternative, the conductive cement between the electrode
and the formation may be filled with metal filler to further
improve conductivity. In still another alternative, the electrode
may include metal fins, coiled wire, or coiled foil which may be
extended when the electrode is placed in the underreamed portion of
the drill hole. The effective conductivity of the electrically
conductive section should be substantially greater than that of the
adjacent deposit layers to reduce local heating at the electrode.
The electrode well pattern will be determined by an economic
optimum which depends, in turn, on the cost of the electrode wells
and the conductivity ratio between the thin conductive layer and
the bulk of the tar sand deposit. Electrode configurations other
2~~"~~~'
- 10 -
than the line array can be employed. Figures 4-6 show some
possible arrays in which alternate electrodes or pairs of
electrodes are offset in a regular pattern. Figure 4 shows the
direct line drive, Figure 5 the sawtooth line drive, and Figure 6
the pair offset line drive electrode arrays. In this last array,
there are two interelectrode distances within a row sl and s2. The
patterns show both positively excited electrodes (+) and negatively
excited electrodes (-).
The thin conductive layers are preferably near the bottom of a
thick segment of tar sand deposit, so that steam can rise up
through the deposit and heated oil can drain down into the flowing
steam channel. The thin conductive layers to be heated are
additionally selected, on the basis of resistivity well logs, to
provide lateral continuity of conductivity. The layers are also
selected to provide a substantially higher conductivity-thickness
product than surrounding zones in the deposit, where the con-
ductivity-thickness product is defined as the product of the
electrical conductivity for a thin layer (Ctl) and the thickness of
that layer (t), or the electrical conductivity of a tar sand
deposit (Cts) and the thickness of that deposit (T-t). The
conductivity-thickness product fox a thin layer (Ctlt) is compared
with the conductivity-thickness product for adjacent tar sand
layers of thickness T-t (Cts(T-t)). By selectively heating a thin
layer with a higher conductivity-thickness product (Ctlt) than that
of the tar sand layer (Cts(T-t)), the heat generated within the
thin layer is more effectively confined to that thin layer. This
is possible because in a tar sand deposit the shale is more
conductive than the tar sand, and may be, for example, 20 times
more conductive,
The amount of electrical power generated in a volume of
material, such as a subterranean, hydrocarbon-bearing deposit, is
given by the expression:
P = CE2
where P is the power generated (in W), C is the conductivity.(the
inverse of the electrical resistance, in 1/ohm), and E is the
~~~~~~~t8
- 11 -
electric potential difference (voltage, in V). For constant
potential boundary conditions, such as those maintained at the
electrodes, the electric field distribution is set by the geometry
of the electrode array. The heating is then determined by the
conductivity distribution of the deposit. The more conductive
layers in the deposit will heat more rapidly. Moreover, as the
temperature of a layer rises, the conductivity of that layer
increases, so that the conductive layers will absorb heat still
more rapidly than the surrounding layers. This continues until
vaporization of water occurs in the conductive layer, at which time
its conductivity will decrease as steam evolves from the conductive
layer. Consequently, it is preferred to keep the temperature
within the conductive layer below the point at which steam will
evolve.
During the electrical preheating step, surface measurements
are made of the current flow into each electrode. All the
electrodes in a row are energized from a common voltage source, so
that as the thin conductive layers heat and become more conductive,
the current will steadily increase. Measurements of the current
entering the electrodes can be used to monitor the progress of the
preheating process. The electrode current will increase steadily
until vaporization of water occurs either at the electrode or
deeper within the deposit, at which time a drop in current will be
observed. Additionally, temperature monitoring wells and/or
numerical simulations may be used to determine the optimum time to
commence steam injection. The preheating phase should be completed
within a time period of a few years. In this time, thermal
conduction will establish relatively uniform heating in a thin,
preheated zone adjacent to the thin conductive layers.
Once the preheating phase is completed, the tar sand deposit
is steam flooded to recover hydrocarbons present. Fluids other
than steam, such as hot air or other gases, or hot water, may also
be used to mobilize the hydrocarbons, and/or to drive the hydro-
carbons to production wells.
Example
Numerical simulations were used to evaluate the feasibility of
~~~~~'~.~~~
- 12 -
electrically preheating a thin, conductive layer within a tar sand
deposit, and subsequently injecting steam. The numerical
simulations required an input function of electrical conductivity
versus temperature. The change in electrical conductivity of a
typical Athabasca tar sand with temperature may be described by the
equation:
C m constant * (T + 22)
where C is the electrical conductivity in 1/ohm and T is the
temperature in °C. Thus there is an increase in conductivity by
about a factor of three as the temperature rises from 20°C (T +
22 = 42) to 100°C (T + 22 ~ 122). These simulations also required
an input function of viscosity versus temperature. The change in
viscosity versus temperature for a typical Athabasca tar sand
bitumen may be described by the equation:
~. = exp ((3.218 x 10¹¹) (T-4.2)y _ 0.5
where T is in degrees Kelvin and viscosity (~a) is in centipoise
(cp), For example, the viscosity at 20°C is about 1.6 million cp,
whereas the viscosity at 100°C is reduced to about 161 cp. In a
sand with a permeability of 3 darcy, steam at typical field
conditions can be injected continuously once the viscosity of the
tar is reduced to about 10,000 cp, which occurs at a temperature of
about 50°C. Injection at a somewhat higher viscosity, for example
at about 15,000 cp, may be possible if the higher viscosity is
localized. Also, where initial injectivity is limited, a few
"huff-and-puff" steam injection cycles may be sufficient to
overcome localized high viscosity.
The parameters set for the electric preheating numerical simu-
lation are shown in Table 1. Two cases are identified, Case 1, a
tar sand deposit with no shale layer, and Case 2, a tar sand
deposit including a shale layer. Most parameters were held
constant between the two cases. The total amount of heat delivered
to the formation was set at 5.31012) per electrode pair, delivered
over a two-year period. Because of the gxeater conductivity
~~?~~~~ ~v
- 13 -
of the shale layer, relative to the tar sand deposit, a lower
voltage was required to inject the same amount of heat for the
electrodes in Case 2.
~r
- 14 -
Table 1
ELECTRIC PREHEATING NUMERICAL SIMULATION
Case Case 2
1
No ShaleOne Shale
P a r a m a t a r Layer Layer
-
Deposit thickness, ft
tar sand deposit (T) 100 . 100
shale layer (t) N/A 10
overburden (shale) 210 210
underburden (limestone) 210 210
3 827*103 827*103
/K
Volumetric heat capacity,
J/m
Thermal conductivity, W/K/m 0.83 0.83
Electric conductivity, 1/ohm/m
tar sand deposit 0.01 0.01
shale layer N/A 0.2
overburden (shale) 0.2 0.2
underburden (limestone) 0.01 0.01
Interrow distance, m
same polarity (d2) 45 45
opposite polarity (dl) 100 100
Interelectrode distance (s) 14 14
m
Active electrode length, m 10 10
Electrode radius, m 0.3 0.3
i 6*101 2 6*1012
r
Total heat delivered, J/electrode
pa
Electrode voltage, V 820 530
Heating time, years 2 2
- 15 -
Figures 7 and 8 show the results of numerical simulations of
the temperature distribution in a typical Athabasca tar sand
deposit with the above conductivity functions. Figure 7 shows the
projected temperature distribution that resulted from simulated
electrical preheating of a thick tar sand deposit with uniform
conductivity and no shale layer. Figure 8 snows the projected
temperature distribution that resulted from simulated electrical
preheating of a thick tar sand deposit with one 10-foot thick shale
layer located 15 feet from the bottom of the deposit. The shale
layer had an electrical conductivity 20 times that of the deposit,
and the electrodes contacted the deposit from 10 feet above to 10
feet below the shale layer. The electrodes in both cases had an
active length of 30 feet and were spaced 330 feet apart (dl).
As shown in Figure 8, the two-year period of preheating
resulted in a contiguous preheated zone, between the electrodes, at
a temperature and viscosity sufficient to allow steam injection at
a point midway between the electrodes. Since the temperature of
the contiguous preheated zone between the electrodes is shown as 25
to over 55°C, and steam injection may be possible at temperatures
as low as about 50°C, a heating period of less than two years could
have been sufficient for this example. For tar sands containing
bitumen less viscous than the Athabasca example, even less
intensive heating would be required to achieve a viscosity
reduction sufficient to allow steam injection. However, as shown
in Figure 7, after injecting the same quantity of heat over the
same two-year time period, no such contiguous zone is established
in the tar sand deposit without a shale layer. The higher
temperature, lower viscosity zones are localized around the
electrodes, and it would not be possible to inject steam at a point
midway between the electrodes. To achieve steam injectivity at
that midway point without vaporizing water adjacent to the
electrodes, it would be necessary to either heat the deposit over a
longer time period or decrease the distance between the electrode
rows (dl and d2). Either of these steps would increase the overall
cost of such a recovery process. It should be noted that once some
~~~'~~.~i:;
- 16 -
portion of the deposit reaches the temperature at which any water
within the deposit will vaporize, the conductivity of the deposit
will significantly decrease.
Comparison of Figures 7 and 8 demonstrates that preheating a
tar sand deposit containing a conductive shale layer establishes a
thin preheated zone adjacent to the conductive layer, and allows
steam injection after a shorter period of heating, and/or much
greater distances between rows of electrodes, and therefore
improved economics.
Figure 9 shows the projected steam injection (Q in
barrels/day) and oil production (in ~ of the oil in place) that
would result after T years electrically preheating a thin
conductive layer within the same Athabasca tar sand deposit with
the above conductivity and viscosity functions. After the initial
preheating phase of about two years, steam injection may be
initiated, and steadily increased to a rate of about 1,400 barrels
per day. After about seven years, live steam reaches the
production well, and steam injection is reduced. At the completion
of the recovery project, almost 80 percent of the hydrocarbon
originally in place is recovered.
The oil recovery and steam injection rates for a five-acre
pattern using the proposed process are more akin to conventional
heavy oil developments than to tar sands with no steam injectivity.
The total electrical energy utilized was less than 10 percent of
the equivalent energy in steam utilized in producing the deposit,
thus, the ratio of electrical energy to steam energy was very
favorable. Also, the economics of the process are significantly
improved relative to the prior art proposals of uniform electrical
heating of an entire tar sand deposit.
Significant energy savings can be realized when the electrodes
span a thin conductive layer such as a shale layer within a tar
sand deposit. Preheating a thin conductive layer substantially
confines the electrical current in the vertical direction,
minimizes the amount of expensive electrical energy dissipated
outside the tar sand deposit, and provides a thin preheated zone of
- 17 -
reduced viscosity within the tar sand deposit that allows
subsequent steam injection. Additionally, since much greater
distances between rows of electrodes axe possible, the capital cost
of the recovery process is reduced relative to previous proposals. ,
Having discussed the invention with reference to certain of
its preferred embodiments, it is pointed out that the embodiments
discussed are illustrative rather than limiting in nature, and that
many variations and modifications are possible within the scope of
the invention. Many such variations and modifications may be
considered obvious and desirable to those skilled in the art based
upon a review of the figures and the foregoing description of
preferred embodiments.